FNB HPI March 2017
•
0 likes•39 views

The FNB House Price Index showed an acceleration in year-on-year growth in March 2017 to 4.1% compared to 2.7% in February. In real terms, adjusting for inflation, house prices declined 3.4% year-on-year in February. Month-on-month house price inflation was positive at 1.7% in March after deflation in late 2016. While signs point to a moderate economic recovery in South Africa strengthening house prices, political risks remain from developments that could negatively impact the economy and housing market.

Recommended
More Related Content
What's hot
What's hot (20)
Similar to FNB HPI March 2017
Similar to FNB HPI March 2017 (20)
More from Berty Van Staaden
More from Berty Van Staaden (20)
Recently uploaded
Recently uploaded (20)
FNB HPI March 2017
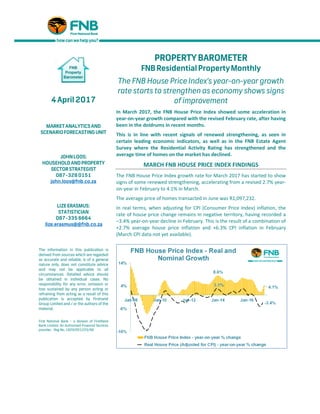
- 1. 4April2017 MARKETANALYTICS AND SCENARIOFORECASTING UNIT JOHNLOOS: HOUSEHOLDAND PROPERTY SECTORSTRATEGIST 087-328 0151 john.loos@fnb.co.za LIZE ERASMUS: STATISTICIAN 087-335 6664 lize.erasmus@@fnb.co.za The information in this publication is derived from sources which are regarded as accurate and reliable, is of a general nature only, does not constitute advice and may not be applicable to all circumstances. Detailed advice should be obtained in individual cases. No responsibility for any error, omission or loss sustained by any person acting or refraining from acting as a result of this publication is accepted by Firstrand Group Limited and / or the authors of the material. First National Bank – a division of FirstRand Bank Limited. An Authorised Financial Services provider. Reg No. 1929/001225/06 PROPERTYBAROMETER FNB Residential PropertyMonthly The FNB House Price Index’s year-on-year growth rate starts to strengthen as economy shows signs of improvement In March 2017, the FNB House Price Index showed some acceleration in year-on-year growth compared with the revised February rate, after having been in the doldrums in recent months. This is in line with recent signals of renewed strengthening, as seen in certain leading economic indicators, as well as in the FNB Estate Agent Survey where the Residential Activity Rating has strengthened and the average time of homes on the market has declined. MARCH FNB HOUSE PRICE INDEX FINDINGS The FNB House Price Index growth rate for March 2017 has started to show signs of some renewed strengthening, accelerating from a revised 2.7% year- on-year in February to 4.1% in March. The average price of homes transacted in June was R1,097,232. In real terms, when adjusting for CPI (Consumer Price Index) inflation, the rate of house price change remains in negative territory, having recorded a –3.4% year-on-year decline in February. This is the result of a combination of +2.7% average house price inflation and +6.3% CPI inflation in February (March CPI data not yet available).
- 2. The magnitude of this house price deflation in real terms has begun to represent a noticeable house price “correction” of late. Since December 2015, the average real house price has declined by a revised -4.6%. Examining the longer term real house price trends (house prices adjusted for CPI inflation), we see that there has only been a minor gain of +1.3% since the revised post-2008/9 recession low reached in November 2012. The average real house price level is now -22.2% below the all-time high reached in December 2007 at the back end of the residential boom period. Looking back further, however, the average real price currently remains 61.5% above the end-2000 level, around 16 years ago, and a time back just before boom-time price inflation started to accelerate rapidly. We therefore still regard current real price levels as high. In nominal terms, when not adjusting for CPI inflation, the average house price in March 2017 was 312.4% above the End-2000 level. MONTH-ON-MONTH HOUSE PRICE GROWTH STRENGTHENS Examining house price growth on a month-on- month basis shows a move back into positive territory in recent months. On a seasonally-adjusted basis, month-on- month house price inflation measured 1.7% in March, after a revised positive rate of 1.2% in February. This comes after a prior deflation period late in 2016. These month-on-month house price fluctuations appear to reflect short term economic performance fluctuations. The Manufacturing Sector is one sector that normally reflects the direction of the overall economy quite well, and we thus see the high frequency peaks and troughs in month-on-month house price rates of change broadly correlating with the Barclays Manufacturing Purchasing Managers Index (PMI). The PMI shifted back up to a level above the crucial 50 mark (scale 0 to 100) in January/February 2017, after also having spent the previous 5 months below the 50 level (50 being the dividing line between expansion and contraction in output). CONCLUSION Therefore, our FNB House Price Index has begun to point to some recovery, although still seeing negative house price growth in real terms (when adjusted for CPI inflation). This is not too surprising given signs of a moderate economic recovery in South Africa. The SARB Leading Indicator has been pointing upwards for some months, and the Barclays Manufacturing Purchasing Managers Index, a useful high frequency indicator of economic direction has also moved back into
- 3. “expansionary” territory in recent months. Global commodity prices are stronger, and domestically the drought conditions have alleviated. However, key risks to the economy and thus the housing market remain due to developments on the political front, notably last week’s removal of Minister of Finance Gordhan. This has exerted some pressure on the rand, and this of course is watched closely by the ratings agencies, sustaining the risk of ratings downgrades for South Africa. Should significant further pressure be exerted on capital flows out of South Africa, and as a result on the rand, the additional imported inflation pressures can lead to an unexpected resumption of interest rate hiking, which could curb residential demand and thus house price growth once more. That’s the risk scenario, however, with our most likely view that interest rates remain unchanged through 2017 and house price growth of near to the March level can be sustained. ADDENDUM - NOTES: Note on The FNB Average House Price Index: Although also working on the average price principle (as opposed to median or repeat sales), the FNB House Price Index differs from a simple average house price index in that it could probably be termed a “fixed weight” average house price index. One of the practical problems we have found with house price indices is that relative short term activity shifts up and down the price ladder can lead to an average or median price index rising or declining where there was not necessarily “genuine” capital growth on homes. For example, if “Full Title 3 Bedroom volumes remain unchanged from one month to the next, but Sectional Title 1 Bedroom and Less (the cheapest segment on average) transaction volumes hypothetically double, the overall national average price could conceivably decline due to this relative activity shift. This challenge of activity shifts between segments is faced by all constructors of house price indices. In an attempt to reduce this effect, we decided to fix the weightings of the FNB House Price Index’s sub-segments in the overall national index. This, at best, can only be a partial solution, as activity shifts can still take place between smaller segments within the sub-segments. However, it does improve the situation. With our 2013 re-weighting exercise, we have begun to segment not only according to room number, but also to segment according to building size within the normal segments by room number, in order to further reduce the impact of activity shifts on average price estimates. The FNB House Price Index’s main segments are now as follows: • The weightings of the sub-segments are determined by their relative transaction volumes over the past 5 years, and will now change very slowly over time by applying a 5-year moving average to each new price data point. The sub-segments are: - Sectional Title: • Less than 2 bedroom – Large • Less than 2 bedroom – Medium • Less than 2 bedroom – Small • 2 Bedroom – Large • 2 bedroom – Medium • 2 bedroom – Small • 3 Bedroom and More - Large • 3 Bedroom and More - Medium • 3 Bedroom and More - Small
- 4. - Full Title: • 2 Bedrooms and Less - Large • 2 Bedrooms and Less - Medium • 2 Bedrooms and Less - Small • 3 Bedroom - Large • 3 Bedroom - Medium • 3 Bedroom - Small • 4 Bedrooms and More - Large • 4 Bedrooms and More - Medium • 4 Bedrooms and More – Small The size cut-offs for “small”, medium” and “large” differ per room number sub-segment. “Large” would refer to the largest one-third of homes within a particular room number segment over the past 5 year period, “Medium” to the middle one-third, and “Small” to the smallest one-third of homes within that segment. • The Index is constructed using transaction price data from homes financed by FNB. • The minimum size cut-off for full title stands is 200 square metres, and the maximum size is 4000 square metres • The maximum price cut-off is R10m, and the lower price cut-off is R20,000 (largely to eliminate major outliers and glaring inputting errors). • The index is very lightly smoothed using a Hodrick-Prescott smoothing function with a Lambda of 5. ADDENDUM - NOTES: Note on the FNB Valuers’ Market Strength Index: *When an FNB valuer values a property, he/she is required to provide a rating of demand as well as supply for property in the specific area. The demand and supply rating categories are a simple “good (100)”, “average (50)”, and “weak (0)”. From all of these ratings we compile an aggregate demand and an aggregate supply rating, which are expressed on a scale of 0 to 100. After aggregating the individual demand and supply ratings, we subtract the aggregate supply rating from the demand rating, add 100 to the difference, and divide by 2, so that the FNB Valuers’ Residential Market Strength Index is also depicted on a scale of 0 to 100 with 50 being the point where supply and demand are equal.