Rental Market Buoyancy Varies by Sector
•
0 likes•29 views

- The survey found that brokers perceive the industrial/warehouse rental market as most active, while the office and retail markets are struggling. Retail brokers cited high rentals and online shopping as particular issues. - The industrial/warehouse market showed increased activity and declining vacancy rates over the past 6 months, while office and retail saw weaker activity and rising vacancy. - Near-term expectations improved significantly for the industrial sector after the elections but were more muted for retail, which faces challenges of high rentals and the shift to online shopping.

Recommended
More Related Content
What's hot
What's hot (20)
Similar to Rental Market Buoyancy Varies by Sector
Similar to Rental Market Buoyancy Varies by Sector (20)
More from Berty Van Staaden
More from Berty Van Staaden (20)
Recently uploaded
Recently uploaded (20)
Rental Market Buoyancy Varies by Sector
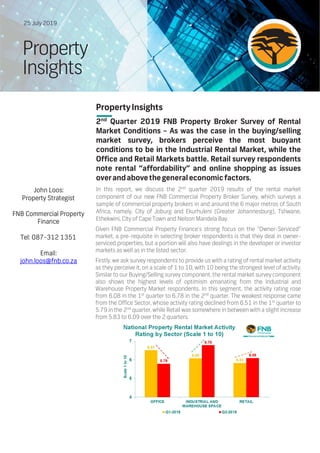
- 1. PropertyInsights 2nd Quarter 2019 FNB Property Broker Survey of Rental Market Conditions – As was the case in the buying/selling market survey, brokers perceive the most buoyant conditions to be in the Industrial Rental Market, while the Office and Retail Markets battle. Retail survey respondents note rental “affordability” and online shopping as issues overandabovethegeneraleconomicfactors. In this report, we discuss the 2nd quarter 2019 results of the rental market component of our new FNB Commercial Property Broker Survey, which surveys a sample of commercial property brokers in and around the 6 major metros of South Africa, namely, City of Joburg and Ekurhuleni (Greater Johannesburg), Tshwane, Ethekwini, City of Cape Town and Nelson Mandela Bay. Given FNB Commercial Property Finance’s strong focus on the ‘‘Owner-Serviced’’ market, a pre-requisite in selecting broker respondents is that they deal in owner- serviced properties, but a portion will also have dealings in the developer or investor markets as well as in the listed sector. Firstly, we ask survey respondents to provide us with a rating of rental market activity as they perceive it, on a scale of 1 to 10, with 10 being the strongest level of activity. Similar to our Buying/Selling survey component, the rental market survey component also shows the highest levels of optimism emanating from the Industrial and Warehouse Property Market respondents. In this segment, the activity rating rose from 6.08 in the 1st quarter to 6.78 in the 2nd quarter. The weakest response came from the Office Sector, whose activity rating declined from 6.51 in the 1st quarter to 5.79 in the 2nd quarter, while Retail was somewhere in between with a slight increase from 5.83 to 6.09 over the 2 quarters. 25 July 2019 Property Insights John Loos: Property Strategist FNB Commercial Property Finance Tel: 087-312 1351 Email: john.loos@fnb.co.za John Loos: Property Strategist FNB Commercial Property Finance Tel: 087-312 1351 Email: john.loos@fnb.co.za
- 2. 2 Activitytrendover thepast 6months We ask a follow up question to the activity rating, asking respondents whether they believe that rental market activity has strengthened, weakened or remained the same since 6 months prior (i.e. since the final quarter of 2018). Out of the responses we create an index by allocating a +1 score to an ‘‘increased’’ response, a zero to an ‘‘unchanged’’ response and a negative -1 to a ‘‘declined’’ response. The scale of the ‘‘Index for direction of change in rental market activity over the past 6 months’’ is thus from +100 to -100. A score of +100 would imply that 100% of respondents perceived an increase in time on the market over the past 6 months and -100 would imply 100% of respondents perceiving a weakening, while a zero level would mean that those providing an ‘‘increased’’ response equals those responding with ‘‘decline’’. Of the 3 property classes, the Industrial Property survey returned a strong positive reading of 36, implying that 36 percentage points’ more respondents perceived an increase in rental market activity than those who perceived a decline. By comparison, the responses in the Retail and Office Markets were significantly weaker, Retail with a +6 reading and Office Property a zero. VacancyTrends Using the same methodology as above, we compile an index on a scale of +100 to -100 for the responses as to whether vacancy rates have risen, remained the same or declined over the past 6 months. Once again the relative optimism in the Industrial and Warehouse Property Sector comes out, with this sector’s Index for Direction of Change in Vacancy Rates over the past 6 months declining in the 2nd quarter showing a -7, implying that 7 percentage points’ more respondents perceived vacancy rates to have declined than those perceiving an increase. This is a recent phenomenon, with the 1st quarter survey reading still having been strongly biased towards increasing vacancy rates, having recorded a +22.2 reading. By comparison, for the 2nd quarter of 2019 the Office Market’s index showed a +30 reading and that of Retail Property a +38, suggesting a strong bias of survey respondents towards rising vacancy rates in the latter 2 sectors. Near term Expectations – Post Election “Bounce” Near term optimism amongst survey respondents has improved significantly in the Industrial and Warehouse Property Market, when we ask them to provide their 6-months ahead expectations for rental market activity (i.e. increase, decrease or remain the same). The Rental Market Activity Near Term Expectations Index for the Industrial and Warehouse Market shot up from +8.3 in the 1st quarter 2019 to +67 in the 2nd quarter (on a scale of -100 to +100). By comparison, the Retail Expectations Index was also biased in favour of ‘‘activity strengthening’’ to come, but far more moderately so with a +22 reading, while the Office Market Expectations Index was strongly biased in favour of increase, with a positive reading of +58..
- 3. 3 Key factors that drive near term activity expectations Economic and Political factors swing to the positive The key reasons for the big jump in expectations from 1st to 2nd quarter surveys appears to be all about a ‘‘favourable’’ May election result, whatever that may mean. When asking brokers for the reasons as to why they expect what they expect, we get a lengthy list of key reasons, both positive and negative, and these give us insight into what respondents perceive to be key issues in their market. In the 1st quarter, a high percentage pointed .to ‘‘economic and political uncertainty’’ as a key negative factor in driving their expectations, 48% in the Office survey, 44.4% in the Industrial survey and 34.8% in the Retail survey. A major portion of this was cited as due to upcoming elections. In the 2nd quarter, these percentages receded markedly to 16%, 17% and 28% for Office, Industrial, and Retail surveys respectively. In the 2nd quarter there was simultaneously a jump in those brokers citing ‘‘Positive Business Sentiment’’, 44% in the case of Office, 40% in the case of Industrial and 28% in the case of Retail, in all 3 cases making this factor category the highest or at least in Retail’s case joint highest. But Retail has some additional challenges But in the case of Retail Property the confidence jump in the 2nd quarter was far more muted than in the case of Office and Industrial. Viewing the key drivers of near term expectations, an additional 2 key negatives emerge in the Retail Survey. A significant 22% of respondents point to ‘‘landlords asking rentals that are too high’’. By comparison only 7% point to this in the Office Sector and 5% in Industrial, the latter being the cheapest of the property classes. Affordability has become a key issue for tenants and prospective tenants in the very expensive Retail Property market. In addition, 13% of respondents in the Retail Survey point towards ‘‘shoppers moving to online retail’’. Affordability and online shopping, therefore, while not yet exceeding general economic conditions in significance amongst the brokers surveyed, are coming out as noteworthy activity-influencing factors in a negative way. Disclaimer AdivisionofFirstRandBankLimited. An Authorised Financial Services and Credit Provider (NCRCP20). Disclaimer: The information in this publication is derived from sources which are regarded as accurate and reliable, is of a general nature only, does not constitute advice and may not be applicable to all circumstances. Detailed advice should be obtained in individual cases. No responsibility for any error, omission or loss sustained by any person acting or refraining from acting as a result of this publication isaccepted by FirstRand GroupLimitedand/ orthe authors of the materi
- 4. 3