SLIGHT WEAKENING IN HOME MAINTENANCE AND UPGRADES THROUGH 2017
•
0 likes•61 views

There was a slight weakening in home maintenance and upgrades in South Africa from the start to the end of 2017 according to survey data from estate agents and hardware retail sales. Specifically, the percentage of homeowners making value-adding upgrades decreased slightly, as did those fully maintaining their properties and making some improvements. Correspondingly, the percentages of those only doing basic maintenance or allowing their homes to fall into disrepair increased mildly. Various economic indicators pointed to a mild stagnation in the home maintenance and upgrades market in the latter half of 2017 compared to earlier in the year.

Recommended
More Related Content
What's hot
What's hot (13)
Similar to SLIGHT WEAKENING IN HOME MAINTENANCE AND UPGRADES THROUGH 2017
Similar to SLIGHT WEAKENING IN HOME MAINTENANCE AND UPGRADES THROUGH 2017 (20)
More from Berty Van Staaden
More from Berty Van Staaden (20)
Recently uploaded
Recently uploaded (20)
SLIGHT WEAKENING IN HOME MAINTENANCE AND UPGRADES THROUGH 2017
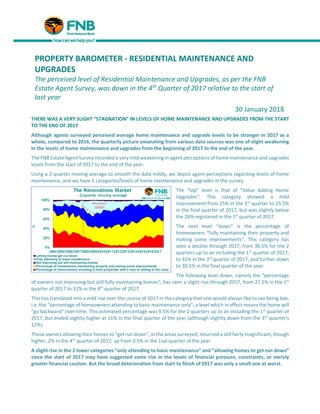
- 1. THERE WAS A VERY SLIGHT “STAGNATION” IN LEVELS OF HOME MAINTENANCE AND UPGRADES FROM THE START TO THE END OF 2017 Although agents surveyed perceived average home maintenance and upgrade levels to be stronger in 2017 as a whole, compared to 2016, the quarterly picture emanating from various data sources was one of slight weakening in the levels of home maintenance and upgrades from the beginning of 2017 to the end of the year. The FNB Estate Agent Survey recorded a very mild weakening in agent perceptions of home maintenance and upgrades levels from the start of 2017 to the end of the year. Using a 2-quarter moving average to smooth the data mildly, we depict agent perceptions regarding levels of home maintenance, and we have 5 categories/levels of home maintenance and upgrades in the survey. The “top” level is that of “Value Adding Home Upgrades”. This category showed a mild improvement from 25% in the 3rd quarter to 25.5% in the final quarter of 2017, but was slightly below the 26% registered in the 1st quarter of 2017. The next level “down” is the percentage of homeowners “fully maintaining their property and making some improvements”. This category has seen a decline through 2017, from 36.5% for the 2 quarters up to an including the 1st quarter of 2017, to 31% in the 3rd quarter of 2017, and further down to 30.5% in the final quarter of the year. The following level down, namely the “percentage of owners not improving but still fully maintaining homes”, has seen a slight rise through 2017, from 27.5% in the 1st quarter of 2017 to 31% in the 4th quarter of 2017. This has translated into a mild rise over the course of 2017 in the category that one would always like to see being low, i.e. the “percentage of homeowners attending to basic maintenance only”, a level which in effect means the home will “go backward” over time. This estimated percentage was 9.5% for the 2 quarters up to an including the 1st quarter of 2017, but ended slightly higher at 11% in the final quarter of the year (although slightly down from the 3rd quarter’s 12%). Those owners allowing their homes to “get run down”, in the areas surveyed, returned a still fairly insignificant, though higher, 2% in the 4th quarter of 2017, up from 0.5% in the 1sxt quarter of the year. A slight rise in the 2 lower categories “only attending to basic maintenance” and “allowing homes to get run down” since the start of 2017 may have suggested some rise in the levels of financial pressure, constraints, or merely greater financial caution. But the broad deterioration from start to finish of 2017 was only a small one at worst. PROPERTY BAROMETER - RESIDENTIAL MAINTENANCE AND UPGRADES The perceived level of Residential Maintenance and Upgrades, as per the FNB Estate Agent Survey, was down in the 4th Quarter of 2017 relative to the start of last year 30 January 2018
- 2. FNB HOME INVESTMENT CONFIDENCE INDICATOR EDGES SLIGHTLY LOWER The slight decline in 2 of the highest 3 categories of home investment, “Value Adding Upgrades” and “Maintaining and making some improvements”, from the start to the end of 2017 (and rise in the lowest 2 categories over the same period) has contributed to a 3-quarter decline in the FNB Home Investment Confidence Indicator, following on a prior rise late in 2016, from 1.74 in the 1st quarter of 2017 to 1.67 by the final quarter.. This indicator is represented on a scale of -1 to +3. The indicator had a steady increase over the 2013 to 2015 period, to reach a level of +1.79 in the 3rd quarter of 2015, but has receded since then. HARDWARE RETAIL ALSO POINTS TO WEAKENING IN HOME MAINTENANCE AND UPGRADES Further hint of a mild stagnation in the level of home maintenance and upgrades also emanates from a view of growth in Real Retail Sales by Hardware, Paint and Glass Products Retailers. Using a 3-month moving average for smoothing purposes, this category of real retail sales declined slightly by -0.8% year-on-year for the 3 months to November 2017. REASONS FOR MAKING HOME IMPROVEMENTS With regard to the reasons for why people undertaking home improvements are doing it, our agent survey pointed to the speculative building motive being a less significant 15% of total home improvements for the 2 quarters up to the 4th quarter of 2017, compared with 18.5% as at the 1st quarter of last year. The overwhelming majority of 69.5 still do the improvements for their own use, while 16% do it because they “can’t afford to buy elsewhere”. The latter motive had risen from 10% at the start of 2017.
- 3. HOME ADDITIONS AND ALTERATIONS DATA Finally, viewing StatsSA Building Statistics up until November 2017, we have recently witnessed a mild year-on-year decline in square meterage of residential building additions and alterations plans passed as well as those completed. Plans passed declined by -3.71% year-on-year for the 3 months to November, while completions declined by a more significant -13.5% in the same period. This appears to be further evidence of mild weakening in the “Maintenance and Upgrades” market recently. CONCLUSION Various data related to the Home Maintenance and Upgrades market showed mild weakening from the start to the end of 2017. Not only were agents returning mildly weaker home maintenance and upgrade survey responses in the 4th quarter of 2017, compared to the 1st quarter of the year, but both Hardware Retail Sales data as well as Building data all showed some mild year-on-year decline late in 2017, seemingly supportive of the estate agent perception. The situation remained significantly better than 2008/9 recession levels, but was seemingly softened through the year by weak economic conditions in 2017. Weak and uncertain economic and financial times, as 2017 had become compared to prior years, can lead to consumers cutting back on unnecessary expenditure, or postponing certain less urgent expenditure items. Home Maintenance and Upgrades often falls into the latter category of “less urgent” expenditure items than, say for instance, basic foods spending. However, the recent mild deterioration in the Home Maintenance and Upgrades market may be halted in 2018, with Leading Business Cycle Indicators having recently been pointing to possible economic strengthening in 2018, which in turn supports mildly stronger employment creation and Household Disposable Income growth. JOHN LOOS: HOUSEHOLD AND PROPERTY SECTOR STRATEGIST 087-328 0151 John.loos@fnb.co.za The information in this publication is derived from sources which are regarded as accurate and reliable, is of a general nature only, does not constitute advice and may not be applicable to all circumstances. Detailed advice should be obtained in individual cases. No responsibility for any error, omission or loss sustained by any person acting or refraining from acting as a result of this publication is accepted by Firstrand Group Limited and / or the authors of the material. First National Bank – a division of FirstRand Bank Limited. An Authorised Financial Services provider. Reg No. 1929/001225/06