FNB 2017 House Price Index Performance
•
1 like•62 views

FNB 2017 House Price Index Performance

Recommended
More Related Content
What's hot
What's hot (20)
Similar to FNB 2017 House Price Index Performance
Similar to FNB 2017 House Price Index Performance (20)
More from Berty Van Staaden
More from Berty Van Staaden (20)
Recently uploaded
Recently uploaded (20)
FNB 2017 House Price Index Performance
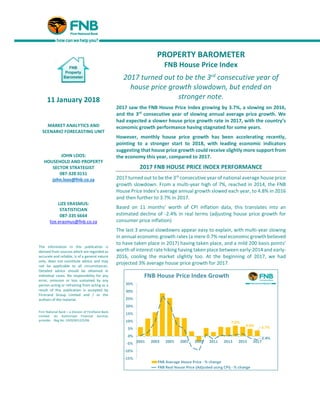
- 1. PROPERTY BAROMETER FNB House Price Index 2017 turned out to be the 3rd consecutive year of house price growth slowdown, but ended on stronger note. 2017 saw the FNB House Price Index growing by 3.7%, a slowing on 2016, and the 3rd consecutive year of slowing annual average price growth. We had expected a slower house price growth rate in 2017, with the country’s economic growth performance having stagnated for some years. However, monthly house price growth has been accelerating recently, pointing to a stronger start to 2018, with leading economic indicators suggesting that house price growth could receive slightly more support from the economy this year, compared to 2017. 2017 FNB HOUSE PRICE INDEX PERFORMANCE 2017 turned out to be the 3rd consecutive year of national average house price growth slowdown. From a multi-year high of 7%, reached in 2014, the FNB House Price Index’s average annual growth slowed each year, to 4.8% in 2016 and then further to 3.7% in 2017. Based on 11 months’ worth of CPI inflation data, this translates into an estimated decline of -2.4% in real terms (adjusting house price growth for consumer price inflation) The last 3 annual slowdowns appear easy to explain, with multi-year slowing in annual economic growth rates (a mere 0.7% real economic growth believed to have taken place in 2017) having taken place, and a mild 200 basis points’ worth of interest ratehiking having taken place between early-2014 and early- 2016, cooling the market slightly too. At the beginning of 2017, we had projected 3% average house price growth for 2017. 11 January 2018 MARKET ANALYTICS AND SCENARIO FORECASTING UNIT JOHN LOOS: HOUSEHOLD AND PROPERTY SECTOR STRATEGIST 087-328 0151 john.loos@fnb.co.za LIZE ERASMUS: STATISTICIAN 087-335 6664 lize.erasmus@fnb.co.za The information in this publication is derived from sources which are regarded as accurate and reliable, is of a general nature only, does not constitute advice and may not be applicable to all circumstances. Detailed advice should be obtained in individual cases. No responsibility for any error, omission or loss sustained by any person acting or refraining from acting as a result of this publication is accepted by Firstrand Group Limited and / or the authors of the material. First National Bank – a division of FirstRand Bank Limited. An Authorised Financial Services provider. Reg No. 1929/001225/06
- 2. DECEMBER FNB HOUSE PRICE INDEX FINDINGS However, when examining the FNB House Price Index performance on a monthly basis, we actually see that it showed gradual year-on-year growth strengthening as the year progressed, having hit “rock bottom” growth late in 2016. From a low of 1.5% year-on-year house price growth in December 2016, the rate gradually rose to reach 6.1% in December 2017, further up from a revised 5.5% rate for November 2017. In real terms, when adjusting for CPI (Consumer Price Index) inflation, house price deflation that had occurred earlier in the year gradually dissipated, and by November we saw a slightly positive year-on-year real house price growth rate of 0.8%, house price growth moderately exceeding CPI (Consumer Price Index) inflation (December CPI data is not yet available) The average price of homes transacted in December was R1,126,224. Examining house price growth on a month-on- month seasonally-adjusted basis, a better indicator of very recent price growth momentum than year-on-year rates, we saw an early-2016 high, followed by a dip around mid- year, and then very recently an acceleration in the revised month-on-month growth rates right at the end of the year, with December 2017 closing at 0.72% month-on-month growth. The prior dip in month-on-month house price growth did co-incide broadly with a dip in another key leading economic indicator, i.e. the Manufacturing Purchasing Managers’ Index, and in recent months the latter indicator has also been moving higher, both perhaps pointing to signs of a slightly stronger economy going into 2018. WHAT’S IN STORE FOR 2018? After 3 years of slowing annual average house price growth, we believe that 2018 could see a slightly stronger growth rate, but would caution against expecting too much. From an average house price growth rate of 3.7% last year, we project the 2018 average to shift a little higher to nearer to 5%. This is not a major improvement, but it stems from expectations of marginal economic growth improvement in 2018, from an estimated 0.7% last year to 1.2%, and one lone interest rate hike only late in 2018 not expected to have a significant dampening effect. The SARB Leading Business Cycle Indicator does appear supportive of mildly better economic growth in the near term, having risen in recent months. But predictions are never without risks. Much will depend on the political and government policy environment, though, with 2018 being the run-up to the 2019 general election. Uncertainty around policy direction makes forecasting even tougher than it would be under conditions of greater certainty, posing significant risks to forecasts.
- 3. Widely publicized ratings agency downgrades for the country, should they occur, can quite easily dampen national sentiment, and this can easily feed into a housing market either directly, or indirectly via the economic impact. In addition, drought conditions, notably in the Western Cape region, can impact on regional economies which feeds into those regions’ housing markets, so much will depend on weather patterns in certain parts of the country this year, especially in the Western Cape which is one of the country’s prime property markets.
- 5. ADDENDUM - NOTES: Note on The FNB Average House Price Index: Although also working on the average price principle (as opposed to median or repeat sales), the FNB House Price Index differs from a simple average house price index in that it could probably be termed a “fixed weight” average house price index. One of the practical problems we have found with house price indices is that relative short term activity shifts up and down the price ladder can lead to an average or median price index rising or declining where there was not necessarily “genuine” capital growth on homes. For example, if “Full Title 3 Bedroom volumes remain unchanged from one month to the next, but Sectional Title 1 Bedroom and Less (the cheapest segment on average) transaction volumes hypothetically double, the overall national average price could conceivably decline due to this relative activity shift. This challenge of activity shifts between segments is faced by all constructors of house price indices. In an attempt to reduce this effect, we decided to fix the weightings of the FNB House Price Index’s sub-segments in the overall national index. This, at best, can only be a partial solution, as activity shifts can still take place between smaller segments within the sub-segments. However, it does improve the situation. With our 2013 re-weighting exercise, we have begun to segment not only according to room number, but also to segment according to building size within the normal segments by room number, in order to further reduce the impact of activity shifts on average price estimates. The FNB House Price Index’s main segments are now as follows: • The weightings of the sub-segments are determined by their relative transaction volumes over the past 5 years, and will now change very slowly over time by applying a 5-year moving average to each new price data point. The sub-segments are: - Sectional Title: • Less than 2 bedroom – Large • Less than 2 bedroom – Medium • Less than 2 bedroom – Small • 2 Bedroom – Large • 2 bedroom – Medium • 2 bedroom – Small • 3 Bedroom and More - Large • 3 Bedroom and More - Medium • 3 Bedroom and More - Small - Full Title: • 2 Bedrooms and Less - Large • 2 Bedrooms and Less - Medium • 2 Bedrooms and Less - Small • 3 Bedroom - Large • 3 Bedroom - Medium • 3 Bedroom - Small • 4 Bedrooms and More - Large • 4 Bedrooms and More - Medium • 4 Bedrooms and More – Small
- 6. The size cut-offs for “small”, medium” and “large” differ per room number sub-segment. “Large” would refer to the largest one-third of homes within a particular room number segment over the past 5 year period, “Medium” to the middle one-third, and “Small” to the smallest one-third of homes within that segment. • The Index is constructed using transaction price data from homes financed by FNB. • The minimum size cut-off for full title stands is 200 square metres, and the maximum size is 4000 square metres • The maximum price cut-off is R10m, and the lower price cut-off is R20,000 (largely to eliminate major outliers and glaring inputting errors). • The index is very lightly smoothed using a Hodrick-Prescott smoothing function with a Lambda of 5.