

Recommended
Recommended
More Related Content
What's hot
What's hot (20)
Similar to FNB House Price Index_Sept 2017
Similar to FNB House Price Index_Sept 2017 (20)
More from Berty Van Staaden
More from Berty Van Staaden (20)
Recently uploaded
Recently uploaded (20)
FNB House Price Index_Sept 2017
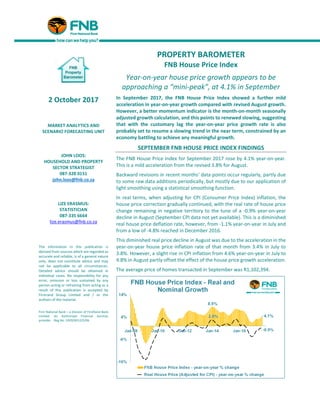
- 1. PROPERTY BAROMETER FNB House Price Index Year-on-year house price growth appears to be approaching a “mini-peak”, at 4.1% in September In September 2017, the FNB House Price Index showed a further mild acceleration in year-on-year growth compared with revised August growth. However, a better momentum indicator is the month-on-month seasonally adjusted growth calculation, and this points to renewed slowing, suggesting that with the customary lag the year-on-year price growth rate is also probably set to resume a slowing trend in the near term, constrained by an economy battling to achieve any meaningful growth. SEPTEMBER FNB HOUSE PRICE INDEX FINDINGS The FNB House Price Index for September 2017 rose by 4.1% year-on-year. This is a mild acceleration from the revised 3.8% for August. Backward revisions in recent months’ data points occur regularly, partly due to some raw data additions periodically, but mostly due to our application of light smoothing using a statistical smoothing function. In real terms, when adjusting for CPI (Consumer Price Index) inflation, the house price correction gradually continued, with the real rate of house price change remaining in negative territory to the tune of a -0.9% year-on-year decline in August (September CPI data not yet available). This is a diminished real house price deflation rate, however, from -1.1% year-on-year in July and from a low of -4.8% reached in December 2016. This diminished real price decline in August was due to the acceleration in the year-on-year house price inflation rate of that month from 3.4% in July to 3.8%. However, a slight rise in CPI inflation from 4.6% year-on-year in July to 4.8% in August partly offset the effect of the house price growth acceleration. The average price of homes transacted in September was R1,102,394. 2 October 2017 MARKET ANALYTICS AND SCENARIO FORECASTING UNIT JOHN LOOS: HOUSEHOLD AND PROPERTY SECTOR STRATEGIST 087-328 0151 john.loos@fnb.co.za LIZE ERASMUS: STATISTICIAN 087-335 6664 lize.erasmus@fnb.co.za The information in this publication is derived from sources which are regarded as accurate and reliable, is of a general nature only, does not constitute advice and may not be applicable to all circumstances. Detailed advice should be obtained in individual cases. No responsibility for any error, omission or loss sustained by any person acting or refraining from acting as a result of this publication is accepted by Firstrand Group Limited and / or the authors of the material. First National Bank – a division of FirstRand Bank Limited. An Authorised Financial Services provider. Reg No. 1929/001225/06
- 2. SLOWING MONTH-ON-MONTH PRICE GROWTH TREND RESUMES However, while the year-on-year house price growth rate still shows mild acceleration, a better way to be up to date on most recent house price growth momentum is to view it on a month-on-month seasonally-adjusted basis. Calculating house price growth on this basis we see a resumption of the slowing price growth trend, which started in April 2017, after a very brief pause for a solitary month in August. The month-on-month house price growth rate was a lowly 0.13% for September, down from the prior month’s 0.25% and now well-down on the 2017 high of 0.82% reached in March. This most recent month-on-month slowing house price growth trend once again broadly coincides with a marked dip in the Absa Manufacturing Sector Purchasing Managers Index (PMI), suggesting that it is reflective of a renewed economic “dip” after a brief economic growth improvement in the 2nd quarter of 2017 which ended the prior 2-quarter recession. Not only does the recent slowing month-on-month house price growth rate point to possible renewed weakening in the economy, but also to the likelihood that year-on-year house price growth may soon begin to slow once more. If we annualize the most recent 0.13% month-on-month rate, it says to us that, in the hypothetical scenario of house price growth remaining at this September rate, in the next 12 months we would achieve a mere 1.61% growth in total over the period. It thus appears highly likely that low single-digit average house price growth will continue in the near term, and that the house price “correction” will continue in the form of a further price decline in real terms (adjusted for CPI). 2017 REMAINS ON COURSE TO BEING A SLOWER PRICE GROWTH YEAR THAN THE PREVIOUS 3. Viewing the “bigger” annual picture, the renewed slowing in month-on-month house price growth suggests to us that, despite a brief acceleration in monthly year-on-year house price growth in 2017 to above 4% in September, for the year as a whole we are likely to see average house price growth slower than that of the past 3 years (2014 recording 7% price growth, 2015 6.2%, and 2016 4.9%), with the year-to-date year-on-year average price growth sitting at 3.1%, and a -3.1% decline in real terms.
- 3. HOUSE PRICE “CORRECTION WATCH” – LONGER RUN REAL HOUSE PRICE ADJUSTMENTS Examining the longer term real house price trends (house prices adjusted for CPI inflation), we see that the level as at August 2017 had lost -4.6% since a post-2008/9 recession high in December 2015. Looking a bit further back to the all-time real house price peak at the end of 2007 (at the end of the pre-2008 housing boom period), on a cumulative basis real house prices were -19.2% down on that high as at August 2017. However, looking back further, despite a mediocre performance in recent years, the average real price currently remains a massive 63.9% above the end-2000 level, around 16.5 years ago, and a time back just before boom-time price inflation started to accelerate rapidly. In nominal terms, when not adjusting for CPI inflation, the average house price in September 2017 was 318.0% above the end-2000 level. By comparison, consumer goods and services prices, as measured by the CPI, were only 154.7% higher over virtually the same period (up to August 2017 due to September CPI data not yet available).
- 5. ADDENDUM - NOTES: Note on The FNB Average House Price Index: Although also working on the average price principle (as opposed to median or repeat sales), the FNB House Price Index differs from a simple average house price index in that it could probably be termed a “fixed weight” average house price index. One of the practical problems we have found with house price indices is that relative short term activity shifts up and down the price ladder can lead to an average or median price index rising or declining where there was not necessarily “genuine” capital growth on homes. For example, if “Full Title 3 Bedroom volumes remain unchanged from one month to the next, but Sectional Title 1 Bedroom and Less (the cheapest segment on average) transaction volumes hypothetically double, the overall national average price could conceivably decline due to this relative activity shift. This challenge of activity shifts between segments is faced by all constructors of house price indices. In an attempt to reduce this effect, we decided to fix the weightings of the FNB House Price Index’s sub-segments in the overall national index. This, at best, can only be a partial solution, as activity shifts can still take place between smaller segments within the sub-segments. However, it does improve the situation. With our 2013 re-weighting exercise, we have begun to segment not only according to room number, but also to segment according to building size within the normal segments by room number, in order to further reduce the impact of activity shifts on average price estimates. The FNB House Price Index’s main segments are now as follows: • The weightings of the sub-segments are determined by their relative transaction volumes over the past 5 years, and will now change very slowly over time by applying a 5-year moving average to each new price data point. The sub-segments are: - Sectional Title: • Less than 2 bedroom – Large • Less than 2 bedroom – Medium • Less than 2 bedroom – Small • 2 Bedroom – Large • 2 bedroom – Medium • 2 bedroom – Small • 3 Bedroom and More - Large • 3 Bedroom and More - Medium • 3 Bedroom and More - Small - Full Title: • 2 Bedrooms and Less - Large • 2 Bedrooms and Less - Medium • 2 Bedrooms and Less - Small • 3 Bedroom - Large • 3 Bedroom - Medium • 3 Bedroom - Small • 4 Bedrooms and More - Large • 4 Bedrooms and More - Medium • 4 Bedrooms and More – Small
- 6. The size cut-offs for “small”, medium” and “large” differ per room number sub-segment. “Large” would refer to the largest one-third of homes within a particular room number segment over the past 5 year period, “Medium” to the middle one-third, and “Small” to the smallest one-third of homes within that segment. • The Index is constructed using transaction price data from homes financed by FNB. • The minimum size cut-off for full title stands is 200 square metres, and the maximum size is 4000 square metres • The maximum price cut-off is R10m, and the lower price cut-off is R20,000 (largely to eliminate major outliers and glaring inputting errors). • The index is very lightly smoothed using a Hodrick-Prescott smoothing function with a Lambda of 5.