SlideShare a Scribd company logo
1 of 2
Download to read offline
PROPERTY BAROMETER – House Price Indices by Major
Province and Major Metro
The overall Western Cape house price growth rate continued to slow in the final quarter of
2017, although its City of Cape Town Metro still “defies gravity”. In contrast, the other 3 of
the “Big 4” provinces showed house price growth accelerations late in 2017.
19 January 2018
WESTERN CAPE HOUSE PRICE GROWTH CONTINUED TO SLOW, BUT THE CITY OF CAPE TOWN METRO REMAINS
STRONG.
Examining the FNB House Price Indices for the country’s major regions, gradually slowing price growth in what has
been the country’s top performing region in recent years, the Western Cape, continued in the 4th
quarter of 2017.
The year-on-year average house price growth for
the Western Cape measured 4.4% in the 4th
quarter, slower than the 4.8% revised rate of the
previous quarter and now significantly slower than
the 11.1% multi-year high recorded in the 1st
quarter of 2016.
This means that, not for the 1st
time in recent years,
the Western Cape House Price Index growth rate
finds itself moving in the opposite direction to the
other 3 of the “Big 4” provinces.
In the 4th
quarter of 2017, the other 3 major
provinces” provinces showed some growth
acceleration again, the Eastern Cape from a lowly
1% year-on-year in the prior quarter to 1.5%,
Gauteng from 2% to 2.4%, and KZN from 6% to 7.9%. This slowing in the Western Cape, while other major regions
have been “picking up some speed”, is not too surprising. The Western Cape has significantly out-performed the rest
of the country over the past 5 or 6 years, and in the process has seen its affordability deteriorate markedly. In addition,
we suspect that the severe drought in that region may be starting to impact on the more Agriculture-driven parts of
that province outside of the Cape Town Metro.
We believe that the slowing in Western Cape
average house price growth is largely outside the
City of Cape Town Metro, because the 4th
quarter
2017 FNB Cape Town Metro House Price Index was
still roaring along at a relatively strong 9.4% year-
on-year, which is slightly faster than the previous
quarter’s 9%.
The KZN House Price Index’s recent growth
outperformance is perhaps tougher to explain than
the slowing in the Western Cape. The prospects for
the economy had started to improve late in 2017,
with certain Leading Business Cycle Indicators
having risen, and interest rates did get lowered
slightly last July. Link this to the fact that we had
seen very slow growth in house prices in recent past years in all of the 4 major provinces bar the Western Cape,
translating into some affordability improvements in terms of average house price relative to household incomes, and
some recent house price acceleration in these 3 provinces is not too surprising.
But the recent outperformance of KZN’s house price growth over Gauteng is a little surprising (although it must be
remembered that all regions remain in single-digit price growth, so nothing is booming). We say this because our FNB
Estate Agent Surveys for the major metros point to a greater supply-demand imbalance in the all-important Ethekwini
Metro in KZN (and Ethekwini’s recent house price growth acceleration has been a contributor to KZN Province’s overall
house price growth acceleration), with the 4th
quarter estimated average time of homes on the market in that metro
being a still-lengthy 20 weeks and 6 days, compared to Greater Joburg’s shorter 17 weeks and 1 day, and Tshwane
Metro’s 13 weeks and 2 days. During 2017, Gauteng’s Major Metro regions also saw strong rates of 1st
time buying
compared to all 3 Major Coastal Metros, suggesting that they have less of an affordability challenge than down at the
coast. Therefore, despite a recent superior price growth performance in KZN, we believe that price realism and
affordability in Gauteng are better than the other major regions, and that Gauteng is all round the healthiest and most
well-balanced housing market. The “superior” price growth performance in KZN may thus not be sustainable for too
long.
The FNB House Price Index for the 5 Smaller Provinces (Mpumalanga, Limpopo, North West, Northern Cape and Free
State) showed further negative growth in the 4th
quarter of 2017, from -0.4% year-on-year in the prior quarter to
-0.9%. In recent years. Mining regions’ economies
in the smaller provinces have been under pressure
since around 2011, while more recently many of
the strong Agriculture regions’ economies have
been under pressure from drought conditions.
Their housing markets’ underperformance is thus
perhaps not altogether surprising in such
challenging economic conditions. Cumulatively,
over the past 5 years, from the 4th
quarter of 2012
to the 4th
quarter of 2017, the Western Cape’s
house price growth has far outpaced the other
major regions, rising by 50.4%, with KZN being a
distant second recording 31.9%, Eastern Cape
25.6%, Gauteng 21.9% and the 5 Smaller Provinces
17.1%
JOHN LOOS:
HOUSEHOLD AND PROPERTY SECTOR STRATEGIST
087-328 0151
John.loos@fnb.co.za
The information in this publication is derived from sources which are regarded as accurate and reliable, is of a general nature only, does not constitute advice
and may not be applicable to all circumstances. Detailed advice should be obtained in individual cases. No responsibility for any error, omission or loss
sustained by any person acting or refraining from acting as a result of this publication is accepted by Firstrand Group Limited and / or the authors of the
material.
First National Bank – a division of FirstRand Bank Limited. An Authorised Financial Services provider. Reg No. 1929/001225/06

More Related Content

What's hot

The Real Estate Report for the Las Vegas Metropolitan Area (February/March 2...
The Real Estate Report for the Las Vegas Metropolitan Area  (February/March 2...The Real Estate Report for the Las Vegas Metropolitan Area  (February/March 2...
The Real Estate Report for the Las Vegas Metropolitan Area (February/March 2...Mark Evan Israelitt (or IZZY)
 
Housing Market Forecast 2016-2017
Housing Market Forecast 2016-2017Housing Market Forecast 2016-2017
Housing Market Forecast 2016-2017Kanoee Reynolds
 
Building Products and Materials Industry Insights - Q1 2017
Building Products and Materials Industry Insights - Q1 2017Building Products and Materials Industry Insights - Q1 2017
Building Products and Materials Industry Insights - Q1 2017Duff & Phelps
 
This Month in Real Estate July 2011
This Month in Real Estate July 2011This Month in Real Estate July 2011
This Month in Real Estate July 2011pdrury
 
San Francisco Real Estate Housing Market 2016 Summary
San Francisco Real Estate Housing Market 2016 SummarySan Francisco Real Estate Housing Market 2016 Summary
San Francisco Real Estate Housing Market 2016 SummaryRonny Budiutama
 
U.S. House Prices Rose 1.9 Percent in First Quarter 2013
U.S. House Prices Rose 1.9 Percent in First Quarter 2013U.S. House Prices Rose 1.9 Percent in First Quarter 2013
U.S. House Prices Rose 1.9 Percent in First Quarter 2013Wealth Partners
 
Economic Indicators for week of July 26-30
Economic Indicators for week of July 26-30Economic Indicators for week of July 26-30
Economic Indicators for week of July 26-30NAR Research
 
CANADIAN HOME SALES ACTIVITY IMPROVES IN JUNE - 16 JULY 2018
CANADIAN HOME SALES ACTIVITY IMPROVES IN JUNE - 16 JULY 2018CANADIAN HOME SALES ACTIVITY IMPROVES IN JUNE - 16 JULY 2018
CANADIAN HOME SALES ACTIVITY IMPROVES IN JUNE - 16 JULY 2018Shawn Venasse
 
San francisco market focus 2018 overview
San francisco market focus 2018 overviewSan francisco market focus 2018 overview
San francisco market focus 2018 overviewRonny Budiutama
 
Princeton Real Estate Market Presentation March 2017
Princeton Real Estate Market Presentation March 2017Princeton Real Estate Market Presentation March 2017
Princeton Real Estate Market Presentation March 2017Weichert Realtors
 
Canadian M&A Insights - Summer 2017
Canadian M&A Insights - Summer 2017Canadian M&A Insights - Summer 2017
Canadian M&A Insights - Summer 2017Duff & Phelps
 
ABSA_House Price Indices (latest)
ABSA_House Price Indices (latest)ABSA_House Price Indices (latest)
ABSA_House Price Indices (latest)Berty Van Staaden
 
Economic indicators for week of June 21-25
Economic indicators for week of June 21-25Economic indicators for week of June 21-25
Economic indicators for week of June 21-25NAR Research
 
Monthly Market Report - March 2018 from Physicians Agent™ Network
Monthly Market Report - March 2018 from Physicians Agent™ NetworkMonthly Market Report - March 2018 from Physicians Agent™ Network
Monthly Market Report - March 2018 from Physicians Agent™ NetworkChaDeiparine
 
January 2011 Princeton Area Market Update
January 2011 Princeton Area Market UpdateJanuary 2011 Princeton Area Market Update
January 2011 Princeton Area Market UpdateWeichert Realtors
 
San Francisco Market Focus March 2017
San Francisco Market Focus March 2017San Francisco Market Focus March 2017
San Francisco Market Focus March 2017Ronny Budiutama
 

What's hot (19)

The Real Estate Report for the Las Vegas Metropolitan Area (February/March 2...
The Real Estate Report for the Las Vegas Metropolitan Area  (February/March 2...The Real Estate Report for the Las Vegas Metropolitan Area  (February/March 2...
The Real Estate Report for the Las Vegas Metropolitan Area (February/March 2...
 
Housing Market Forecast 2016-2017
Housing Market Forecast 2016-2017Housing Market Forecast 2016-2017
Housing Market Forecast 2016-2017
 
Building Products and Materials Industry Insights - Q1 2017
Building Products and Materials Industry Insights - Q1 2017Building Products and Materials Industry Insights - Q1 2017
Building Products and Materials Industry Insights - Q1 2017
 
This Month in Real Estate July 2011
This Month in Real Estate July 2011This Month in Real Estate July 2011
This Month in Real Estate July 2011
 
San Francisco Real Estate Housing Market 2016 Summary
San Francisco Real Estate Housing Market 2016 SummarySan Francisco Real Estate Housing Market 2016 Summary
San Francisco Real Estate Housing Market 2016 Summary
 
U.S. House Prices Rose 1.9 Percent in First Quarter 2013
U.S. House Prices Rose 1.9 Percent in First Quarter 2013U.S. House Prices Rose 1.9 Percent in First Quarter 2013
U.S. House Prices Rose 1.9 Percent in First Quarter 2013
 
Economic Indicators for week of July 26-30
Economic Indicators for week of July 26-30Economic Indicators for week of July 26-30
Economic Indicators for week of July 26-30
 
CANADIAN HOME SALES ACTIVITY IMPROVES IN JUNE - 16 JULY 2018
CANADIAN HOME SALES ACTIVITY IMPROVES IN JUNE - 16 JULY 2018CANADIAN HOME SALES ACTIVITY IMPROVES IN JUNE - 16 JULY 2018
CANADIAN HOME SALES ACTIVITY IMPROVES IN JUNE - 16 JULY 2018
 
San francisco market focus 2018 overview
San francisco market focus 2018 overviewSan francisco market focus 2018 overview
San francisco market focus 2018 overview
 
Princeton Real Estate Market Presentation March 2017
Princeton Real Estate Market Presentation March 2017Princeton Real Estate Market Presentation March 2017
Princeton Real Estate Market Presentation March 2017
 
Canadian M&A Insights - Summer 2017
Canadian M&A Insights - Summer 2017Canadian M&A Insights - Summer 2017
Canadian M&A Insights - Summer 2017
 
ABSA_House Price Indices (latest)
ABSA_House Price Indices (latest)ABSA_House Price Indices (latest)
ABSA_House Price Indices (latest)
 
2016 01-rental review dec 2015-released jan 2016
2016 01-rental review dec 2015-released jan 20162016 01-rental review dec 2015-released jan 2016
2016 01-rental review dec 2015-released jan 2016
 
Economic indicators for week of June 21-25
Economic indicators for week of June 21-25Economic indicators for week of June 21-25
Economic indicators for week of June 21-25
 
Monthly Market Report - March 2018 from Physicians Agent™ Network
Monthly Market Report - March 2018 from Physicians Agent™ NetworkMonthly Market Report - March 2018 from Physicians Agent™ Network
Monthly Market Report - March 2018 from Physicians Agent™ Network
 
Rent reviewreportmarch72016
Rent reviewreportmarch72016Rent reviewreportmarch72016
Rent reviewreportmarch72016
 
January 2011 Princeton Area Market Update
January 2011 Princeton Area Market UpdateJanuary 2011 Princeton Area Market Update
January 2011 Princeton Area Market Update
 
By the numbers week of 4 17-17
By the numbers week of 4 17-17By the numbers week of 4 17-17
By the numbers week of 4 17-17
 
San Francisco Market Focus March 2017
San Francisco Market Focus March 2017San Francisco Market Focus March 2017
San Francisco Market Focus March 2017
 

Similar to W Cape House Price Growth Slowed in 2017, But Cape Town Metro Remains Strong

FNB_Residential Demand Conditions_1st Time Home Buying
FNB_Residential Demand Conditions_1st Time Home BuyingFNB_Residential Demand Conditions_1st Time Home Buying
FNB_Residential Demand Conditions_1st Time Home BuyingBerty Van Staaden
 
FNB_Gauteng Sub-Region House Price Indices
FNB_Gauteng Sub-Region House Price IndicesFNB_Gauteng Sub-Region House Price Indices
FNB_Gauteng Sub-Region House Price IndicesBerty Van Staaden
 
FNB_House Price Index_Nov 2017
FNB_House Price Index_Nov 2017FNB_House Price Index_Nov 2017
FNB_House Price Index_Nov 2017Berty Van Staaden
 
FNB 2017 House Price Index Performance
FNB 2017 House Price Index PerformanceFNB 2017 House Price Index Performance
FNB 2017 House Price Index PerformanceBerty Van Staaden
 
FNB_AREA VALUE BAND HOUSE PRICE INDEX
FNB_AREA VALUE BAND HOUSE PRICE INDEXFNB_AREA VALUE BAND HOUSE PRICE INDEX
FNB_AREA VALUE BAND HOUSE PRICE INDEXBerty Van Staaden
 
FNB_Home Buying Estate Agent Survey
FNB_Home Buying Estate Agent SurveyFNB_Home Buying Estate Agent Survey
FNB_Home Buying Estate Agent SurveyBerty Van Staaden
 
PayProp Rental Index Q2 2017
PayProp Rental Index Q2 2017PayProp Rental Index Q2 2017
PayProp Rental Index Q2 2017Berty Van Staaden
 
FNB Residential Property Monthly March
FNB Residential Property Monthly MarchFNB Residential Property Monthly March
FNB Residential Property Monthly MarchBerty Van Staaden
 
FNB Residential Property Monthly_March
FNB Residential Property Monthly_MarchFNB Residential Property Monthly_March
FNB Residential Property Monthly_MarchBerty Van Staaden
 
FNB House Price Index_Sept 2017
FNB House Price Index_Sept 2017FNB House Price Index_Sept 2017
FNB House Price Index_Sept 2017Berty Van Staaden
 
PayProp Rental Index_ Q3 2017
PayProp Rental Index_ Q3 2017PayProp Rental Index_ Q3 2017
PayProp Rental Index_ Q3 2017Berty Van Staaden
 
PayProp Rental Index_Q2 2018
PayProp Rental Index_Q2 2018PayProp Rental Index_Q2 2018
PayProp Rental Index_Q2 2018Berty Van Staaden
 

Similar to W Cape House Price Growth Slowed in 2017, But Cape Town Metro Remains Strong (20)

FNB_Western Cape
FNB_Western CapeFNB_Western Cape
FNB_Western Cape
 
FNB_Residential Demand Conditions_1st Time Home Buying
FNB_Residential Demand Conditions_1st Time Home BuyingFNB_Residential Demand Conditions_1st Time Home Buying
FNB_Residential Demand Conditions_1st Time Home Buying
 
FNB_House Price Index
FNB_House Price IndexFNB_House Price Index
FNB_House Price Index
 
FNB_Gauteng Sub-Region House Price Indices
FNB_Gauteng Sub-Region House Price IndicesFNB_Gauteng Sub-Region House Price Indices
FNB_Gauteng Sub-Region House Price Indices
 
FNB_Gauteng HPI_Jul 2017
FNB_Gauteng HPI_Jul 2017FNB_Gauteng HPI_Jul 2017
FNB_Gauteng HPI_Jul 2017
 
FNB_House Price Index_Nov 2017
FNB_House Price Index_Nov 2017FNB_House Price Index_Nov 2017
FNB_House Price Index_Nov 2017
 
Australian Regional Market Report
Australian Regional Market ReportAustralian Regional Market Report
Australian Regional Market Report
 
FNB 2017 House Price Index Performance
FNB 2017 House Price Index PerformanceFNB 2017 House Price Index Performance
FNB 2017 House Price Index Performance
 
FNB_AREA VALUE BAND HOUSE PRICE INDEX
FNB_AREA VALUE BAND HOUSE PRICE INDEXFNB_AREA VALUE BAND HOUSE PRICE INDEX
FNB_AREA VALUE BAND HOUSE PRICE INDEX
 
FNB_Home Buying Estate Agent Survey
FNB_Home Buying Estate Agent SurveyFNB_Home Buying Estate Agent Survey
FNB_Home Buying Estate Agent Survey
 
PayProp Rental Index Q2 2017
PayProp Rental Index Q2 2017PayProp Rental Index Q2 2017
PayProp Rental Index Q2 2017
 
FNB Residential Property Monthly March
FNB Residential Property Monthly MarchFNB Residential Property Monthly March
FNB Residential Property Monthly March
 
FNB Residential Property Monthly_March
FNB Residential Property Monthly_MarchFNB Residential Property Monthly_March
FNB Residential Property Monthly_March
 
FNB House Price Index_Sept 2017
FNB House Price Index_Sept 2017FNB House Price Index_Sept 2017
FNB House Price Index_Sept 2017
 
2016 09--core logic-home-value-index-sept
2016 09--core logic-home-value-index-sept2016 09--core logic-home-value-index-sept
2016 09--core logic-home-value-index-sept
 
PayProp Rental Index_ Q3 2017
PayProp Rental Index_ Q3 2017PayProp Rental Index_ Q3 2017
PayProp Rental Index_ Q3 2017
 
PayProp Rental Index_Q2 2018
PayProp Rental Index_Q2 2018PayProp Rental Index_Q2 2018
PayProp Rental Index_Q2 2018
 
Queensland Market Monitor
Queensland Market MonitorQueensland Market Monitor
Queensland Market Monitor
 
2017 01-core logic-home-value_index
2017 01-core logic-home-value_index2017 01-core logic-home-value_index
2017 01-core logic-home-value_index
 
Core logic home value index feb 2020 final 0
Core logic home value index feb 2020 final 0Core logic home value index feb 2020 final 0
Core logic home value index feb 2020 final 0
 

More from Berty Van Staaden

FNB_Property Barometer - September
FNB_Property Barometer - SeptemberFNB_Property Barometer - September
FNB_Property Barometer - SeptemberBerty Van Staaden
 
Lightstone House Price Index_August 2019
Lightstone House Price Index_August 2019Lightstone House Price Index_August 2019
Lightstone House Price Index_August 2019Berty Van Staaden
 
FNB_Gauteng House Price Index
FNB_Gauteng House Price IndexFNB_Gauteng House Price Index
FNB_Gauteng House Price IndexBerty Van Staaden
 
FNB Property Insights SARB Leading Indicator_August 2019
FNB Property Insights SARB Leading Indicator_August 2019FNB Property Insights SARB Leading Indicator_August 2019
FNB Property Insights SARB Leading Indicator_August 2019Berty Van Staaden
 
PayProp Rental Index Q2 2019
PayProp Rental Index Q2 2019PayProp Rental Index Q2 2019
PayProp Rental Index Q2 2019Berty Van Staaden
 
FNB Residential Building Stats_Q2 2019
FNB Residential Building Stats_Q2 2019FNB Residential Building Stats_Q2 2019
FNB Residential Building Stats_Q2 2019Berty Van Staaden
 
FNB Property Insights August 2019
FNB Property Insights August 2019FNB Property Insights August 2019
FNB Property Insights August 2019Berty Van Staaden
 
FNB Property Barometer (CPTt)_Aug 2019
FNB Property Barometer (CPTt)_Aug 2019FNB Property Barometer (CPTt)_Aug 2019
FNB Property Barometer (CPTt)_Aug 2019Berty Van Staaden
 
FNB_Property Insights_Retail Property's Consumer Challenges
FNB_Property Insights_Retail Property's Consumer ChallengesFNB_Property Insights_Retail Property's Consumer Challenges
FNB_Property Insights_Retail Property's Consumer ChallengesBerty Van Staaden
 
Lightstone_Residential Property Indices_July 2019
Lightstone_Residential Property Indices_July 2019Lightstone_Residential Property Indices_July 2019
Lightstone_Residential Property Indices_July 2019Berty Van Staaden
 
FNB Market Activity Ratings_July 2019
FNB Market Activity Ratings_July 2019FNB Market Activity Ratings_July 2019
FNB Market Activity Ratings_July 2019Berty Van Staaden
 
FNB May Building Statistics (Jul 2019)
FNB May Building Statistics (Jul 2019)FNB May Building Statistics (Jul 2019)
FNB May Building Statistics (Jul 2019)Berty Van Staaden
 
FNB Estate Agents Survey_Buy-to-Let
FNB Estate Agents Survey_Buy-to-LetFNB Estate Agents Survey_Buy-to-Let
FNB Estate Agents Survey_Buy-to-LetBerty Van Staaden
 
FNB Estate Agents Survey_Net Foreign Effect
FNB Estate Agents Survey_Net Foreign EffectFNB Estate Agents Survey_Net Foreign Effect
FNB Estate Agents Survey_Net Foreign EffectBerty Van Staaden
 
Lightstone_Residential Property Indices May 2019
Lightstone_Residential Property Indices May 2019Lightstone_Residential Property Indices May 2019
Lightstone_Residential Property Indices May 2019Berty Van Staaden
 
PayProp Rental Index Q 1 2019
PayProp Rental Index Q 1 2019PayProp Rental Index Q 1 2019
PayProp Rental Index Q 1 2019Berty Van Staaden
 
FNB Residential Property Barometer_February 2019
FNB Residential Property Barometer_February 2019FNB Residential Property Barometer_February 2019
FNB Residential Property Barometer_February 2019Berty Van Staaden
 
Lightstone Property Forecast for 2019
Lightstone Property Forecast for 2019Lightstone Property Forecast for 2019
Lightstone Property Forecast for 2019Berty Van Staaden
 
Lightstone_Residential Property Indices_January 2019
Lightstone_Residential Property Indices_January 2019Lightstone_Residential Property Indices_January 2019
Lightstone_Residential Property Indices_January 2019Berty Van Staaden
 

More from Berty Van Staaden (20)

FNB_Property Barometer - September
FNB_Property Barometer - SeptemberFNB_Property Barometer - September
FNB_Property Barometer - September
 
Lightstone House Price Index_August 2019
Lightstone House Price Index_August 2019Lightstone House Price Index_August 2019
Lightstone House Price Index_August 2019
 
FNB_Gauteng House Price Index
FNB_Gauteng House Price IndexFNB_Gauteng House Price Index
FNB_Gauteng House Price Index
 
FNB Property Insights SARB Leading Indicator_August 2019
FNB Property Insights SARB Leading Indicator_August 2019FNB Property Insights SARB Leading Indicator_August 2019
FNB Property Insights SARB Leading Indicator_August 2019
 
PayProp Rental Index Q2 2019
PayProp Rental Index Q2 2019PayProp Rental Index Q2 2019
PayProp Rental Index Q2 2019
 
FNB Residential Building Stats_Q2 2019
FNB Residential Building Stats_Q2 2019FNB Residential Building Stats_Q2 2019
FNB Residential Building Stats_Q2 2019
 
FNB Property Insights August 2019
FNB Property Insights August 2019FNB Property Insights August 2019
FNB Property Insights August 2019
 
FNB Property Barometer (CPTt)_Aug 2019
FNB Property Barometer (CPTt)_Aug 2019FNB Property Barometer (CPTt)_Aug 2019
FNB Property Barometer (CPTt)_Aug 2019
 
FNB_Property Insights_Retail Property's Consumer Challenges
FNB_Property Insights_Retail Property's Consumer ChallengesFNB_Property Insights_Retail Property's Consumer Challenges
FNB_Property Insights_Retail Property's Consumer Challenges
 
Lightstone_Residential Property Indices_July 2019
Lightstone_Residential Property Indices_July 2019Lightstone_Residential Property Indices_July 2019
Lightstone_Residential Property Indices_July 2019
 
FNB_Rental Market
FNB_Rental MarketFNB_Rental Market
FNB_Rental Market
 
FNB Market Activity Ratings_July 2019
FNB Market Activity Ratings_July 2019FNB Market Activity Ratings_July 2019
FNB Market Activity Ratings_July 2019
 
FNB May Building Statistics (Jul 2019)
FNB May Building Statistics (Jul 2019)FNB May Building Statistics (Jul 2019)
FNB May Building Statistics (Jul 2019)
 
FNB Estate Agents Survey_Buy-to-Let
FNB Estate Agents Survey_Buy-to-LetFNB Estate Agents Survey_Buy-to-Let
FNB Estate Agents Survey_Buy-to-Let
 
FNB Estate Agents Survey_Net Foreign Effect
FNB Estate Agents Survey_Net Foreign EffectFNB Estate Agents Survey_Net Foreign Effect
FNB Estate Agents Survey_Net Foreign Effect
 
Lightstone_Residential Property Indices May 2019
Lightstone_Residential Property Indices May 2019Lightstone_Residential Property Indices May 2019
Lightstone_Residential Property Indices May 2019
 
PayProp Rental Index Q 1 2019
PayProp Rental Index Q 1 2019PayProp Rental Index Q 1 2019
PayProp Rental Index Q 1 2019
 
FNB Residential Property Barometer_February 2019
FNB Residential Property Barometer_February 2019FNB Residential Property Barometer_February 2019
FNB Residential Property Barometer_February 2019
 
Lightstone Property Forecast for 2019
Lightstone Property Forecast for 2019Lightstone Property Forecast for 2019
Lightstone Property Forecast for 2019
 
Lightstone_Residential Property Indices_January 2019
Lightstone_Residential Property Indices_January 2019Lightstone_Residential Property Indices_January 2019
Lightstone_Residential Property Indices_January 2019
 

Recently uploaded

Prestige Sanctuary Nandi Hills Bangalore.pdf
Prestige Sanctuary Nandi Hills Bangalore.pdfPrestige Sanctuary Nandi Hills Bangalore.pdf
Prestige Sanctuary Nandi Hills Bangalore.pdfashiyadav24
 
SVN Live 4.15.24 Weekly Property Broadcast
SVN Live 4.15.24 Weekly Property BroadcastSVN Live 4.15.24 Weekly Property Broadcast
SVN Live 4.15.24 Weekly Property BroadcastSVN International Corp.
 
Kohinoor Hinjewadi Phase 2 In Pune - PDF.pdf
Kohinoor Hinjewadi Phase 2 In Pune - PDF.pdfKohinoor Hinjewadi Phase 2 In Pune - PDF.pdf
Kohinoor Hinjewadi Phase 2 In Pune - PDF.pdfmonikasharma630
 
Honer Richmont Hyderabad E brochure - A Life With A View
Honer Richmont Hyderabad E brochure - A Life With A ViewHoner Richmont Hyderabad E brochure - A Life With A View
Honer Richmont Hyderabad E brochure - A Life With A ViewAhanundefined
 
Dubai Real Estate vs Other Global Markets-a-Comparative-Analysis
Dubai Real Estate vs Other Global Markets-a-Comparative-AnalysisDubai Real Estate vs Other Global Markets-a-Comparative-Analysis
Dubai Real Estate vs Other Global Markets-a-Comparative-AnalysisHomeStation1
 
Maha Mauka Squarefeet Brochure |Maha Mauka Squarefeet PDF Brochure|
Maha Mauka Squarefeet Brochure |Maha Mauka Squarefeet PDF Brochure|Maha Mauka Squarefeet Brochure |Maha Mauka Squarefeet PDF Brochure|
Maha Mauka Squarefeet Brochure |Maha Mauka Squarefeet PDF Brochure|AkshayJoshi575980
 
Shapoorji Pallonji Parkwest Sequoia Tower Binnypet, Central Bangalore E - Bro...
Shapoorji Pallonji Parkwest Sequoia Tower Binnypet, Central Bangalore E - Bro...Shapoorji Pallonji Parkwest Sequoia Tower Binnypet, Central Bangalore E - Bro...
Shapoorji Pallonji Parkwest Sequoia Tower Binnypet, Central Bangalore E - Bro...faheemali990101
 
Assetz Melodies Of Life off Hosa Road Bangalore.pdf
Assetz Melodies Of Life off Hosa Road Bangalore.pdfAssetz Melodies Of Life off Hosa Road Bangalore.pdf
Assetz Melodies Of Life off Hosa Road Bangalore.pdfashiyadav24
 
SSPL The Strand Abodes Pune Brochure.pdf
SSPL The Strand Abodes Pune Brochure.pdfSSPL The Strand Abodes Pune Brochure.pdf
SSPL The Strand Abodes Pune Brochure.pdfkishor21012022
 
NIDO by Wanson Group Floor Plan Set 2024
NIDO by Wanson Group Floor Plan Set 2024NIDO by Wanson Group Floor Plan Set 2024
NIDO by Wanson Group Floor Plan Set 2024VickyAulakh1
 
Volition Meetup 2024 03 Mortgages & Interest Rates – Is The Worst Behind Us_ ...
Volition Meetup 2024 03 Mortgages & Interest Rates – Is The Worst Behind Us_ ...Volition Meetup 2024 03 Mortgages & Interest Rates – Is The Worst Behind Us_ ...
Volition Meetup 2024 03 Mortgages & Interest Rates – Is The Worst Behind Us_ ...Volition Properties
 
What is Affordable Housing? Bristol Civic Society April 2024
What is Affordable Housing? Bristol Civic Society April 2024What is Affordable Housing? Bristol Civic Society April 2024
What is Affordable Housing? Bristol Civic Society April 2024Paul Smith
 
Listing Turkey Green life Istanbul Eyup Catalog
Listing Turkey Green life Istanbul Eyup CatalogListing Turkey Green life Istanbul Eyup Catalog
Listing Turkey Green life Istanbul Eyup CatalogListing Turkey
 
Seller Seminar Presentation With A Realtor
Seller Seminar  Presentation With A RealtorSeller Seminar  Presentation With A Realtor
Seller Seminar Presentation With A Realtorcarlsbadheather
 
Shriram Hebbal One Kempapura Bangalore E- Brochure.pdf
Shriram Hebbal One Kempapura Bangalore E- Brochure.pdfShriram Hebbal One Kempapura Bangalore E- Brochure.pdf
Shriram Hebbal One Kempapura Bangalore E- Brochure.pdffaheemali990101
 
Provident Kenworth Rajendra Nagar Hyderabad.pdf
Provident Kenworth Rajendra Nagar Hyderabad.pdfProvident Kenworth Rajendra Nagar Hyderabad.pdf
Provident Kenworth Rajendra Nagar Hyderabad.pdfashiyadav24
 
Saheel ITREND Futura At Baner Annexe Pune - PDF.pdf
Saheel ITREND Futura At Baner Annexe Pune - PDF.pdfSaheel ITREND Futura At Baner Annexe Pune - PDF.pdf
Saheel ITREND Futura At Baner Annexe Pune - PDF.pdfmonikasharma630
 
Listing Turkey - Viva Perla Maltepe Catalog
Listing Turkey - Viva Perla Maltepe CatalogListing Turkey - Viva Perla Maltepe Catalog
Listing Turkey - Viva Perla Maltepe CatalogListing Turkey
 
Goyal Ganga One Boat Club Pune Brochure.pdf
Goyal Ganga One Boat Club Pune Brochure.pdfGoyal Ganga One Boat Club Pune Brochure.pdf
Goyal Ganga One Boat Club Pune Brochure.pdfabbu831446
 
SVN Live 4.8.24 Weekly Property Broadcast
SVN Live 4.8.24 Weekly Property BroadcastSVN Live 4.8.24 Weekly Property Broadcast
SVN Live 4.8.24 Weekly Property BroadcastSVN International Corp.
 

Recently uploaded (20)

Prestige Sanctuary Nandi Hills Bangalore.pdf
Prestige Sanctuary Nandi Hills Bangalore.pdfPrestige Sanctuary Nandi Hills Bangalore.pdf
Prestige Sanctuary Nandi Hills Bangalore.pdf
 
SVN Live 4.15.24 Weekly Property Broadcast
SVN Live 4.15.24 Weekly Property BroadcastSVN Live 4.15.24 Weekly Property Broadcast
SVN Live 4.15.24 Weekly Property Broadcast
 
Kohinoor Hinjewadi Phase 2 In Pune - PDF.pdf
Kohinoor Hinjewadi Phase 2 In Pune - PDF.pdfKohinoor Hinjewadi Phase 2 In Pune - PDF.pdf
Kohinoor Hinjewadi Phase 2 In Pune - PDF.pdf
 
Honer Richmont Hyderabad E brochure - A Life With A View
Honer Richmont Hyderabad E brochure - A Life With A ViewHoner Richmont Hyderabad E brochure - A Life With A View
Honer Richmont Hyderabad E brochure - A Life With A View
 
Dubai Real Estate vs Other Global Markets-a-Comparative-Analysis
Dubai Real Estate vs Other Global Markets-a-Comparative-AnalysisDubai Real Estate vs Other Global Markets-a-Comparative-Analysis
Dubai Real Estate vs Other Global Markets-a-Comparative-Analysis
 
Maha Mauka Squarefeet Brochure |Maha Mauka Squarefeet PDF Brochure|
Maha Mauka Squarefeet Brochure |Maha Mauka Squarefeet PDF Brochure|Maha Mauka Squarefeet Brochure |Maha Mauka Squarefeet PDF Brochure|
Maha Mauka Squarefeet Brochure |Maha Mauka Squarefeet PDF Brochure|
 
Shapoorji Pallonji Parkwest Sequoia Tower Binnypet, Central Bangalore E - Bro...
Shapoorji Pallonji Parkwest Sequoia Tower Binnypet, Central Bangalore E - Bro...Shapoorji Pallonji Parkwest Sequoia Tower Binnypet, Central Bangalore E - Bro...
Shapoorji Pallonji Parkwest Sequoia Tower Binnypet, Central Bangalore E - Bro...
 
Assetz Melodies Of Life off Hosa Road Bangalore.pdf
Assetz Melodies Of Life off Hosa Road Bangalore.pdfAssetz Melodies Of Life off Hosa Road Bangalore.pdf
Assetz Melodies Of Life off Hosa Road Bangalore.pdf
 
SSPL The Strand Abodes Pune Brochure.pdf
SSPL The Strand Abodes Pune Brochure.pdfSSPL The Strand Abodes Pune Brochure.pdf
SSPL The Strand Abodes Pune Brochure.pdf
 
NIDO by Wanson Group Floor Plan Set 2024
NIDO by Wanson Group Floor Plan Set 2024NIDO by Wanson Group Floor Plan Set 2024
NIDO by Wanson Group Floor Plan Set 2024
 
Volition Meetup 2024 03 Mortgages & Interest Rates – Is The Worst Behind Us_ ...
Volition Meetup 2024 03 Mortgages & Interest Rates – Is The Worst Behind Us_ ...Volition Meetup 2024 03 Mortgages & Interest Rates – Is The Worst Behind Us_ ...
Volition Meetup 2024 03 Mortgages & Interest Rates – Is The Worst Behind Us_ ...
 
What is Affordable Housing? Bristol Civic Society April 2024
What is Affordable Housing? Bristol Civic Society April 2024What is Affordable Housing? Bristol Civic Society April 2024
What is Affordable Housing? Bristol Civic Society April 2024
 
Listing Turkey Green life Istanbul Eyup Catalog
Listing Turkey Green life Istanbul Eyup CatalogListing Turkey Green life Istanbul Eyup Catalog
Listing Turkey Green life Istanbul Eyup Catalog
 
Seller Seminar Presentation With A Realtor
Seller Seminar  Presentation With A RealtorSeller Seminar  Presentation With A Realtor
Seller Seminar Presentation With A Realtor
 
Shriram Hebbal One Kempapura Bangalore E- Brochure.pdf
Shriram Hebbal One Kempapura Bangalore E- Brochure.pdfShriram Hebbal One Kempapura Bangalore E- Brochure.pdf
Shriram Hebbal One Kempapura Bangalore E- Brochure.pdf
 
Provident Kenworth Rajendra Nagar Hyderabad.pdf
Provident Kenworth Rajendra Nagar Hyderabad.pdfProvident Kenworth Rajendra Nagar Hyderabad.pdf
Provident Kenworth Rajendra Nagar Hyderabad.pdf
 
Saheel ITREND Futura At Baner Annexe Pune - PDF.pdf
Saheel ITREND Futura At Baner Annexe Pune - PDF.pdfSaheel ITREND Futura At Baner Annexe Pune - PDF.pdf
Saheel ITREND Futura At Baner Annexe Pune - PDF.pdf
 
Listing Turkey - Viva Perla Maltepe Catalog
Listing Turkey - Viva Perla Maltepe CatalogListing Turkey - Viva Perla Maltepe Catalog
Listing Turkey - Viva Perla Maltepe Catalog
 
Goyal Ganga One Boat Club Pune Brochure.pdf
Goyal Ganga One Boat Club Pune Brochure.pdfGoyal Ganga One Boat Club Pune Brochure.pdf
Goyal Ganga One Boat Club Pune Brochure.pdf
 
SVN Live 4.8.24 Weekly Property Broadcast
SVN Live 4.8.24 Weekly Property BroadcastSVN Live 4.8.24 Weekly Property Broadcast
SVN Live 4.8.24 Weekly Property Broadcast
 

W Cape House Price Growth Slowed in 2017, But Cape Town Metro Remains Strong

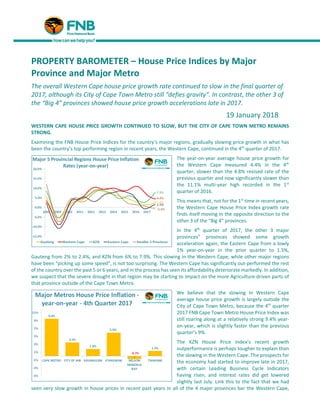
  • 1. PROPERTY BAROMETER – House Price Indices by Major Province and Major Metro The overall Western Cape house price growth rate continued to slow in the final quarter of 2017, although its City of Cape Town Metro still “defies gravity”. In contrast, the other 3 of the “Big 4” provinces showed house price growth accelerations late in 2017. 19 January 2018 WESTERN CAPE HOUSE PRICE GROWTH CONTINUED TO SLOW, BUT THE CITY OF CAPE TOWN METRO REMAINS STRONG. Examining the FNB House Price Indices for the country’s major regions, gradually slowing price growth in what has been the country’s top performing region in recent years, the Western Cape, continued in the 4th quarter of 2017. The year-on-year average house price growth for the Western Cape measured 4.4% in the 4th quarter, slower than the 4.8% revised rate of the previous quarter and now significantly slower than the 11.1% multi-year high recorded in the 1st quarter of 2016. This means that, not for the 1st time in recent years, the Western Cape House Price Index growth rate finds itself moving in the opposite direction to the other 3 of the “Big 4” provinces. In the 4th quarter of 2017, the other 3 major provinces” provinces showed some growth acceleration again, the Eastern Cape from a lowly 1% year-on-year in the prior quarter to 1.5%, Gauteng from 2% to 2.4%, and KZN from 6% to 7.9%. This slowing in the Western Cape, while other major regions have been “picking up some speed”, is not too surprising. The Western Cape has significantly out-performed the rest of the country over the past 5 or 6 years, and in the process has seen its affordability deteriorate markedly. In addition, we suspect that the severe drought in that region may be starting to impact on the more Agriculture-driven parts of that province outside of the Cape Town Metro. We believe that the slowing in Western Cape average house price growth is largely outside the City of Cape Town Metro, because the 4th quarter 2017 FNB Cape Town Metro House Price Index was still roaring along at a relatively strong 9.4% year- on-year, which is slightly faster than the previous quarter’s 9%. The KZN House Price Index’s recent growth outperformance is perhaps tougher to explain than the slowing in the Western Cape. The prospects for the economy had started to improve late in 2017, with certain Leading Business Cycle Indicators having risen, and interest rates did get lowered slightly last July. Link this to the fact that we had seen very slow growth in house prices in recent past years in all of the 4 major provinces bar the Western Cape,
  • 2. translating into some affordability improvements in terms of average house price relative to household incomes, and some recent house price acceleration in these 3 provinces is not too surprising. But the recent outperformance of KZN’s house price growth over Gauteng is a little surprising (although it must be remembered that all regions remain in single-digit price growth, so nothing is booming). We say this because our FNB Estate Agent Surveys for the major metros point to a greater supply-demand imbalance in the all-important Ethekwini Metro in KZN (and Ethekwini’s recent house price growth acceleration has been a contributor to KZN Province’s overall house price growth acceleration), with the 4th quarter estimated average time of homes on the market in that metro being a still-lengthy 20 weeks and 6 days, compared to Greater Joburg’s shorter 17 weeks and 1 day, and Tshwane Metro’s 13 weeks and 2 days. During 2017, Gauteng’s Major Metro regions also saw strong rates of 1st time buying compared to all 3 Major Coastal Metros, suggesting that they have less of an affordability challenge than down at the coast. Therefore, despite a recent superior price growth performance in KZN, we believe that price realism and affordability in Gauteng are better than the other major regions, and that Gauteng is all round the healthiest and most well-balanced housing market. The “superior” price growth performance in KZN may thus not be sustainable for too long. The FNB House Price Index for the 5 Smaller Provinces (Mpumalanga, Limpopo, North West, Northern Cape and Free State) showed further negative growth in the 4th quarter of 2017, from -0.4% year-on-year in the prior quarter to -0.9%. In recent years. Mining regions’ economies in the smaller provinces have been under pressure since around 2011, while more recently many of the strong Agriculture regions’ economies have been under pressure from drought conditions. Their housing markets’ underperformance is thus perhaps not altogether surprising in such challenging economic conditions. Cumulatively, over the past 5 years, from the 4th quarter of 2012 to the 4th quarter of 2017, the Western Cape’s house price growth has far outpaced the other major regions, rising by 50.4%, with KZN being a distant second recording 31.9%, Eastern Cape 25.6%, Gauteng 21.9% and the 5 Smaller Provinces 17.1% JOHN LOOS: HOUSEHOLD AND PROPERTY SECTOR STRATEGIST 087-328 0151 John.loos@fnb.co.za The information in this publication is derived from sources which are regarded as accurate and reliable, is of a general nature only, does not constitute advice and may not be applicable to all circumstances. Detailed advice should be obtained in individual cases. No responsibility for any error, omission or loss sustained by any person acting or refraining from acting as a result of this publication is accepted by Firstrand Group Limited and / or the authors of the material. First National Bank – a division of FirstRand Bank Limited. An Authorised Financial Services provider. Reg No. 1929/001225/06