SlideShare a Scribd company logo
1 of 4
Download to read offline
PROPERTY INSIGHTS
– The October CPI and Property
Recent CPI readings continue to show Residential Rentals as a
positive contributor to low interest rates, but the Municipal
Rates and Utilities Tariffs component of the Housing CPI
remains troublesome
Today’s October CPI (Consumer Price Index) showed a slight acceleration in its
year-on-year inflation rate, from 4.9% in the previous month to 5.1%. This
remains within the SARB’s (South African Reserve Bank) 3-6% target range, but
now being nearer to the higher end of this target range, the speculation
regarding tomorrow’s SARB interest rate decision ranges between “hike” and
“unchanged” rates, Firstrand expecting a 25 basis point interest rate hike.
The key contributor to this mild acceleration in the CPI inflation rate was the
recent sharp rise in domestic fuel prices, brought on by an oil price surge up to
early-October. This caused a larger contribution to overall CPI from the Transport
CPI
POTENTIAL IMPLICATIONS FOR THE PROPERTY MARKET
But what do CPI numbers in recent months say about property, or imply for
property. Some would say that, given that it has much to do with higher petrol
costs in recent months, homes nearer to major places of employment would
become more sought after, in an attempt to lower commuter transport costs.
We would doubt this, because these oil and petrol price surges are typically too
short-lived to change people’s living and home buying decisions (essentially
longer term decisions) significantly. What changes people location decisions over
the longer term is the gradually mounting traffic congestion challenge in SA’s
major cities, as opposed to short run fuel price spikes.
But a real potential short term implication emanates from a possible interest
rate hike, should recent CPI readings lead to this. The weak economy of recent
years has already caused real property values (“real” referring to property values
adjusted for general inflation, either using the CPI or GDP measures of inflation)
to go into decline for some time now, and here we refer to both Residential and
21 November 2018
FNB COMMERCIAL PROPERTY
FINANCE
JOHN LOOS:
PROPERTY SECTOR
STRATEGIST
087-328 0151
john.loos@fnb.co.za
The information in this publication is
derived from sources which are regarded as
accurate and reliable, is of a general nature
only, does not constitute advice and may
not be applicable to all circumstances.
Detailed advice should be obtained in
individual cases. No responsibility for any
error, omission or loss sustained by any
person acting or refraining from acting as a
result of this publication is accepted by
Firstrand Group Limited and / or the
authors of the material.
First National Bank – a division of FirstRand Bank
Limited. An Authorised Financial Services
provider. Reg No. 1929/001225/06
Commercial Property. Should the October CPI reading lead to a rate hike, we would expect property demand to remain
weak in this economic environment, and for real property values to remain in decline.
WHAT THE CPI SAYS ABOUT THE PROPERTY MARKET – RENTAL MARKET WEAKNESS, BAD FOR LANDLORDS BUT
GOOD FOR INTEREST RATES
The Property Market itself is a key positive contributor in terms of keeping CPI inflation within the 3-6% target range.
And here we refer specifically to the Residential
Rental part of the Property Market. The Actual
Rental and Owner Equivalent Housing Rental CPI
Sub-Indices carry a large weighting of 16.84% of the
total CPI together. This is almost as big as the Food
and Non-Alcoholic Beverages CPI’s weighting of
17.24%, and a weak Residential Rental Market in
recent times has contributed to the low CPI/low
interest rate cause.
The CPI for Actual Rentals showed inflation of
4.03% (last surveyed in September CPI), having
slowed in recent surveys, and the Owner Equivalent
Rental CPI an even slower 3.66%.
UTILITIES TARIFFS AND MUNICIPAL RATES REMAIN TROUBLESOME
However, the overall Housing CPI inflation rate remains mildly “troublesome” for the Overall CPI inflation rate,
recording an October rate of 5.2% due to ongoing strong inflation in Municipal Rates and Utilities Tariffs, which are
components of the Housing CPI, being costs directly related to owning or renting a house.
Municipal Rates and Non-Electricity Utilities Tariffs
(“Water and Other Services” CPI) are most
troublesome, recording year-on-year inflation of
11.1%. The CPI for Electricity and Other Fuels
showed 7.73% year-on-year inflation, also well
above overall CPI inflation.
By comparison, the CPI for Home Maintenance is
better behaved at 3.1% year-on-year. It is possible
that this latter CPI component reflects the Home
Maintenance Industry being partly “crowded out”
by ongoing sharp cost increases for homeowners
emanating from Municipal Rates and Tariffs.
The long term trend of Municipal Rates and Tariffs
inflation far outstripping general inflation raises the affordability challenges for tenants and owners, incentivizing a
shift to alternative sources of power to Eskom, while also incentivizing better use of property/space.
SMALLER IS BETTER IN THE HOUSING RENTAL MARKET
So finally, perhaps not surprising is that the CPI
figures also point to “smaller being better” in terms
of home rentals, the Flat Rental and Townhouse
Rental CPIs continuing to outperform the “Houses”
CPI, the latter being on average the largest category
and the most costly to run. The Flats Rental CPI
inflated by 4.7% year-on-year in October, The
Townhouses CPI by a similar 4.8%, and the House
CPI by a noticeably lesser 3.5%.
Since January 2008, just over a decade, the Flats
CPI has inflated cumulatively by 90%, Townhouses
by 75.9% and Houses by 62.6%.
May-18 Jun-18 Jul-18 Aug-18 Sep-18 Oct-18
Key CPI Inflation Measures
CPI - All Urban Areas 107.2 107.6 108.5 108.4 108.9 109.4
Y-o-Y % Change 4.4 4.6 5.1 4.9 4.9 5.1
CPI - All Goods 106.0 106.5 107.5 107.4 107.6 108.6
Y-o-Y % Change 3.5 4.2 5.3 5.0 4.8 5.1
CPI - All Services 108.4 108.7 109.4 109.4 110.2 110.2
Y-o-Y % Change 5.3 4.9 5.0 5.0 5.2 5.1
May-18 Jun-18 Jul-18 Aug-18 Sep-18 Oct-18
Key CPI Housing and Related Measures
CPI - Housing and Utilities 105.7 106.0 108.4 108.5 109.4 109.4
Y-o-Y % Change 4.8 4.1 5.2 5.3 5.29 5.19
CPI - Actual housing rentals 106.4 106.9 106.9 106.9 108.4 108.4
Y-o-Y % Change 5.1 4.2 4.2 4.2 4.03 4.03
- Houses 105.9 106.1 106.1 106.1 107.5 107.5
Y-o-Y % Change 4.7 3.6 3.6 3.6 3.5 3.5
- Townhouses 107.7 107.6 107.6 107.6 109.4 109.4
Y-o-Y % Change 6.3 4.6 4.6 4.6 4.8 4.8
- Flats 107.1 108.3 108.3 108.3 109.8 109.8
Y-o-Y % Change 5.8 5.1 5.1 5.1 4.7 4.7
CPI - Owner occupied housing rentals 105.8 106.2 106.2 106.2 107.5 107.5
Y-o-Y % Change 4.6 3.7 3.7 3.7 3.66 3.66
- Houses 105.7 106.0 106.0 106.0 107.3 107.3
Y-o-Y % Change 4.5 3.5 3.5 3.5 3.5 3.5
- Townhouses 106.6 106.9 106.9 106.9 108.4 108.4
Y-o-Y % Change 5.3 4.4 4.4 4.4 4.3 4.3
- Flats 106.4 107.5 107.5 107.5 108.9 108.9
Y-o-Y % Change 5.3 4.7 4.7 4.7 4.3 4.3
CPI - Home Maintenance and Repairs 104.5 105.1 105.2 105.5 105.3 105.6
Y-o-Y % Change 2.5 2.9 2.9 3.0 3.0 3.1
CPI - Housing - Water and other services 107.9 107.9 118.9 119.1 119.1 119.1
Y-o-Y % Change 7.3 7.1 11.0 11.2 11.1 11.1
CPI - Housing - Electricity and other fuels 103.1 103.1 110.0 110.1 110.1 110.1
Y-o-Y % Change 3.1 3.1 7.7 7.8 7.8 7.7
Consumer Inflation - Key Components
Consumer Inflation - Housing - Related Components
May-18 Jun-18 Jul-18 Aug-18 Sep-18 Oct-18
Key CPI Product and Service Categories
CPI - Housing and Utiilities 105.7 106.0 108.4 108.5 109.4 109.4
Y-o-Y % Change 4.8 4.1 5.2 5.3 5.3 5.2
CPI - Food and Non-Alcoholic Beverages 106.8 106.8 107.1 107.0 107.3 107.5
Y-o-Y % Change 3.4 3.4 3.4 3.5 3.9 3.4
CPI - Alcoholic Beverages and Tobacco 108.7 108.7 109.0 108.8 108.9 109.4
Y-o-Y % Change 6.2 6.0 6.0 4.6 4.2 4.2
CPI - Clothing and Footwear 102.6 102.8 102.9 103.1 103.2 103.3
Y-o-Y % Change 1.7 1.8 1.8 1.9 1.9 2.0
CPI - Household Contents and Equipment 102.9 103.9 104.0 103.8 104.5 104.4
Y-o-Y % Change 2.4 2.7 2.8 2.9 3.0 3.0
CPI - Health 110.7 110.7 110.7 111.3 111.7 111.4
Y-o-Y % Change 4.8 4.7 4.4 5.2 5.4 5.0
CPI - Transport 108.2 110.2 111.3 111.4 112.4 115.3
Y-o-Y % Change 5.0 7.3 10.0 9.5 8.7 10.5
CPI - Communication 100.3 100.1 100.0 100.0 99.8 99.8
Y-o-Y % Change 1.1 1.1 1.1 1.2 1.1 1.2
CPI - Recreation and Culture 101.9 101.3 101.3 101.2 101.2 101.3
Y-o-Y % Change 1.3 0.6 0.4 0.3 0.5 0.7
CPI - Education 114.2 114.2 114.2 114.2 114.2 114.2
Y-o-Y % Change 6.7 6.7 6.7 6.7 6.7 6.7
CPI - Restaurants and Hotels 105.3 105.0 105.4 105.6 105.9 106.1
Y-o-Y % Change 5.0 4.5 4.2 4.0 4.6 4.2
CPI - Miscellaneous 113.0 113.1 113.1 113.0 113.1 113.0
Y-o-Y % Change 6.2 6.2 5.7 5.6 5.5 5.4
Consumer Inflation - Key Product and Service Categories

More Related Content

What's hot

July 2021 Okanagan Statistics
July 2021 Okanagan StatisticsJuly 2021 Okanagan Statistics
July 2021 Okanagan StatisticsVicky Aulakh
 
Annie Williams Real Estate Report - March 2021
Annie Williams Real Estate Report - March 2021Annie Williams Real Estate Report - March 2021
Annie Williams Real Estate Report - March 2021Annie Williams
 
The end of low pay? Charting the future of the minimum wage
The end of low pay? Charting the future of the minimum wageThe end of low pay? Charting the future of the minimum wage
The end of low pay? Charting the future of the minimum wageResolutionFoundation
 
What to Expect from Real Estate in 2018
What to Expect from Real Estate in 2018What to Expect from Real Estate in 2018
What to Expect from Real Estate in 2018ATTOM Data Solutions
 
Paying for a fairer Britain – Labour’s tax policy
Paying for a fairer Britain – Labour’s tax policyPaying for a fairer Britain – Labour’s tax policy
Paying for a fairer Britain – Labour’s tax policyResolutionFoundation
 
Tax and welfare policy: indexation and benchmarks for distributional impact
Tax and welfare policy: indexation and benchmarks for distributional impactTax and welfare policy: indexation and benchmarks for distributional impact
Tax and welfare policy: indexation and benchmarks for distributional impactEconomic and Social Research Institute
 
Covid-compressed incomes? The past, present and future of crisis-hit living s...
Covid-compressed incomes? The past, present and future of crisis-hit living s...Covid-compressed incomes? The past, present and future of crisis-hit living s...
Covid-compressed incomes? The past, present and future of crisis-hit living s...ResolutionFoundation
 
An Overview of the 2021 Long-Term Budget Outlook
An Overview of the 2021 Long-Term Budget OutlookAn Overview of the 2021 Long-Term Budget Outlook
An Overview of the 2021 Long-Term Budget OutlookCongressional Budget Office
 
A lifetime of living standards: Launch of the Intergenerational Centre and in...
A lifetime of living standards: Launch of the Intergenerational Centre and in...A lifetime of living standards: Launch of the Intergenerational Centre and in...
A lifetime of living standards: Launch of the Intergenerational Centre and in...ResolutionFoundation
 
An Overview of the 2021 Long-Term Budget Outlook
An Overview of the 2021 Long-Term Budget OutlookAn Overview of the 2021 Long-Term Budget Outlook
An Overview of the 2021 Long-Term Budget OutlookCongressional Budget Office
 
The congressional budget office's 2012 long term budget outlook
The congressional budget office's 2012 long term budget outlookThe congressional budget office's 2012 long term budget outlook
The congressional budget office's 2012 long term budget outlookRobert M. Davis, MPA
 
REBGV Statistics package July 2020
REBGV Statistics package July 2020REBGV Statistics package July 2020
REBGV Statistics package July 2020Vicky Aulakh
 
RICS UK Economy and Property Market Chart Book - December 2015
RICS UK Economy and Property Market Chart Book - December 2015RICS UK Economy and Property Market Chart Book - December 2015
RICS UK Economy and Property Market Chart Book - December 2015George Marcou
 

What's hot (20)

July 2021 Okanagan Statistics
July 2021 Okanagan StatisticsJuly 2021 Okanagan Statistics
July 2021 Okanagan Statistics
 
The 2020 Budget and Economic Outlook
The 2020 Budget and Economic OutlookThe 2020 Budget and Economic Outlook
The 2020 Budget and Economic Outlook
 
CBO’s Updated Budget and Economic Projections
CBO’s Updated Budget and Economic ProjectionsCBO’s Updated Budget and Economic Projections
CBO’s Updated Budget and Economic Projections
 
Annie Williams Real Estate Report - March 2021
Annie Williams Real Estate Report - March 2021Annie Williams Real Estate Report - March 2021
Annie Williams Real Estate Report - March 2021
 
The Budget and Economic Outlook
The Budget and Economic OutlookThe Budget and Economic Outlook
The Budget and Economic Outlook
 
The end of low pay? Charting the future of the minimum wage
The end of low pay? Charting the future of the minimum wageThe end of low pay? Charting the future of the minimum wage
The end of low pay? Charting the future of the minimum wage
 
The economic impact of COVID-19
The economic impact of COVID-19The economic impact of COVID-19
The economic impact of COVID-19
 
What to Expect from Real Estate in 2018
What to Expect from Real Estate in 2018What to Expect from Real Estate in 2018
What to Expect from Real Estate in 2018
 
Paying for a fairer Britain – Labour’s tax policy
Paying for a fairer Britain – Labour’s tax policyPaying for a fairer Britain – Labour’s tax policy
Paying for a fairer Britain – Labour’s tax policy
 
Tax and welfare policy: indexation and benchmarks for distributional impact
Tax and welfare policy: indexation and benchmarks for distributional impactTax and welfare policy: indexation and benchmarks for distributional impact
Tax and welfare policy: indexation and benchmarks for distributional impact
 
Covid-compressed incomes? The past, present and future of crisis-hit living s...
Covid-compressed incomes? The past, present and future of crisis-hit living s...Covid-compressed incomes? The past, present and future of crisis-hit living s...
Covid-compressed incomes? The past, present and future of crisis-hit living s...
 
An Overview of the 2021 Long-Term Budget Outlook
An Overview of the 2021 Long-Term Budget OutlookAn Overview of the 2021 Long-Term Budget Outlook
An Overview of the 2021 Long-Term Budget Outlook
 
A lifetime of living standards: Launch of the Intergenerational Centre and in...
A lifetime of living standards: Launch of the Intergenerational Centre and in...A lifetime of living standards: Launch of the Intergenerational Centre and in...
A lifetime of living standards: Launch of the Intergenerational Centre and in...
 
An Overview of the 2021 Long-Term Budget Outlook
An Overview of the 2021 Long-Term Budget OutlookAn Overview of the 2021 Long-Term Budget Outlook
An Overview of the 2021 Long-Term Budget Outlook
 
The congressional budget office's 2012 long term budget outlook
The congressional budget office's 2012 long term budget outlookThe congressional budget office's 2012 long term budget outlook
The congressional budget office's 2012 long term budget outlook
 
REBGV Statistics package July 2020
REBGV Statistics package July 2020REBGV Statistics package July 2020
REBGV Statistics package July 2020
 
Revenue Neutral Carbon Tax
Revenue Neutral Carbon TaxRevenue Neutral Carbon Tax
Revenue Neutral Carbon Tax
 
Senate President Cullerton Taxpayers Federation Slideshow
Senate President Cullerton Taxpayers Federation SlideshowSenate President Cullerton Taxpayers Federation Slideshow
Senate President Cullerton Taxpayers Federation Slideshow
 
RICS UK Economy and Property Market Chart Book - December 2015
RICS UK Economy and Property Market Chart Book - December 2015RICS UK Economy and Property Market Chart Book - December 2015
RICS UK Economy and Property Market Chart Book - December 2015
 
TPN_Rental Monitor_Q2 2017
TPN_Rental Monitor_Q2 2017TPN_Rental Monitor_Q2 2017
TPN_Rental Monitor_Q2 2017
 

Similar to FNB_Property Insights

FNB_Property Barometer - September
FNB_Property Barometer - SeptemberFNB_Property Barometer - September
FNB_Property Barometer - SeptemberBerty Van Staaden
 
Lightstone residential property indices april 2018
Lightstone residential property indices april 2018Lightstone residential property indices april 2018
Lightstone residential property indices april 2018Berty Van Staaden
 
Annual report on sf county housing market
Annual report on sf county housing marketAnnual report on sf county housing market
Annual report on sf county housing marketRonny Budiutama
 
Lightstone_ Residential Property Indices_January 2018
Lightstone_ Residential Property Indices_January 2018Lightstone_ Residential Property Indices_January 2018
Lightstone_ Residential Property Indices_January 2018Berty Van Staaden
 
Lightstone House Price Index_August 2019
Lightstone House Price Index_August 2019Lightstone House Price Index_August 2019
Lightstone House Price Index_August 2019Berty Van Staaden
 
Residential Property Indices_Lightstone_Sept 2017
Residential Property Indices_Lightstone_Sept 2017Residential Property Indices_Lightstone_Sept 2017
Residential Property Indices_Lightstone_Sept 2017Berty Van Staaden
 
Lightstone_Residential Property Indices_July 2019
Lightstone_Residential Property Indices_July 2019Lightstone_Residential Property Indices_July 2019
Lightstone_Residential Property Indices_July 2019Berty Van Staaden
 
Lightstone_Residential Property Indices_January 2019
Lightstone_Residential Property Indices_January 2019Lightstone_Residential Property Indices_January 2019
Lightstone_Residential Property Indices_January 2019Berty Van Staaden
 
FNB_Property Insights_Retail Property's Consumer Challenges
FNB_Property Insights_Retail Property's Consumer ChallengesFNB_Property Insights_Retail Property's Consumer Challenges
FNB_Property Insights_Retail Property's Consumer ChallengesBerty Van Staaden
 
Lightstone_Residential Property Indices_July 2018
Lightstone_Residential Property Indices_July 2018Lightstone_Residential Property Indices_July 2018
Lightstone_Residential Property Indices_July 2018Berty Van Staaden
 
Lightstone_Residential Property Indices
Lightstone_Residential Property IndicesLightstone_Residential Property Indices
Lightstone_Residential Property IndicesBerty Van Staaden
 
Lightstone_Residential Property Indices May 2019
Lightstone_Residential Property Indices May 2019Lightstone_Residential Property Indices May 2019
Lightstone_Residential Property Indices May 2019Berty Van Staaden
 
Lightstone_Residential Property Indices
Lightstone_Residential Property IndicesLightstone_Residential Property Indices
Lightstone_Residential Property IndicesBerty Van Staaden
 
Today’s Economic Landscape and What’s on the Other Side
Today’s Economic Landscape and What’s on the Other SideToday’s Economic Landscape and What’s on the Other Side
Today’s Economic Landscape and What’s on the Other SideSavannah Whaley
 
The Economy: Getting Through the Recession
The Economy: Getting Through the RecessionThe Economy: Getting Through the Recession
The Economy: Getting Through the RecessionSavannah Whaley
 
Economic Forecast - Summer 2014 NCLGBA Conference
Economic Forecast - Summer 2014 NCLGBA ConferenceEconomic Forecast - Summer 2014 NCLGBA Conference
Economic Forecast - Summer 2014 NCLGBA ConferencePublicFinanceTV
 
San francisco market focus 2018 overview
San francisco market focus 2018 overviewSan francisco market focus 2018 overview
San francisco market focus 2018 overviewRonny Budiutama
 
Case-Shiller Report Slowing Price Increases - Real Estate Report October/Nove...
Case-Shiller Report Slowing Price Increases - Real Estate Report October/Nove...Case-Shiller Report Slowing Price Increases - Real Estate Report October/Nove...
Case-Shiller Report Slowing Price Increases - Real Estate Report October/Nove...AMSI, San Francisco
 
Lightstone Residential Property Indices_December 2017
Lightstone Residential Property Indices_December 2017Lightstone Residential Property Indices_December 2017
Lightstone Residential Property Indices_December 2017Berty Van Staaden
 

Similar to FNB_Property Insights (20)

FNB_Property Barometer - September
FNB_Property Barometer - SeptemberFNB_Property Barometer - September
FNB_Property Barometer - September
 
Lightstone residential property indices april 2018
Lightstone residential property indices april 2018Lightstone residential property indices april 2018
Lightstone residential property indices april 2018
 
Annual report on sf county housing market
Annual report on sf county housing marketAnnual report on sf county housing market
Annual report on sf county housing market
 
Lightstone_ Residential Property Indices_January 2018
Lightstone_ Residential Property Indices_January 2018Lightstone_ Residential Property Indices_January 2018
Lightstone_ Residential Property Indices_January 2018
 
Lightstone House Price Index_August 2019
Lightstone House Price Index_August 2019Lightstone House Price Index_August 2019
Lightstone House Price Index_August 2019
 
Residential Property Indices_Lightstone_Sept 2017
Residential Property Indices_Lightstone_Sept 2017Residential Property Indices_Lightstone_Sept 2017
Residential Property Indices_Lightstone_Sept 2017
 
Lightstone_Residential Property Indices_July 2019
Lightstone_Residential Property Indices_July 2019Lightstone_Residential Property Indices_July 2019
Lightstone_Residential Property Indices_July 2019
 
Lightstone_Residential Property Indices_January 2019
Lightstone_Residential Property Indices_January 2019Lightstone_Residential Property Indices_January 2019
Lightstone_Residential Property Indices_January 2019
 
FNB_Property Insights_Retail Property's Consumer Challenges
FNB_Property Insights_Retail Property's Consumer ChallengesFNB_Property Insights_Retail Property's Consumer Challenges
FNB_Property Insights_Retail Property's Consumer Challenges
 
Economic Presentation
Economic PresentationEconomic Presentation
Economic Presentation
 
Lightstone_Residential Property Indices_July 2018
Lightstone_Residential Property Indices_July 2018Lightstone_Residential Property Indices_July 2018
Lightstone_Residential Property Indices_July 2018
 
Lightstone_Residential Property Indices
Lightstone_Residential Property IndicesLightstone_Residential Property Indices
Lightstone_Residential Property Indices
 
Lightstone_Residential Property Indices May 2019
Lightstone_Residential Property Indices May 2019Lightstone_Residential Property Indices May 2019
Lightstone_Residential Property Indices May 2019
 
Lightstone_Residential Property Indices
Lightstone_Residential Property IndicesLightstone_Residential Property Indices
Lightstone_Residential Property Indices
 
Today’s Economic Landscape and What’s on the Other Side
Today’s Economic Landscape and What’s on the Other SideToday’s Economic Landscape and What’s on the Other Side
Today’s Economic Landscape and What’s on the Other Side
 
The Economy: Getting Through the Recession
The Economy: Getting Through the RecessionThe Economy: Getting Through the Recession
The Economy: Getting Through the Recession
 
Economic Forecast - Summer 2014 NCLGBA Conference
Economic Forecast - Summer 2014 NCLGBA ConferenceEconomic Forecast - Summer 2014 NCLGBA Conference
Economic Forecast - Summer 2014 NCLGBA Conference
 
San francisco market focus 2018 overview
San francisco market focus 2018 overviewSan francisco market focus 2018 overview
San francisco market focus 2018 overview
 
Case-Shiller Report Slowing Price Increases - Real Estate Report October/Nove...
Case-Shiller Report Slowing Price Increases - Real Estate Report October/Nove...Case-Shiller Report Slowing Price Increases - Real Estate Report October/Nove...
Case-Shiller Report Slowing Price Increases - Real Estate Report October/Nove...
 
Lightstone Residential Property Indices_December 2017
Lightstone Residential Property Indices_December 2017Lightstone Residential Property Indices_December 2017
Lightstone Residential Property Indices_December 2017
 

More from Berty Van Staaden

FNB_Gauteng House Price Index
FNB_Gauteng House Price IndexFNB_Gauteng House Price Index
FNB_Gauteng House Price IndexBerty Van Staaden
 
FNB Property Insights SARB Leading Indicator_August 2019
FNB Property Insights SARB Leading Indicator_August 2019FNB Property Insights SARB Leading Indicator_August 2019
FNB Property Insights SARB Leading Indicator_August 2019Berty Van Staaden
 
PayProp Rental Index Q2 2019
PayProp Rental Index Q2 2019PayProp Rental Index Q2 2019
PayProp Rental Index Q2 2019Berty Van Staaden
 
FNB Residential Building Stats_Q2 2019
FNB Residential Building Stats_Q2 2019FNB Residential Building Stats_Q2 2019
FNB Residential Building Stats_Q2 2019Berty Van Staaden
 
FNB Property Insights August 2019
FNB Property Insights August 2019FNB Property Insights August 2019
FNB Property Insights August 2019Berty Van Staaden
 
FNB Property Barometer (CPTt)_Aug 2019
FNB Property Barometer (CPTt)_Aug 2019FNB Property Barometer (CPTt)_Aug 2019
FNB Property Barometer (CPTt)_Aug 2019Berty Van Staaden
 
FNB Market Activity Ratings_July 2019
FNB Market Activity Ratings_July 2019FNB Market Activity Ratings_July 2019
FNB Market Activity Ratings_July 2019Berty Van Staaden
 
FNB May Building Statistics (Jul 2019)
FNB May Building Statistics (Jul 2019)FNB May Building Statistics (Jul 2019)
FNB May Building Statistics (Jul 2019)Berty Van Staaden
 
FNB Estate Agents Survey_Buy-to-Let
FNB Estate Agents Survey_Buy-to-LetFNB Estate Agents Survey_Buy-to-Let
FNB Estate Agents Survey_Buy-to-LetBerty Van Staaden
 
FNB Estate Agents Survey_Net Foreign Effect
FNB Estate Agents Survey_Net Foreign EffectFNB Estate Agents Survey_Net Foreign Effect
FNB Estate Agents Survey_Net Foreign EffectBerty Van Staaden
 
PayProp Rental Index Q 1 2019
PayProp Rental Index Q 1 2019PayProp Rental Index Q 1 2019
PayProp Rental Index Q 1 2019Berty Van Staaden
 
FNB Residential Property Barometer_February 2019
FNB Residential Property Barometer_February 2019FNB Residential Property Barometer_February 2019
FNB Residential Property Barometer_February 2019Berty Van Staaden
 
Lightstone Property Forecast for 2019
Lightstone Property Forecast for 2019Lightstone Property Forecast for 2019
Lightstone Property Forecast for 2019Berty Van Staaden
 
PayProp Rental Index_Q3 2018
PayProp Rental Index_Q3 2018PayProp Rental Index_Q3 2018
PayProp Rental Index_Q3 2018Berty Van Staaden
 
PayProp Rental Index_Q2 2018
PayProp Rental Index_Q2 2018PayProp Rental Index_Q2 2018
PayProp Rental Index_Q2 2018Berty Van Staaden
 
ABSA_Credit and Mortgage Advances
ABSA_Credit and Mortgage Advances ABSA_Credit and Mortgage Advances
ABSA_Credit and Mortgage Advances Berty Van Staaden
 

More from Berty Van Staaden (20)

FNB_Gauteng House Price Index
FNB_Gauteng House Price IndexFNB_Gauteng House Price Index
FNB_Gauteng House Price Index
 
FNB Property Insights SARB Leading Indicator_August 2019
FNB Property Insights SARB Leading Indicator_August 2019FNB Property Insights SARB Leading Indicator_August 2019
FNB Property Insights SARB Leading Indicator_August 2019
 
PayProp Rental Index Q2 2019
PayProp Rental Index Q2 2019PayProp Rental Index Q2 2019
PayProp Rental Index Q2 2019
 
FNB Residential Building Stats_Q2 2019
FNB Residential Building Stats_Q2 2019FNB Residential Building Stats_Q2 2019
FNB Residential Building Stats_Q2 2019
 
FNB Property Insights August 2019
FNB Property Insights August 2019FNB Property Insights August 2019
FNB Property Insights August 2019
 
FNB Property Barometer (CPTt)_Aug 2019
FNB Property Barometer (CPTt)_Aug 2019FNB Property Barometer (CPTt)_Aug 2019
FNB Property Barometer (CPTt)_Aug 2019
 
FNB_Rental Market
FNB_Rental MarketFNB_Rental Market
FNB_Rental Market
 
FNB Market Activity Ratings_July 2019
FNB Market Activity Ratings_July 2019FNB Market Activity Ratings_July 2019
FNB Market Activity Ratings_July 2019
 
FNB May Building Statistics (Jul 2019)
FNB May Building Statistics (Jul 2019)FNB May Building Statistics (Jul 2019)
FNB May Building Statistics (Jul 2019)
 
FNB Estate Agents Survey_Buy-to-Let
FNB Estate Agents Survey_Buy-to-LetFNB Estate Agents Survey_Buy-to-Let
FNB Estate Agents Survey_Buy-to-Let
 
FNB Estate Agents Survey_Net Foreign Effect
FNB Estate Agents Survey_Net Foreign EffectFNB Estate Agents Survey_Net Foreign Effect
FNB Estate Agents Survey_Net Foreign Effect
 
PayProp Rental Index Q 1 2019
PayProp Rental Index Q 1 2019PayProp Rental Index Q 1 2019
PayProp Rental Index Q 1 2019
 
FNB Residential Property Barometer_February 2019
FNB Residential Property Barometer_February 2019FNB Residential Property Barometer_February 2019
FNB Residential Property Barometer_February 2019
 
Lightstone Property Forecast for 2019
Lightstone Property Forecast for 2019Lightstone Property Forecast for 2019
Lightstone Property Forecast for 2019
 
TPN_Vacancy Survey_Q3 2018
TPN_Vacancy Survey_Q3 2018TPN_Vacancy Survey_Q3 2018
TPN_Vacancy Survey_Q3 2018
 
FNB_SARB Leading Indicator
FNB_SARB Leading IndicatorFNB_SARB Leading Indicator
FNB_SARB Leading Indicator
 
FNB_Western Cape
FNB_Western CapeFNB_Western Cape
FNB_Western Cape
 
PayProp Rental Index_Q3 2018
PayProp Rental Index_Q3 2018PayProp Rental Index_Q3 2018
PayProp Rental Index_Q3 2018
 
PayProp Rental Index_Q2 2018
PayProp Rental Index_Q2 2018PayProp Rental Index_Q2 2018
PayProp Rental Index_Q2 2018
 
ABSA_Credit and Mortgage Advances
ABSA_Credit and Mortgage Advances ABSA_Credit and Mortgage Advances
ABSA_Credit and Mortgage Advances
 

Recently uploaded

Call Girls in Kashmiri Gate Delhi 💯Call Us 🔝8264348440🔝
Call Girls in Kashmiri Gate Delhi 💯Call Us 🔝8264348440🔝Call Girls in Kashmiri Gate Delhi 💯Call Us 🔝8264348440🔝
Call Girls in Kashmiri Gate Delhi 💯Call Us 🔝8264348440🔝soniya singh
 
Building Dreams: Newman Leech's Visionary Approach to Real Estate Investment
Building Dreams: Newman Leech's Visionary Approach to Real Estate InvestmentBuilding Dreams: Newman Leech's Visionary Approach to Real Estate Investment
Building Dreams: Newman Leech's Visionary Approach to Real Estate InvestmentNewman George Leech
 
Omaxe Dwarka In Delhi E Brochure Pdf
Omaxe Dwarka In Delhi E Brochure     PdfOmaxe Dwarka In Delhi E Brochure     Pdf
Omaxe Dwarka In Delhi E Brochure Pdfashiyadav24
 
SSPL The Strand Abodes Kharadi Pune Brochure.pdf
SSPL The Strand Abodes Kharadi Pune Brochure.pdfSSPL The Strand Abodes Kharadi Pune Brochure.pdf
SSPL The Strand Abodes Kharadi Pune Brochure.pdfabbu831446
 
Call Girls in Model Town Delhi 💯Call Us 🔝8264348440🔝
Call Girls in Model Town Delhi 💯Call Us 🔝8264348440🔝Call Girls in Model Town Delhi 💯Call Us 🔝8264348440🔝
Call Girls in Model Town Delhi 💯Call Us 🔝8264348440🔝soniya singh
 
Call Girls in Sarai Kale Khan Delhi 💯Call Us 🔝8264348440🔝
Call Girls in Sarai Kale Khan Delhi 💯Call Us 🔝8264348440🔝Call Girls in Sarai Kale Khan Delhi 💯Call Us 🔝8264348440🔝
Call Girls in Sarai Kale Khan Delhi 💯Call Us 🔝8264348440🔝soniya singh
 
Call Girls in Pitampura Delhi 💯Call Us 🔝8264348440🔝
Call Girls in Pitampura Delhi 💯Call Us 🔝8264348440🔝Call Girls in Pitampura Delhi 💯Call Us 🔝8264348440🔝
Call Girls in Pitampura Delhi 💯Call Us 🔝8264348440🔝soniya singh
 
call girls in Shahdara (DELHI) 🔝 >༒9953330565🔝 genuine Escort Service 🔝✔️✔️
call girls in Shahdara (DELHI) 🔝 >༒9953330565🔝 genuine Escort Service 🔝✔️✔️call girls in Shahdara (DELHI) 🔝 >༒9953330565🔝 genuine Escort Service 🔝✔️✔️
call girls in Shahdara (DELHI) 🔝 >༒9953330565🔝 genuine Escort Service 🔝✔️✔️9953056974 Low Rate Call Girls In Saket, Delhi NCR
 
The Omaxe State Dwarka Delhi-broucher.pdf.pdf
The Omaxe State Dwarka Delhi-broucher.pdf.pdfThe Omaxe State Dwarka Delhi-broucher.pdf.pdf
The Omaxe State Dwarka Delhi-broucher.pdf.pdfkratirudram
 
Low Rate Call Girls in Tughlakabad Delhi Call 9990771857
Low Rate Call Girls in Tughlakabad Delhi Call 9990771857Low Rate Call Girls in Tughlakabad Delhi Call 9990771857
Low Rate Call Girls in Tughlakabad Delhi Call 9990771857delhimodel235
 
Call Girls in Nehru Place Delhi 💯Call Us 🔝8264348440🔝
Call Girls in Nehru Place Delhi 💯Call Us 🔝8264348440🔝Call Girls in Nehru Place Delhi 💯Call Us 🔝8264348440🔝
Call Girls in Nehru Place Delhi 💯Call Us 🔝8264348440🔝soniya singh
 
Low Rate Call Girls In Madipur Slum Quarter +91)8447779280Low Rate 2 short 2...
Low Rate Call Girls In Madipur Slum Quarter  +91)8447779280Low Rate 2 short 2...Low Rate Call Girls In Madipur Slum Quarter  +91)8447779280Low Rate 2 short 2...
Low Rate Call Girls In Madipur Slum Quarter +91)8447779280Low Rate 2 short 2...asmaqueen5
 
SVN Live 4.22.24 Weekly Property Broadcast
SVN Live 4.22.24 Weekly Property BroadcastSVN Live 4.22.24 Weekly Property Broadcast
SVN Live 4.22.24 Weekly Property BroadcastSVN International Corp.
 
9990771857 Call Girls in Noida Sector 06 Noida (Call Girls) Delhi
9990771857 Call Girls in Noida Sector 06 Noida (Call Girls) Delhi9990771857 Call Girls in Noida Sector 06 Noida (Call Girls) Delhi
9990771857 Call Girls in Noida Sector 06 Noida (Call Girls) Delhidelhimodel235
 
Call Girls In Hari Nagar Dadb Block {8447779280}Hari Nagar {West Delhi Escort...
Call Girls In Hari Nagar Dadb Block {8447779280}Hari Nagar {West Delhi Escort...Call Girls In Hari Nagar Dadb Block {8447779280}Hari Nagar {West Delhi Escort...
Call Girls In Hari Nagar Dadb Block {8447779280}Hari Nagar {West Delhi Escort...asmaqueen5
 
Purva Palm Hills Devanahalli, Bangalore E- Brochure.pdf
Purva Palm Hills Devanahalli, Bangalore E- Brochure.pdfPurva Palm Hills Devanahalli, Bangalore E- Brochure.pdf
Purva Palm Hills Devanahalli, Bangalore E- Brochure.pdffaheemali990101
 
83770-87607 ۞Call Girls In Near The Park Hotel (Cp) Delhi
83770-87607 ۞Call Girls In Near The Park Hotel (Cp) Delhi83770-87607 ۞Call Girls In Near The Park Hotel (Cp) Delhi
83770-87607 ۞Call Girls In Near The Park Hotel (Cp) Delhidollysharma2066
 
9711199012 Call {Girls Delhi} Very Low rate Vaishali DownLoad PDF
9711199012 Call {Girls Delhi} Very Low rate Vaishali DownLoad PDF9711199012 Call {Girls Delhi} Very Low rate Vaishali DownLoad PDF
9711199012 Call {Girls Delhi} Very Low rate Vaishali DownLoad PDFMs Riya
 
9990771857 Call Girls in Noida Sector 11 Noida (Call Girls) Delhi
9990771857 Call Girls in Noida Sector 11 Noida (Call Girls) Delhi9990771857 Call Girls in Noida Sector 11 Noida (Call Girls) Delhi
9990771857 Call Girls in Noida Sector 11 Noida (Call Girls) Delhidelhimodel235
 

Recently uploaded (20)

Call Girls in Kashmiri Gate Delhi 💯Call Us 🔝8264348440🔝
Call Girls in Kashmiri Gate Delhi 💯Call Us 🔝8264348440🔝Call Girls in Kashmiri Gate Delhi 💯Call Us 🔝8264348440🔝
Call Girls in Kashmiri Gate Delhi 💯Call Us 🔝8264348440🔝
 
Building Dreams: Newman Leech's Visionary Approach to Real Estate Investment
Building Dreams: Newman Leech's Visionary Approach to Real Estate InvestmentBuilding Dreams: Newman Leech's Visionary Approach to Real Estate Investment
Building Dreams: Newman Leech's Visionary Approach to Real Estate Investment
 
Omaxe Dwarka In Delhi E Brochure Pdf
Omaxe Dwarka In Delhi E Brochure     PdfOmaxe Dwarka In Delhi E Brochure     Pdf
Omaxe Dwarka In Delhi E Brochure Pdf
 
SSPL The Strand Abodes Kharadi Pune Brochure.pdf
SSPL The Strand Abodes Kharadi Pune Brochure.pdfSSPL The Strand Abodes Kharadi Pune Brochure.pdf
SSPL The Strand Abodes Kharadi Pune Brochure.pdf
 
Call Girls in Model Town Delhi 💯Call Us 🔝8264348440🔝
Call Girls in Model Town Delhi 💯Call Us 🔝8264348440🔝Call Girls in Model Town Delhi 💯Call Us 🔝8264348440🔝
Call Girls in Model Town Delhi 💯Call Us 🔝8264348440🔝
 
Call Girls in Sarai Kale Khan Delhi 💯Call Us 🔝8264348440🔝
Call Girls in Sarai Kale Khan Delhi 💯Call Us 🔝8264348440🔝Call Girls in Sarai Kale Khan Delhi 💯Call Us 🔝8264348440🔝
Call Girls in Sarai Kale Khan Delhi 💯Call Us 🔝8264348440🔝
 
Call Girls in Pitampura Delhi 💯Call Us 🔝8264348440🔝
Call Girls in Pitampura Delhi 💯Call Us 🔝8264348440🔝Call Girls in Pitampura Delhi 💯Call Us 🔝8264348440🔝
Call Girls in Pitampura Delhi 💯Call Us 🔝8264348440🔝
 
call girls in Shahdara (DELHI) 🔝 >༒9953330565🔝 genuine Escort Service 🔝✔️✔️
call girls in Shahdara (DELHI) 🔝 >༒9953330565🔝 genuine Escort Service 🔝✔️✔️call girls in Shahdara (DELHI) 🔝 >༒9953330565🔝 genuine Escort Service 🔝✔️✔️
call girls in Shahdara (DELHI) 🔝 >༒9953330565🔝 genuine Escort Service 🔝✔️✔️
 
The Omaxe State Dwarka Delhi-broucher.pdf.pdf
The Omaxe State Dwarka Delhi-broucher.pdf.pdfThe Omaxe State Dwarka Delhi-broucher.pdf.pdf
The Omaxe State Dwarka Delhi-broucher.pdf.pdf
 
Low Rate Call Girls in Tughlakabad Delhi Call 9990771857
Low Rate Call Girls in Tughlakabad Delhi Call 9990771857Low Rate Call Girls in Tughlakabad Delhi Call 9990771857
Low Rate Call Girls in Tughlakabad Delhi Call 9990771857
 
Call Girls in Nehru Place Delhi 💯Call Us 🔝8264348440🔝
Call Girls in Nehru Place Delhi 💯Call Us 🔝8264348440🔝Call Girls in Nehru Place Delhi 💯Call Us 🔝8264348440🔝
Call Girls in Nehru Place Delhi 💯Call Us 🔝8264348440🔝
 
Low Rate Call Girls In Madipur Slum Quarter +91)8447779280Low Rate 2 short 2...
Low Rate Call Girls In Madipur Slum Quarter  +91)8447779280Low Rate 2 short 2...Low Rate Call Girls In Madipur Slum Quarter  +91)8447779280Low Rate 2 short 2...
Low Rate Call Girls In Madipur Slum Quarter +91)8447779280Low Rate 2 short 2...
 
SVN Live 4.22.24 Weekly Property Broadcast
SVN Live 4.22.24 Weekly Property BroadcastSVN Live 4.22.24 Weekly Property Broadcast
SVN Live 4.22.24 Weekly Property Broadcast
 
9990771857 Call Girls in Noida Sector 06 Noida (Call Girls) Delhi
9990771857 Call Girls in Noida Sector 06 Noida (Call Girls) Delhi9990771857 Call Girls in Noida Sector 06 Noida (Call Girls) Delhi
9990771857 Call Girls in Noida Sector 06 Noida (Call Girls) Delhi
 
Call Girls In Hari Nagar Dadb Block {8447779280}Hari Nagar {West Delhi Escort...
Call Girls In Hari Nagar Dadb Block {8447779280}Hari Nagar {West Delhi Escort...Call Girls In Hari Nagar Dadb Block {8447779280}Hari Nagar {West Delhi Escort...
Call Girls In Hari Nagar Dadb Block {8447779280}Hari Nagar {West Delhi Escort...
 
Purva Palm Hills Devanahalli, Bangalore E- Brochure.pdf
Purva Palm Hills Devanahalli, Bangalore E- Brochure.pdfPurva Palm Hills Devanahalli, Bangalore E- Brochure.pdf
Purva Palm Hills Devanahalli, Bangalore E- Brochure.pdf
 
83770-87607 ۞Call Girls In Near The Park Hotel (Cp) Delhi
83770-87607 ۞Call Girls In Near The Park Hotel (Cp) Delhi83770-87607 ۞Call Girls In Near The Park Hotel (Cp) Delhi
83770-87607 ۞Call Girls In Near The Park Hotel (Cp) Delhi
 
9711199012 Call {Girls Delhi} Very Low rate Vaishali DownLoad PDF
9711199012 Call {Girls Delhi} Very Low rate Vaishali DownLoad PDF9711199012 Call {Girls Delhi} Very Low rate Vaishali DownLoad PDF
9711199012 Call {Girls Delhi} Very Low rate Vaishali DownLoad PDF
 
9990771857 Call Girls in Noida Sector 11 Noida (Call Girls) Delhi
9990771857 Call Girls in Noida Sector 11 Noida (Call Girls) Delhi9990771857 Call Girls in Noida Sector 11 Noida (Call Girls) Delhi
9990771857 Call Girls in Noida Sector 11 Noida (Call Girls) Delhi
 
Low Rate Call Girls in Triveni Complex Delhi Call 9873940964
Low Rate Call Girls in Triveni Complex Delhi Call 9873940964Low Rate Call Girls in Triveni Complex Delhi Call 9873940964
Low Rate Call Girls in Triveni Complex Delhi Call 9873940964
 

FNB_Property Insights

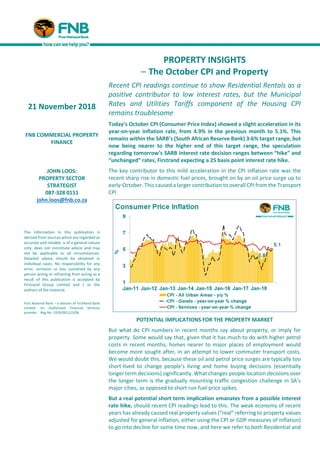
  • 1. PROPERTY INSIGHTS – The October CPI and Property Recent CPI readings continue to show Residential Rentals as a positive contributor to low interest rates, but the Municipal Rates and Utilities Tariffs component of the Housing CPI remains troublesome Today’s October CPI (Consumer Price Index) showed a slight acceleration in its year-on-year inflation rate, from 4.9% in the previous month to 5.1%. This remains within the SARB’s (South African Reserve Bank) 3-6% target range, but now being nearer to the higher end of this target range, the speculation regarding tomorrow’s SARB interest rate decision ranges between “hike” and “unchanged” rates, Firstrand expecting a 25 basis point interest rate hike. The key contributor to this mild acceleration in the CPI inflation rate was the recent sharp rise in domestic fuel prices, brought on by an oil price surge up to early-October. This caused a larger contribution to overall CPI from the Transport CPI POTENTIAL IMPLICATIONS FOR THE PROPERTY MARKET But what do CPI numbers in recent months say about property, or imply for property. Some would say that, given that it has much to do with higher petrol costs in recent months, homes nearer to major places of employment would become more sought after, in an attempt to lower commuter transport costs. We would doubt this, because these oil and petrol price surges are typically too short-lived to change people’s living and home buying decisions (essentially longer term decisions) significantly. What changes people location decisions over the longer term is the gradually mounting traffic congestion challenge in SA’s major cities, as opposed to short run fuel price spikes. But a real potential short term implication emanates from a possible interest rate hike, should recent CPI readings lead to this. The weak economy of recent years has already caused real property values (“real” referring to property values adjusted for general inflation, either using the CPI or GDP measures of inflation) to go into decline for some time now, and here we refer to both Residential and 21 November 2018 FNB COMMERCIAL PROPERTY FINANCE JOHN LOOS: PROPERTY SECTOR STRATEGIST 087-328 0151 john.loos@fnb.co.za The information in this publication is derived from sources which are regarded as accurate and reliable, is of a general nature only, does not constitute advice and may not be applicable to all circumstances. Detailed advice should be obtained in individual cases. No responsibility for any error, omission or loss sustained by any person acting or refraining from acting as a result of this publication is accepted by Firstrand Group Limited and / or the authors of the material. First National Bank – a division of FirstRand Bank Limited. An Authorised Financial Services provider. Reg No. 1929/001225/06
  • 2. Commercial Property. Should the October CPI reading lead to a rate hike, we would expect property demand to remain weak in this economic environment, and for real property values to remain in decline. WHAT THE CPI SAYS ABOUT THE PROPERTY MARKET – RENTAL MARKET WEAKNESS, BAD FOR LANDLORDS BUT GOOD FOR INTEREST RATES The Property Market itself is a key positive contributor in terms of keeping CPI inflation within the 3-6% target range. And here we refer specifically to the Residential Rental part of the Property Market. The Actual Rental and Owner Equivalent Housing Rental CPI Sub-Indices carry a large weighting of 16.84% of the total CPI together. This is almost as big as the Food and Non-Alcoholic Beverages CPI’s weighting of 17.24%, and a weak Residential Rental Market in recent times has contributed to the low CPI/low interest rate cause. The CPI for Actual Rentals showed inflation of 4.03% (last surveyed in September CPI), having slowed in recent surveys, and the Owner Equivalent Rental CPI an even slower 3.66%. UTILITIES TARIFFS AND MUNICIPAL RATES REMAIN TROUBLESOME However, the overall Housing CPI inflation rate remains mildly “troublesome” for the Overall CPI inflation rate, recording an October rate of 5.2% due to ongoing strong inflation in Municipal Rates and Utilities Tariffs, which are components of the Housing CPI, being costs directly related to owning or renting a house. Municipal Rates and Non-Electricity Utilities Tariffs (“Water and Other Services” CPI) are most troublesome, recording year-on-year inflation of 11.1%. The CPI for Electricity and Other Fuels showed 7.73% year-on-year inflation, also well above overall CPI inflation. By comparison, the CPI for Home Maintenance is better behaved at 3.1% year-on-year. It is possible that this latter CPI component reflects the Home Maintenance Industry being partly “crowded out” by ongoing sharp cost increases for homeowners emanating from Municipal Rates and Tariffs. The long term trend of Municipal Rates and Tariffs inflation far outstripping general inflation raises the affordability challenges for tenants and owners, incentivizing a shift to alternative sources of power to Eskom, while also incentivizing better use of property/space. SMALLER IS BETTER IN THE HOUSING RENTAL MARKET So finally, perhaps not surprising is that the CPI figures also point to “smaller being better” in terms of home rentals, the Flat Rental and Townhouse Rental CPIs continuing to outperform the “Houses” CPI, the latter being on average the largest category and the most costly to run. The Flats Rental CPI inflated by 4.7% year-on-year in October, The Townhouses CPI by a similar 4.8%, and the House CPI by a noticeably lesser 3.5%. Since January 2008, just over a decade, the Flats CPI has inflated cumulatively by 90%, Townhouses by 75.9% and Houses by 62.6%.
  • 3. May-18 Jun-18 Jul-18 Aug-18 Sep-18 Oct-18 Key CPI Inflation Measures CPI - All Urban Areas 107.2 107.6 108.5 108.4 108.9 109.4 Y-o-Y % Change 4.4 4.6 5.1 4.9 4.9 5.1 CPI - All Goods 106.0 106.5 107.5 107.4 107.6 108.6 Y-o-Y % Change 3.5 4.2 5.3 5.0 4.8 5.1 CPI - All Services 108.4 108.7 109.4 109.4 110.2 110.2 Y-o-Y % Change 5.3 4.9 5.0 5.0 5.2 5.1 May-18 Jun-18 Jul-18 Aug-18 Sep-18 Oct-18 Key CPI Housing and Related Measures CPI - Housing and Utilities 105.7 106.0 108.4 108.5 109.4 109.4 Y-o-Y % Change 4.8 4.1 5.2 5.3 5.29 5.19 CPI - Actual housing rentals 106.4 106.9 106.9 106.9 108.4 108.4 Y-o-Y % Change 5.1 4.2 4.2 4.2 4.03 4.03 - Houses 105.9 106.1 106.1 106.1 107.5 107.5 Y-o-Y % Change 4.7 3.6 3.6 3.6 3.5 3.5 - Townhouses 107.7 107.6 107.6 107.6 109.4 109.4 Y-o-Y % Change 6.3 4.6 4.6 4.6 4.8 4.8 - Flats 107.1 108.3 108.3 108.3 109.8 109.8 Y-o-Y % Change 5.8 5.1 5.1 5.1 4.7 4.7 CPI - Owner occupied housing rentals 105.8 106.2 106.2 106.2 107.5 107.5 Y-o-Y % Change 4.6 3.7 3.7 3.7 3.66 3.66 - Houses 105.7 106.0 106.0 106.0 107.3 107.3 Y-o-Y % Change 4.5 3.5 3.5 3.5 3.5 3.5 - Townhouses 106.6 106.9 106.9 106.9 108.4 108.4 Y-o-Y % Change 5.3 4.4 4.4 4.4 4.3 4.3 - Flats 106.4 107.5 107.5 107.5 108.9 108.9 Y-o-Y % Change 5.3 4.7 4.7 4.7 4.3 4.3 CPI - Home Maintenance and Repairs 104.5 105.1 105.2 105.5 105.3 105.6 Y-o-Y % Change 2.5 2.9 2.9 3.0 3.0 3.1 CPI - Housing - Water and other services 107.9 107.9 118.9 119.1 119.1 119.1 Y-o-Y % Change 7.3 7.1 11.0 11.2 11.1 11.1 CPI - Housing - Electricity and other fuels 103.1 103.1 110.0 110.1 110.1 110.1 Y-o-Y % Change 3.1 3.1 7.7 7.8 7.8 7.7 Consumer Inflation - Key Components Consumer Inflation - Housing - Related Components
  • 4. May-18 Jun-18 Jul-18 Aug-18 Sep-18 Oct-18 Key CPI Product and Service Categories CPI - Housing and Utiilities 105.7 106.0 108.4 108.5 109.4 109.4 Y-o-Y % Change 4.8 4.1 5.2 5.3 5.3 5.2 CPI - Food and Non-Alcoholic Beverages 106.8 106.8 107.1 107.0 107.3 107.5 Y-o-Y % Change 3.4 3.4 3.4 3.5 3.9 3.4 CPI - Alcoholic Beverages and Tobacco 108.7 108.7 109.0 108.8 108.9 109.4 Y-o-Y % Change 6.2 6.0 6.0 4.6 4.2 4.2 CPI - Clothing and Footwear 102.6 102.8 102.9 103.1 103.2 103.3 Y-o-Y % Change 1.7 1.8 1.8 1.9 1.9 2.0 CPI - Household Contents and Equipment 102.9 103.9 104.0 103.8 104.5 104.4 Y-o-Y % Change 2.4 2.7 2.8 2.9 3.0 3.0 CPI - Health 110.7 110.7 110.7 111.3 111.7 111.4 Y-o-Y % Change 4.8 4.7 4.4 5.2 5.4 5.0 CPI - Transport 108.2 110.2 111.3 111.4 112.4 115.3 Y-o-Y % Change 5.0 7.3 10.0 9.5 8.7 10.5 CPI - Communication 100.3 100.1 100.0 100.0 99.8 99.8 Y-o-Y % Change 1.1 1.1 1.1 1.2 1.1 1.2 CPI - Recreation and Culture 101.9 101.3 101.3 101.2 101.2 101.3 Y-o-Y % Change 1.3 0.6 0.4 0.3 0.5 0.7 CPI - Education 114.2 114.2 114.2 114.2 114.2 114.2 Y-o-Y % Change 6.7 6.7 6.7 6.7 6.7 6.7 CPI - Restaurants and Hotels 105.3 105.0 105.4 105.6 105.9 106.1 Y-o-Y % Change 5.0 4.5 4.2 4.0 4.6 4.2 CPI - Miscellaneous 113.0 113.1 113.1 113.0 113.1 113.0 Y-o-Y % Change 6.2 6.2 5.7 5.6 5.5 5.4 Consumer Inflation - Key Product and Service Categories