Download as PDF, PPTX


![5/9
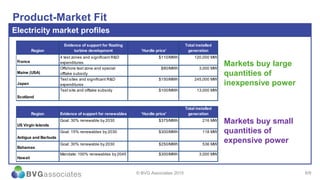
Product-Market Fit
Cost profile during scale-up
© BVG Associates 2015
$0
$100
$200
$300
$400
$500
$600
Commercial
readiness
index
Turbine
rating
(MW)
Number
of
turbines
Project
rating
(MW)
CAPEX per
MW
Annual
OPEX
per MW
Capacity
factor WACC
LCOE
low
($/MWh)
LCOE
high
($/MWh)
Minimum viable
product
2 to 7 1 2 to 7 $9 million
to $11 million
$250,000 35% 12% $ 423 $ 500
Commercial
trial
5 to 8 5 to 10 25 to 80 $7 million
to $9 million
$175,000 42% 12% $ 269 $ 333
Commercial
scale-up
5 to 8 10 to 20 50 to 160 $5.5 million
to $8 million
$125,000 48% 10% $ 157 $ 215
Multiple
commercial
applications
5 to 8 25 to 50 125 to
400
$3.5 million
to $6 million
$90,000 50% 8% $ 82 $ 127
LCOE [US$/MWh]
Progression through commercial readiness index ](https://image.slidesharecdn.com/nordstrom-steppingstonesforfloatingfoundationsr02-151016092423-lva1-app6891/85/Stepping-stones-for-floating-foundations-r02-5-320.jpg)
![7/9
$0
$100
$200
$300
$400
$500
$600
LCOE range [US$/MWh]
MVP
(<10 MW)
commercial trial
(25 to 80 MW)
commercial
scale-up
(50 to 160 MW)
multiple
commercial
(hundreds of MW
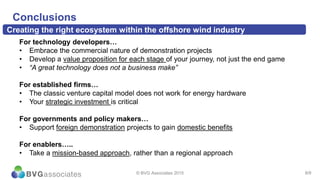
Product-Market Fit
The right product for the right market
© BVG Associates 2015
Total project up-charge in France: $100 million (6 MW)
Total project up-charge in Scotland: $400 million (30 MW)
Total project up-charge in Maine: $890 million (100 MW)
Commercially attractive in a wide range of
electricity markets (200+ MW)
Total project up-charge in US Virgin Islands: $20 million (6 MW)
Total project discount in US Virgin Islands: $160 million (30 MW)
Total project discount in Hawaii: $960 million (100 MW)](https://image.slidesharecdn.com/nordstrom-steppingstonesforfloatingfoundationsr02-151016092423-lva1-app6891/85/Stepping-stones-for-floating-foundations-r02-7-320.jpg)


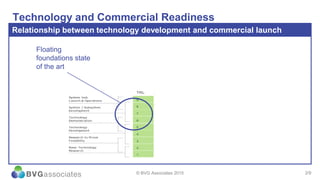
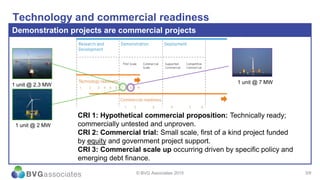
The document discusses the commercialization of floating wind turbine technologies, outlining the stages of technology readiness and market fit needed for successful deployment. It emphasizes the importance of demonstrating commercial viability through pilot projects and scaling up to larger operations while considering regional electricity market profiles and cost structures. Key takeaways include the need for strategic investment from established firms and government support to foster innovation in the offshore wind industry.


