SlideShare a Scribd company logo
1 of 86
Activity-based management Implementation Model
1
ABM Model
Systems Planning
Identify, Define, and
Classify Activities
Reduce
Costs
Improve
Decisions
Increase Profitability
ABC
1. Continuous improvement (PVA)
2. Product design (eg complexity drivers)
3. Improved decision making
4. Accurate cost info (VCA)(ABC)
a. Products (MA1)
b. Customers (eg setup drivers)
c. Suppliers
PVA
Assess Value Content of
Activities
Define Root Causes of
Each Activity
Establish Activity
Performance Measures
Search for Improvement
Opportunities
Part 1 – Week 2 Part 2 – Week 3
Assign Resource Cost to
Activities
Identify Cost Objects and
Define Activity Drivers
Calculate Activity Rates
Assign Costs to Cost
objects
Product design
Value engineering
Design
analysis
Functional
analysis
Cost Allocation Value Chain Analysis Sales Profitability AnalysisVCA-Customer linkages
1
Week 3
Cost Allocation, Customer-
Profitability Analysis, and
Sales-Variance Analysis
http://www.youtube.com/watch?v=qS7nqwGt4-I 2
3
 Cost Allocation
 Learning Objective 4: Understand criteria to guide cost-allocation decisions
 Value Chain Analysis
 VCA-Customer linkages
 Learning Objective 1: Discuss why a company’s revenues and costs differ across customers
 Learning Objective 2: Identify the importance of customer-profitability profiles
 Learning Objective 3: Understand the cost-hierarchy-based operating income statement
 Learning Objective 5: Discuss decision faced when collecting and allocating indirect costs to
customers
 Sales Profitability Analysis
 Learning Objective 6: Subdivide the sales-variance into the sales-mix variance and the sales-quantity
variance into the market share variance and the market size variance
Week 3: Learning objective summary
Cost Allocation Value Chain Analysis Sales Profitability Analysis
Activity-based management Implementation Model
5
ABM Model
Systems Planning
Identify, Define, and
Classify Activities
Reduce
Costs
Improve
Decisions
Increase Profitability
ABC
1. Continuous improvement (PVA)
2. Product design (eg complexity drivers)
3. Improved decision making
4. Accurate cost info (VCA)(ABC)
a. Products (MA1)
b. Customers (eg setup drivers)
c. Suppliers
PVA
Assess Value Content of
Activities
Define Root Causes of
Each Activity
Establish Activity
Performance Measures
Search for Improvement
Opportunities
Part 1 – Week 2 Part 2 – Week 3
Assign Resource Cost to
Activities
Identify Cost Objects and
Define Activity Drivers
Calculate Activity Rates
Assign Costs to Cost
objects
Product design
Value engineering
Design
analysis
Functional
analysis
Cost Allocation Value Chain Analysis Sales Profitability AnalysisVCA-Customer linkages
5
6
1. What is Cost Allocation?
 Assigning indirect costs to cost objects
 These costs are not traced
 Indirect costs often comprise a large percentage of Total Overall Costs
Cost Allocation Value Chain Analysis Sales Profitability AnalysisVCA-Customer linkages
Learning Objective 1:
Understand the criteria to guide cost-
allocation decisions. Identify four
purposes for allocating costs to cost
objectives
4(1&2)
7
2. What are the purposes of cost allocation?
 1
 2
 3
 4
Cost Allocation Value Chain Analysis Sales Profitability AnalysisVCA-Customer linkages
Purposes of Cost Allocation
Cost Allocation Value Chain Analysis Sales Profitability AnalysisVCA-Customer linkages
8
9
3. What are the criteria for cost allocations?
 1
 2
 3
 4
Cost Allocation Value Chain Analysis Sales Profitability AnalysisVCA-Customer linkages
10
Exercise: Criteria for Cost-allocation decisions
 Cause and Effect
 Benefits Received
 Fairness (Equity)
 Ability to Bear
Cost Allocation Value Chain Analysis Sales Profitability AnalysisVCA-Customer linkages
11
Exercise: Criteria for Cost-allocation decisions
 The basis for establishing a price satisfactory to the government and
its suppliers
 Most credible to operating managers
 costs are allocated in proportion to the cost object’s ability to bear
them
 Integral part of ABC
 Generally, larger or more profitable objects receive proportionally more
of the allocated costs
 Cost allocation here is viewed as a “reasonable” or “fair” means of
establishing selling price
 the beneficiaries of the outputs of the cost object are charged with
costs in proportion to the benefits received
 variables are identified that cause resources to be consumed
Cost Allocation Value Chain Analysis Sales Profitability AnalysisVCA-Customer linkages
12
Exercise: Criteria for Cost-allocation decisions
 Cause and Effect
 variables are identified that cause resources to be consumed
 Most credible to operating managers
 Integral part of ABC
 Benefits Received
 the beneficiaries of the outputs of the cost object are charged with costs in proportion
to the benefits received
 Fairness (Equity)
 the basis for establishing a price satisfactory to the government and its suppliers
 Cost allocation here is viewed as a “reasonable” or “fair” means of establishing selling
price
 Ability to Bear
 costs are allocated in proportion to the cost object’s ability to bear them
 Generally, larger or more profitable objects receive proportionally more of the
allocated costs
Cost Allocation Value Chain Analysis Sales Profitability AnalysisVCA-Customer linkages
Example: Cost Allocation
Cost Allocation Value Chain Analysis Sales Profitability AnalysisVCA-Customer linkages
13
14
Value Chain Analysis - Product Costing Definitions
Long-Term Pricing Decisions
Product-Mix Decisions
Life cycle product costing
Strategic Profitability Analysis
Short-Term Pricing Decisions
Product-Mix Decisions
Strategic Design Decisions
Tactical Profitability Analysis
Short-Term Pricing
Decisions
External Financial
Reporting
Production
Value-Chain Product Costs Operating Product Costs Traditional Product Costs
Production
Cost Allocation Value Chain Analysis Sales Profitability AnalysisVCA-Customer linkages
Research &
Development
Production
Marketing
Distribution
Outsourcing/suppliers
Customer service
Warranty claims
Design
Lawsuits
Learning Objective 3:
Understand the broader relevant costs
across the value chain and the
decisions impacted
(3)
15
Profit and Loss Statement
 Sales
 Cost of Goods Sold
 Begin Inventory
 Cost of Goods Manufactured
 Begin WIP
 Total Manufacturing costs
 Direct materials
 Direct labor
 Manufacturing overhead
 Ending WIP
 End Inventory
 Gross Profit on Sales
 Operating (period) expenses
 Selling
 Administration
 Financing
 Net Profit on Sales
Cost Allocation Value Chain Analysis Sales Profitability AnalysisVCA-Customer linkages
16
Customer
Profitability
Analysis
Customer
Revenue Analysis
Customer
Cost Analysis
Cost Allocation Value Chain Analysis Sales Profitability AnalysisVCA-Customer linkages
Learning Objective 1:
Discuss why a
company’s revenues
and costs differ
across customers
… revenues can differ
because of differences in
the quantity purchased
and the price discounts
while costs differ
because of different
demands placed on a
company’s resources
(P.572)
1(4)
17
Customer Profitability Analysis
 ABC/ABM product costing can be extended to customer profitability
analysis to identify the best customers
 Customer profitability analysis focuses on selling, general, and
administrative costs
 Customer profitability analysis analyzes activities, identifies proper cost
drivers, and determines realized profits from customers
Cost Allocation Value Chain Analysis Sales Profitability AnalysisVCA-Customer linkages
18
Customer Profitability Matrix
Companies do not have to target all types of customers in order to be successful. One way to think
about which customers to target is by using a customer profitability matrix.
Insert Exhibit 5.16
(Profitability Matrix)
Here
18
Cost Allocation Value Chain Analysis Sales Profitability AnalysisVCA-Customer linkages
19
Cost Allocation Value Chain Analysis Sales Profitability AnalysisVCA-Customer linkages
Managers are increasingly finding it important to:
https://www.youtube.com/watch?v=_IznwZYvrAE (Equation)
https://www.youtube.com/watch?v=EYboh3f6gsU (SAP)
The banking industry is changing and financial institutions are suffering
increasing pressures. To survive in an increasingly competitive market,
banks are forced to become more flexible, they must innovate to meet
customers' needs whose behaviors and expectations are changing.
Want to stay competitive in the eyes of your customer? How to
customize your service offerings to meet the changing needs of your
customers? By implementing a relationship-based and a la carte
pricing! Discover how a predictive analysis of your customer combined
with a flexible pricing engine allows you to set up the appropriate
service offerings and to reward customer's loyalty while maintaining
your profitability.
20
1. E.g. raise prices for “demanders” or discount to gain more volume with low
“cost-to-serve” customers
2. Identify the most profitable customers
3. Providing better services to highly profitable customers (e.g. offer the
customer profit-positives service level options)
4. Securing highly profitable customers from competitors
5. Establish a surcharge for or re-pricing of expensive activities
6. Negotiating with customers to reach mutually beneficial levels of service
7. Choose various kinds of after-sale services to provide)
8. Abandon (reduce) products, services, or customers (e.g. conceding
permanent “loss customers” to competitors
9. Introduce new products and services
10. Manage each customer’s “costs-to-serve” to a lower level (e.g. Improve
their processes)
11. select the customer mix (e.g. shift the customer’s purchase mix toward
richer, higher-margin products and service lines)
Cost Allocation Value Chain Analysis Sales Profitability AnalysisVCA-Customer linkages
Managers are increasingly finding it important to:
21
Customer Profitability Analysis – Task 1
 Customer profitability analysis allows managers to:
1. Strategic customer acquisition
2. Continuous improvement
3. Setting prices based on the cost to serve
4. Value added service management
Cost Allocation Value Chain Analysis Sales Profitability AnalysisVCA-Customer linkages
22
Customer Profitability Analysis – Task 1
 Customer profitability analysis allows managers to:
1. Strategic customer acquisition
1. Identify the most profitable customers
2. Securing highly profitable customers from competitors
3. Abandon (reduce) products, services, or customers (e.g. conceding permanent “loss customers” to
competitors
2. Continuous improvement
1. Manage each customer’s “costs-to-serve” to a lower level (e.g. Improve their processes)
3. Setting prices based on the cost to serve
1. E.g. raise prices for “demanders” or discount to gain more volume with low “cost-to-serve” customers
2. Establish a surcharge for or re-pricing of expensive activities
4. Value added service management (i.e. choose various kinds of after-sale services to provide)
1. Select the customer mix (e.g. shift the customer’s purchase mix toward richer, higher-margin products and
service lines)
2. Introduce new products and services
3. Providing better services to highly profitable customers (e.g. offer the customer profit-positives service level
options)
4. Negotiating with customers to reach mutually beneficial levels of service
Cost Allocation Value Chain Analysis Sales Profitability AnalysisVCA-Customer linkages
In practice #1: Banks - U.S. Millionaires Told
Go Away as Tax Evasion Rule Looms
 “I don’t open U.S. accounts, period,” said Su Shan Tan, head
of private banking at Singapore-based DBS, Southeast Asia’s
largest lender, who described reg attitudes toward U.S.
clients as “Draconian.”
 Bank of Singapore, the private-banking arm of Oversea-
Chinese Banking Corp. (OCBC), ranked strongest in the
world for the last two years by Bloomberg Markets magazine,
has turned away millions of dollars from Americans because
it doesn’t want to deal with the regulatory hassle, according
to Chief Executive Officer Renato de Guzman. The bank had
$32 billion under management as of the beginning of the
year.
 http://www.bloomberg.com/news/2012-05-08/u-s-millionaires-told-go-away-as-
tax-evasion-rule-looms.html 23
Cost Allocation Value Chain Analysis Sales Profitability AnalysisVCA-Customer linkages
25
Cost Allocation Value Chain Analysis Sales Profitability AnalysisVCA-Customer linkages
In practice #1: Customer stop light feedback indicators
Companies use stop lights to give instant feedback to service operators (phone operators) so as to
help them deal with the type of customer in the appropriate way.
26
In practice #2: Oops, what happened here?
Cost Allocation Value Chain Analysis Sales Profitability AnalysisVCA-Customer linkages
27
In practice #2: Customer profitability in an Insurance company
 Figure 1 occurs in virtually every customer profitability study ever done,
in which:
 15 percent to 20 percent of the customers generate 100 percent (or
more) of the profits.
 In this case,
1. the most profitable 40 percent of customers generate 130 percent of annual
profits;
2. the middle 55 percent of customers break even, and
3. the least profitable 5 percent of customers incur losses equal to 30 percent
of annual profits.
Cost Allocation Value Chain Analysis Sales Profitability AnalysisVCA-Customer linkages
28
In practice #2: Customer Profitability in an Insurance Company
Cost Allocation Value Chain Analysis Sales Profitability AnalysisVCA-Customer linkages
29
In practice #2: Customer profitability in an Insurance company –
decisions made
1. With its most profitable customers, the company worked harder to
ensure their continued loyalty and to generate more business from them.
2. For customers in the middle break-even group, it would improve its
processes to lower its cost of serving them.
3. It focused most of its attention on the 5 percent-loss customers, taking
actions to re-price services and asking them for more business in
higher-margin product lines. If the company could not transform these
customers into profitable ones by these actions, it was prepared to drop
the accounts.
Cost Allocation Value Chain Analysis Sales Profitability AnalysisVCA-Customer linkages
30
Customer
Profitability
Analysis
Customer
Revenue Analysis
Customer
Cost Analysis
Cost Allocation Value Chain Analysis Sales Profitability AnalysisVCA-Customer linkages
EXAMPLE FROM 14th edition
Example 1: Customer Profitability Analysis –
Spring Distribution Co – Retail Channel (14th ed Exb14-5)
Cost Allocation Value Chain Analysis Sales Profitability AnalysisVCA-Customer linkages
31
Example 1: Customer Profitability Analysis
Spring Distribution Co – Retail & Wholesale Channel
(14th ed Exb14-6)
Cost Allocation Value Chain Analysis Sales Profitability AnalysisVCA-Customer linkages
32
Example 1: Customer Profitability Analysis Spring
Distribution Co – Retail Channel (14th ed Exb14-7)
Cost Allocation Value Chain Analysis Sales Profitability AnalysisVCA-Customer linkages
33
Example 1: Customer Profitability Analysis
(14th ed Exb14-8)
Cost Allocation Value Chain Analysis Sales Profitability AnalysisVCA-Customer linkages
34
35
Customer
Profitability
Analysis
Customer
Revenue Analysis
Customer
Cost Analysis
Cost Allocation Value Chain Analysis Sales Profitability AnalysisVCA-Customer linkages
EXAMPLE FROM 15th edition
36
Customer Revenue Analysis
 Customer revenue analysis considers all activities that affect the net
amount received from the customers
 Customer revenue analysis traces prices and discounts (including sales
and cash discounts) to customers and identifies financing costs
associated with customer revenues
Cost Allocation Value Chain Analysis Sales Profitability AnalysisVCA-Customer linkages
Example 2: Customer Profitability Analysis –
Astel Computers
Cost Allocation Value Chain Analysis Sales Profitability AnalysisVCA-Customer linkages
37
Example 2: Customer Profitability Analysis –
Astel Computers
Cost Allocation Value Chain Analysis Sales Profitability AnalysisVCA-Customer linkages
38
39
 Not all customers require the same type of activities. Examples
of customer-specific activities include:
 order processing costs
 billing, collection and payment processing costs
 accounts receivable and carrying costs
 customer service costs
 return or allowance processing costs
 restocking costs
 selling and marketing costs
Customer Cost Analysis
Cost Allocation Value Chain Analysis Sales Profitability AnalysisVCA-Customer linkages
40
 Customer cost analysis identifies activities and cost drivers to
service customers
 Traditionally, these costs are hidden in the customer support,
marketing, and sales function
 Customer cost can be classified into the following categories:
1. customer unit-level cost
2. customer batch-level cost (e.g. order size)
3. customer-sustaining cost (e.g. visits)
4. distribution-channel cost (e.g. commercial vs. retail)
5. sales-sustaining costs (e.g. maintaining firm sales capability)
Customer Cost Analysis
Cost Allocation Value Chain Analysis Sales Profitability AnalysisVCA-Customer linkages
Example 2: Customer Profitability Analysis –
Astel Computers
Provalue division cost and cost driver information
(Exhibit 14-2)
Cost Allocation Value Chain Analysis Sales Profitability AnalysisVCA-Customer linkages
41
Example 2: Customer Profitability Analysis –
Astel Computers
Provalue quantity of cost drivers, select customers
Next, we must determine how much of each resource the various
customers consumed. That information is reported here.
Cost Allocation Value Chain Analysis Sales Profitability AnalysisVCA-Customer linkages
42
Example 2: Customer Profitability Analysis –
Astel Computers
Customer-profitability analysis for provalue-
wholesale customers
Now that we’ve identified the activities that drive
costs and determined the usage for those
activities for our select customers, we can
calculate profitability by customer.
In this example, we’ll look at Provalue’s 4
wholesale customers and compare profitability.
14-43
Cost Allocation Value Chain Analysis Sales Profitability AnalysisVCA-Customer linkages
Example 2: Customer Profitability Analysis –
Astel Computers
Looking at this chart, if you were the manager, what would you do?
(Exhibit 14-3)
Cost Allocation Value Chain Analysis Sales Profitability AnalysisVCA-Customer linkages
44
 Customer profitability profiles are a useful tool for
managers.
 Cumulative customer profitability profiles provide
information that shows what percentage of operating
income each additional customer contributes.
 Customers are presented in order of contribution to
operating income so any customers in a loss position are
highlighted at the bottom of the analysis.
14-45
Example 2: Customer Profitability
Analysis – Astel Computers
Customer Profitability Profiles
Cost Allocation Value Chain Analysis Sales Profitability AnalysisVCA-Customer linkages
2
Learning Objective 2:
Identify the importance
of customer-
profitability profiles
Example 2: Customer Profitability Analysis –
Astel Computers
Customer profitability profiles, cont’d
 Customer profitability profiles can be presented in
graphical form as well as table form.
14-46
Cost Allocation Value Chain Analysis Sales Profitability AnalysisVCA-Customer linkages
Real World Example : Sanyo Ltd – Can Activity-based
Costing Improve Sanyo’s Management Decision
Making?
Customer Profitability for Selected Customers
-400
-300
-200
-100
0
100
200
300
400
500
1 2 3 4 5 6 7 8 9 10 11 12 13 14 15 16 17 18 19 20
Selected Customers
CustomerProfit('000)
47
Cost Allocation Value Chain Analysis Sales Profitability AnalysisVCA-Customer linkages
48
What other factors need to be considered in evaluating
customer profitability?
 1.
 2.
 3.
 4.
 5.
 6.
Cost Allocation Value Chain Analysis Sales Profitability AnalysisVCA-Customer linkages
49
Other Factors in Evaluating Customer Profitability
 Likelihood of customer retention
 Potential for sales growth
 Importance of having the firm as a customer for future sales
references
 Long-run customer profitability
 Increases in overall demand from having well-known customers
 Ability to learn from customers
Cost Allocation Value Chain Analysis Sales Profitability AnalysisVCA-Customer linkages
Example 2: Customer Profitability Analysis –
Astel Computers
Customer profitability profiles, concluded
 Managers must explore ways to make unprofitable
customers profitable. When doing so, they should
include factors other than the current profitability level
including:
 Likelihood of customer retention.
 Potential for sales growth.
 Long-run customer profitability.
 Increases in overall demand from having well-known customers
(if applicable).
 Ability to learn from customers.
14-50
Cost Allocation Value Chain Analysis Sales Profitability AnalysisVCA-Customer linkages
51
External Linkages - Issues to consider
 Reward loyalty – Longer term customers are loyal customers
 Growth opportunities – Small customers can grow into large customers
 Reputation – Must judge the impact on firm reputation among community (e.g.
Citibank versus Hang Seng Bank in Hong Kong.)
Cost Allocation Value Chain Analysis Sales Profitability AnalysisVCA-Customer linkages
Cost hierarchy-based
operating income statement
 We’ve assigned customer-level costs to customers
but what about corporate costs, R&D and design
costs, etc.
 Customer actions do not influence these costs which
raises two important questions:
1. Should these costs be allocated to customers when
calculating customer profitability, and
2. If they are allocated, on what basis should they be allocated
given the weak cause-and-effect relationship between these
costs and customer actions?
14-52
Cost Allocation Value Chain Analysis Sales Profitability AnalysisVCA-Customer linkages
3(6)
Learning Objective 3:
Apply the concept of
cost hierarchy to
customer costing
Cost hierarchy-based operating
income statement, concluded
 Some managers and management accountants advocate
fully allocating all costs to customers and distribution
channels because all costs are incurred to support the
sales of products to customers.
 Sometimes only those corporate and other costs that are
widely perceived as causally related to customer actions
or that provide explicit benefits to customer profitability
are allocated.
 Let’s take a look at some criteria to guide cost
allocations.
14-53
Cost Allocation Value Chain Analysis Sales Profitability AnalysisVCA-Customer linkages
Cost hierarchy-based operating income statement
Example 3: Astel Computers (Exhibit 14-6)
Cost Allocation Value Chain Analysis Sales Profitability AnalysisVCA-Customer linkages
54
Cost hierarchy-based operating income statement
Example 3: Astel Computers (Exhibit 14-7)
Cost Allocation Value Chain Analysis Sales Profitability AnalysisVCA-Customer linkages
55
Fully allocated customer profitability
 Recall that the first purpose of cost allocation is
to provide information for economic decisions,
such as pricing, by measuring the full costs of
delivering products to different customers
based on an ABC system.
 Cost categories can be summarized into:
 Corporate costs
 Division costs
 Channel costs.
14-56
5
Learning Objective 5:
Discuss decisions
faced when collecting
and allocating indirect
costs to customers
Cost Allocation Value Chain Analysis Sales Profitability AnalysisVCA-Customer linkages
Overview diagram for allocation of corporate,
division and channel costs
Follow the arrows to determine how the costs are allocated:
14-57
Cost Allocation Value Chain Analysis Sales Profitability AnalysisVCA-Customer linkages
Beginning with the last row in the prior screen, we continue
with the allocation.
14-58
Overview diagram for allocation of corporate,
division and channel costs, concluded
What issues, if any, should Astel’s management consider
as they accumulate and allocation these costs?
Issues in allocating corporate costs to
divisions/customers
Let’s take a look at two questions, then we’ll
contemplate the better answers:
1. When allocating corporate costs to divisions, should
a company allocate only costs that vary with division
activity or assign fixed costs as well?
2. When allocating costs to divisions, channels and
customers, how many cost pools should be used?
14-59
Issues in allocating corporate costs to
divisions/customers, concluded
Companies should look to their particular situations, but
the probable best answers to these questions are:
1. To make good long-run decisions, managers need
to know the cost of all resources (variable or fixed
in the short-run) required to sell products to
customers, taking into account only relevant costs
for the specific decision.
2. Managers must balance the benefit of using a
multiple cost-pool system against the cost of
implementing it. Advances in IT technology make it
more likely that a multiple cost-pool system will
pass the cost-benefit test.
14-60
What type of decision?
Sales Variance Analysis
61
Cost Allocation Value Chain Analysis Sales Profitability AnalysisVCA-Customer linkages
Learning outcome 6: Discuss why customer level costs differ across customers
6 (7&8)
SMA
62
 Level 1: Static-budget variance – the difference between an actual result
and the static-budgeted amount - Ouch!
– What happened?
– How much did we make vs. expected (budget)?
 Level 2: Flexible-budget variance – the difference between an actual result
and the flexible-budgeted amount - Ouch!
– what happened?
- How much was due to change in contribution margin (rev – costs)?
 Level 2: Sales-volume variance
- How much was due to change in volume?
 Level 3: Sales Quantity variance
- How much was due to change in quantity?
 Level 3: Sales Mix variance
- How much was due to change in mix?
 Level 4: Market Size variance
- How much was due to change in market size?
 Level 4: Market Share variance
- How much was due to change in market share?
Sales Variance Analysis
Cost Allocation Value Chain Analysis Sales Profitability AnalysisVCA-Customer linkages
MA
63
 Measures shifts between selling more or less of higher or lower
profitable products
Budgeted
Sales-Mix
Percentage
Actual
Sales-Mix
Percentage
X
Budgeted
Contribution
Margin per Unit
Sales-Mix
Variance =
Actual
Units of
All
Products
Sold
X
Sales Variance Analysis
Cost Allocation Value Chain Analysis Sales Profitability AnalysisVCA-Customer linkages
Learning Objective 6:
Subdivide the sales-volume variance into the sales-mix
variance
…the variance arises because actual sales mix differs from
budgeted sales mix
and the sales-quantity variance
… this variance arises because actual total unit sales differ from
budgeted total unit sales (P.591)
7
64
Budgeted
Units of all
Products
Sold
Actual
Units of All
Products
Sold
Budgeted
Contribution
Margin per Unit
Sales-
Quantity
Variance
=
Budgeted
Sales-Mix
Percentage
X X
Sales Variance Analysis
Cost Allocation Value Chain Analysis Sales Profitability AnalysisVCA-Customer linkages
Level 2: Change in margin
Change in volume
Example: Flexible-budget and sales-volume variances
65
Cost Allocation Value Chain Analysis Sales Profitability AnalysisVCA-Customer linkages
MA1
Level 3: Change in mix – Which product makes you more money? Did you
sell a higher or lower proportion of this product?
Change in volume
Example: Sales-mix and sales-quantity variances
66
Cost Allocation Value Chain Analysis Sales Profitability AnalysisVCA-Customer linkages
7
What type of decision?
Sales Variance Analysis
67
Cost Allocation Value Chain Analysis Sales Profitability AnalysisVCA-Customer linkages
Learning outcome 6: Discuss why customer level costs differ across customers
7
8
MA1
68
Budgeted
Market
Share
Actual
Market
Share
X
Budgeted
Contribution
Margin per
Composite Unit
for Budgeted
Mix
Market-
Share
Variance
=
Actual
Market
Size in
Units
X
Do you have control over this?
Market-share variance
Cost Allocation Value Chain Analysis Sales Profitability AnalysisVCA-Customer linkages
Learning Objective 6:
Subdivide the sales-
quantity variance into
the market-share
variance
…the variance arises
because actual market
share differs from
budgeted market share
and the market-size
variance
… this variance arises
because actual market
size differ from budgeted
market size
(P.591)
8
69
Budgeted
Market
Size
Actual
Market
Size
Budgeted
Contribution
Margin per
Composite Unit
for Budgeted
Mix
Market-Size
Variance =
Budgeted
Market
Share
X X
1. Management can only change what they can control?
2. So the value of information is dependent on how well you separate out those
uncontrollable.
3. Do you have control over this?
Market-size variance
Cost Allocation Value Chain Analysis Sales Profitability AnalysisVCA-Customer linkages
Which variance can you control?
Example: Market-share and Market-size variance
70
Cost Allocation Value Chain Analysis Sales Profitability AnalysisVCA-Customer linkages
8
What type of decision?
Sales Variance Analysis
71
Cost Allocation Value Chain Analysis Sales Profitability AnalysisVCA-Customer linkages
Learning outcome 6: Discuss why customer level costs differ across customers
7
8
MA1
72
 Cost Allocation
 Learning Objective 4: Understand criteria to guide cost-allocation decisions
 Value Chain Analysis
 VCA-Customer linkages
 Learning Objective 1: Discuss why a company’s revenues and costs differ across customers
 Learning Objective 2: Identify the importance of customer-profitability profiles
 Learning Objective 3: Understand the cost-hierarchy-based operating income statement
 Learning Objective 5: Discuss decision faced when collecting and allocating indirect costs to
customers
 Sales Profitability Analysis
 Learning Objective 6: Subdivide the sales-variance into the sales-mix variance and the sales-quantity
variance into the market share variance and the market size variance
Week 3: Learning objective summary
Cost Allocation Value Chain Analysis Sales Profitability Analysis
Additional Example
Customer Profitability Analysis
73
Activity-based management Implementation Model
74
ABM Model
Systems Planning
Identify, Define, and
Classify Activities
Reduce
Costs
Improve
Decisions
Increase Profitability
ABC
1. Continuous improvement (PVA)
2. Product design (eg complexity drivers)
3. Improved decision making
4. Accurate cost info (VCA)(ABC)
a. Products (MA1)
b. Customers (eg setup drivers)
c. Suppliers
PVA
Assess Value Content of
Activities
Define Root Causes of
Each Activity
Establish Activity
Performance Measures
Search for Improvement
Opportunities
Part 1 – Week 2 Part 2 – Week 3
Assign Resource Cost to
Activities
Identify Cost Objects and
Define Activity Drivers
Calculate Activity Rates
Assign Costs to Cost
objects
Product design
Value engineering
Design
analysis
Functional
analysis
Cost Allocation Value Chain Analysis Sales Profitability AnalysisVCA-Customer linkages
74
75
Customer
Profitability
Analysis
Customer
Revenue Analysis
Customer
Cost Analysis
Cost Allocation Value Chain Analysis Sales Profitability AnalysisVCA-Customer linkages
Additional Example
76
Customer
Profitability
Analysis
Customer
Revenue Analysis
Customer
Cost Analysis
Cost Allocation Value Chain Analysis Sales Profitability AnalysisVCA-Customer linkages
77
Customer Revenue Analysis
 Customer revenue analysis considers all activities that affect
the net amount received from the customers
 Customer revenue analysis traces prices and discounts
(including sales and cash discounts) to customers and identifies
financing costs associated with customer revenues
Cost Allocation Value Chain Analysis Sales Profitability AnalysisVCA-Customer linkages
78
Example 3: Customer Revenue Analysis
Cost Allocation Value Chain Analysis Sales Profitability AnalysisVCA-Customer linkages
79
Example 3: Customer Revenue Analysis
Insert Exhibit 5.18
Cost Allocation Value Chain Analysis Sales Profitability AnalysisVCA-Customer linkages
80
Customer
Profitability
Analysis
Customer
Revenue Analysis
Customer
Cost Analysis
Cost Allocation Value Chain Analysis Sales Profitability AnalysisVCA-Customer linkages
81
 Not all customers require the same type of activities. Examples
of customer-specific activities include:
 order processing costs
 billing, collection and payment processing costs
 accounts receivable and carrying costs
 customer service costs
 return or allowance processing costs
 restocking costs
 selling and marketing costs
Customer Cost Analysis
Cost Allocation Value Chain Analysis Sales Profitability AnalysisVCA-Customer linkages
82
 Customer cost analysis identifies activities and cost drivers to service
customers
 Traditionally, these costs are hidden in the customer support, marketing,
and sales function
 Customer cost can be classified into the following categories:
1. customer unit-level cost
2. customer batch-level cost (e.g. order size)
3. customer-sustaining cost (e.g. visits)
4. distribution-channel cost (e.g. com vs. retail)
5. sales-sustaining costs (e.g. maintaining firm sales capability)
Customer Cost Analysis
Cost Allocation Value Chain Analysis Sales Profitability AnalysisVCA-Customer linkages
83
Example 3: Customer Cost Analysis
Insert Exhibit 5.19
(Customer-Related Activity)
Here
Cost Allocation Value Chain Analysis Sales Profitability AnalysisVCA-Customer linkages
84
Insert Exhibit 5.20
Example 3: Customer Cost Analysis
Which customer has higher batch level (order) activity costs?
Which customer has higher customer sustaining level (visits) activity costs?
Cost Allocation Value Chain Analysis Sales Profitability AnalysisVCA-Customer linkages
85
Example 3: Customer Cost Analysis
Insert Exhibit 5.21
Cost Allocation Value Chain Analysis Sales Profitability AnalysisVCA-Customer linkages
86
Customer
Profitability
Analysis
Customer
Revenue Analysis
Customer
Cost Analysis
Cost Allocation Value Chain Analysis Sales Profitability AnalysisVCA-Customer linkages
87
Insert Exhibit 5.22
Example 3: Customer Revenue + Customer Cost
= Customer Profitability Analysis
Cost Allocation Value Chain Analysis Sales Profitability AnalysisVCA-Customer linkages
Activity-based management Implementation Model
88
ABM Model
Systems Planning
Identify, Define, and
Classify Activities
Reduce
Costs
Improve
Decisions
Increase Profitability
ABC
1. Continuous improvement (PVA)
2. Product design (eg complexity drivers)
3. Improved decision making
4. Accurate cost info (VCA)(ABC)
a. Products (MA1)
b. Customers (eg setup drivers)
c. Suppliers
PVA
Assess Value Content of
Activities
Define Root Causes of
Each Activity
Establish Activity
Performance Measures
Search for Improvement
Opportunities
Part 1 – Week 2 Part 2 – Week 3
Assign Resource Cost to
Activities
Identify Cost Objects and
Define Activity Drivers
Calculate Activity Rates
Assign Costs to Cost
objects
Product design
Value engineering
Design
analysis
Functional
analysis
Cost Allocation Value Chain Analysis Sales Profitability AnalysisVCA-Customer linkages
88

More Related Content

What's hot

Ppt slides for cost accounting t2 w1 2016 0329arthur
Ppt slides for cost accounting t2 w1 2016  0329arthurPpt slides for cost accounting t2 w1 2016  0329arthur
Ppt slides for cost accounting t2 w1 2016 0329arthurArthur Shum
 
Procurement Cost Saving Strategy " Procurement dari cost centre menjadi profit...
Procurement Cost Saving Strategy " Procurement dari cost centre menjadi profit...Procurement Cost Saving Strategy " Procurement dari cost centre menjadi profit...
Procurement Cost Saving Strategy " Procurement dari cost centre menjadi profit...Indonesian Procurement Society
 
Cost Savings Presentation May 2012
Cost Savings  Presentation   May 2012Cost Savings  Presentation   May 2012
Cost Savings Presentation May 2012ParryMurphy
 
Cost Reduction Toolkit
Cost Reduction ToolkitCost Reduction Toolkit
Cost Reduction ToolkitDavid Tracy
 
Cost Management PowerPoint Presentation Slides
Cost Management PowerPoint Presentation SlidesCost Management PowerPoint Presentation Slides
Cost Management PowerPoint Presentation SlidesSlideTeam
 
Activity based costing
Activity based costingActivity based costing
Activity based costingPraveen Ojha
 
Cost Reduction Strategies:Focus and Techniques
Cost Reduction Strategies:Focus and TechniquesCost Reduction Strategies:Focus and Techniques
Cost Reduction Strategies:Focus and TechniquesThomas Tanel
 
Cost reduction-report
Cost reduction-reportCost reduction-report
Cost reduction-reportjaoctaviano
 
Cost, diff, responce
Cost, diff, responceCost, diff, responce
Cost, diff, responcekahogan62
 
ACG 3341 Technology levels--snaptutorial.com
ACG 3341 Technology levels--snaptutorial.comACG 3341 Technology levels--snaptutorial.com
ACG 3341 Technology levels--snaptutorial.comsholingarjosh14
 
Seven Steps for Achieving Sustainable Cost Reduction
Seven Steps for Achieving Sustainable Cost ReductionSeven Steps for Achieving Sustainable Cost Reduction
Seven Steps for Achieving Sustainable Cost ReductionScottMadden, Inc.
 
Lecture 2 Cost Terminology and Classification
Lecture 2 Cost Terminology and ClassificationLecture 2 Cost Terminology and Classification
Lecture 2 Cost Terminology and ClassificationRiri Ariyanty
 
Price Optimization PowerPoint Presentation Slides
Price Optimization PowerPoint Presentation SlidesPrice Optimization PowerPoint Presentation Slides
Price Optimization PowerPoint Presentation SlidesSlideTeam
 
Uop acc 561 week 6 final guide
Uop acc 561 week 6 final guideUop acc 561 week 6 final guide
Uop acc 561 week 6 final guidekrystalhero123
 
Cost Control Systems
Cost Control SystemsCost Control Systems
Cost Control SystemsUmesh Charki
 

What's hot (20)

Week 9
Week 9Week 9
Week 9
 
Ppt slides for cost accounting t2 w1 2016 0329arthur
Ppt slides for cost accounting t2 w1 2016  0329arthurPpt slides for cost accounting t2 w1 2016  0329arthur
Ppt slides for cost accounting t2 w1 2016 0329arthur
 
Procurement Cost Saving Strategy " Procurement dari cost centre menjadi profit...
Procurement Cost Saving Strategy " Procurement dari cost centre menjadi profit...Procurement Cost Saving Strategy " Procurement dari cost centre menjadi profit...
Procurement Cost Saving Strategy " Procurement dari cost centre menjadi profit...
 
Corporate Cost Reduction
Corporate Cost ReductionCorporate Cost Reduction
Corporate Cost Reduction
 
Cost Savings Presentation May 2012
Cost Savings  Presentation   May 2012Cost Savings  Presentation   May 2012
Cost Savings Presentation May 2012
 
Strategic Cost Management
Strategic Cost ManagementStrategic Cost Management
Strategic Cost Management
 
Cost Reduction Toolkit
Cost Reduction ToolkitCost Reduction Toolkit
Cost Reduction Toolkit
 
Cost Management PowerPoint Presentation Slides
Cost Management PowerPoint Presentation SlidesCost Management PowerPoint Presentation Slides
Cost Management PowerPoint Presentation Slides
 
Activity based costing
Activity based costingActivity based costing
Activity based costing
 
Cost Reduction Strategies:Focus and Techniques
Cost Reduction Strategies:Focus and TechniquesCost Reduction Strategies:Focus and Techniques
Cost Reduction Strategies:Focus and Techniques
 
Cost reduction-report
Cost reduction-reportCost reduction-report
Cost reduction-report
 
Chap002
Chap002Chap002
Chap002
 
Cost, diff, responce
Cost, diff, responceCost, diff, responce
Cost, diff, responce
 
ACG 3341 Technology levels--snaptutorial.com
ACG 3341 Technology levels--snaptutorial.comACG 3341 Technology levels--snaptutorial.com
ACG 3341 Technology levels--snaptutorial.com
 
Seven Steps for Achieving Sustainable Cost Reduction
Seven Steps for Achieving Sustainable Cost ReductionSeven Steps for Achieving Sustainable Cost Reduction
Seven Steps for Achieving Sustainable Cost Reduction
 
Strategy Bsc
Strategy BscStrategy Bsc
Strategy Bsc
 
Lecture 2 Cost Terminology and Classification
Lecture 2 Cost Terminology and ClassificationLecture 2 Cost Terminology and Classification
Lecture 2 Cost Terminology and Classification
 
Price Optimization PowerPoint Presentation Slides
Price Optimization PowerPoint Presentation SlidesPrice Optimization PowerPoint Presentation Slides
Price Optimization PowerPoint Presentation Slides
 
Uop acc 561 week 6 final guide
Uop acc 561 week 6 final guideUop acc 561 week 6 final guide
Uop acc 561 week 6 final guide
 
Cost Control Systems
Cost Control SystemsCost Control Systems
Cost Control Systems
 

Similar to Week 3

Awais Iqbal 2019-EMBA-08 SCM Assignment No. 1 Final.pdf
Awais Iqbal 2019-EMBA-08 SCM Assignment No. 1 Final.pdfAwais Iqbal 2019-EMBA-08 SCM Assignment No. 1 Final.pdf
Awais Iqbal 2019-EMBA-08 SCM Assignment No. 1 Final.pdfMUHAMMAD ASIM shahzad
 
Vb marketing andpricing
Vb marketing andpricingVb marketing andpricing
Vb marketing andpricingAdCMO
 
Cost Advantage.pptx
Cost Advantage.pptxCost Advantage.pptx
Cost Advantage.pptxmirajrokib
 
Economics of crm 3
Economics of crm 3Economics of crm 3
Economics of crm 3ajitjoshiin
 
Michael Porter's Competitive Advantage
Michael Porter's Competitive AdvantageMichael Porter's Competitive Advantage
Michael Porter's Competitive AdvantageWesley Shu
 
Question 3 Are the Company’s Prices and Costs CompetitiveOne o.docx
Question 3 Are the Company’s Prices and Costs CompetitiveOne o.docxQuestion 3 Are the Company’s Prices and Costs CompetitiveOne o.docx
Question 3 Are the Company’s Prices and Costs CompetitiveOne o.docxsimonlbentley59018
 
Job Costing & ABC costing
Job Costing & ABC costingJob Costing & ABC costing
Job Costing & ABC costingRakesh Singh
 
Value analysis methodology
Value analysis methodologyValue analysis methodology
Value analysis methodologybarcelona98
 
Webinar: Pricing a Data Product by fmr Salesforce Sr PM
Webinar: Pricing a Data Product by fmr Salesforce Sr PMWebinar: Pricing a Data Product by fmr Salesforce Sr PM
Webinar: Pricing a Data Product by fmr Salesforce Sr PMProduct School
 
Michael Porters Competitive Advantage 6110
Michael Porters Competitive Advantage 6110Michael Porters Competitive Advantage 6110
Michael Porters Competitive Advantage 6110guest98c5db
 
Customer Retention Summit Integrated Insight V1
Customer Retention Summit   Integrated Insight V1Customer Retention Summit   Integrated Insight V1
Customer Retention Summit Integrated Insight V1Tony Mooney
 
Supplier partnership
Supplier partnershipSupplier partnership
Supplier partnershipLibra chudry
 
Strategic cost management
Strategic cost managementStrategic cost management
Strategic cost managementmnbvcz
 
(DRAFT)Assessment 2 Appendix B – Learning and de.docx
 (DRAFT)Assessment 2  Appendix B  – Learning and de.docx (DRAFT)Assessment 2  Appendix B  – Learning and de.docx
(DRAFT)Assessment 2 Appendix B – Learning and de.docxShiraPrater50
 

Similar to Week 3 (20)

Value analysis
Value analysisValue analysis
Value analysis
 
Abc costig
Abc costigAbc costig
Abc costig
 
Activity based costing
Activity based costingActivity based costing
Activity based costing
 
Awais Iqbal 2019-EMBA-08 SCM Assignment No. 1 Final.pdf
Awais Iqbal 2019-EMBA-08 SCM Assignment No. 1 Final.pdfAwais Iqbal 2019-EMBA-08 SCM Assignment No. 1 Final.pdf
Awais Iqbal 2019-EMBA-08 SCM Assignment No. 1 Final.pdf
 
Vb marketing andpricing
Vb marketing andpricingVb marketing andpricing
Vb marketing andpricing
 
Cost Advantage.pptx
Cost Advantage.pptxCost Advantage.pptx
Cost Advantage.pptx
 
Economics of crm 3
Economics of crm 3Economics of crm 3
Economics of crm 3
 
Activity Based Costing
Activity Based CostingActivity Based Costing
Activity Based Costing
 
Michael Porter's Competitive Advantage
Michael Porter's Competitive AdvantageMichael Porter's Competitive Advantage
Michael Porter's Competitive Advantage
 
Question 3 Are the Company’s Prices and Costs CompetitiveOne o.docx
Question 3 Are the Company’s Prices and Costs CompetitiveOne o.docxQuestion 3 Are the Company’s Prices and Costs CompetitiveOne o.docx
Question 3 Are the Company’s Prices and Costs CompetitiveOne o.docx
 
Job Costing & ABC costing
Job Costing & ABC costingJob Costing & ABC costing
Job Costing & ABC costing
 
Value analysis methodology
Value analysis methodologyValue analysis methodology
Value analysis methodology
 
Webinar: Pricing a Data Product by fmr Salesforce Sr PM
Webinar: Pricing a Data Product by fmr Salesforce Sr PMWebinar: Pricing a Data Product by fmr Salesforce Sr PM
Webinar: Pricing a Data Product by fmr Salesforce Sr PM
 
Michael Porters Competitive Advantage 6110
Michael Porters Competitive Advantage 6110Michael Porters Competitive Advantage 6110
Michael Porters Competitive Advantage 6110
 
Activity based costing salah skaik
Activity based costing   salah skaikActivity based costing   salah skaik
Activity based costing salah skaik
 
Customer Retention Summit Integrated Insight V1
Customer Retention Summit   Integrated Insight V1Customer Retention Summit   Integrated Insight V1
Customer Retention Summit Integrated Insight V1
 
PPT on PM_Unit 1 .pptx.
PPT                  on PM_Unit 1 .pptx.PPT                  on PM_Unit 1 .pptx.
PPT on PM_Unit 1 .pptx.
 
Supplier partnership
Supplier partnershipSupplier partnership
Supplier partnership
 
Strategic cost management
Strategic cost managementStrategic cost management
Strategic cost management
 
(DRAFT)Assessment 2 Appendix B – Learning and de.docx
 (DRAFT)Assessment 2  Appendix B  – Learning and de.docx (DRAFT)Assessment 2  Appendix B  – Learning and de.docx
(DRAFT)Assessment 2 Appendix B – Learning and de.docx
 

Recently uploaded

Procuring digital preservation CAN be quick and painless with our new dynamic...
Procuring digital preservation CAN be quick and painless with our new dynamic...Procuring digital preservation CAN be quick and painless with our new dynamic...
Procuring digital preservation CAN be quick and painless with our new dynamic...Jisc
 
Hierarchy of management that covers different levels of management
Hierarchy of management that covers different levels of managementHierarchy of management that covers different levels of management
Hierarchy of management that covers different levels of managementmkooblal
 
Keynote by Prof. Wurzer at Nordex about IP-design
Keynote by Prof. Wurzer at Nordex about IP-designKeynote by Prof. Wurzer at Nordex about IP-design
Keynote by Prof. Wurzer at Nordex about IP-designMIPLM
 
ENGLISH 7_Q4_LESSON 2_ Employing a Variety of Strategies for Effective Interp...
ENGLISH 7_Q4_LESSON 2_ Employing a Variety of Strategies for Effective Interp...ENGLISH 7_Q4_LESSON 2_ Employing a Variety of Strategies for Effective Interp...
ENGLISH 7_Q4_LESSON 2_ Employing a Variety of Strategies for Effective Interp...JhezDiaz1
 
Employee wellbeing at the workplace.pptx
Employee wellbeing at the workplace.pptxEmployee wellbeing at the workplace.pptx
Employee wellbeing at the workplace.pptxNirmalaLoungPoorunde1
 
Proudly South Africa powerpoint Thorisha.pptx
Proudly South Africa powerpoint Thorisha.pptxProudly South Africa powerpoint Thorisha.pptx
Proudly South Africa powerpoint Thorisha.pptxthorishapillay1
 
ENGLISH6-Q4-W3.pptxqurter our high choom
ENGLISH6-Q4-W3.pptxqurter our high choomENGLISH6-Q4-W3.pptxqurter our high choom
ENGLISH6-Q4-W3.pptxqurter our high choomnelietumpap1
 
Full Stack Web Development Course for Beginners
Full Stack Web Development Course  for BeginnersFull Stack Web Development Course  for Beginners
Full Stack Web Development Course for BeginnersSabitha Banu
 
HỌC TỐT TIẾNG ANH 11 THEO CHƯƠNG TRÌNH GLOBAL SUCCESS ĐÁP ÁN CHI TIẾT - CẢ NĂ...
HỌC TỐT TIẾNG ANH 11 THEO CHƯƠNG TRÌNH GLOBAL SUCCESS ĐÁP ÁN CHI TIẾT - CẢ NĂ...HỌC TỐT TIẾNG ANH 11 THEO CHƯƠNG TRÌNH GLOBAL SUCCESS ĐÁP ÁN CHI TIẾT - CẢ NĂ...
HỌC TỐT TIẾNG ANH 11 THEO CHƯƠNG TRÌNH GLOBAL SUCCESS ĐÁP ÁN CHI TIẾT - CẢ NĂ...Nguyen Thanh Tu Collection
 
Field Attribute Index Feature in Odoo 17
Field Attribute Index Feature in Odoo 17Field Attribute Index Feature in Odoo 17
Field Attribute Index Feature in Odoo 17Celine George
 
ROOT CAUSE ANALYSIS PowerPoint Presentation
ROOT CAUSE ANALYSIS PowerPoint PresentationROOT CAUSE ANALYSIS PowerPoint Presentation
ROOT CAUSE ANALYSIS PowerPoint PresentationAadityaSharma884161
 
Computed Fields and api Depends in the Odoo 17
Computed Fields and api Depends in the Odoo 17Computed Fields and api Depends in the Odoo 17
Computed Fields and api Depends in the Odoo 17Celine George
 
Influencing policy (training slides from Fast Track Impact)
Influencing policy (training slides from Fast Track Impact)Influencing policy (training slides from Fast Track Impact)
Influencing policy (training slides from Fast Track Impact)Mark Reed
 
How to Configure Email Server in Odoo 17
How to Configure Email Server in Odoo 17How to Configure Email Server in Odoo 17
How to Configure Email Server in Odoo 17Celine George
 
ECONOMIC CONTEXT - PAPER 1 Q3: NEWSPAPERS.pptx
ECONOMIC CONTEXT - PAPER 1 Q3: NEWSPAPERS.pptxECONOMIC CONTEXT - PAPER 1 Q3: NEWSPAPERS.pptx
ECONOMIC CONTEXT - PAPER 1 Q3: NEWSPAPERS.pptxiammrhaywood
 

Recently uploaded (20)

Procuring digital preservation CAN be quick and painless with our new dynamic...
Procuring digital preservation CAN be quick and painless with our new dynamic...Procuring digital preservation CAN be quick and painless with our new dynamic...
Procuring digital preservation CAN be quick and painless with our new dynamic...
 
TataKelola dan KamSiber Kecerdasan Buatan v022.pdf
TataKelola dan KamSiber Kecerdasan Buatan v022.pdfTataKelola dan KamSiber Kecerdasan Buatan v022.pdf
TataKelola dan KamSiber Kecerdasan Buatan v022.pdf
 
Hierarchy of management that covers different levels of management
Hierarchy of management that covers different levels of managementHierarchy of management that covers different levels of management
Hierarchy of management that covers different levels of management
 
Keynote by Prof. Wurzer at Nordex about IP-design
Keynote by Prof. Wurzer at Nordex about IP-designKeynote by Prof. Wurzer at Nordex about IP-design
Keynote by Prof. Wurzer at Nordex about IP-design
 
ENGLISH 7_Q4_LESSON 2_ Employing a Variety of Strategies for Effective Interp...
ENGLISH 7_Q4_LESSON 2_ Employing a Variety of Strategies for Effective Interp...ENGLISH 7_Q4_LESSON 2_ Employing a Variety of Strategies for Effective Interp...
ENGLISH 7_Q4_LESSON 2_ Employing a Variety of Strategies for Effective Interp...
 
Employee wellbeing at the workplace.pptx
Employee wellbeing at the workplace.pptxEmployee wellbeing at the workplace.pptx
Employee wellbeing at the workplace.pptx
 
Proudly South Africa powerpoint Thorisha.pptx
Proudly South Africa powerpoint Thorisha.pptxProudly South Africa powerpoint Thorisha.pptx
Proudly South Africa powerpoint Thorisha.pptx
 
Raw materials used in Herbal Cosmetics.pptx
Raw materials used in Herbal Cosmetics.pptxRaw materials used in Herbal Cosmetics.pptx
Raw materials used in Herbal Cosmetics.pptx
 
ENGLISH6-Q4-W3.pptxqurter our high choom
ENGLISH6-Q4-W3.pptxqurter our high choomENGLISH6-Q4-W3.pptxqurter our high choom
ENGLISH6-Q4-W3.pptxqurter our high choom
 
Model Call Girl in Bikash Puri Delhi reach out to us at 🔝9953056974🔝
Model Call Girl in Bikash Puri  Delhi reach out to us at 🔝9953056974🔝Model Call Girl in Bikash Puri  Delhi reach out to us at 🔝9953056974🔝
Model Call Girl in Bikash Puri Delhi reach out to us at 🔝9953056974🔝
 
Full Stack Web Development Course for Beginners
Full Stack Web Development Course  for BeginnersFull Stack Web Development Course  for Beginners
Full Stack Web Development Course for Beginners
 
OS-operating systems- ch04 (Threads) ...
OS-operating systems- ch04 (Threads) ...OS-operating systems- ch04 (Threads) ...
OS-operating systems- ch04 (Threads) ...
 
HỌC TỐT TIẾNG ANH 11 THEO CHƯƠNG TRÌNH GLOBAL SUCCESS ĐÁP ÁN CHI TIẾT - CẢ NĂ...
HỌC TỐT TIẾNG ANH 11 THEO CHƯƠNG TRÌNH GLOBAL SUCCESS ĐÁP ÁN CHI TIẾT - CẢ NĂ...HỌC TỐT TIẾNG ANH 11 THEO CHƯƠNG TRÌNH GLOBAL SUCCESS ĐÁP ÁN CHI TIẾT - CẢ NĂ...
HỌC TỐT TIẾNG ANH 11 THEO CHƯƠNG TRÌNH GLOBAL SUCCESS ĐÁP ÁN CHI TIẾT - CẢ NĂ...
 
Rapple "Scholarly Communications and the Sustainable Development Goals"
Rapple "Scholarly Communications and the Sustainable Development Goals"Rapple "Scholarly Communications and the Sustainable Development Goals"
Rapple "Scholarly Communications and the Sustainable Development Goals"
 
Field Attribute Index Feature in Odoo 17
Field Attribute Index Feature in Odoo 17Field Attribute Index Feature in Odoo 17
Field Attribute Index Feature in Odoo 17
 
ROOT CAUSE ANALYSIS PowerPoint Presentation
ROOT CAUSE ANALYSIS PowerPoint PresentationROOT CAUSE ANALYSIS PowerPoint Presentation
ROOT CAUSE ANALYSIS PowerPoint Presentation
 
Computed Fields and api Depends in the Odoo 17
Computed Fields and api Depends in the Odoo 17Computed Fields and api Depends in the Odoo 17
Computed Fields and api Depends in the Odoo 17
 
Influencing policy (training slides from Fast Track Impact)
Influencing policy (training slides from Fast Track Impact)Influencing policy (training slides from Fast Track Impact)
Influencing policy (training slides from Fast Track Impact)
 
How to Configure Email Server in Odoo 17
How to Configure Email Server in Odoo 17How to Configure Email Server in Odoo 17
How to Configure Email Server in Odoo 17
 
ECONOMIC CONTEXT - PAPER 1 Q3: NEWSPAPERS.pptx
ECONOMIC CONTEXT - PAPER 1 Q3: NEWSPAPERS.pptxECONOMIC CONTEXT - PAPER 1 Q3: NEWSPAPERS.pptx
ECONOMIC CONTEXT - PAPER 1 Q3: NEWSPAPERS.pptx
 

Week 3

  • 1. Activity-based management Implementation Model 1 ABM Model Systems Planning Identify, Define, and Classify Activities Reduce Costs Improve Decisions Increase Profitability ABC 1. Continuous improvement (PVA) 2. Product design (eg complexity drivers) 3. Improved decision making 4. Accurate cost info (VCA)(ABC) a. Products (MA1) b. Customers (eg setup drivers) c. Suppliers PVA Assess Value Content of Activities Define Root Causes of Each Activity Establish Activity Performance Measures Search for Improvement Opportunities Part 1 – Week 2 Part 2 – Week 3 Assign Resource Cost to Activities Identify Cost Objects and Define Activity Drivers Calculate Activity Rates Assign Costs to Cost objects Product design Value engineering Design analysis Functional analysis Cost Allocation Value Chain Analysis Sales Profitability AnalysisVCA-Customer linkages 1
  • 2. Week 3 Cost Allocation, Customer- Profitability Analysis, and Sales-Variance Analysis http://www.youtube.com/watch?v=qS7nqwGt4-I 2
  • 3. 3  Cost Allocation  Learning Objective 4: Understand criteria to guide cost-allocation decisions  Value Chain Analysis  VCA-Customer linkages  Learning Objective 1: Discuss why a company’s revenues and costs differ across customers  Learning Objective 2: Identify the importance of customer-profitability profiles  Learning Objective 3: Understand the cost-hierarchy-based operating income statement  Learning Objective 5: Discuss decision faced when collecting and allocating indirect costs to customers  Sales Profitability Analysis  Learning Objective 6: Subdivide the sales-variance into the sales-mix variance and the sales-quantity variance into the market share variance and the market size variance Week 3: Learning objective summary Cost Allocation Value Chain Analysis Sales Profitability Analysis
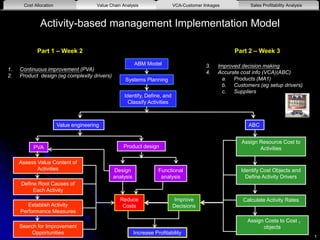
  • 4. Activity-based management Implementation Model 5 ABM Model Systems Planning Identify, Define, and Classify Activities Reduce Costs Improve Decisions Increase Profitability ABC 1. Continuous improvement (PVA) 2. Product design (eg complexity drivers) 3. Improved decision making 4. Accurate cost info (VCA)(ABC) a. Products (MA1) b. Customers (eg setup drivers) c. Suppliers PVA Assess Value Content of Activities Define Root Causes of Each Activity Establish Activity Performance Measures Search for Improvement Opportunities Part 1 – Week 2 Part 2 – Week 3 Assign Resource Cost to Activities Identify Cost Objects and Define Activity Drivers Calculate Activity Rates Assign Costs to Cost objects Product design Value engineering Design analysis Functional analysis Cost Allocation Value Chain Analysis Sales Profitability AnalysisVCA-Customer linkages 5
  • 5. 6 1. What is Cost Allocation?  Assigning indirect costs to cost objects  These costs are not traced  Indirect costs often comprise a large percentage of Total Overall Costs Cost Allocation Value Chain Analysis Sales Profitability AnalysisVCA-Customer linkages Learning Objective 1: Understand the criteria to guide cost- allocation decisions. Identify four purposes for allocating costs to cost objectives 4(1&2)
  • 6. 7 2. What are the purposes of cost allocation?  1  2  3  4 Cost Allocation Value Chain Analysis Sales Profitability AnalysisVCA-Customer linkages
  • 7. Purposes of Cost Allocation Cost Allocation Value Chain Analysis Sales Profitability AnalysisVCA-Customer linkages 8
  • 8. 9 3. What are the criteria for cost allocations?  1  2  3  4 Cost Allocation Value Chain Analysis Sales Profitability AnalysisVCA-Customer linkages
  • 9. 10 Exercise: Criteria for Cost-allocation decisions  Cause and Effect  Benefits Received  Fairness (Equity)  Ability to Bear Cost Allocation Value Chain Analysis Sales Profitability AnalysisVCA-Customer linkages
  • 10. 11 Exercise: Criteria for Cost-allocation decisions  The basis for establishing a price satisfactory to the government and its suppliers  Most credible to operating managers  costs are allocated in proportion to the cost object’s ability to bear them  Integral part of ABC  Generally, larger or more profitable objects receive proportionally more of the allocated costs  Cost allocation here is viewed as a “reasonable” or “fair” means of establishing selling price  the beneficiaries of the outputs of the cost object are charged with costs in proportion to the benefits received  variables are identified that cause resources to be consumed Cost Allocation Value Chain Analysis Sales Profitability AnalysisVCA-Customer linkages
  • 11. 12 Exercise: Criteria for Cost-allocation decisions  Cause and Effect  variables are identified that cause resources to be consumed  Most credible to operating managers  Integral part of ABC  Benefits Received  the beneficiaries of the outputs of the cost object are charged with costs in proportion to the benefits received  Fairness (Equity)  the basis for establishing a price satisfactory to the government and its suppliers  Cost allocation here is viewed as a “reasonable” or “fair” means of establishing selling price  Ability to Bear  costs are allocated in proportion to the cost object’s ability to bear them  Generally, larger or more profitable objects receive proportionally more of the allocated costs Cost Allocation Value Chain Analysis Sales Profitability AnalysisVCA-Customer linkages
  • 12. Example: Cost Allocation Cost Allocation Value Chain Analysis Sales Profitability AnalysisVCA-Customer linkages 13
  • 13. 14 Value Chain Analysis - Product Costing Definitions Long-Term Pricing Decisions Product-Mix Decisions Life cycle product costing Strategic Profitability Analysis Short-Term Pricing Decisions Product-Mix Decisions Strategic Design Decisions Tactical Profitability Analysis Short-Term Pricing Decisions External Financial Reporting Production Value-Chain Product Costs Operating Product Costs Traditional Product Costs Production Cost Allocation Value Chain Analysis Sales Profitability AnalysisVCA-Customer linkages Research & Development Production Marketing Distribution Outsourcing/suppliers Customer service Warranty claims Design Lawsuits Learning Objective 3: Understand the broader relevant costs across the value chain and the decisions impacted (3)
  • 14. 15 Profit and Loss Statement  Sales  Cost of Goods Sold  Begin Inventory  Cost of Goods Manufactured  Begin WIP  Total Manufacturing costs  Direct materials  Direct labor  Manufacturing overhead  Ending WIP  End Inventory  Gross Profit on Sales  Operating (period) expenses  Selling  Administration  Financing  Net Profit on Sales Cost Allocation Value Chain Analysis Sales Profitability AnalysisVCA-Customer linkages
  • 15. 16 Customer Profitability Analysis Customer Revenue Analysis Customer Cost Analysis Cost Allocation Value Chain Analysis Sales Profitability AnalysisVCA-Customer linkages Learning Objective 1: Discuss why a company’s revenues and costs differ across customers … revenues can differ because of differences in the quantity purchased and the price discounts while costs differ because of different demands placed on a company’s resources (P.572) 1(4)
  • 16. 17 Customer Profitability Analysis  ABC/ABM product costing can be extended to customer profitability analysis to identify the best customers  Customer profitability analysis focuses on selling, general, and administrative costs  Customer profitability analysis analyzes activities, identifies proper cost drivers, and determines realized profits from customers Cost Allocation Value Chain Analysis Sales Profitability AnalysisVCA-Customer linkages
  • 17. 18 Customer Profitability Matrix Companies do not have to target all types of customers in order to be successful. One way to think about which customers to target is by using a customer profitability matrix. Insert Exhibit 5.16 (Profitability Matrix) Here 18 Cost Allocation Value Chain Analysis Sales Profitability AnalysisVCA-Customer linkages
  • 18. 19 Cost Allocation Value Chain Analysis Sales Profitability AnalysisVCA-Customer linkages Managers are increasingly finding it important to: https://www.youtube.com/watch?v=_IznwZYvrAE (Equation) https://www.youtube.com/watch?v=EYboh3f6gsU (SAP) The banking industry is changing and financial institutions are suffering increasing pressures. To survive in an increasingly competitive market, banks are forced to become more flexible, they must innovate to meet customers' needs whose behaviors and expectations are changing. Want to stay competitive in the eyes of your customer? How to customize your service offerings to meet the changing needs of your customers? By implementing a relationship-based and a la carte pricing! Discover how a predictive analysis of your customer combined with a flexible pricing engine allows you to set up the appropriate service offerings and to reward customer's loyalty while maintaining your profitability.
  • 19. 20 1. E.g. raise prices for “demanders” or discount to gain more volume with low “cost-to-serve” customers 2. Identify the most profitable customers 3. Providing better services to highly profitable customers (e.g. offer the customer profit-positives service level options) 4. Securing highly profitable customers from competitors 5. Establish a surcharge for or re-pricing of expensive activities 6. Negotiating with customers to reach mutually beneficial levels of service 7. Choose various kinds of after-sale services to provide) 8. Abandon (reduce) products, services, or customers (e.g. conceding permanent “loss customers” to competitors 9. Introduce new products and services 10. Manage each customer’s “costs-to-serve” to a lower level (e.g. Improve their processes) 11. select the customer mix (e.g. shift the customer’s purchase mix toward richer, higher-margin products and service lines) Cost Allocation Value Chain Analysis Sales Profitability AnalysisVCA-Customer linkages Managers are increasingly finding it important to:
  • 20. 21 Customer Profitability Analysis – Task 1  Customer profitability analysis allows managers to: 1. Strategic customer acquisition 2. Continuous improvement 3. Setting prices based on the cost to serve 4. Value added service management Cost Allocation Value Chain Analysis Sales Profitability AnalysisVCA-Customer linkages
  • 21. 22 Customer Profitability Analysis – Task 1  Customer profitability analysis allows managers to: 1. Strategic customer acquisition 1. Identify the most profitable customers 2. Securing highly profitable customers from competitors 3. Abandon (reduce) products, services, or customers (e.g. conceding permanent “loss customers” to competitors 2. Continuous improvement 1. Manage each customer’s “costs-to-serve” to a lower level (e.g. Improve their processes) 3. Setting prices based on the cost to serve 1. E.g. raise prices for “demanders” or discount to gain more volume with low “cost-to-serve” customers 2. Establish a surcharge for or re-pricing of expensive activities 4. Value added service management (i.e. choose various kinds of after-sale services to provide) 1. Select the customer mix (e.g. shift the customer’s purchase mix toward richer, higher-margin products and service lines) 2. Introduce new products and services 3. Providing better services to highly profitable customers (e.g. offer the customer profit-positives service level options) 4. Negotiating with customers to reach mutually beneficial levels of service Cost Allocation Value Chain Analysis Sales Profitability AnalysisVCA-Customer linkages
  • 22. In practice #1: Banks - U.S. Millionaires Told Go Away as Tax Evasion Rule Looms  “I don’t open U.S. accounts, period,” said Su Shan Tan, head of private banking at Singapore-based DBS, Southeast Asia’s largest lender, who described reg attitudes toward U.S. clients as “Draconian.”  Bank of Singapore, the private-banking arm of Oversea- Chinese Banking Corp. (OCBC), ranked strongest in the world for the last two years by Bloomberg Markets magazine, has turned away millions of dollars from Americans because it doesn’t want to deal with the regulatory hassle, according to Chief Executive Officer Renato de Guzman. The bank had $32 billion under management as of the beginning of the year.  http://www.bloomberg.com/news/2012-05-08/u-s-millionaires-told-go-away-as- tax-evasion-rule-looms.html 23 Cost Allocation Value Chain Analysis Sales Profitability AnalysisVCA-Customer linkages
  • 23. 25 Cost Allocation Value Chain Analysis Sales Profitability AnalysisVCA-Customer linkages In practice #1: Customer stop light feedback indicators Companies use stop lights to give instant feedback to service operators (phone operators) so as to help them deal with the type of customer in the appropriate way.
  • 24. 26 In practice #2: Oops, what happened here? Cost Allocation Value Chain Analysis Sales Profitability AnalysisVCA-Customer linkages
  • 25. 27 In practice #2: Customer profitability in an Insurance company  Figure 1 occurs in virtually every customer profitability study ever done, in which:  15 percent to 20 percent of the customers generate 100 percent (or more) of the profits.  In this case, 1. the most profitable 40 percent of customers generate 130 percent of annual profits; 2. the middle 55 percent of customers break even, and 3. the least profitable 5 percent of customers incur losses equal to 30 percent of annual profits. Cost Allocation Value Chain Analysis Sales Profitability AnalysisVCA-Customer linkages
  • 26. 28 In practice #2: Customer Profitability in an Insurance Company Cost Allocation Value Chain Analysis Sales Profitability AnalysisVCA-Customer linkages
  • 27. 29 In practice #2: Customer profitability in an Insurance company – decisions made 1. With its most profitable customers, the company worked harder to ensure their continued loyalty and to generate more business from them. 2. For customers in the middle break-even group, it would improve its processes to lower its cost of serving them. 3. It focused most of its attention on the 5 percent-loss customers, taking actions to re-price services and asking them for more business in higher-margin product lines. If the company could not transform these customers into profitable ones by these actions, it was prepared to drop the accounts. Cost Allocation Value Chain Analysis Sales Profitability AnalysisVCA-Customer linkages
  • 28. 30 Customer Profitability Analysis Customer Revenue Analysis Customer Cost Analysis Cost Allocation Value Chain Analysis Sales Profitability AnalysisVCA-Customer linkages EXAMPLE FROM 14th edition
  • 29. Example 1: Customer Profitability Analysis – Spring Distribution Co – Retail Channel (14th ed Exb14-5) Cost Allocation Value Chain Analysis Sales Profitability AnalysisVCA-Customer linkages 31
  • 30. Example 1: Customer Profitability Analysis Spring Distribution Co – Retail & Wholesale Channel (14th ed Exb14-6) Cost Allocation Value Chain Analysis Sales Profitability AnalysisVCA-Customer linkages 32
  • 31. Example 1: Customer Profitability Analysis Spring Distribution Co – Retail Channel (14th ed Exb14-7) Cost Allocation Value Chain Analysis Sales Profitability AnalysisVCA-Customer linkages 33
  • 32. Example 1: Customer Profitability Analysis (14th ed Exb14-8) Cost Allocation Value Chain Analysis Sales Profitability AnalysisVCA-Customer linkages 34
  • 33. 35 Customer Profitability Analysis Customer Revenue Analysis Customer Cost Analysis Cost Allocation Value Chain Analysis Sales Profitability AnalysisVCA-Customer linkages EXAMPLE FROM 15th edition
  • 34. 36 Customer Revenue Analysis  Customer revenue analysis considers all activities that affect the net amount received from the customers  Customer revenue analysis traces prices and discounts (including sales and cash discounts) to customers and identifies financing costs associated with customer revenues Cost Allocation Value Chain Analysis Sales Profitability AnalysisVCA-Customer linkages
  • 35. Example 2: Customer Profitability Analysis – Astel Computers Cost Allocation Value Chain Analysis Sales Profitability AnalysisVCA-Customer linkages 37
  • 36. Example 2: Customer Profitability Analysis – Astel Computers Cost Allocation Value Chain Analysis Sales Profitability AnalysisVCA-Customer linkages 38
  • 37. 39  Not all customers require the same type of activities. Examples of customer-specific activities include:  order processing costs  billing, collection and payment processing costs  accounts receivable and carrying costs  customer service costs  return or allowance processing costs  restocking costs  selling and marketing costs Customer Cost Analysis Cost Allocation Value Chain Analysis Sales Profitability AnalysisVCA-Customer linkages
  • 38. 40  Customer cost analysis identifies activities and cost drivers to service customers  Traditionally, these costs are hidden in the customer support, marketing, and sales function  Customer cost can be classified into the following categories: 1. customer unit-level cost 2. customer batch-level cost (e.g. order size) 3. customer-sustaining cost (e.g. visits) 4. distribution-channel cost (e.g. commercial vs. retail) 5. sales-sustaining costs (e.g. maintaining firm sales capability) Customer Cost Analysis Cost Allocation Value Chain Analysis Sales Profitability AnalysisVCA-Customer linkages
  • 39. Example 2: Customer Profitability Analysis – Astel Computers Provalue division cost and cost driver information (Exhibit 14-2) Cost Allocation Value Chain Analysis Sales Profitability AnalysisVCA-Customer linkages 41
  • 40. Example 2: Customer Profitability Analysis – Astel Computers Provalue quantity of cost drivers, select customers Next, we must determine how much of each resource the various customers consumed. That information is reported here. Cost Allocation Value Chain Analysis Sales Profitability AnalysisVCA-Customer linkages 42
  • 41. Example 2: Customer Profitability Analysis – Astel Computers Customer-profitability analysis for provalue- wholesale customers Now that we’ve identified the activities that drive costs and determined the usage for those activities for our select customers, we can calculate profitability by customer. In this example, we’ll look at Provalue’s 4 wholesale customers and compare profitability. 14-43 Cost Allocation Value Chain Analysis Sales Profitability AnalysisVCA-Customer linkages
  • 42. Example 2: Customer Profitability Analysis – Astel Computers Looking at this chart, if you were the manager, what would you do? (Exhibit 14-3) Cost Allocation Value Chain Analysis Sales Profitability AnalysisVCA-Customer linkages 44
  • 43.  Customer profitability profiles are a useful tool for managers.  Cumulative customer profitability profiles provide information that shows what percentage of operating income each additional customer contributes.  Customers are presented in order of contribution to operating income so any customers in a loss position are highlighted at the bottom of the analysis. 14-45 Example 2: Customer Profitability Analysis – Astel Computers Customer Profitability Profiles Cost Allocation Value Chain Analysis Sales Profitability AnalysisVCA-Customer linkages 2 Learning Objective 2: Identify the importance of customer- profitability profiles
  • 44. Example 2: Customer Profitability Analysis – Astel Computers Customer profitability profiles, cont’d  Customer profitability profiles can be presented in graphical form as well as table form. 14-46 Cost Allocation Value Chain Analysis Sales Profitability AnalysisVCA-Customer linkages
  • 45. Real World Example : Sanyo Ltd – Can Activity-based Costing Improve Sanyo’s Management Decision Making? Customer Profitability for Selected Customers -400 -300 -200 -100 0 100 200 300 400 500 1 2 3 4 5 6 7 8 9 10 11 12 13 14 15 16 17 18 19 20 Selected Customers CustomerProfit('000) 47 Cost Allocation Value Chain Analysis Sales Profitability AnalysisVCA-Customer linkages
  • 46. 48 What other factors need to be considered in evaluating customer profitability?  1.  2.  3.  4.  5.  6. Cost Allocation Value Chain Analysis Sales Profitability AnalysisVCA-Customer linkages
  • 47. 49 Other Factors in Evaluating Customer Profitability  Likelihood of customer retention  Potential for sales growth  Importance of having the firm as a customer for future sales references  Long-run customer profitability  Increases in overall demand from having well-known customers  Ability to learn from customers Cost Allocation Value Chain Analysis Sales Profitability AnalysisVCA-Customer linkages
  • 48. Example 2: Customer Profitability Analysis – Astel Computers Customer profitability profiles, concluded  Managers must explore ways to make unprofitable customers profitable. When doing so, they should include factors other than the current profitability level including:  Likelihood of customer retention.  Potential for sales growth.  Long-run customer profitability.  Increases in overall demand from having well-known customers (if applicable).  Ability to learn from customers. 14-50 Cost Allocation Value Chain Analysis Sales Profitability AnalysisVCA-Customer linkages
  • 49. 51 External Linkages - Issues to consider  Reward loyalty – Longer term customers are loyal customers  Growth opportunities – Small customers can grow into large customers  Reputation – Must judge the impact on firm reputation among community (e.g. Citibank versus Hang Seng Bank in Hong Kong.) Cost Allocation Value Chain Analysis Sales Profitability AnalysisVCA-Customer linkages
  • 50. Cost hierarchy-based operating income statement  We’ve assigned customer-level costs to customers but what about corporate costs, R&D and design costs, etc.  Customer actions do not influence these costs which raises two important questions: 1. Should these costs be allocated to customers when calculating customer profitability, and 2. If they are allocated, on what basis should they be allocated given the weak cause-and-effect relationship between these costs and customer actions? 14-52 Cost Allocation Value Chain Analysis Sales Profitability AnalysisVCA-Customer linkages 3(6) Learning Objective 3: Apply the concept of cost hierarchy to customer costing
  • 51. Cost hierarchy-based operating income statement, concluded  Some managers and management accountants advocate fully allocating all costs to customers and distribution channels because all costs are incurred to support the sales of products to customers.  Sometimes only those corporate and other costs that are widely perceived as causally related to customer actions or that provide explicit benefits to customer profitability are allocated.  Let’s take a look at some criteria to guide cost allocations. 14-53 Cost Allocation Value Chain Analysis Sales Profitability AnalysisVCA-Customer linkages
  • 52. Cost hierarchy-based operating income statement Example 3: Astel Computers (Exhibit 14-6) Cost Allocation Value Chain Analysis Sales Profitability AnalysisVCA-Customer linkages 54
  • 53. Cost hierarchy-based operating income statement Example 3: Astel Computers (Exhibit 14-7) Cost Allocation Value Chain Analysis Sales Profitability AnalysisVCA-Customer linkages 55
  • 54. Fully allocated customer profitability  Recall that the first purpose of cost allocation is to provide information for economic decisions, such as pricing, by measuring the full costs of delivering products to different customers based on an ABC system.  Cost categories can be summarized into:  Corporate costs  Division costs  Channel costs. 14-56 5 Learning Objective 5: Discuss decisions faced when collecting and allocating indirect costs to customers Cost Allocation Value Chain Analysis Sales Profitability AnalysisVCA-Customer linkages
  • 55. Overview diagram for allocation of corporate, division and channel costs Follow the arrows to determine how the costs are allocated: 14-57 Cost Allocation Value Chain Analysis Sales Profitability AnalysisVCA-Customer linkages
  • 56. Beginning with the last row in the prior screen, we continue with the allocation. 14-58 Overview diagram for allocation of corporate, division and channel costs, concluded What issues, if any, should Astel’s management consider as they accumulate and allocation these costs?
  • 57. Issues in allocating corporate costs to divisions/customers Let’s take a look at two questions, then we’ll contemplate the better answers: 1. When allocating corporate costs to divisions, should a company allocate only costs that vary with division activity or assign fixed costs as well? 2. When allocating costs to divisions, channels and customers, how many cost pools should be used? 14-59
  • 58. Issues in allocating corporate costs to divisions/customers, concluded Companies should look to their particular situations, but the probable best answers to these questions are: 1. To make good long-run decisions, managers need to know the cost of all resources (variable or fixed in the short-run) required to sell products to customers, taking into account only relevant costs for the specific decision. 2. Managers must balance the benefit of using a multiple cost-pool system against the cost of implementing it. Advances in IT technology make it more likely that a multiple cost-pool system will pass the cost-benefit test. 14-60
  • 59. What type of decision? What type of decision? What type of decision? Sales Variance Analysis 61 Cost Allocation Value Chain Analysis Sales Profitability AnalysisVCA-Customer linkages Learning outcome 6: Discuss why customer level costs differ across customers 6 (7&8) SMA
  • 60. 62  Level 1: Static-budget variance – the difference between an actual result and the static-budgeted amount - Ouch! – What happened? – How much did we make vs. expected (budget)?  Level 2: Flexible-budget variance – the difference between an actual result and the flexible-budgeted amount - Ouch! – what happened? - How much was due to change in contribution margin (rev – costs)?  Level 2: Sales-volume variance - How much was due to change in volume?  Level 3: Sales Quantity variance - How much was due to change in quantity?  Level 3: Sales Mix variance - How much was due to change in mix?  Level 4: Market Size variance - How much was due to change in market size?  Level 4: Market Share variance - How much was due to change in market share? Sales Variance Analysis Cost Allocation Value Chain Analysis Sales Profitability AnalysisVCA-Customer linkages MA
  • 61. 63  Measures shifts between selling more or less of higher or lower profitable products Budgeted Sales-Mix Percentage Actual Sales-Mix Percentage X Budgeted Contribution Margin per Unit Sales-Mix Variance = Actual Units of All Products Sold X Sales Variance Analysis Cost Allocation Value Chain Analysis Sales Profitability AnalysisVCA-Customer linkages Learning Objective 6: Subdivide the sales-volume variance into the sales-mix variance …the variance arises because actual sales mix differs from budgeted sales mix and the sales-quantity variance … this variance arises because actual total unit sales differ from budgeted total unit sales (P.591) 7
  • 62. 64 Budgeted Units of all Products Sold Actual Units of All Products Sold Budgeted Contribution Margin per Unit Sales- Quantity Variance = Budgeted Sales-Mix Percentage X X Sales Variance Analysis Cost Allocation Value Chain Analysis Sales Profitability AnalysisVCA-Customer linkages
  • 63. Level 2: Change in margin Change in volume Example: Flexible-budget and sales-volume variances 65 Cost Allocation Value Chain Analysis Sales Profitability AnalysisVCA-Customer linkages MA1
  • 64. Level 3: Change in mix – Which product makes you more money? Did you sell a higher or lower proportion of this product? Change in volume Example: Sales-mix and sales-quantity variances 66 Cost Allocation Value Chain Analysis Sales Profitability AnalysisVCA-Customer linkages 7
  • 65. What type of decision? What type of decision? What type of decision? Sales Variance Analysis 67 Cost Allocation Value Chain Analysis Sales Profitability AnalysisVCA-Customer linkages Learning outcome 6: Discuss why customer level costs differ across customers 7 8 MA1
  • 66. 68 Budgeted Market Share Actual Market Share X Budgeted Contribution Margin per Composite Unit for Budgeted Mix Market- Share Variance = Actual Market Size in Units X Do you have control over this? Market-share variance Cost Allocation Value Chain Analysis Sales Profitability AnalysisVCA-Customer linkages Learning Objective 6: Subdivide the sales- quantity variance into the market-share variance …the variance arises because actual market share differs from budgeted market share and the market-size variance … this variance arises because actual market size differ from budgeted market size (P.591) 8
  • 67. 69 Budgeted Market Size Actual Market Size Budgeted Contribution Margin per Composite Unit for Budgeted Mix Market-Size Variance = Budgeted Market Share X X 1. Management can only change what they can control? 2. So the value of information is dependent on how well you separate out those uncontrollable. 3. Do you have control over this? Market-size variance Cost Allocation Value Chain Analysis Sales Profitability AnalysisVCA-Customer linkages
  • 68. Which variance can you control? Example: Market-share and Market-size variance 70 Cost Allocation Value Chain Analysis Sales Profitability AnalysisVCA-Customer linkages 8
  • 69. What type of decision? What type of decision? What type of decision? Sales Variance Analysis 71 Cost Allocation Value Chain Analysis Sales Profitability AnalysisVCA-Customer linkages Learning outcome 6: Discuss why customer level costs differ across customers 7 8 MA1
  • 70. 72  Cost Allocation  Learning Objective 4: Understand criteria to guide cost-allocation decisions  Value Chain Analysis  VCA-Customer linkages  Learning Objective 1: Discuss why a company’s revenues and costs differ across customers  Learning Objective 2: Identify the importance of customer-profitability profiles  Learning Objective 3: Understand the cost-hierarchy-based operating income statement  Learning Objective 5: Discuss decision faced when collecting and allocating indirect costs to customers  Sales Profitability Analysis  Learning Objective 6: Subdivide the sales-variance into the sales-mix variance and the sales-quantity variance into the market share variance and the market size variance Week 3: Learning objective summary Cost Allocation Value Chain Analysis Sales Profitability Analysis
  • 72. Activity-based management Implementation Model 74 ABM Model Systems Planning Identify, Define, and Classify Activities Reduce Costs Improve Decisions Increase Profitability ABC 1. Continuous improvement (PVA) 2. Product design (eg complexity drivers) 3. Improved decision making 4. Accurate cost info (VCA)(ABC) a. Products (MA1) b. Customers (eg setup drivers) c. Suppliers PVA Assess Value Content of Activities Define Root Causes of Each Activity Establish Activity Performance Measures Search for Improvement Opportunities Part 1 – Week 2 Part 2 – Week 3 Assign Resource Cost to Activities Identify Cost Objects and Define Activity Drivers Calculate Activity Rates Assign Costs to Cost objects Product design Value engineering Design analysis Functional analysis Cost Allocation Value Chain Analysis Sales Profitability AnalysisVCA-Customer linkages 74
  • 73. 75 Customer Profitability Analysis Customer Revenue Analysis Customer Cost Analysis Cost Allocation Value Chain Analysis Sales Profitability AnalysisVCA-Customer linkages Additional Example
  • 74. 76 Customer Profitability Analysis Customer Revenue Analysis Customer Cost Analysis Cost Allocation Value Chain Analysis Sales Profitability AnalysisVCA-Customer linkages
  • 75. 77 Customer Revenue Analysis  Customer revenue analysis considers all activities that affect the net amount received from the customers  Customer revenue analysis traces prices and discounts (including sales and cash discounts) to customers and identifies financing costs associated with customer revenues Cost Allocation Value Chain Analysis Sales Profitability AnalysisVCA-Customer linkages
  • 76. 78 Example 3: Customer Revenue Analysis Cost Allocation Value Chain Analysis Sales Profitability AnalysisVCA-Customer linkages
  • 77. 79 Example 3: Customer Revenue Analysis Insert Exhibit 5.18 Cost Allocation Value Chain Analysis Sales Profitability AnalysisVCA-Customer linkages
  • 78. 80 Customer Profitability Analysis Customer Revenue Analysis Customer Cost Analysis Cost Allocation Value Chain Analysis Sales Profitability AnalysisVCA-Customer linkages
  • 79. 81  Not all customers require the same type of activities. Examples of customer-specific activities include:  order processing costs  billing, collection and payment processing costs  accounts receivable and carrying costs  customer service costs  return or allowance processing costs  restocking costs  selling and marketing costs Customer Cost Analysis Cost Allocation Value Chain Analysis Sales Profitability AnalysisVCA-Customer linkages
  • 80. 82  Customer cost analysis identifies activities and cost drivers to service customers  Traditionally, these costs are hidden in the customer support, marketing, and sales function  Customer cost can be classified into the following categories: 1. customer unit-level cost 2. customer batch-level cost (e.g. order size) 3. customer-sustaining cost (e.g. visits) 4. distribution-channel cost (e.g. com vs. retail) 5. sales-sustaining costs (e.g. maintaining firm sales capability) Customer Cost Analysis Cost Allocation Value Chain Analysis Sales Profitability AnalysisVCA-Customer linkages
  • 81. 83 Example 3: Customer Cost Analysis Insert Exhibit 5.19 (Customer-Related Activity) Here Cost Allocation Value Chain Analysis Sales Profitability AnalysisVCA-Customer linkages
  • 82. 84 Insert Exhibit 5.20 Example 3: Customer Cost Analysis Which customer has higher batch level (order) activity costs? Which customer has higher customer sustaining level (visits) activity costs? Cost Allocation Value Chain Analysis Sales Profitability AnalysisVCA-Customer linkages
  • 83. 85 Example 3: Customer Cost Analysis Insert Exhibit 5.21 Cost Allocation Value Chain Analysis Sales Profitability AnalysisVCA-Customer linkages
  • 84. 86 Customer Profitability Analysis Customer Revenue Analysis Customer Cost Analysis Cost Allocation Value Chain Analysis Sales Profitability AnalysisVCA-Customer linkages
  • 85. 87 Insert Exhibit 5.22 Example 3: Customer Revenue + Customer Cost = Customer Profitability Analysis Cost Allocation Value Chain Analysis Sales Profitability AnalysisVCA-Customer linkages
  • 86. Activity-based management Implementation Model 88 ABM Model Systems Planning Identify, Define, and Classify Activities Reduce Costs Improve Decisions Increase Profitability ABC 1. Continuous improvement (PVA) 2. Product design (eg complexity drivers) 3. Improved decision making 4. Accurate cost info (VCA)(ABC) a. Products (MA1) b. Customers (eg setup drivers) c. Suppliers PVA Assess Value Content of Activities Define Root Causes of Each Activity Establish Activity Performance Measures Search for Improvement Opportunities Part 1 – Week 2 Part 2 – Week 3 Assign Resource Cost to Activities Identify Cost Objects and Define Activity Drivers Calculate Activity Rates Assign Costs to Cost objects Product design Value engineering Design analysis Functional analysis Cost Allocation Value Chain Analysis Sales Profitability AnalysisVCA-Customer linkages 88