Download as PDF, PPTX


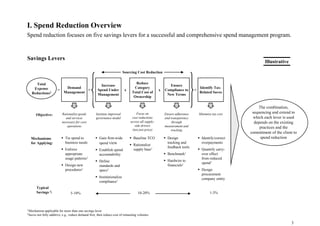


The document provides guidance on conducting a spend reduction project. It outlines a six-step approach including establishing a spend baseline, assessing the supply chain, performing a market analysis, rationalizing spend, recovering overpayments, and implementing improvements. The goal is to reduce operating expenses on purchased goods and services through various levers such as demand management, strategic sourcing, and tax minimization. Spend reduction can typically save 10-25% and identifies both short and long-term cost reduction opportunities.


](https://cdn.slidesharecdn.com/ss_thumbnails/salesinstitute110119v3read-only1-120514015157-phpapp02-thumbnail.jpg?width=640&height=640&fit=bounds)


