SlideShare a Scribd company logo
1 of 8
Download to read offline
An Interactive Visualization of Crosslinguistic Colexification Patterns
Thomas Mayer1
, Johann-Mattis List1
, Anselm Terhalle2
, Matthias Urban3
1
Philipps-Universität Marburg, 2
Heinrich-Heine-Universität Düsseldorf, 3
Universiteit Leiden
thomas.mayer@uni-marburg.de, mattis.list@uni-marburg.de,
terhalle@phil.uni-duesseldorf.de, m.urban@hum.leidenuniv.nl
Abstract
In this paper, we present an interactive web-based visualization for the CLICS database, an online resource for synchronic lexical
associations (colexification patterns) in over 200 language varieties. The associations cover 1,288 concepts and represent the tendency
for concepts to be expressed by the same words in the same languages and language varieties of the world. The complexity of the
network structure in the CLICS database calls for a visualization component that makes it easier for researchers to explore the patterns
of crosslinguistic colexifications. The network is represented as a force-directed graph and features a number of interactive components
that allow the user to get an overview of the overall structure while at the same time providing an opportunity to look into the data in
more detail. An integral part of the visualization is an interactive listing of all languages that contribute to the strength of a given pattern
of colexification. Each language in the list is thereby attributed a different color depending on its genealogical or areal affiliation. In this
way, given associations can be inspected for genealogical or areal bias.
Keywords: interactive visualization, colexification, crosslinguistic database
1. Introduction
What does ‘good’ have to do with ‘beautiful’? Logically,
not everything that is good is beautiful, and not everything
that is beautiful is good. However, people seem to associate
these concepts quite strongly, as linguistic data suggest:
‘good’ and ‘beautiful’ are expressed as identical words in
at least 27 languages from 8 different language families. To
assess the cognitive, linguistic, and cultural implications of
this fact correctly, additional information would be useful:
Where are these languages located on the globe? How are
they distributed among the 8 families? Which other con-
cepts are verbalized by the same form as ‘good’ and ‘beau-
tiful’?
Synchronic lexical association or colexification, i.e., the
verbalization of two or more concepts by means of the same
form in a given language, for instance, the words expressing
both the notions ‘good’ and ‘beautiful’ mentioned above,
is an important source of information for investigations in
cognitive linguistics, linguistic typology, and historical se-
mantics. In this paper, we present an interactive web-based
visualization for CLICS, an online database that contains a
large crosslinguistic data set on colexifications worldwide.
We provide a brief outline of CLICS, describe the function-
alities of the visualization, and show that the visualization is
an indispensable tool that provides researchers an overview
of the data and allows them to concisely plan further quan-
titative analyses according to their needs.
2. CLICS
CLICS (Crosslinguistic Colexifications, http:
//clics.lingpy.org) is an online database of
synchronic lexico-semantic associations in 221 languages
and language varieties of the world. CLICS exploits
already existing large online lexical databases, but has the
advantage that it makes visible the relationships between
meanings and forms in the object languages, something
Concept IDS key Families Languages
money 11.43 15 33
coin 11.44 9 13
iron 9.67 3 3
gold 9.64 2 2
tin, tinplate 9.69 2 2
white 15.64 2 2
blunt, dull 15.79 1 1
bright 15.57 1 1
chest 4.40 1 1
clock, timepiece 14.53 1 1
copper, bronze 9.66 1 1
earring 6.77 1 1
hammer 9.49 1 1
helmet 20.33 1 1
jewel 6.72 1 1
lead (noun) 9.68 1 1
price 11.87 1 1
razor 6.93 1 1
saw 9.48 1 1
Table 1: Common colexifications involving the con-
cept ‘silver’ in CLICS. Concepts which are expressed by
the same word form in more than one language fam-
ily are shaded gray. In order to browse the table on
the CLICS website, use the following URL: http://
clics.lingpy.org/all.php?gloss=silver.
which is not easily possible using the interfaces of its
sources themselves. Table 1 gives an example of the basic
structure of the data in CLICS.
2.1. Homonymy, polysemy, and colexification
A well-known concept from lexical semantic analysis is
that of polysemy. It refers to the situation in which a lex-
ical item possesses more than one identifiable sense be-
tween which there is a conceptual relation. A number of
tests are available to distinguish polysemy from semantic
vagueness, in which a division into distinct senses is not
warranted. From an analytical perspective, polysemy has
to be further distinguished from homonymy and contextual
variation. Homonymy refers to the “accidental” verbaliza-
tion of at least two meanings by the same sound chain,
without any conceptual relation that is more than coinci-
dental. Contextual variation designates the adaption of a
lexicalized meaning to contextual factors in an utterance.
Although historical and synchronic criteria have been pro-
posed to distinguish polysemy from homonymy, and con-
textual variation can be tested by resorting to categorization
(Blank, 1997), the differentiation depends on the individual
analysis of every single word and is not entirely objective.
Hence, it is difficult for quantitative investigations to pro-
vide this differentiation in advance. Here, we use the term
colexification (originally from François, 2008) to refer to
the situation in which two or more of the meanings in our
sources correspond to the same lexical item in one of the
languages. For instance, we would say that in Wayuu (an
Arawak language of Venezuela), anas1 colexifies ‘good’
and ‘beautiful.’1
Colexification is thus a deliberately am-
biguous label that allows us to avoid making a commitment
in each case as to the adequate lexical semantic analysis.
Roughly speaking, colexification can correspond either to
polysemy or contextual variation in lexical semantic analy-
ses. Since CLICS is not based on such analyses that would
allow us to further discriminate between the two, we chose
colexification as a label that deliberately does not make a
commitment with regard to this distinction. However, as
we will show below, quantitative approaches are available
to rule out effects of accidental homonymy.
2.2. CLICS’ data and sources
CLICS (Version 1.0) offers information on colexification
in 221 different language varieties covering 64 different
language families.2
All language varieties in our sample
comprise a total of 301,498 words covering 1,280 differ-
ent concepts.3
Using a strictly automatic procedure, we
identified 45,667 cases of colexification that correspond to
16,239 different links between the 1,280 concepts covered
by our data.
At present, four sources feed into CLICS: (1) The Intercon-
tinental Dictionary Series (IDS, Key and Comrie, 2007),
offering lexical data for 233 languages and language va-
rieties. Ideally, datasets for each language contain 1,310
entries, though coverage differs in completeness for in-
dividual languages. Of all 233 languages in IDS, 178
were automatically cleaned and included in CLICS. (2) The
World Loanword Database (WOLD, Haspelmath and Tad-
1
See also the example of ‘money’ and ‘silver’ in the case study
in Section 3.5. below.
2
This count includes 12 language isolates, and 3 unclassified
languages, according to the classification schema of Ethnologue
(Lewis and Fennig, 2013).
3
Since some concepts are expressed by more than one word in
the respective languages, the number of words is higher than the
expected one (282,880) if multiple synonyms per concept were
not allowed.
mor, 2009), the main goal of which has to do with identi-
fying lexical borrowings, but which nevertheless also pro-
vides general lexical data for 41 languages. The vocabu-
laries for the individual languages differ somewhat in their
size, ranging somewhere between 1,000 and 2,000 items.
33 of the 41 vocabularies are included in CLICS. (3) Data
for four languages represented neither in IDS nor WOLD
were added from the LOGOS dictionary (http://www.
logosdictionary.org), a multilingual online dictio-
nary. (4) Additional data for six Himalayan languages was
taken from the Språkbanken project (University of Gothen-
burg, http://spraakbanken.gu.se).4
2.3. Network modeling of CLICS
As mentioned above, there is no guarantee that lexical asso-
ciations within CLICS reflect conceptual associations. For
example, there are three attested links between the concepts
‘arm’ and ‘poor’ in the current version of CLICS, which are
due to homonymy in some Germanic languages (German,
Dutch, and Yiddish).
In order to distinguish strong association tendencies from
spuriously occurring associations and to rule out cases of
accidental homonymy, List et al. (2013) model cross-
linguistic colexification data as a weighted network in
which nodes represent concepts and weighted edges be-
tween the nodes represent the number of attested colexi-
fications in the data. With the help of community detection
analyses, strongly interconnected regions in the colexifica-
tion network can be identified. Communities are groups of
nodes in a network ‘within which the connections are dense
but between which they are sparser’ (Newman, 2004). List
et al. (2013) apply a weighted version of the community de-
tection algorithm by Girvan and Newman (2002) to a cross-
linguistic colexification network consisting of 1,252 con-
cepts translated into 195 languages covering 44 language
families. Their analysis yielded a total of 337 communities,
with 104 communities consisting of 5 and more nodes and
covering 68% of all concepts. A qualitative survey of the
largest communities showed that most of them constitute
meaningful units and accidental homologies were success-
fully excluded.
2.4. Limitations and caveats
The data structure in CLICS directly mirrors the data struc-
ture of the sources we used. We did not manipulate or rean-
alyze the data in any way, to the effect that the reliability of
CLICS is greatly dependent on the reliability of its sources.
Additionally, it should be pointed out that we also cannot
rule out the possibility of artifacts arising from automatic
data cleaning in cases where textual coding of the data was
inconsistent. As for its actual application, it also must be
borne in mind that CLICS reflects a certain bias regarding
the geographical locations of the languages included in its
sources: IDS features many languages from South America
and the Caucasus, while WOLD includes a disproportion-
ate percentage of European languages. Hence, the sheer
frequency of instances of a particular colexification pattern
4
In all cases, we ignored protolanguages and archaic languages
(like Latin and Ancient Greek), and those languages which did not
have enough coverage in terms of lexical items.
in CLICS may be misleading insofar as a pattern may seem
very robust crosslinguistically, but actually is so only in cer-
tain regions of the world. We have not implemented any
computational method in CLICS to balance out the picture
a posteriori. Since we nevertheless want to present poten-
tial users of CLICS with the possibility to assess possible
areal patterns in the data, we include a powerful visualiza-
tion that enables them to detect areal imbalances in colexi-
fication patterns in individual cases themselves.
3. Visualization
The CLICS database is available online at http://
clics.lingpy.org and offers its users a search inter-
face to all concepts and crosslinguistic colexifications be-
tween concepts. The wealth of information in the database
and the various possibilities of exploring the colexifications
in the network call for an additional component that makes
potentially interesting observations more easily accessible
to the researcher. The idea was to equip the database with
a visualization component that provides various interactive
functionalities and enables users to navigate through the
networks of colexifications while at the same time provid-
ing more detailed information on the actual language data.
3.1. Web-based visualization
We opted for a web-based implementation of the CLICS
visualization in JavaScript using the D3 library (Bostock
et al., 2011). The main benefits of a web-based visualiza-
tion are its platform independence and the fact that users
can access it from any device with a browser supporting
JavaScript. There is no need for the installation of addi-
tional software or for maintenance of the system on the part
of the user (Murray, 2010). In addition, links to the de-
scriptions of the external resources can easily be included
to allow users to explore the CLICS data in more detail on
demand.
3.2. Data preparation
In its current form, the data in CLICS yields a small world
network in which all nodes are densely connected. Brows-
ing such a dense network is very confusing and provides
few insights for the user (see Figure 1). In order to break
down the complexity inherent in CLICS, we employed two
different strategies to present the data from two different
perspectives. According to our first strategy, we decided to
split the data into communities first. Starting from 1,280
concepts in CLICS which were connected to at least one
other concept, we applied the Infomap algorithm by Ros-
vall and Bergstrom (2008) to cluster all concepts into com-
munities. The Infomap algorithm requires that weights are
defined for the edges of the network. Here we used the
number of attested language families per colexification as
edge weights. Following a suggestion by Dellert (2014) we
further normalized the number of attested language families
with the help of Formula 1:
W =
C2
OA + OB − C
, (1)
where C is the number of attested language families for
the colexification of concept A and concept B, OA is the
number of language families in which concept A occurs,
and OB is the number of language families in which con-
cept B occurs. The Infomap algorithm was chosen because
of its remarkable performance on the community detection
task, both in terms of computation time and quality of re-
sults (Lancichinetti and Fortunato, 2009). With the help
of this analysis, it was possible to subdivide the 1,280 con-
cepts into 271 communities. Of these communities, 118 are
large, containing more than five nodes. The large commu-
nities cover 65% (828) of all nodes in the original network
(1,280). In order to enable the user to quickly identify com-
munities of specific interest, we labeled all communities by
taking the concept with the highest degree as representative.
The communities do not differ much in size, ranging from
2 (‘men’s house’) to 16 concepts (‘fur’) with an average of
4.72 concepts per community.
The advantage of the community perspective on CLICS is
that it provides an independent automatic clustering of the
data. The disadvantage is that this preselection deprives
the user of finding alternative, possibly interesting connec-
tions between the concepts. Community detection meth-
ods are not error-proof, and their performance varies de-
pending on the algorithms being used and the data being
analyzed. Even more importantly, most community detec-
tion methods are based on restricted decisions when clus-
tering the nodes of a given network into groups. Every
node is assigned to one community only. No transitions
between communities are possible. In order to offer a less
biased perspective on the network, we decided to extract
subgraphs for each concept in the data showing its strongest
connections up to a certain depth of resolution. The individ-
ual subgraphs were constructed as follows: starting from a
given concept, we first searched for all of its direct neigh-
bors with which it shared at least 5 colexifications in five
different language families. The same procedure was ap-
plied to all neighbors which were added to the subgraph
in the first run and repeated two times. If the resulting
graph for a given concept was too small, a relaxed thresh-
old of 4 colexifications in four different language families
was used. In the resulting subgraphs, the longest possible
path length between the selected concept and all other con-
cepts is 3. Having excluded 280 subgraphs in which no
stronger links between the selected concept and any other
concept could be found, this procedure left us with 1,000
individual subgraphs of individual size and structure, rang-
ing from 56 nodes (selected concept ‘take’) to 2 (selected
concept ‘north’). When browsing the network representa-
tion of the data, the user can select between both perspec-
tives on the data in CLICS, the community perspective, and
the perspective of the strongest connections.
3.3. Interactive functionalities
The visualization features various interactive functionali-
ties that are designed to enhance the exploration of the
CLICS data at the level of communities or strongest con-
nections. The main component is a flexible force-directed
graph layout that displays the concepts as nodes and the
crosslinguistic colexifications as edges (see Figure 2). The
strength of the force in the edges of the graph is dependent
on the number of language families that can be attested to
having lexical associations for the respective concepts that
are linked through the edge. As mentioned in the previ-
ous section, we decided to provide two different views on
the network, one for separate communities obtained from
the Infomap analysis (Rosvall and Bergstrom, 2008), and
one in which the subgraph containing the strongest links for
each concept is displayed. With the help of the web inter-
face for network browsing (http://clics.lingpy.
org/browse.php) the user can look up the respective
subgraphs by selecting the concept of interest and specify-
ing the desired ‘view.’
The force-directed graph layout ensures that all concepts
are neatly arranged according to their similarity as defined
by the number of crosslinguistic colexifications. As a re-
sult, concepts that are highly connected are located close to
each other. To make it easier for users to explore the net-
work that is depicted in the graph, concepts can be dragged
to different positions where there is less overlap. The drag-
ging behavior of a concept is activated when mousing over
the respective node in the graph (when the cursor symbol
turns into a cross hair).
As mentioned above, the edges of the graph represent the
number of cases of crosslinguistic colexifications for the
linked concepts. For a more detailed view on which lan-
guages contribute to the strength of the connections, the
user can mouse over the links in the graph to see the forms
in the individual languages responsible for the associative
link (Figure 3). The list includes additional information on
the languages such as their ISO 639-3 language code and
family. Furthermore, each entry in the list provides a hy-
perlink to the original source from where the information is
taken.
Each language in the list is attributed a different back-
ground color depending on its language family or location
Figure 1: Full network of all 1,288 concepts in CLICS
(outer circle) together with their connections. The strength
of the connections is marked in different colors, with very
strong links represented in red
Figure 2: Force-directed graph with mouse-over function-
alities highlighting all connected concepts. In order to
browse the graph on the CLICS website, use the following
URL: http://clics.lingpy.org/browse.php?
gloss=earth,%20land.
in order to allow for an at-a-glance overview of all lan-
guages in the list. The user can choose from a drop-down
menu whether to include the genealogical or areal informa-
tion as the background color. For the genealogical infor-
mation, all language families are attributed a different color
value. Languages belonging to the same language families
are therefore given the same background color. Moreover,
the list is sorted according to language families. In this
way, the user can immediately see how many languages of
a given family contribute to the overall strength for the con-
nection at hand.
As to the areal information, the world map is provided with
a color gradient as shown in Figure 4. To this end, each po-
sition in the world map is attributed a color value using the
L*a*b* color space. The color hue thereby indicates the
position on the map in terms of the longitude (specifying
the east-west position) whereas the lightness of the color
represents the position in terms of the latitude information
(specifying the north-south position).5
The mapping from
geolocation to color values allows for an easier evaluation
of areal patterns in the selected connection. In this regard,
users can directly detect whether a certain pattern of colex-
ification is restricted to a certain region of the world or con-
stitutes a more widespread colexification pattern (see the
case study in Section 3.5. below). In addition, all languages
in the list are displayed with their geographical location on
a world map (see Figure 3). Hence, areal patterns can be di-
rectly compared to the genealogical information in the list
(if the first option is chosen).
In addition to the interactive functionalities described
above, the visualization also features a variety of further
components that allow for an easier exploration of the
database. The graph layout is equipped with panning and
5
See Mayer et al. (2014) for a different approach of a linguis-
tically informed color gradient of the world map.
Figure 3: Force-directed graph with mouse-over functionalities showing the strongest links of the concept ‘money.’ The
entries have different background colors depending on their location in the world map (cf. Figure 4). In order to browse
the graph on the CLICS website, use the following URL: http://clics.lingpy.org/browse.php?gloss=
money&view=part.
Figure 4: World map with color gradient. The color repre-
sents the location where a language is spoken (see Figure
3 where the background color identifies the location of the
language)
zooming functionality that enables the user to navigate
through the network graph. Panning is enabled when the
cursor changes into a hand symbol when mousing over a
link of the graph. The whole graph can then be dragged
to a new position. The zooming behavior is activated with
the scroll wheel. When mousing over a concept (node) in
the graph all connected links and concepts are highlighted
in order to provide a better overview of the connectivity of
certain concepts (see Figure 2). The control panel of the
visualization also includes a slider button that allows the
user to show only those edges in the graph with a minimum
number of crosslinguistic colexifications.
3.4. Implementation
The visualization is implemented in JavaScript using the
D3 library (Bostock et al., 2011).6
The force-directed
graph is generated with the force() function from the
d3.layout module. The layout implementation uses
position Verlet integration for simple constraints (Dwyer,
2009).7
In order to ensure that the concept labels are lo-
cated close to the concept nodes, a second force layout
(with a static weight of 1) is set up for each concept link
to the node.
The color values for the world map gradient scale are com-
puted from the two-dimensional geographical coordinates
that are given as an input. The latitude [-90;90] and lon-
gitude [-180;180] values are thereby normalized between
[0;1] and serve as the input for the function cl2pix.8
function cl2pix(c,l){
var TAU = 6.2831853
var L = l*0.61 + 0.09;
var angle = TAU/6.0 - c*TAU;
var r = l*0.311 + 0.125
var a = Math.sin(angle)*r;
var b = Math.cos(angle)*r;
return [L,a,b];
6
http://d3js.org
7
See https://github.com/mbostock/d3/wiki/
Force-Layout for a description of the implementation.
8
The code was adapted from the GNU C code by David Dal-
rymple (http://davidad.net/colorviz/, accessed on
January 25, 2014) and translated into JavaScript.
};
The actual HTML color code is generated with the function
d3.lab from the D3 library, which takes the three values
for [L,a,b] as input. The main reason for choosing the
L*a*b* color space is a smoother transition between dif-
ferent color hues without any visible boundaries. As can
be seen in Figure 5, the color gradient in the L*a*b* color
space exhibits a much smoother perceptual transition be-
tween the color hues on the y-axis. For the coloring of
the language families, the background colors are gener-
ated with the categorical scale functions of the d3.scale
module.
Figure 5: Comparison between two-dimensional color gra-
dients in the L*a*b* (right) and HSV (left) color space.
The dragging and panning functionalities of the graph
are implemented with the drag() function from the
d3.behavior module and the SVG transform and
translate attributes. The interactive world map is gen-
erated with the topojson package and makes use of the
d3.geo projection module.
3.5. Case studies
In order to illustrate the usefulness of the visualization for
the purposes of exploring the database, consider the graph
in Figure 3. Among other things, it contains the connec-
tion between the concepts ‘money’ and ‘silver.’ A subset of
the languages and words contributing to this connection are
shown on the left where the background color represents
the location of the languages. For instance, French con-
tributes to the crosslinguistic colexification because both
concepts are realized by the same word (viz. argent) in
that language. When looking at the areal distribution of the
languages, a clear pattern emerges at a glance (see Figure
6 for the full list of languages showing this colexification
pattern). Most of the languages contributing to the colexi-
fication are from two major regions: Caucasus (marked in
blue) and South America (marked in green). However, as
mentioned in Section 2.4., this distribution might be an ar-
tifact of the general bias for languages of the Caucasus and
South America in the underlying databases. In any case,
the visualization directly points the attention to this pattern.
As the aim of the visualization component is not to replace
linguistic research but to guide it, such patterns have to be
looked at in more detail by checking the actual data.
Figure 6: Languages and words contributing to the connec-
tions of lexical associations for the concepts ‘money’ and
‘silver’
Another example deals with the colexification of the con-
cepts ‘wheel’ and ‘foot.’ In contrast to the case of ‘money’
and ‘silver’ above, these concepts at first glance may not
immediately suggest a close association. Yet such cases
do exist as the link in Figure 7 reveals. The connection
links two bigger communities of nodes, including spheri-
cal objects on the one hand and parts of the lower body on
the other. The list of languages for the connection ‘wheel’
and ‘foot’ in Figure 7 clearly shows that the association is
restricted to languages of South America. This geographi-
cal restriction may reflect semantic borrowing among South
American languages, but since the distribution within South
America is rather erratic, independent innovation is also a
possibility. At any rate, the color coding in the visualization
immediately draws the researcher’s attention to the poten-
tially interesting geographical patterning.
4. Conclusions and future work
The size and complexity of today’s language resources call
for a data preparation pipeline that enables researchers to
find meaningful patterns among the multitude of different
factors that can be taken into consideration. In our view,
such a data preparation pipeline necessarily consists of two
major parts, both of which are illustrated in the present pa-
Figure 7: Force-directed graph with areal distribution for the concepts ‘wheel’ and ‘foot.’ In order to browse the graph
on the CLICS website, enter the following URL: http://clics.lingpy.org/browse.php?gloss=wheel&
view=part.
per. On the one hand, methods and techniques from data
mining or computational linguistics help to detect basic
trends or groups of similar objects in the search space. On
the other hand, the resulting groups or trends are mapped to
visual variables in order to make interesting observations
readily accessible to human perception.
The CLICS database contains a wealth of information about
colexification patterns in the languages of the world. Man-
ually inspecting the large amount of connections in the
database, however, is a laborious and time-consuming task
that allows for a detailed exploration of individual links
but does not capture overall trends in the data. This paper
presents an attempt to combine the advantages of human
inspection with the strength of a computational approach
(Keim et al., 2008).
The CLICS visualization features an automatic preprocess-
ing of the colexification links into so-called communities
on the graph, groups of highly connected nodes that re-
veal a meaningful overall trend in the worldwide patterns
of lexical associations. The communities are then graph-
ically represented in a force-directed graph that shows all
connections within the various concepts that are included.
Interactive components in the visualization allow for a more
detailed view of associations at the level of the languages
that contribute to the colexification. Mapping the genealog-
ical and areal information on individual languages to colors
enables an at-a-glance evaluation of potentially interesting
trends in individual colexifications (see the case studies in
Section 3.5.). In this way, users can get an overview of the
general trends in the data and at the same time have the
opportunity to directly inspect the lexical associations.
In future work, we plan to enhance the visualization tool
with further interactive components that allow for a better
overview of the complete network of colexifications (shown
in Figure 1) and facilitate the detection of genealogical or
areal trends in the database. The idea is to integrate a
sunburst visualization (Stasko and Zhang, 2000) of the ge-
nealogical information in order to enable a better overview
of the language families that are involved in a given colexi-
fication pattern.9
In addition, we intend to equip the user in-
terface with further interactive components that allow users
to explore the database from different perspectives (e.g.,
compare individual languages in terms of shared lexical as-
sociations). All components will be made publicly avail-
able online for the (linguistic) research community.
5. Acknowledgements
This work was supported by the German Research Founda-
tion (DFG project ‘Algorithmic corpus-based approaches to
typological comparison’ and DFG CRC 991 ‘The structure
of representations in language, cognition, and science’) and
the European Research Council (ERC starting grant 240816
‘Quantitative modelling of historical-comparative linguis-
tics,’ and ERC advanced grant 103891 ‘The linguistic past
of Mesoamerica and the Andes’).
9
See Mayer et al. (2014) for an example of using sunburst dis-
plays to represent the hierarchical structure of language families.
6. References
Blank, A. (1997). Prinzipien des Bedeutungswandels
am Beispiel der romanischen Sprachen. Niemeyer,
Tübingen.
Bostock, M., Ogievetsky, V., and Heer, J. (2011).
D3: Data-driven documents. IEEE Transactions on
Visualization & Computer Graphics (Proc. InfoVis),
17(12):2301–2309.
Dellert, J. (2014). Lifting a large multilingual dictionary to
the level of concepts. Talk held at the “Workshop on his-
torical and empirical evolutionary Linguistics” (February
15–16, 2014, Eberhard-Karls-Universität Tübingen).
Dwyer, T. (2009). Scalable, versatile and simple con-
strained graph layout. In Proceedings of the 11th Eu-
rographics / IEEE - VGTC Conference on Visualization,
EuroVis’09, pages 991–1006, Aire-la-Ville, Switzerland.
Eurographics Association.
François, A. (2008). Semantic maps and the typology of
colexification: intertwining polysemous networks across
languages. In Vanhove, M., editor, From polysemy to se-
mantic change, pages 163–215. Benjamins, Amsterdam.
Girvan, M. and Newman, M. E. (2002). Community struc-
ture in social and biological networks. Proceedings of
the National Academy of Sciences of the United States of
America, 99(12):7821–7826.
Haspelmath, M. and Tadmor, U. (2009). World Loanword
Database. Max Planck Digital Library, Munich.
Keim, D. A., Andrienko, G., Fekete, J.-D., Görg, C.,
Kohlhammer, J., and Melançon, G. (2008). Visual an-
alytics: definition, process, and challenges. In Ker-
ren, Andreas, Stasko, John T., Fekete, Jean-Daniel, and
North, Chris, editors, Information Visualization, pages
154–175. Berlin: Springer Verlag.
Key, M. R. and Comrie, B. (2007). IDS – The Inter-
continental Dictionary Series. Springer, Berlin, URL:
http://lingweb.eva.mpg.de/ids/.
Lancichinetti, A. and Fortunato, S. (2009). Community de-
tection algorithms: a comparative analysis. Physical Re-
view E, 80(5 Pt 2):056117.
Lewis, M. P. and Fennig, C. D., editors. (2013). Eth-
nologue. SIL International, Dallas, 17 edition. URL:
http://www.ethnologue.com.
List, J.-M., Terhalle, A., and Urban, M. (2013). Using
network approaches to enhance the analysis of cross-
linguistic polysemies. In Proceedings of the 10th In-
ternational Conference on Computational Semantics –
Short Papers, pages 347–353, Stroudsburg. Association
for Computational Linguistics.
Mayer, T., Wälchli, B., Rohrdantz, C., and Hund, M.
(2014). From the extraction of continuous features
in parallel texts to visual analytics of heterogeneous
areal-typological datasets. In Language Processing and
Grammars. The role of functionally oriented computa-
tional models, pages 13–38. John Benjamins.
Murray, S. (2010). Interactive Data Visualization for the
Web. O’Reilly Media, Inc.
Newman, M. E. J. (2004). Analysis of weighted networks.
Physical Review E, 70(5):056131.
Rosvall, M. and Bergstrom, C. T. (2008). Maps of random
walks on complex networks reveal community structure.
Proc. Natl. Acad. Sci. U.S.A., 105(4):1118–1123.
Stasko, J. and Zhang, E. (2000). Focus+context display
and navigation techniques for enhancing radial, space-
filling hierarchy visualizations. In Proceedings of the
IEEE Symposium on Information Vizualization 2000, IN-
FOVIS ’00, pages 57–65, Washington, DC, USA. IEEE
Computer Society.

More Related Content

Similar to An Interactive Visualization Of Crosslinguistic Colexification Patterns

Lost in Translation - Gabriel Emanuel Borlean
Lost in Translation - Gabriel Emanuel BorleanLost in Translation - Gabriel Emanuel Borlean
Lost in Translation - Gabriel Emanuel BorleanGabriel Borlean (CCNP, CCDP)
 
An Outline Of Type-Theoretical Approaches To Lexical Semantics
An Outline Of Type-Theoretical Approaches To Lexical SemanticsAn Outline Of Type-Theoretical Approaches To Lexical Semantics
An Outline Of Type-Theoretical Approaches To Lexical SemanticsTye Rausch
 
AMBIGUITY-AWARE DOCUMENT SIMILARITY
AMBIGUITY-AWARE DOCUMENT SIMILARITYAMBIGUITY-AWARE DOCUMENT SIMILARITY
AMBIGUITY-AWARE DOCUMENT SIMILARITYijnlc
 
Your Annotated Bibliography must have 8 sources. Please go back to t.docx
Your Annotated Bibliography must have 8 sources. Please go back to t.docxYour Annotated Bibliography must have 8 sources. Please go back to t.docx
Your Annotated Bibliography must have 8 sources. Please go back to t.docxbudbarber38650
 
Language structure is partly by social structure
Language structure is partly by social structureLanguage structure is partly by social structure
Language structure is partly by social structureSpanishinBuenosAires
 
Co word analysis
Co word analysisCo word analysis
Co word analysisdebolina73
 
UNIVERSALITY IN TRANSLATION: AN ANALYSIS OF TRANSLATION INTERFERENCE IN MULTI...
UNIVERSALITY IN TRANSLATION: AN ANALYSIS OF TRANSLATION INTERFERENCE IN MULTI...UNIVERSALITY IN TRANSLATION: AN ANALYSIS OF TRANSLATION INTERFERENCE IN MULTI...
UNIVERSALITY IN TRANSLATION: AN ANALYSIS OF TRANSLATION INTERFERENCE IN MULTI...John1Lorcan
 
FinalDraftRevisisions
FinalDraftRevisisionsFinalDraftRevisisions
FinalDraftRevisisionsJoshua StGeorge
 
Macrolinguistics & Contrastive Analysis
Macrolinguistics & Contrastive AnalysisMacrolinguistics & Contrastive Analysis
Macrolinguistics & Contrastive Analysiszahraa Aamir
 
How do we generate spoken words This issue is a fasci-natin.docx
How do we generate spoken words This issue is a fasci-natin.docxHow do we generate spoken words This issue is a fasci-natin.docx
How do we generate spoken words This issue is a fasci-natin.docxwellesleyterresa
 
Annotating A Low-Resource Language With LLOD Technology Sumerian Morphology ...
Annotating A Low-Resource Language With LLOD Technology  Sumerian Morphology ...Annotating A Low-Resource Language With LLOD Technology  Sumerian Morphology ...
Annotating A Low-Resource Language With LLOD Technology Sumerian Morphology ...Scott Bou
 
Lexicon Disambiguation1
Lexicon Disambiguation1Lexicon Disambiguation1
Lexicon Disambiguation1Sead Spuzic
 
Computer assisted text and corpus analysis
Computer assisted text and corpus analysisComputer assisted text and corpus analysis
Computer assisted text and corpus analysisRubyaShaheen
 
1 Distributive And Semantic Interpretation Of Macedonian Pronominal Clitics ...
1 Distributive And Semantic Interpretation Of Macedonian Pronominal Clitics  ...1 Distributive And Semantic Interpretation Of Macedonian Pronominal Clitics  ...
1 Distributive And Semantic Interpretation Of Macedonian Pronominal Clitics ...James Heller
 
LEARNING CROSS-LINGUAL WORD EMBEDDINGS WITH UNIVERSAL CONCEPTS
LEARNING CROSS-LINGUAL WORD EMBEDDINGS WITH UNIVERSAL CONCEPTSLEARNING CROSS-LINGUAL WORD EMBEDDINGS WITH UNIVERSAL CONCEPTS
LEARNING CROSS-LINGUAL WORD EMBEDDINGS WITH UNIVERSAL CONCEPTSijwscjournal
 
LEARNING CROSS-LINGUAL WORD EMBEDDINGS WITH UNIVERSAL CONCEPTS
LEARNING CROSS-LINGUAL WORD EMBEDDINGS WITH UNIVERSAL CONCEPTSLEARNING CROSS-LINGUAL WORD EMBEDDINGS WITH UNIVERSAL CONCEPTS
LEARNING CROSS-LINGUAL WORD EMBEDDINGS WITH UNIVERSAL CONCEPTSijwscjournal
 
LEARNING CROSS-LINGUAL WORD EMBEDDINGS WITH UNIVERSAL CONCEPTS
LEARNING CROSS-LINGUAL WORD EMBEDDINGS WITH UNIVERSAL CONCEPTSLEARNING CROSS-LINGUAL WORD EMBEDDINGS WITH UNIVERSAL CONCEPTS
LEARNING CROSS-LINGUAL WORD EMBEDDINGS WITH UNIVERSAL CONCEPTSijwscjournal
 

Similar to An Interactive Visualization Of Crosslinguistic Colexification Patterns (20)

Lost in Translation - Gabriel Emanuel Borlean
Lost in Translation - Gabriel Emanuel BorleanLost in Translation - Gabriel Emanuel Borlean
Lost in Translation - Gabriel Emanuel Borlean
 
Lexicon
LexiconLexicon
Lexicon
 
An Outline Of Type-Theoretical Approaches To Lexical Semantics
An Outline Of Type-Theoretical Approaches To Lexical SemanticsAn Outline Of Type-Theoretical Approaches To Lexical Semantics
An Outline Of Type-Theoretical Approaches To Lexical Semantics
 
Edinburgh
EdinburghEdinburgh
Edinburgh
 
AMBIGUITY-AWARE DOCUMENT SIMILARITY
AMBIGUITY-AWARE DOCUMENT SIMILARITYAMBIGUITY-AWARE DOCUMENT SIMILARITY
AMBIGUITY-AWARE DOCUMENT SIMILARITY
 
Your Annotated Bibliography must have 8 sources. Please go back to t.docx
Your Annotated Bibliography must have 8 sources. Please go back to t.docxYour Annotated Bibliography must have 8 sources. Please go back to t.docx
Your Annotated Bibliography must have 8 sources. Please go back to t.docx
 
Language structure is partly by social structure
Language structure is partly by social structureLanguage structure is partly by social structure
Language structure is partly by social structure
 
Co word analysis
Co word analysisCo word analysis
Co word analysis
 
UNIVERSALITY IN TRANSLATION: AN ANALYSIS OF TRANSLATION INTERFERENCE IN MULTI...
UNIVERSALITY IN TRANSLATION: AN ANALYSIS OF TRANSLATION INTERFERENCE IN MULTI...UNIVERSALITY IN TRANSLATION: AN ANALYSIS OF TRANSLATION INTERFERENCE IN MULTI...
UNIVERSALITY IN TRANSLATION: AN ANALYSIS OF TRANSLATION INTERFERENCE IN MULTI...
 
FinalDraftRevisisions
FinalDraftRevisisionsFinalDraftRevisisions
FinalDraftRevisisions
 
Macrolinguistics & Contrastive Analysis
Macrolinguistics & Contrastive AnalysisMacrolinguistics & Contrastive Analysis
Macrolinguistics & Contrastive Analysis
 
How do we generate spoken words This issue is a fasci-natin.docx
How do we generate spoken words This issue is a fasci-natin.docxHow do we generate spoken words This issue is a fasci-natin.docx
How do we generate spoken words This issue is a fasci-natin.docx
 
Annotating A Low-Resource Language With LLOD Technology Sumerian Morphology ...
Annotating A Low-Resource Language With LLOD Technology  Sumerian Morphology ...Annotating A Low-Resource Language With LLOD Technology  Sumerian Morphology ...
Annotating A Low-Resource Language With LLOD Technology Sumerian Morphology ...
 
Lexicon Disambiguation1
Lexicon Disambiguation1Lexicon Disambiguation1
Lexicon Disambiguation1
 
Computer assisted text and corpus analysis
Computer assisted text and corpus analysisComputer assisted text and corpus analysis
Computer assisted text and corpus analysis
 
1 Distributive And Semantic Interpretation Of Macedonian Pronominal Clitics ...
1 Distributive And Semantic Interpretation Of Macedonian Pronominal Clitics  ...1 Distributive And Semantic Interpretation Of Macedonian Pronominal Clitics  ...
1 Distributive And Semantic Interpretation Of Macedonian Pronominal Clitics ...
 
LEARNING CROSS-LINGUAL WORD EMBEDDINGS WITH UNIVERSAL CONCEPTS
LEARNING CROSS-LINGUAL WORD EMBEDDINGS WITH UNIVERSAL CONCEPTSLEARNING CROSS-LINGUAL WORD EMBEDDINGS WITH UNIVERSAL CONCEPTS
LEARNING CROSS-LINGUAL WORD EMBEDDINGS WITH UNIVERSAL CONCEPTS
 
LEARNING CROSS-LINGUAL WORD EMBEDDINGS WITH UNIVERSAL CONCEPTS
LEARNING CROSS-LINGUAL WORD EMBEDDINGS WITH UNIVERSAL CONCEPTSLEARNING CROSS-LINGUAL WORD EMBEDDINGS WITH UNIVERSAL CONCEPTS
LEARNING CROSS-LINGUAL WORD EMBEDDINGS WITH UNIVERSAL CONCEPTS
 
LEARNING CROSS-LINGUAL WORD EMBEDDINGS WITH UNIVERSAL CONCEPTS
LEARNING CROSS-LINGUAL WORD EMBEDDINGS WITH UNIVERSAL CONCEPTSLEARNING CROSS-LINGUAL WORD EMBEDDINGS WITH UNIVERSAL CONCEPTS
LEARNING CROSS-LINGUAL WORD EMBEDDINGS WITH UNIVERSAL CONCEPTS
 
New word analogy corpus
New word analogy corpusNew word analogy corpus
New word analogy corpus
 

More from Angel Evans

Buy Essay Online Sites Top Websites To Purchase Essays
Buy Essay Online Sites Top Websites To Purchase EssaysBuy Essay Online Sites Top Websites To Purchase Essays
Buy Essay Online Sites Top Websites To Purchase EssaysAngel Evans
 
Essay School Life Is The Best Of Life. Wr
Essay School Life Is The Best Of Life. WrEssay School Life Is The Best Of Life. Wr
Essay School Life Is The Best Of Life. WrAngel Evans
 
Best Custom Essay Writing University Essay Services
Best Custom Essay Writing University Essay ServicesBest Custom Essay Writing University Essay Services
Best Custom Essay Writing University Essay ServicesAngel Evans
 
Format Of A Scholarship Essay. How To Write A Coll
Format Of A Scholarship Essay. How To Write A CollFormat Of A Scholarship Essay. How To Write A Coll
Format Of A Scholarship Essay. How To Write A CollAngel Evans
 
Boston College Supplemental Essays Bo
Boston College Supplemental Essays BoBoston College Supplemental Essays Bo
Boston College Supplemental Essays BoAngel Evans
 
Pin On Homeschooling
Pin On HomeschoolingPin On Homeschooling
Pin On HomeschoolingAngel Evans
 
Writing A Poetry Essay - Writing A Poetry Essay Yo
Writing A Poetry Essay - Writing A Poetry Essay YoWriting A Poetry Essay - Writing A Poetry Essay Yo
Writing A Poetry Essay - Writing A Poetry Essay YoAngel Evans
 
Conclusion To Essay Writing
Conclusion To Essay WritingConclusion To Essay Writing
Conclusion To Essay WritingAngel Evans
 
What Abilities Do You Need To Write An Es
What Abilities Do You Need To Write An EsWhat Abilities Do You Need To Write An Es
What Abilities Do You Need To Write An EsAngel Evans
 
Android Apps And Websites That Write Essays For You
Android Apps And Websites That Write Essays For YouAndroid Apps And Websites That Write Essays For You
Android Apps And Websites That Write Essays For YouAngel Evans
 
Sample Apa Essay Paper APA Format Examples
Sample Apa Essay Paper  APA Format ExamplesSample Apa Essay Paper  APA Format Examples
Sample Apa Essay Paper APA Format ExamplesAngel Evans
 
School Essay Explanation Essay Examples For College
School Essay Explanation Essay Examples For CollegeSchool Essay Explanation Essay Examples For College
School Essay Explanation Essay Examples For CollegeAngel Evans
 
Report Writing On Global Warming Es
Report Writing On Global Warming EsReport Writing On Global Warming Es
Report Writing On Global Warming EsAngel Evans
 
WRITING PROMPTS FOR COLLEGE APPLICATION
WRITING PROMPTS FOR COLLEGE APPLICATIONWRITING PROMPTS FOR COLLEGE APPLICATION
WRITING PROMPTS FOR COLLEGE APPLICATIONAngel Evans
 
How To Write An Essay About Your Mom Tele
How To Write An Essay About Your Mom  TeleHow To Write An Essay About Your Mom  Tele
How To Write An Essay About Your Mom TeleAngel Evans
 
A Measurement Model Of Visitor S Event Experience Within Festivals And Specia...
A Measurement Model Of Visitor S Event Experience Within Festivals And Specia...A Measurement Model Of Visitor S Event Experience Within Festivals And Specia...
A Measurement Model Of Visitor S Event Experience Within Festivals And Specia...Angel Evans
 
A Critical Study Of Charles Dickens Representation Of The Socially Disadvant...
A Critical Study Of Charles Dickens  Representation Of The Socially Disadvant...A Critical Study Of Charles Dickens  Representation Of The Socially Disadvant...
A Critical Study Of Charles Dickens Representation Of The Socially Disadvant...Angel Evans
 
A View From The Bridge
A View From The BridgeA View From The Bridge
A View From The BridgeAngel Evans
 
A Concept For Support Of Firefighter Frontline Communication
A Concept For Support Of Firefighter Frontline CommunicationA Concept For Support Of Firefighter Frontline Communication
A Concept For Support Of Firefighter Frontline CommunicationAngel Evans
 
Analysing The Data
Analysing The DataAnalysing The Data
Analysing The DataAngel Evans
 

More from Angel Evans (20)

Buy Essay Online Sites Top Websites To Purchase Essays
Buy Essay Online Sites Top Websites To Purchase EssaysBuy Essay Online Sites Top Websites To Purchase Essays
Buy Essay Online Sites Top Websites To Purchase Essays
 
Essay School Life Is The Best Of Life. Wr
Essay School Life Is The Best Of Life. WrEssay School Life Is The Best Of Life. Wr
Essay School Life Is The Best Of Life. Wr
 
Best Custom Essay Writing University Essay Services
Best Custom Essay Writing University Essay ServicesBest Custom Essay Writing University Essay Services
Best Custom Essay Writing University Essay Services
 
Format Of A Scholarship Essay. How To Write A Coll
Format Of A Scholarship Essay. How To Write A CollFormat Of A Scholarship Essay. How To Write A Coll
Format Of A Scholarship Essay. How To Write A Coll
 
Boston College Supplemental Essays Bo
Boston College Supplemental Essays BoBoston College Supplemental Essays Bo
Boston College Supplemental Essays Bo
 
Pin On Homeschooling
Pin On HomeschoolingPin On Homeschooling
Pin On Homeschooling
 
Writing A Poetry Essay - Writing A Poetry Essay Yo
Writing A Poetry Essay - Writing A Poetry Essay YoWriting A Poetry Essay - Writing A Poetry Essay Yo
Writing A Poetry Essay - Writing A Poetry Essay Yo
 
Conclusion To Essay Writing
Conclusion To Essay WritingConclusion To Essay Writing
Conclusion To Essay Writing
 
What Abilities Do You Need To Write An Es
What Abilities Do You Need To Write An EsWhat Abilities Do You Need To Write An Es
What Abilities Do You Need To Write An Es
 
Android Apps And Websites That Write Essays For You
Android Apps And Websites That Write Essays For YouAndroid Apps And Websites That Write Essays For You
Android Apps And Websites That Write Essays For You
 
Sample Apa Essay Paper APA Format Examples
Sample Apa Essay Paper  APA Format ExamplesSample Apa Essay Paper  APA Format Examples
Sample Apa Essay Paper APA Format Examples
 
School Essay Explanation Essay Examples For College
School Essay Explanation Essay Examples For CollegeSchool Essay Explanation Essay Examples For College
School Essay Explanation Essay Examples For College
 
Report Writing On Global Warming Es
Report Writing On Global Warming EsReport Writing On Global Warming Es
Report Writing On Global Warming Es
 
WRITING PROMPTS FOR COLLEGE APPLICATION
WRITING PROMPTS FOR COLLEGE APPLICATIONWRITING PROMPTS FOR COLLEGE APPLICATION
WRITING PROMPTS FOR COLLEGE APPLICATION
 
How To Write An Essay About Your Mom Tele
How To Write An Essay About Your Mom  TeleHow To Write An Essay About Your Mom  Tele
How To Write An Essay About Your Mom Tele
 
A Measurement Model Of Visitor S Event Experience Within Festivals And Specia...
A Measurement Model Of Visitor S Event Experience Within Festivals And Specia...A Measurement Model Of Visitor S Event Experience Within Festivals And Specia...
A Measurement Model Of Visitor S Event Experience Within Festivals And Specia...
 
A Critical Study Of Charles Dickens Representation Of The Socially Disadvant...
A Critical Study Of Charles Dickens  Representation Of The Socially Disadvant...A Critical Study Of Charles Dickens  Representation Of The Socially Disadvant...
A Critical Study Of Charles Dickens Representation Of The Socially Disadvant...
 
A View From The Bridge
A View From The BridgeA View From The Bridge
A View From The Bridge
 
A Concept For Support Of Firefighter Frontline Communication
A Concept For Support Of Firefighter Frontline CommunicationA Concept For Support Of Firefighter Frontline Communication
A Concept For Support Of Firefighter Frontline Communication
 
Analysing The Data
Analysing The DataAnalysing The Data
Analysing The Data
 

Recently uploaded

CELL CYCLE Division Science 8 quarter IV.pptx
CELL CYCLE Division Science 8 quarter IV.pptxCELL CYCLE Division Science 8 quarter IV.pptx
CELL CYCLE Division Science 8 quarter IV.pptxJiesonDelaCerna
 
Employee wellbeing at the workplace.pptx
Employee wellbeing at the workplace.pptxEmployee wellbeing at the workplace.pptx
Employee wellbeing at the workplace.pptxNirmalaLoungPoorunde1
 
AmericanHighSchoolsprezentacijaoskolama.
AmericanHighSchoolsprezentacijaoskolama.AmericanHighSchoolsprezentacijaoskolama.
AmericanHighSchoolsprezentacijaoskolama.arsicmarija21
 
Proudly South Africa powerpoint Thorisha.pptx
Proudly South Africa powerpoint Thorisha.pptxProudly South Africa powerpoint Thorisha.pptx
Proudly South Africa powerpoint Thorisha.pptxthorishapillay1
 
How to Configure Email Server in Odoo 17
How to Configure Email Server in Odoo 17How to Configure Email Server in Odoo 17
How to Configure Email Server in Odoo 17Celine George
 
Presiding Officer Training module 2024 lok sabha elections
Presiding Officer Training module 2024 lok sabha electionsPresiding Officer Training module 2024 lok sabha elections
Presiding Officer Training module 2024 lok sabha electionsanshu789521
 
“Oh GOSH! Reflecting on Hackteria's Collaborative Practices in a Global Do-It...
“Oh GOSH! Reflecting on Hackteria's Collaborative Practices in a Global Do-It...“Oh GOSH! Reflecting on Hackteria's Collaborative Practices in a Global Do-It...
“Oh GOSH! Reflecting on Hackteria's Collaborative Practices in a Global Do-It...Marc Dusseiller Dusjagr
 
Final demo Grade 9 for demo Plan dessert.pptx
Final demo Grade 9 for demo Plan dessert.pptxFinal demo Grade 9 for demo Plan dessert.pptx
Final demo Grade 9 for demo Plan dessert.pptxAvyJaneVismanos
 
Procuring digital preservation CAN be quick and painless with our new dynamic...
Procuring digital preservation CAN be quick and painless with our new dynamic...Procuring digital preservation CAN be quick and painless with our new dynamic...
Procuring digital preservation CAN be quick and painless with our new dynamic...Jisc
 
Difference Between Search & Browse Methods in Odoo 17
Difference Between Search & Browse Methods in Odoo 17Difference Between Search & Browse Methods in Odoo 17
Difference Between Search & Browse Methods in Odoo 17Celine George
 
What is Model Inheritance in Odoo 17 ERP
What is Model Inheritance in Odoo 17 ERPWhat is Model Inheritance in Odoo 17 ERP
What is Model Inheritance in Odoo 17 ERPCeline George
 
Capitol Tech U Doctoral Presentation - April 2024.pptx
Capitol Tech U Doctoral Presentation - April 2024.pptxCapitol Tech U Doctoral Presentation - April 2024.pptx
Capitol Tech U Doctoral Presentation - April 2024.pptxCapitolTechU
 
Pharmacognosy Flower 3. Compositae 2023.pdf
Pharmacognosy Flower 3. Compositae 2023.pdfPharmacognosy Flower 3. Compositae 2023.pdf
Pharmacognosy Flower 3. Compositae 2023.pdfMahmoud M. Sallam
 
Full Stack Web Development Course for Beginners
Full Stack Web Development Course  for BeginnersFull Stack Web Development Course  for Beginners
Full Stack Web Development Course for BeginnersSabitha Banu
 
call girls in Kamla Market (DELHI) 🔝 >༒9953330565🔝 genuine Escort Service 🔝✔️✔️
call girls in Kamla Market (DELHI) 🔝 >༒9953330565🔝 genuine Escort Service 🔝✔️✔️call girls in Kamla Market (DELHI) 🔝 >༒9953330565🔝 genuine Escort Service 🔝✔️✔️
call girls in Kamla Market (DELHI) 🔝 >༒9953330565🔝 genuine Escort Service 🔝✔️✔️9953056974 Low Rate Call Girls In Saket, Delhi NCR
 
Meghan Sutherland In Media Res Media Component
Meghan Sutherland In Media Res Media ComponentMeghan Sutherland In Media Res Media Component
Meghan Sutherland In Media Res Media ComponentInMediaRes1
 
Alper Gobel In Media Res Media Component
Alper Gobel In Media Res Media ComponentAlper Gobel In Media Res Media Component
Alper Gobel In Media Res Media ComponentInMediaRes1
 
Introduction to AI in Higher Education_draft.pptx
Introduction to AI in Higher Education_draft.pptxIntroduction to AI in Higher Education_draft.pptx
Introduction to AI in Higher Education_draft.pptxpboyjonauth
 

Recently uploaded (20)

OS-operating systems- ch04 (Threads) ...
OS-operating systems- ch04 (Threads) ...OS-operating systems- ch04 (Threads) ...
OS-operating systems- ch04 (Threads) ...
 
CELL CYCLE Division Science 8 quarter IV.pptx
CELL CYCLE Division Science 8 quarter IV.pptxCELL CYCLE Division Science 8 quarter IV.pptx
CELL CYCLE Division Science 8 quarter IV.pptx
 
Employee wellbeing at the workplace.pptx
Employee wellbeing at the workplace.pptxEmployee wellbeing at the workplace.pptx
Employee wellbeing at the workplace.pptx
 
AmericanHighSchoolsprezentacijaoskolama.
AmericanHighSchoolsprezentacijaoskolama.AmericanHighSchoolsprezentacijaoskolama.
AmericanHighSchoolsprezentacijaoskolama.
 
Proudly South Africa powerpoint Thorisha.pptx
Proudly South Africa powerpoint Thorisha.pptxProudly South Africa powerpoint Thorisha.pptx
Proudly South Africa powerpoint Thorisha.pptx
 
How to Configure Email Server in Odoo 17
How to Configure Email Server in Odoo 17How to Configure Email Server in Odoo 17
How to Configure Email Server in Odoo 17
 
Presiding Officer Training module 2024 lok sabha elections
Presiding Officer Training module 2024 lok sabha electionsPresiding Officer Training module 2024 lok sabha elections
Presiding Officer Training module 2024 lok sabha elections
 
“Oh GOSH! Reflecting on Hackteria's Collaborative Practices in a Global Do-It...
“Oh GOSH! Reflecting on Hackteria's Collaborative Practices in a Global Do-It...“Oh GOSH! Reflecting on Hackteria's Collaborative Practices in a Global Do-It...
“Oh GOSH! Reflecting on Hackteria's Collaborative Practices in a Global Do-It...
 
Final demo Grade 9 for demo Plan dessert.pptx
Final demo Grade 9 for demo Plan dessert.pptxFinal demo Grade 9 for demo Plan dessert.pptx
Final demo Grade 9 for demo Plan dessert.pptx
 
Procuring digital preservation CAN be quick and painless with our new dynamic...
Procuring digital preservation CAN be quick and painless with our new dynamic...Procuring digital preservation CAN be quick and painless with our new dynamic...
Procuring digital preservation CAN be quick and painless with our new dynamic...
 
Difference Between Search & Browse Methods in Odoo 17
Difference Between Search & Browse Methods in Odoo 17Difference Between Search & Browse Methods in Odoo 17
Difference Between Search & Browse Methods in Odoo 17
 
What is Model Inheritance in Odoo 17 ERP
What is Model Inheritance in Odoo 17 ERPWhat is Model Inheritance in Odoo 17 ERP
What is Model Inheritance in Odoo 17 ERP
 
Capitol Tech U Doctoral Presentation - April 2024.pptx
Capitol Tech U Doctoral Presentation - April 2024.pptxCapitol Tech U Doctoral Presentation - April 2024.pptx
Capitol Tech U Doctoral Presentation - April 2024.pptx
 
Pharmacognosy Flower 3. Compositae 2023.pdf
Pharmacognosy Flower 3. Compositae 2023.pdfPharmacognosy Flower 3. Compositae 2023.pdf
Pharmacognosy Flower 3. Compositae 2023.pdf
 
Full Stack Web Development Course for Beginners
Full Stack Web Development Course  for BeginnersFull Stack Web Development Course  for Beginners
Full Stack Web Development Course for Beginners
 
call girls in Kamla Market (DELHI) 🔝 >༒9953330565🔝 genuine Escort Service 🔝✔️✔️
call girls in Kamla Market (DELHI) 🔝 >༒9953330565🔝 genuine Escort Service 🔝✔️✔️call girls in Kamla Market (DELHI) 🔝 >༒9953330565🔝 genuine Escort Service 🔝✔️✔️
call girls in Kamla Market (DELHI) 🔝 >༒9953330565🔝 genuine Escort Service 🔝✔️✔️
 
Meghan Sutherland In Media Res Media Component
Meghan Sutherland In Media Res Media ComponentMeghan Sutherland In Media Res Media Component
Meghan Sutherland In Media Res Media Component
 
TataKelola dan KamSiber Kecerdasan Buatan v022.pdf
TataKelola dan KamSiber Kecerdasan Buatan v022.pdfTataKelola dan KamSiber Kecerdasan Buatan v022.pdf
TataKelola dan KamSiber Kecerdasan Buatan v022.pdf
 
Alper Gobel In Media Res Media Component
Alper Gobel In Media Res Media ComponentAlper Gobel In Media Res Media Component
Alper Gobel In Media Res Media Component
 
Introduction to AI in Higher Education_draft.pptx
Introduction to AI in Higher Education_draft.pptxIntroduction to AI in Higher Education_draft.pptx
Introduction to AI in Higher Education_draft.pptx
 

An Interactive Visualization Of Crosslinguistic Colexification Patterns

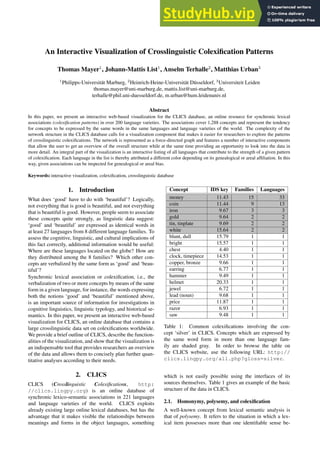
  • 1. An Interactive Visualization of Crosslinguistic Colexification Patterns Thomas Mayer1 , Johann-Mattis List1 , Anselm Terhalle2 , Matthias Urban3 1 Philipps-Universität Marburg, 2 Heinrich-Heine-Universität Düsseldorf, 3 Universiteit Leiden thomas.mayer@uni-marburg.de, mattis.list@uni-marburg.de, terhalle@phil.uni-duesseldorf.de, m.urban@hum.leidenuniv.nl Abstract In this paper, we present an interactive web-based visualization for the CLICS database, an online resource for synchronic lexical associations (colexification patterns) in over 200 language varieties. The associations cover 1,288 concepts and represent the tendency for concepts to be expressed by the same words in the same languages and language varieties of the world. The complexity of the network structure in the CLICS database calls for a visualization component that makes it easier for researchers to explore the patterns of crosslinguistic colexifications. The network is represented as a force-directed graph and features a number of interactive components that allow the user to get an overview of the overall structure while at the same time providing an opportunity to look into the data in more detail. An integral part of the visualization is an interactive listing of all languages that contribute to the strength of a given pattern of colexification. Each language in the list is thereby attributed a different color depending on its genealogical or areal affiliation. In this way, given associations can be inspected for genealogical or areal bias. Keywords: interactive visualization, colexification, crosslinguistic database 1. Introduction What does ‘good’ have to do with ‘beautiful’? Logically, not everything that is good is beautiful, and not everything that is beautiful is good. However, people seem to associate these concepts quite strongly, as linguistic data suggest: ‘good’ and ‘beautiful’ are expressed as identical words in at least 27 languages from 8 different language families. To assess the cognitive, linguistic, and cultural implications of this fact correctly, additional information would be useful: Where are these languages located on the globe? How are they distributed among the 8 families? Which other con- cepts are verbalized by the same form as ‘good’ and ‘beau- tiful’? Synchronic lexical association or colexification, i.e., the verbalization of two or more concepts by means of the same form in a given language, for instance, the words expressing both the notions ‘good’ and ‘beautiful’ mentioned above, is an important source of information for investigations in cognitive linguistics, linguistic typology, and historical se- mantics. In this paper, we present an interactive web-based visualization for CLICS, an online database that contains a large crosslinguistic data set on colexifications worldwide. We provide a brief outline of CLICS, describe the function- alities of the visualization, and show that the visualization is an indispensable tool that provides researchers an overview of the data and allows them to concisely plan further quan- titative analyses according to their needs. 2. CLICS CLICS (Crosslinguistic Colexifications, http: //clics.lingpy.org) is an online database of synchronic lexico-semantic associations in 221 languages and language varieties of the world. CLICS exploits already existing large online lexical databases, but has the advantage that it makes visible the relationships between meanings and forms in the object languages, something Concept IDS key Families Languages money 11.43 15 33 coin 11.44 9 13 iron 9.67 3 3 gold 9.64 2 2 tin, tinplate 9.69 2 2 white 15.64 2 2 blunt, dull 15.79 1 1 bright 15.57 1 1 chest 4.40 1 1 clock, timepiece 14.53 1 1 copper, bronze 9.66 1 1 earring 6.77 1 1 hammer 9.49 1 1 helmet 20.33 1 1 jewel 6.72 1 1 lead (noun) 9.68 1 1 price 11.87 1 1 razor 6.93 1 1 saw 9.48 1 1 Table 1: Common colexifications involving the con- cept ‘silver’ in CLICS. Concepts which are expressed by the same word form in more than one language fam- ily are shaded gray. In order to browse the table on the CLICS website, use the following URL: http:// clics.lingpy.org/all.php?gloss=silver. which is not easily possible using the interfaces of its sources themselves. Table 1 gives an example of the basic structure of the data in CLICS. 2.1. Homonymy, polysemy, and colexification A well-known concept from lexical semantic analysis is that of polysemy. It refers to the situation in which a lex- ical item possesses more than one identifiable sense be-
  • 2. tween which there is a conceptual relation. A number of tests are available to distinguish polysemy from semantic vagueness, in which a division into distinct senses is not warranted. From an analytical perspective, polysemy has to be further distinguished from homonymy and contextual variation. Homonymy refers to the “accidental” verbaliza- tion of at least two meanings by the same sound chain, without any conceptual relation that is more than coinci- dental. Contextual variation designates the adaption of a lexicalized meaning to contextual factors in an utterance. Although historical and synchronic criteria have been pro- posed to distinguish polysemy from homonymy, and con- textual variation can be tested by resorting to categorization (Blank, 1997), the differentiation depends on the individual analysis of every single word and is not entirely objective. Hence, it is difficult for quantitative investigations to pro- vide this differentiation in advance. Here, we use the term colexification (originally from François, 2008) to refer to the situation in which two or more of the meanings in our sources correspond to the same lexical item in one of the languages. For instance, we would say that in Wayuu (an Arawak language of Venezuela), anas1 colexifies ‘good’ and ‘beautiful.’1 Colexification is thus a deliberately am- biguous label that allows us to avoid making a commitment in each case as to the adequate lexical semantic analysis. Roughly speaking, colexification can correspond either to polysemy or contextual variation in lexical semantic analy- ses. Since CLICS is not based on such analyses that would allow us to further discriminate between the two, we chose colexification as a label that deliberately does not make a commitment with regard to this distinction. However, as we will show below, quantitative approaches are available to rule out effects of accidental homonymy. 2.2. CLICS’ data and sources CLICS (Version 1.0) offers information on colexification in 221 different language varieties covering 64 different language families.2 All language varieties in our sample comprise a total of 301,498 words covering 1,280 differ- ent concepts.3 Using a strictly automatic procedure, we identified 45,667 cases of colexification that correspond to 16,239 different links between the 1,280 concepts covered by our data. At present, four sources feed into CLICS: (1) The Intercon- tinental Dictionary Series (IDS, Key and Comrie, 2007), offering lexical data for 233 languages and language va- rieties. Ideally, datasets for each language contain 1,310 entries, though coverage differs in completeness for in- dividual languages. Of all 233 languages in IDS, 178 were automatically cleaned and included in CLICS. (2) The World Loanword Database (WOLD, Haspelmath and Tad- 1 See also the example of ‘money’ and ‘silver’ in the case study in Section 3.5. below. 2 This count includes 12 language isolates, and 3 unclassified languages, according to the classification schema of Ethnologue (Lewis and Fennig, 2013). 3 Since some concepts are expressed by more than one word in the respective languages, the number of words is higher than the expected one (282,880) if multiple synonyms per concept were not allowed. mor, 2009), the main goal of which has to do with identi- fying lexical borrowings, but which nevertheless also pro- vides general lexical data for 41 languages. The vocabu- laries for the individual languages differ somewhat in their size, ranging somewhere between 1,000 and 2,000 items. 33 of the 41 vocabularies are included in CLICS. (3) Data for four languages represented neither in IDS nor WOLD were added from the LOGOS dictionary (http://www. logosdictionary.org), a multilingual online dictio- nary. (4) Additional data for six Himalayan languages was taken from the Språkbanken project (University of Gothen- burg, http://spraakbanken.gu.se).4 2.3. Network modeling of CLICS As mentioned above, there is no guarantee that lexical asso- ciations within CLICS reflect conceptual associations. For example, there are three attested links between the concepts ‘arm’ and ‘poor’ in the current version of CLICS, which are due to homonymy in some Germanic languages (German, Dutch, and Yiddish). In order to distinguish strong association tendencies from spuriously occurring associations and to rule out cases of accidental homonymy, List et al. (2013) model cross- linguistic colexification data as a weighted network in which nodes represent concepts and weighted edges be- tween the nodes represent the number of attested colexi- fications in the data. With the help of community detection analyses, strongly interconnected regions in the colexifica- tion network can be identified. Communities are groups of nodes in a network ‘within which the connections are dense but between which they are sparser’ (Newman, 2004). List et al. (2013) apply a weighted version of the community de- tection algorithm by Girvan and Newman (2002) to a cross- linguistic colexification network consisting of 1,252 con- cepts translated into 195 languages covering 44 language families. Their analysis yielded a total of 337 communities, with 104 communities consisting of 5 and more nodes and covering 68% of all concepts. A qualitative survey of the largest communities showed that most of them constitute meaningful units and accidental homologies were success- fully excluded. 2.4. Limitations and caveats The data structure in CLICS directly mirrors the data struc- ture of the sources we used. We did not manipulate or rean- alyze the data in any way, to the effect that the reliability of CLICS is greatly dependent on the reliability of its sources. Additionally, it should be pointed out that we also cannot rule out the possibility of artifacts arising from automatic data cleaning in cases where textual coding of the data was inconsistent. As for its actual application, it also must be borne in mind that CLICS reflects a certain bias regarding the geographical locations of the languages included in its sources: IDS features many languages from South America and the Caucasus, while WOLD includes a disproportion- ate percentage of European languages. Hence, the sheer frequency of instances of a particular colexification pattern 4 In all cases, we ignored protolanguages and archaic languages (like Latin and Ancient Greek), and those languages which did not have enough coverage in terms of lexical items.
  • 3. in CLICS may be misleading insofar as a pattern may seem very robust crosslinguistically, but actually is so only in cer- tain regions of the world. We have not implemented any computational method in CLICS to balance out the picture a posteriori. Since we nevertheless want to present poten- tial users of CLICS with the possibility to assess possible areal patterns in the data, we include a powerful visualiza- tion that enables them to detect areal imbalances in colexi- fication patterns in individual cases themselves. 3. Visualization The CLICS database is available online at http:// clics.lingpy.org and offers its users a search inter- face to all concepts and crosslinguistic colexifications be- tween concepts. The wealth of information in the database and the various possibilities of exploring the colexifications in the network call for an additional component that makes potentially interesting observations more easily accessible to the researcher. The idea was to equip the database with a visualization component that provides various interactive functionalities and enables users to navigate through the networks of colexifications while at the same time provid- ing more detailed information on the actual language data. 3.1. Web-based visualization We opted for a web-based implementation of the CLICS visualization in JavaScript using the D3 library (Bostock et al., 2011). The main benefits of a web-based visualiza- tion are its platform independence and the fact that users can access it from any device with a browser supporting JavaScript. There is no need for the installation of addi- tional software or for maintenance of the system on the part of the user (Murray, 2010). In addition, links to the de- scriptions of the external resources can easily be included to allow users to explore the CLICS data in more detail on demand. 3.2. Data preparation In its current form, the data in CLICS yields a small world network in which all nodes are densely connected. Brows- ing such a dense network is very confusing and provides few insights for the user (see Figure 1). In order to break down the complexity inherent in CLICS, we employed two different strategies to present the data from two different perspectives. According to our first strategy, we decided to split the data into communities first. Starting from 1,280 concepts in CLICS which were connected to at least one other concept, we applied the Infomap algorithm by Ros- vall and Bergstrom (2008) to cluster all concepts into com- munities. The Infomap algorithm requires that weights are defined for the edges of the network. Here we used the number of attested language families per colexification as edge weights. Following a suggestion by Dellert (2014) we further normalized the number of attested language families with the help of Formula 1: W = C2 OA + OB − C , (1) where C is the number of attested language families for the colexification of concept A and concept B, OA is the number of language families in which concept A occurs, and OB is the number of language families in which con- cept B occurs. The Infomap algorithm was chosen because of its remarkable performance on the community detection task, both in terms of computation time and quality of re- sults (Lancichinetti and Fortunato, 2009). With the help of this analysis, it was possible to subdivide the 1,280 con- cepts into 271 communities. Of these communities, 118 are large, containing more than five nodes. The large commu- nities cover 65% (828) of all nodes in the original network (1,280). In order to enable the user to quickly identify com- munities of specific interest, we labeled all communities by taking the concept with the highest degree as representative. The communities do not differ much in size, ranging from 2 (‘men’s house’) to 16 concepts (‘fur’) with an average of 4.72 concepts per community. The advantage of the community perspective on CLICS is that it provides an independent automatic clustering of the data. The disadvantage is that this preselection deprives the user of finding alternative, possibly interesting connec- tions between the concepts. Community detection meth- ods are not error-proof, and their performance varies de- pending on the algorithms being used and the data being analyzed. Even more importantly, most community detec- tion methods are based on restricted decisions when clus- tering the nodes of a given network into groups. Every node is assigned to one community only. No transitions between communities are possible. In order to offer a less biased perspective on the network, we decided to extract subgraphs for each concept in the data showing its strongest connections up to a certain depth of resolution. The individ- ual subgraphs were constructed as follows: starting from a given concept, we first searched for all of its direct neigh- bors with which it shared at least 5 colexifications in five different language families. The same procedure was ap- plied to all neighbors which were added to the subgraph in the first run and repeated two times. If the resulting graph for a given concept was too small, a relaxed thresh- old of 4 colexifications in four different language families was used. In the resulting subgraphs, the longest possible path length between the selected concept and all other con- cepts is 3. Having excluded 280 subgraphs in which no stronger links between the selected concept and any other concept could be found, this procedure left us with 1,000 individual subgraphs of individual size and structure, rang- ing from 56 nodes (selected concept ‘take’) to 2 (selected concept ‘north’). When browsing the network representa- tion of the data, the user can select between both perspec- tives on the data in CLICS, the community perspective, and the perspective of the strongest connections. 3.3. Interactive functionalities The visualization features various interactive functionali- ties that are designed to enhance the exploration of the CLICS data at the level of communities or strongest con- nections. The main component is a flexible force-directed graph layout that displays the concepts as nodes and the crosslinguistic colexifications as edges (see Figure 2). The strength of the force in the edges of the graph is dependent on the number of language families that can be attested to
  • 4. having lexical associations for the respective concepts that are linked through the edge. As mentioned in the previ- ous section, we decided to provide two different views on the network, one for separate communities obtained from the Infomap analysis (Rosvall and Bergstrom, 2008), and one in which the subgraph containing the strongest links for each concept is displayed. With the help of the web inter- face for network browsing (http://clics.lingpy. org/browse.php) the user can look up the respective subgraphs by selecting the concept of interest and specify- ing the desired ‘view.’ The force-directed graph layout ensures that all concepts are neatly arranged according to their similarity as defined by the number of crosslinguistic colexifications. As a re- sult, concepts that are highly connected are located close to each other. To make it easier for users to explore the net- work that is depicted in the graph, concepts can be dragged to different positions where there is less overlap. The drag- ging behavior of a concept is activated when mousing over the respective node in the graph (when the cursor symbol turns into a cross hair). As mentioned above, the edges of the graph represent the number of cases of crosslinguistic colexifications for the linked concepts. For a more detailed view on which lan- guages contribute to the strength of the connections, the user can mouse over the links in the graph to see the forms in the individual languages responsible for the associative link (Figure 3). The list includes additional information on the languages such as their ISO 639-3 language code and family. Furthermore, each entry in the list provides a hy- perlink to the original source from where the information is taken. Each language in the list is attributed a different back- ground color depending on its language family or location Figure 1: Full network of all 1,288 concepts in CLICS (outer circle) together with their connections. The strength of the connections is marked in different colors, with very strong links represented in red Figure 2: Force-directed graph with mouse-over function- alities highlighting all connected concepts. In order to browse the graph on the CLICS website, use the following URL: http://clics.lingpy.org/browse.php? gloss=earth,%20land. in order to allow for an at-a-glance overview of all lan- guages in the list. The user can choose from a drop-down menu whether to include the genealogical or areal informa- tion as the background color. For the genealogical infor- mation, all language families are attributed a different color value. Languages belonging to the same language families are therefore given the same background color. Moreover, the list is sorted according to language families. In this way, the user can immediately see how many languages of a given family contribute to the overall strength for the con- nection at hand. As to the areal information, the world map is provided with a color gradient as shown in Figure 4. To this end, each po- sition in the world map is attributed a color value using the L*a*b* color space. The color hue thereby indicates the position on the map in terms of the longitude (specifying the east-west position) whereas the lightness of the color represents the position in terms of the latitude information (specifying the north-south position).5 The mapping from geolocation to color values allows for an easier evaluation of areal patterns in the selected connection. In this regard, users can directly detect whether a certain pattern of colex- ification is restricted to a certain region of the world or con- stitutes a more widespread colexification pattern (see the case study in Section 3.5. below). In addition, all languages in the list are displayed with their geographical location on a world map (see Figure 3). Hence, areal patterns can be di- rectly compared to the genealogical information in the list (if the first option is chosen). In addition to the interactive functionalities described above, the visualization also features a variety of further components that allow for an easier exploration of the database. The graph layout is equipped with panning and 5 See Mayer et al. (2014) for a different approach of a linguis- tically informed color gradient of the world map.
  • 5. Figure 3: Force-directed graph with mouse-over functionalities showing the strongest links of the concept ‘money.’ The entries have different background colors depending on their location in the world map (cf. Figure 4). In order to browse the graph on the CLICS website, use the following URL: http://clics.lingpy.org/browse.php?gloss= money&view=part. Figure 4: World map with color gradient. The color repre- sents the location where a language is spoken (see Figure 3 where the background color identifies the location of the language) zooming functionality that enables the user to navigate through the network graph. Panning is enabled when the cursor changes into a hand symbol when mousing over a link of the graph. The whole graph can then be dragged to a new position. The zooming behavior is activated with the scroll wheel. When mousing over a concept (node) in the graph all connected links and concepts are highlighted in order to provide a better overview of the connectivity of certain concepts (see Figure 2). The control panel of the visualization also includes a slider button that allows the user to show only those edges in the graph with a minimum number of crosslinguistic colexifications. 3.4. Implementation The visualization is implemented in JavaScript using the D3 library (Bostock et al., 2011).6 The force-directed graph is generated with the force() function from the d3.layout module. The layout implementation uses position Verlet integration for simple constraints (Dwyer, 2009).7 In order to ensure that the concept labels are lo- cated close to the concept nodes, a second force layout (with a static weight of 1) is set up for each concept link to the node. The color values for the world map gradient scale are com- puted from the two-dimensional geographical coordinates that are given as an input. The latitude [-90;90] and lon- gitude [-180;180] values are thereby normalized between [0;1] and serve as the input for the function cl2pix.8 function cl2pix(c,l){ var TAU = 6.2831853 var L = l*0.61 + 0.09; var angle = TAU/6.0 - c*TAU; var r = l*0.311 + 0.125 var a = Math.sin(angle)*r; var b = Math.cos(angle)*r; return [L,a,b]; 6 http://d3js.org 7 See https://github.com/mbostock/d3/wiki/ Force-Layout for a description of the implementation. 8 The code was adapted from the GNU C code by David Dal- rymple (http://davidad.net/colorviz/, accessed on January 25, 2014) and translated into JavaScript.
  • 6. }; The actual HTML color code is generated with the function d3.lab from the D3 library, which takes the three values for [L,a,b] as input. The main reason for choosing the L*a*b* color space is a smoother transition between dif- ferent color hues without any visible boundaries. As can be seen in Figure 5, the color gradient in the L*a*b* color space exhibits a much smoother perceptual transition be- tween the color hues on the y-axis. For the coloring of the language families, the background colors are gener- ated with the categorical scale functions of the d3.scale module. Figure 5: Comparison between two-dimensional color gra- dients in the L*a*b* (right) and HSV (left) color space. The dragging and panning functionalities of the graph are implemented with the drag() function from the d3.behavior module and the SVG transform and translate attributes. The interactive world map is gen- erated with the topojson package and makes use of the d3.geo projection module. 3.5. Case studies In order to illustrate the usefulness of the visualization for the purposes of exploring the database, consider the graph in Figure 3. Among other things, it contains the connec- tion between the concepts ‘money’ and ‘silver.’ A subset of the languages and words contributing to this connection are shown on the left where the background color represents the location of the languages. For instance, French con- tributes to the crosslinguistic colexification because both concepts are realized by the same word (viz. argent) in that language. When looking at the areal distribution of the languages, a clear pattern emerges at a glance (see Figure 6 for the full list of languages showing this colexification pattern). Most of the languages contributing to the colexi- fication are from two major regions: Caucasus (marked in blue) and South America (marked in green). However, as mentioned in Section 2.4., this distribution might be an ar- tifact of the general bias for languages of the Caucasus and South America in the underlying databases. In any case, the visualization directly points the attention to this pattern. As the aim of the visualization component is not to replace linguistic research but to guide it, such patterns have to be looked at in more detail by checking the actual data. Figure 6: Languages and words contributing to the connec- tions of lexical associations for the concepts ‘money’ and ‘silver’ Another example deals with the colexification of the con- cepts ‘wheel’ and ‘foot.’ In contrast to the case of ‘money’ and ‘silver’ above, these concepts at first glance may not immediately suggest a close association. Yet such cases do exist as the link in Figure 7 reveals. The connection links two bigger communities of nodes, including spheri- cal objects on the one hand and parts of the lower body on the other. The list of languages for the connection ‘wheel’ and ‘foot’ in Figure 7 clearly shows that the association is restricted to languages of South America. This geographi- cal restriction may reflect semantic borrowing among South American languages, but since the distribution within South America is rather erratic, independent innovation is also a possibility. At any rate, the color coding in the visualization immediately draws the researcher’s attention to the poten- tially interesting geographical patterning. 4. Conclusions and future work The size and complexity of today’s language resources call for a data preparation pipeline that enables researchers to find meaningful patterns among the multitude of different factors that can be taken into consideration. In our view, such a data preparation pipeline necessarily consists of two major parts, both of which are illustrated in the present pa-
  • 7. Figure 7: Force-directed graph with areal distribution for the concepts ‘wheel’ and ‘foot.’ In order to browse the graph on the CLICS website, enter the following URL: http://clics.lingpy.org/browse.php?gloss=wheel& view=part. per. On the one hand, methods and techniques from data mining or computational linguistics help to detect basic trends or groups of similar objects in the search space. On the other hand, the resulting groups or trends are mapped to visual variables in order to make interesting observations readily accessible to human perception. The CLICS database contains a wealth of information about colexification patterns in the languages of the world. Man- ually inspecting the large amount of connections in the database, however, is a laborious and time-consuming task that allows for a detailed exploration of individual links but does not capture overall trends in the data. This paper presents an attempt to combine the advantages of human inspection with the strength of a computational approach (Keim et al., 2008). The CLICS visualization features an automatic preprocess- ing of the colexification links into so-called communities on the graph, groups of highly connected nodes that re- veal a meaningful overall trend in the worldwide patterns of lexical associations. The communities are then graph- ically represented in a force-directed graph that shows all connections within the various concepts that are included. Interactive components in the visualization allow for a more detailed view of associations at the level of the languages that contribute to the colexification. Mapping the genealog- ical and areal information on individual languages to colors enables an at-a-glance evaluation of potentially interesting trends in individual colexifications (see the case studies in Section 3.5.). In this way, users can get an overview of the general trends in the data and at the same time have the opportunity to directly inspect the lexical associations. In future work, we plan to enhance the visualization tool with further interactive components that allow for a better overview of the complete network of colexifications (shown in Figure 1) and facilitate the detection of genealogical or areal trends in the database. The idea is to integrate a sunburst visualization (Stasko and Zhang, 2000) of the ge- nealogical information in order to enable a better overview of the language families that are involved in a given colexi- fication pattern.9 In addition, we intend to equip the user in- terface with further interactive components that allow users to explore the database from different perspectives (e.g., compare individual languages in terms of shared lexical as- sociations). All components will be made publicly avail- able online for the (linguistic) research community. 5. Acknowledgements This work was supported by the German Research Founda- tion (DFG project ‘Algorithmic corpus-based approaches to typological comparison’ and DFG CRC 991 ‘The structure of representations in language, cognition, and science’) and the European Research Council (ERC starting grant 240816 ‘Quantitative modelling of historical-comparative linguis- tics,’ and ERC advanced grant 103891 ‘The linguistic past of Mesoamerica and the Andes’). 9 See Mayer et al. (2014) for an example of using sunburst dis- plays to represent the hierarchical structure of language families.
  • 8. 6. References Blank, A. (1997). Prinzipien des Bedeutungswandels am Beispiel der romanischen Sprachen. Niemeyer, Tübingen. Bostock, M., Ogievetsky, V., and Heer, J. (2011). D3: Data-driven documents. IEEE Transactions on Visualization & Computer Graphics (Proc. InfoVis), 17(12):2301–2309. Dellert, J. (2014). Lifting a large multilingual dictionary to the level of concepts. Talk held at the “Workshop on his- torical and empirical evolutionary Linguistics” (February 15–16, 2014, Eberhard-Karls-Universität Tübingen). Dwyer, T. (2009). Scalable, versatile and simple con- strained graph layout. In Proceedings of the 11th Eu- rographics / IEEE - VGTC Conference on Visualization, EuroVis’09, pages 991–1006, Aire-la-Ville, Switzerland. Eurographics Association. François, A. (2008). Semantic maps and the typology of colexification: intertwining polysemous networks across languages. In Vanhove, M., editor, From polysemy to se- mantic change, pages 163–215. Benjamins, Amsterdam. Girvan, M. and Newman, M. E. (2002). Community struc- ture in social and biological networks. Proceedings of the National Academy of Sciences of the United States of America, 99(12):7821–7826. Haspelmath, M. and Tadmor, U. (2009). World Loanword Database. Max Planck Digital Library, Munich. Keim, D. A., Andrienko, G., Fekete, J.-D., Görg, C., Kohlhammer, J., and Melançon, G. (2008). Visual an- alytics: definition, process, and challenges. In Ker- ren, Andreas, Stasko, John T., Fekete, Jean-Daniel, and North, Chris, editors, Information Visualization, pages 154–175. Berlin: Springer Verlag. Key, M. R. and Comrie, B. (2007). IDS – The Inter- continental Dictionary Series. Springer, Berlin, URL: http://lingweb.eva.mpg.de/ids/. Lancichinetti, A. and Fortunato, S. (2009). Community de- tection algorithms: a comparative analysis. Physical Re- view E, 80(5 Pt 2):056117. Lewis, M. P. and Fennig, C. D., editors. (2013). Eth- nologue. SIL International, Dallas, 17 edition. URL: http://www.ethnologue.com. List, J.-M., Terhalle, A., and Urban, M. (2013). Using network approaches to enhance the analysis of cross- linguistic polysemies. In Proceedings of the 10th In- ternational Conference on Computational Semantics – Short Papers, pages 347–353, Stroudsburg. Association for Computational Linguistics. Mayer, T., Wälchli, B., Rohrdantz, C., and Hund, M. (2014). From the extraction of continuous features in parallel texts to visual analytics of heterogeneous areal-typological datasets. In Language Processing and Grammars. The role of functionally oriented computa- tional models, pages 13–38. John Benjamins. Murray, S. (2010). Interactive Data Visualization for the Web. O’Reilly Media, Inc. Newman, M. E. J. (2004). Analysis of weighted networks. Physical Review E, 70(5):056131. Rosvall, M. and Bergstrom, C. T. (2008). Maps of random walks on complex networks reveal community structure. Proc. Natl. Acad. Sci. U.S.A., 105(4):1118–1123. Stasko, J. and Zhang, E. (2000). Focus+context display and navigation techniques for enhancing radial, space- filling hierarchy visualizations. In Proceedings of the IEEE Symposium on Information Vizualization 2000, IN- FOVIS ’00, pages 57–65, Washington, DC, USA. IEEE Computer Society.