Microbial community composition of different soil layers in an aged oil spill site in bomu community
•Download as PPT, PDF•
0 likes•98 views

Microbial community composition of different soil layers in an aged oil spill site in Bomu community. (Slide).
Recommended

Recommended
More Related Content
What's hot
What's hot (20)
Viewers also liked
Viewers also liked (20)
Similar to Microbial community composition of different soil layers in an aged oil spill site in bomu community
Similar to Microbial community composition of different soil layers in an aged oil spill site in bomu community (20)
Recently uploaded
Recently uploaded (20)
Microbial community composition of different soil layers in an aged oil spill site in bomu community
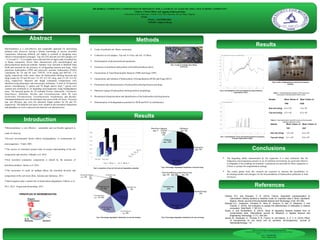
- 1. MICROBIAL COMMUNITY COMPOSITION OF DIFFERENT SOIL LAYERS IN AN AGED OIL-SPILL SITE IN BOMU COMMUNITY Chikere, Chioma Blaise and Aggreh, Erhovwon Peter University of Port Harcourt , P.M.B. 5323, Port Harcourt, Rivers State, Nigeria. Email: choima.chikere@uniport.edu.ng Phone: +2347030912861 Website: uniport.edu.ng MethodsAbstract Introduction Results References Bioremediation: a cost effective , sustainable and eco-friendly approach in crude oil clean up. Several environmental factors affects biodegradation of contaminants by microorganisms . Vidali, 2001. The success of restoration project relies on proper understanding of the soil composition and structure. Eldoado et al, 2016. Soil microbial community composition is altered by the presence of petroleum products. Janine et al, 2016. The occurrence of crude oil spillage affects the microbial diversity and composition of the soil micro-flora. Adesina and Adelasoye, 2013. Microorganism play a central role in hydrocarbon degradation. Chikere et al., 2011, 2012. Grupte and Sonawdekar, 2015. Bioremediation is a cost-effective and sustainable approach for detoxifying polluted soils. However, having a holistic knowledge of diverse microbial composition colonizing different soil depths is essential in designing more effective bioremediation strategies. Top soil (TS) and sub soil (SS) samples at 0 - 15 cm and 15 - 35 cm depths were collected from an aged crude-oil spilled site in Bomu community, Rivers State characterized with microbiological and physicochemical analytical methods. Samples were enriched in Bushnell Haas broth and screened for the presence of oil-degrading bacteria and fungi. Total petroleum hydrocarbon (TPH) and polycyclic aromatic hydrocarbon (PAHs) constituents for TS and SS were 7439.59; 14.58 mg/kg and 8653.03; 1.21 mg/kg, respectively while mean values for hydrocarbon utilizing bacterial and fungi counts for TS and SS were 1.9×10⁵ ; 0.5×10³ cfu/g; and 4.3×10⁵ ; 0.4×10³ cfu/g, respectively. Bacterial and fungal community compositions were identified using phenotypic and microscopic techniques. A total of 24 bacterial species encompassing 11 genera and 10 fungal species from 7 genera were isolated and confirmed as oil degrading microorganisms using biodegradation assay. The bacterial genera for TS included Proteus, Salmonella, Citrobacter, Enterobacter, Klebsiella, Bacillus and Corynebacterium while SS were Escherichia, Flavobacterium, Corynebacterium, Pseudomonas, and Bacillus. Gammaproteobacteria were the dominant class across both soil layers. Fusarium spp. and Rhizopus spp. were the dominant fungal isolates for SS and TS, respectively. The different soil layers were variable in the microbial composition and abundance as well as physical and chemical soil characteristics. Crude oil polluted site: Bomu community. Collection of soil samples. Top soil: 0-15cm, sub soil: 15-30cm. Determination of physicochemical parameters. Extraction of petroleum hydrocarbon with dichloromethane (dcm). Enumeration of Total Heterotrophic Bacteria (THB) and Fungi (THF). Enumeration and isolation of Hydrocarbon Utilizing Bacteria (HUB) and Fungi (HUF). Purification and characterization of hydrocarbon utilizing bacteria and fungi. Phenotyic typing of hydrocarbon utilizing bacteria morphology Biochemical characterization and identification of the hydrocarbon utilizing bacteria Determination of biodegradation potential for HUB and HUF by turbidometry PRINCIPLES OF BIOREMEDIATION Results The degrading ability demonstrated by the organisms is a clear indication that the indigenous microorganisms present in an oil polluted environment are good and effective oil degraders if the enabling environment/ constituents are provided for these organisms or if there is a proper bio-augmentation strategy. The results gotten from this research are expected to increase the possibilities of developing models and strategies for the bioremediation of hydrocarbon pollutants in both soil layers. Chikere, B.C. and Ekwuabu, C. B. (2014). Culture- dependent characterization of hydrocarbon utilizing bacteria in selected crude oil- impacted sites in Bodo Ogoniland, Nigeria. African Journal of Environmental Science and Technology. 8 (6): 401-405. Eldoado A.C., Costantini., Christina, B., Alice, N., Gudrum, S., Ilan, S., Alejandro, V. and Claudio, Z. (2016). Soil indicators to assess the effectiveness of restoration in dryland ecosystem. Solid Earth. 7: 397-414. Gupte, A. and Sonawdekar, S. (2015). Study of degrading bacteria isolated from oil contaminated sites. International Journal for Research in Applied Science and Engineering Technology. 3 (11): 345-349. Janine, M., Alexander, G., Thomas, D. B., Franco, W. and Marcel., G. A. V. H. (2016). Effect of nanoparticles on red clover and its symbiotic microorganisms. Journal of Nanobiotechnology. 1-8. . Conclusions Chikere, Chioma Blaise and Aggreh, Erhovwon Peter University of Port Harcourt , P.M.B. 5323, Port Harcourt, Rivers State, Nigeria. Email: choima.chikere@uniport.edu.ng Phone: +2347030912861 Website: uniport.edu.ng Fig 2. comparison of top soil and sub soil degradation potential. Fig 1. Crude oil polluted site in Bomu community. Fig 3. Percentage degradation distribution of sub soil bacteria. Fig 5. Percentage degradation distribution for sub soil fungi. . Fig 4. Percentage degradation distribution of top soil fungi Fig 6. Chromatogram of top soil polluted for total petroleum hydrocarbon (TPH). Fig 7. Chromatogram of top soil polluted sample for polycyclic aromatic hydrocarbon (PAH). Sample Mean Values of THB Mean Values of HUB Sub soil (cfu/g) 5.3 x 10⁵ 1.9 x 10⁵ Top soil (cfu/g) 5.7 x 10⁵ 4.3 x 10⁵ Table 2. Total heterotrophic fungi (thf) counts and hydrocarbon utilizing fungal (huf) counts Table 1. Total heterotrophic bacteria (THB counts and hydrocarbon utilizing bacteria (HUB) counts Sample Mean Values of THF Mean Values of HUF Sub soil (cfu/g) 1.0 x 10³ 0.4 x 10³ Top soil (cfu/g) 2.1 x 10³ 0.5 x 10³ Fig 9. Crude oil degradation as shown by increase in turbidity.