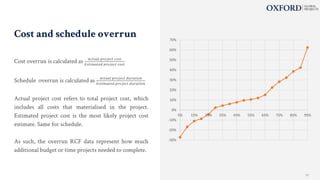
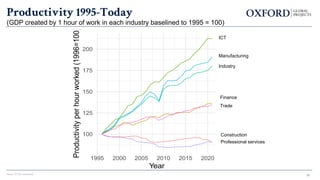
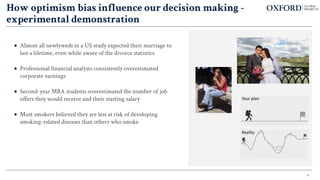
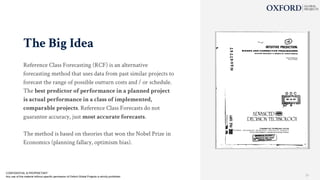
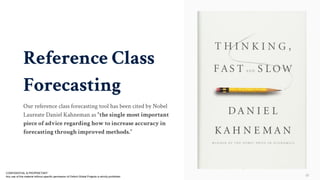
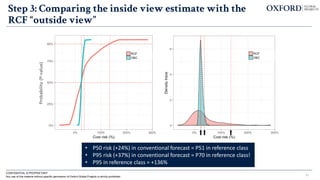
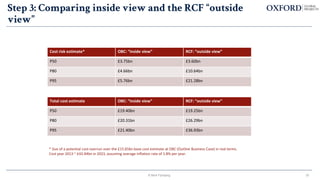
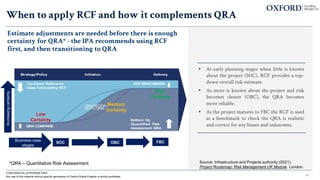
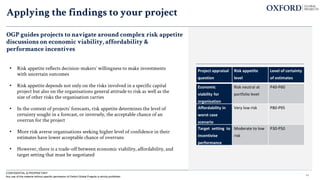
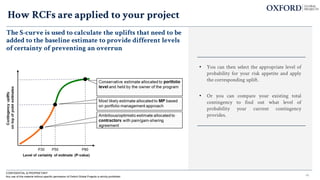
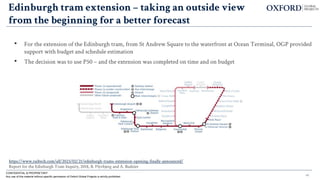
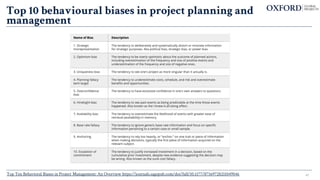
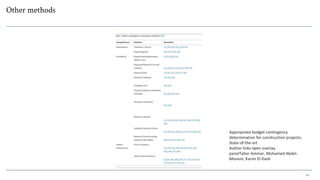
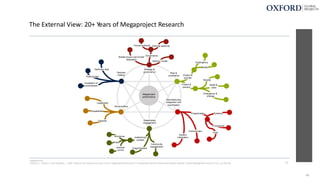
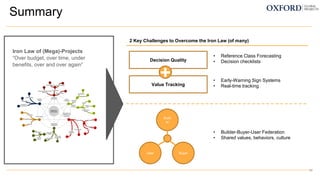
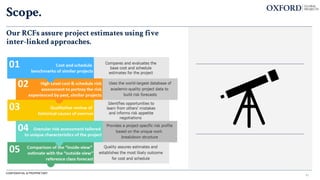
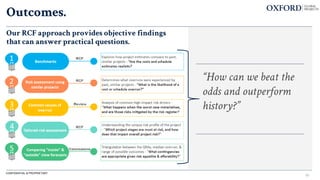
APM Webinar hosted by the North West Branch on 18 October 2023.
Speaker: Dr Michala Techau
Addressing the why, when, and how to use Reference Class Forecasting (RCF) as a method to predict uncertainty in major project planning and delivery. The key reason behind cost and schedule overrun is underestimation of risks, and the root causes of underestimation are optimism and political bias. This webinar was held on Wednesday 18 October 2023.
https://youtu.be/Shl5r1wTzxc
https://www.apm.org.uk/news/reference-class-forecasting-useful-method-or-random-number-generator-webinar/
Oxford Global Projects has vast experience of working on the risk assessment of complex and uncertain major capital projects. Our research shows that these projects are more likely to experience overruns in time and cost than underruns, and that the potential magnitude of overruns is likely to be greater than the magnitude of underruns.
Thus, for large capital projects, the norm is over budget, over time, under benefits, over and over again, The founder of OGP, Professor Bent Flyvbjerg, has named this the “iron law of megaprojects” - and we argue that it is crucial to build a strong evidence base to de-bias cost, schedule, and benefit estimates to derive clear, actionable recommendations for de-risking capital project delivery.
RCF is a method for systematically taking an outside-view on planned actions. The method is used to make explicit, empirically based adjustments to estimates that prevent estimation biases such as optimism bias. To be accurate, these adjustments should be based on data from past and similar projects calibrated for the unique characteristics of the project at hand.
The basic idea of RCF is that we answer the questions:
What was the actual cost and schedule performance of past similar projects?
How risky were they in terms of how much their cost and schedule changed in comparison to their original estimates?
How do the cost and schedule performance of past relevant projects compare to your project, and what is your project’s risk of overrun?
What contingency is required to provide the level of certainty you require that your project will not overrun?
The talk highlighted typical misconceptions about RCF, and put them to bed. Challenges, causes, and cures for major project performance will be illustrated with case studies from the transport, energy, and the built environment sectors. The talk concluded with a Q&A session and an open discussion on how RCF is potentially more important than ever, in relation to addressing our impact on the environment.
Privatization and Disinvestment - Meaning, Objectives, Advantages and Disadva...
Reference Class Forecasting - useful method, or random number generator? webinar
1. Reference class forecasting -
useful method, or random
number generator?
1
18th of October 2023
Dr Michala Techau, Head of Resilience and
Sustainability at Oxford Global Projects
CONFIDENTIAL & PROPRIETARY
Any use of this material without specific permission of Oxford Global Projects is strictly prohibited
For the Association for Project Management
2. Using mega projects as a force for good
The why, when, and how to use Reference Class
Forecasting (RCF) as a method for systematically taking
an outside view to predict uncertainty in mega project
planning and delivery.
Wider context - mega projects are key to the green
transitioning and getting estimates (more) right, is
important in mapping how to reach net zero targets.
CONFIDENTIAL & PROPRIETARY
Any use of this material without specific permission of Oxford Global Projects is strictly prohibited
2
3. What will we cover?
• Example of mega project performance
• What are the main causes of mega project risk?
• What are the cures for mega project risk?
• How do you apply reference class forecasting?
• What are typical misconceptions about reference class
forecasting?
• Q&A
3
CONFIDENTIAL & PROPRIETARY
Any use of this material without specific permission of Oxford Global Projects is strictly prohibited
5. In mega project performance – there is room for improvement…
5
CONFIDENTIAL & PROPRIETARY
Any use of this material without specific permission of Oxford Global Projects is strictly prohibited
6. 6
Edinburgh tram - delivery can be doomed before you
start
…if your forecast is wrong
• Estimate: £498m + a £37m contingency = £535m (2007, Phase 1a only), opening 2011.
• Reality: £776m, opening 2014 ~ 52% over budget (and reduced scope).
• RCF estimate: £697-£781m
CONFIDENTIAL & PROPRIETARY
Any use of this material without specific permission of Oxford Global Projects is strictly prohibited
Source: The City of Edinburgh Council, 2013.
Report for the Edinburgh Tram Inquiry, 2018, B. Flyvbjerg and A. Budzier
7. 7
Hong Kong express rail link – using the “wrong anchor”
can set you up to fail
• Estimate: HK$39.5bn and 4 years to build.
• Reality: Four years in, no end in sight and ballooning
budget.
• RCF estimate: HK$85bn (high confidence, low risk) and a
six-year project schedule.
• XLR completed within budget and time.
CONFIDENTIAL & PROPRIETARY
Any use of this material without specific permission of Oxford Global Projects is strictly prohibited
8. Poll
CONFIDENTIAL & PROPRIETARY
Any use of this material without specific permission of Oxford Global Projects is strictly prohibited
8
Which of these five industries do you think perform best?
9. How reliably do we deliver our promises across industries?
Ø duration, years
Cost overrun
Benefits
overrun
Frequency of
cost overrun
Schedule
overrun
Cost
Black Swans
Olympics
7.1
157%
n/a
10 of 10
0%
57%
IT-led
change
3.3
73%
-28%
4 of 10
43%
18%
Dams
7.9
74%
-11%
8 of 10
45%
23%
Roads
4.9
15%
-4%
6 of 10
36%
3%
8.1
Rail
32%
-23%
7 of 10
31%
9%
Buildings
57%
-5%
7 of 10
29%
18%
6.7 6.8
238%
-23%
9 of 10
70%
43%
Nuclear
waste
storage
Solar
power
2.2
1%
n/a
4 of 10
2%
0%
Source: Oxford Global Projects Database (Q4 2022)
Note: Measured from date of decision to build, in constant prices
Black Swans (outliers) are defined as 1.5 times the Inter-Quartile Range (IQR) IQR=difference difference between the third quartile (Q3) and the first quartile (Q1).
9
10. 100.0%
47.9%
8.5%
0.5%
All projects
(n=16,357)
On-budget (or
better)
On-budget &
on-time
(or better)
On-budget &
on-time &
on-benefits
(or better)
Iron Law of (Mega)-Projects
“Over budget, over time, under benefits, over
and over again” (Professor Bent Flyvbjerg)
The iron law of mega projects
10
CONFIDENTIAL & PROPRIETARY
Any use of this material without specific permission of Oxford Global Projects is strictly prohibited
11. 100.0%
47.9%
8.5%
0.5%
All projects
(n=16,357)
On-budget (or
better)
On-budget &
on-time
(or better)
On-budget &
on-time &
on-benefits
(or better)
11
This is the likelihood of success
if we deliver projects as we have
always done!
The iron law of mega projects
CONFIDENTIAL & PROPRIETARY
Any use of this material without specific permission of Oxford Global Projects is strictly prohibited
13. CONFIDENTIAL & PROPRIETARY
Any use of this material without specific permission of Oxford Global Projects is strictly prohibited 13
The root cause of overruns – the main risks are
internal, not external
Why do we
underestimate risk?
Risk is external All risks are internal
Overrun Underestimation
15. 15
Optimism bias: “The cognitive predisposition
found with most people to judge future events in
a more positive light than is warranted by actual
experience.” (Flyvbjerg 2006)
“The planning fallacy is a consequence of the tendency to
neglect distributional data, and to adopt what may be
termed an 'internal approach' to prediction, where one
focuses on the constituents of the specific problem rather
than on the distribution of outcomes in similar cases.”
(Kahneman & Tversky 1977)
Psychological explanation – what are the most
important biases in projects management?
16. 16
How optimism bias influence our decision making -
experimental demonstration
• Almost all newlyweds in a US study expected their marriage to
last a lifetime, even while aware of the divorce statistics
• Professional financial analysts consistently overestimated
corporate earnings
• Second-year MBA students overestimated the number of job
offers they would receive and their starting salary
• Most smokers believed they are less at risk of developing
smoking-related diseases than others who smoke
18. A planner on cost underestimation
“…as a planner, you will often know the real
costs. You know that the budget is too low, but it
is difficult to pass such a message to the
counsellors [politicians] and the private actors.
They know that high costs reduce the chances
of national funding.”
18
CONFIDENTIAL & PROPRIETARY
Any use of this material without specific permission of Oxford Global Projects is strictly prohibited
19. Poll
CONFIDENTIAL & PROPRIETARY
Any use of this material without specific permission of Oxford Global Projects is strictly prohibited 19
Which of these two impact your project most?
21. The Big Idea
Reference Class Forecasting (RCF) is an alternative
forecasting method that uses data from past similar projects to
forecast the range of possible outturn costs and / or schedule.
The best predictor of performance in a planned project
is actual performance in a class of implemented,
comparable projects. Reference Class Forecasts do not
guarantee accuracy, just most accurate forecasts.
The method is based on theories that won the Nobel Prize in
Economics (planning fallacy, optimism bias).
CONFIDENTIAL & PROPRIETARY
Any use of this material without specific permission of Oxford Global Projects is strictly prohibited 21
22. Reference Class
Forecasting
Our reference class forecasting tool has been cited by Nobel
Laureate Daniel Kahneman as “the single most important
piece of advice regarding how to increase accuracy in
forecasting through improved methods.”
CONFIDENTIAL & PROPRIETARY
Any use of this material without specific permission of Oxford Global Projects is strictly prohibited 22
23. What reference class forecasting does
23
1 2
2
Outside View
Reference
Class
Inside View
Experts’ Forecast
Regresses best guess toward
the mean of the reference class
1
Expands estimate of interval
to interval of the reference class
2
CONFIDENTIAL & PROPRIETARY
Any use of this material without specific permission of Oxford Global Projects is strictly prohibited
24. Unknown-unknowns
RCF takes into account “unknown unknowns”.
How? By incorporating in the reference class ALL effects on
performance, including “unknown unknowns”.
CONFIDENTIAL & PROPRIETARY
Any use of this material without specific permission of Oxford Global Projects is strictly prohibited 24
25. How do you Apply Reference Class
Forecasting to Mega Projects?
26. The three steps of RCF
CONFIDENTIAL & PROPRIETARY
Any use of this material without specific permission of Oxford Global Projects is strictly prohibited
We show the cost overruns experienced
by the projects in the reference class as a
cumulative distribution....
50% of projects had an
overrun of 25%
1. Build a reference class of similar projects
2. Establish probability distribution for the reference class
3. Compare your project with the distribution
26
Cost overrun is calculated as
𝐴𝑐𝑡𝑢𝑎𝑙 𝑝𝑟𝑜𝑗𝑒𝑐𝑡 𝑐𝑜𝑠𝑡
𝐸𝑠𝑡𝑖𝑚𝑎𝑡𝑒𝑑 𝑝𝑟𝑜𝑗𝑒𝑐𝑡 𝑐𝑜𝑠𝑡
P80 = 85%
…which - provided your project performs
no better or worse than projects in the
reference class - can be translated into
probability.
1. 2. 3.
27. High Speed 2 - Phase One cost estimate provided by
OGP in 2019
Cost heading Cost GBP million*
Contracts & Delivery team 1,150
Tunnels 2,910
Civils 3,990
Stations 2,545
Depots and stabling 720
Railway systems 1,560
On-network works 480
Land & property 1,630
Corporate overheads 1,265
Total cost 15,650
27
HS2 Ltd’s Phase one base cost estimate @ OBC
Source: UK Department for Transport
*2013 cost year
CONFIDENTIAL & PROPRIETARY
Any use of this material without specific permission of Oxford Global Projects is strictly prohibited
28. HS2 Ltd’s Outline Business Case estimate of cost risk*
applying Quantitative Risk Analysis (QRA)
28
P95 = £5.75bn
= +37%
P50 = £3.75bn =
+24%
Risk
identification
workshop
Expert
assessment
Monte Carlo
simulation
Limitations
ignored
* Size of a potential cost
overrun over the £15.65bn
base cost estimate in real
terms, Outline Business Case
(OBC)
CONFIDENTIAL & PROPRIETARY
Any use of this material without specific permission of Oxford Global Projects is strictly prohibited
29. • Selecting past similar projects, based on statistical similarity
• Testing whether average, median (P50), P80, P90, P95 are statistically
significantly different from high-speed rail
• Only fixed links are comparable for the full range of estimates from
P50-P95
• Final selected reference class included 39 high-speed rail projects
and 132 fixed links = 171 projects
Is this project type a
suitable comparator for
HSR projects? (n=39)
Average P50 P80 P90 P95
Conv. rail (n=113) ✔ ✔ ✔
Fixed link (n=132) ✔ ✔ ✔ ✔ ✔
Metro (n=196) ✔ ✔ ✔
Road (n=658) ✔ ✔
✔ No statistically
significant difference
✗ Statistically
significant
difference
Step 1: Building a reference class for HS2
29
CONFIDENTIAL & PROPRIETARY
Any use of this material without specific permission of Oxford Global Projects is strictly prohibited
30. Step 2: Establishing the cost risk distribution for the
reference class
30
• Cost overruns in 3 out of 4
projects but also cost
underruns
• High-cost overruns not
unlikely: 1 in 8 projects more
than doubled in cost
50% of projects had
an overrun of 23%
CONFIDENTIAL & PROPRIETARY
Any use of this material without specific permission of Oxford Global Projects is strictly prohibited
31. Step 3: Comparing the inside view estimate with the
RCF “outside view”
31
• P50 risk (+24%) in conventional forecast = P51 in reference class
• P95 risk (+37%) in conventional forecast = P70 in reference class!
• P95 in reference class = +136%
CONFIDENTIAL & PROPRIETARY
Any use of this material without specific permission of Oxford Global Projects is strictly prohibited
33. 33
Institute for Government publication “HS2: costs and controversies. How much has the HS2 project cost since its inception?” 5th October 2023
Comparing RCF estimate with current status of HS2 –
Phase 1 only estimated to cost around £40bn
Recent abandonment of Phase 2 limits estimated spend to £35-45bn (2019 prices) for Phase 1.
CONFIDENTIAL & PROPRIETARY
Any use of this material without specific permission of Oxford Global Projects is strictly prohibited
35. 35
Examples of typical misconceptions about RCF
• Contingency upon contingency
• Where we have data without contingency, the resulting RCF provides suggested uplift to add to deterministic baseline cost
– do you know how much padding is already added to your estimate?
• History repeating
• No – set out to beat the odds. RCF makes you aware of how projects performed in the past, set out to understand why, so
you can mitigate and outperform previous projects.
• Comparing apples with rocks
• RCF is not about exact similarity of technology, but about similarity of risk distributions, e.g., for FoaK projects types, it is
still insightful to see how other FoaK projects performed.
• It is too subjective
• Adjustments to where your project sits on the RCF curve needs to be made as objectively AND consistently as possible.
• Our project will never be approved
• Inflating project cost / schedule using RCF suggested uplifts does look scary – but there to inform discussions on risk
appetite and affordability. More projects should go back to the drawing board!
CONFIDENTIAL & PROPRIETARY
Any use of this material without specific permission of Oxford Global Projects is strictly prohibited
36. Key take home message on RCF
Enhances accuracy of
estimates by leveraging
full distributions of
historical data - to provide
a more realistic and
objective basis for decision
making
36
CONFIDENTIAL & PROPRIETARY
Any use of this material without specific permission of Oxford Global Projects is strictly prohibited
37. 37
So how do we beat the odds and use mega projects as a
force for good?
• Informing policy for better incentivisation?
• Optimising resource allocation
• Project appraisal – selection effect
• Often the worst projects are approved, because they look
best on paper (highest BCR)
• Require more efficient delivery of projects
• Experience – people and technology
• Avoid the eternal beginner syndrome
• Modularity
CONFIDENTIAL & PROPRIETARY
Any use of this material without specific permission of Oxford Global Projects is strictly prohibited
40. When to apply RCF and how it complements QRA
Estimate adjustments are needed before there is enough
certainty for QRA* - the IPA recommends using RCF
first, and then transitioning to QRA
Source: Infrastructure and Projects authority (2021).
Project Routemap: Risk Management UK Module. London.
• At early planning stages when little is known
about the project (SOC), RCF provides a top-
down overall risk estimate.
• As more is known about the project and risk
becomes clearer (OBC), the QRA becomes
more reliable.
• As the project matures to FBC the RCF is used
as a benchmark to check the QRA is realistic
and correct for any biases and unknowns.
Low
Certainty
Business case
stages
SOC OBC FBC
Increasing
certainty
Medium
Certainty
High
Certainty
*QRA – Quantitative Risk Assessment
CONFIDENTIAL & PROPRIETARY
Any use of this material without specific permission of Oxford Global Projects is strictly prohibited 40
41. How risk distribution for historical data compares to
an example of a current estimate in the nuclear industry
CONFIDENTIAL & PROPRIETARY
Any use of this material without specific permission of Oxford Global Projects is strictly prohibited 41
Clear difference between the Monte Carlo risk model (green) and the historical data, both inclusive (blue) and exclusive (orange) of the North
American projects. Especially for values greater than P50.
42. Bad data +
bad models
→ Error
Error means
• Overestimation as likely
as underestimation
• Overestimation similar
size as underestimation
• In the long run they
average out
Transport
infrastructure
(n=1,505)
Average
overrun
Standard
deviation
Level of significance
(p)
Cost 28% 61% < 0.001
Schedule 37% 53% < 0.001
Benefits -6% 43% < 0.001
The project performance data reject the error hypothesis.
Technical explanation
42
43. • Within an industry, programmes or projects
are statistically very similar, in terms of cost,
schedule and benefit risks.
• The assumption of uniqueness does not stand
up to hard, statistical test, it’s a myth.
• Truly unique programs are rare; even projects
like the Greenlandic Arctic Circle Road have
similarities with other projects.
• Statistical similarity is all we need for RCF and
better risk management.
Uniqueness bias – unique projects are rarer than you think
CONFIDENTIAL & PROPRIETARY
Any use of this material without specific permission of Oxford Global Projects is strictly prohibited 43
44. 44
CONFIDENTIAL & PROPRIETARY
Any use of this material without specific permission of Oxford Global Projects is strictly prohibited
• Risk appetite reflects decision-makers’ willingness to make investments
with uncertain outcomes
• Risk appetite depends not only on the risks involved in a specific capital
project but also on the organisations general attitude to risk as well as the
size of other risks the organisation carries
• In the context of projects’ forecasts, risk appetite determines the level of
certainty sought in a forecast, or inversely, the acceptable chance of an
overrun for the project
• More risk averse organisations seeking higher level of confidence in their
estimates have lower acceptable chance of overruns
• However, there is a trade-off between economic viability, affordability, and
target setting that must be negotiated
Project appraisal
question
Risk appetite
level
Level of certainty
of estimates
Economic
viability for
organisation
Risk neutral at
portfolio level
P40-P60
Affordability in
worst case
scenario
Very low risk P80-P95
Target setting to
incentivise
performance
Moderate to low
risk
P30-P50
OGP guides projects to navigate around complex risk appetite
discussions on economic viability, affordability &
performance incentives
Applying the findings to your project
45. How RCFs are applied to your project
CONFIDENTIAL & PROPRIETARY
Any use of this material without specific permission of Oxford Global Projects is strictly prohibited
The S-curve is used to calculate the uplifts that need to be
added to the baseline estimate to provide different levels
of certainty of preventing an overrun
• You can then select the appropriate level of
probability for your risk appetite and apply
the corresponding uplift.
• Or you can compare your existing total
contingency to find out what level of
probability your current contingency
provides.
45
46. Edinburgh tram extension – taking an outside view
from the beginning for a better forecast
• For the extension of the Edinburgh tram, from St Andrew Square to the waterfront at Ocean Terminal, OGP provided
support with budget and schedule estimation
• The decision was to use P50 – and the extension was completed on time and on budget
CONFIDENTIAL & PROPRIETARY
Any use of this material without specific permission of Oxford Global Projects is strictly prohibited
https://www.railtech.com/all/2023/02/21/edinburgh-trams-extension-opening-finally-announced/
Report for the Edinburgh Tram Inquiry, 2018, B. Flyvbjerg and A. Budzier
46
47. 47
Top 10 behavioural biases in project planning and
management
Top Ten Behavioral Biases in Project Management: An Overview https://journals.sagepub.com/doi/full/10.1177/87569728211049046
48. Other methods
48
Appropriate budget contingency
determination for construction projects:
State-of-the-art
Author links open overlay
panelTaher Ammar, Mohamed Abdel-
Monem, Karim El-Dash
49. The External View: 20+ Years of Megaproject Research
13
Optimism bias
Political bias
Escalation of
commitment
Decision
making
Builder-buyer-user-funder
federation
Governance
Delivery model
Formal authority Informal authority
Strategy &
governance
Socio-politics
Leadership
Capabilities
Capacity
Manufacturing
integration and
coordination
Programatics
Commercials
System
integration
Systems
Procedures
Tools
Novelty
Scale &
pace
Emergence &
change
Predict &
provide
Predict &
prevent
Contingency
Buffer
Risk &
uncertainty
Institutional
context
Structures
Rules
Informal
norms
Fragmentation
Community
engagement
Stakeholder
engagement
Megaproject
performance
Adapted from:
Denicol, J., Davies, A. and Krystallis, I., 2020. What are the causes and cures of poor megaproject performance? A systematic literature review and research agenda. Project Management Journal, 51(3), pp.328-345.
49
50. Iron Law of (Mega)-Projects
“Over budget, over time, under
benefits, over and over again”
Summary
2 Key Challenges to Overcome the Iron Law (of many)
Decision Quality
Value Tracking
+
• Reference Class Forecasting
• Decision checklists
• Early-Warning Sign Systems
• Real-time tracking
Build
er
User Buyer
• Builder-Buyer-User Federation
• Shared values, behaviors, culture
Optimism bias
Political bias
Escalation of
commitment
Decision
making
Builder-buyer-user-funder
federation
Governance
Delivery model
Formal authority Informal authority
Strategy &
governance
Socio-politics
Leadership
Capabilities
Capacity
Manufacturing
integration and
coordination
Programatics
Commercials
System
integration
Systems
Procedures
Tools
Novelty
Scale &
pace
Emergence &
change
Predict &
provide
Predict &
prevent
Contingency
Buffer
Risk &
uncertainty
Institutional
context
Structures
Rules
Informal
norms
Fragmentation
Community
engagement
Stakeholder
engagement
Megaproject
performance
50
52. CONFIDENTIAL & PROPRIETARY
Outcomes.
“How can we beat the
odds and outperform
history?”
Our RCF approach provides objective findings
that can answer practical questions.
52
53. Independent Studies
1. Sydney Water Corporation, 11 infrastructure projects with RCF showed a significantly increased likelihood of completing under budget
(Napier and Liu, 2008).
2. Australian State Road and Traffic Authority, 44 projects with RCF showed increased forecast accuracy (Liu, Wehbe, and Siscovic, 2010).
3. Bridge construction forecast based on RCF and Bayesian updating produced more accurate forecasts (Kim and Reinschmidt, 2011)
4. RCF and Bayesian forecast of healthcare cost in 8 car manufacturing plants produced more accurate forecasts (Bordley, 2014)
5. A study of 56 construction projects shows that RCF outperforms conventional techniques, i.e. bottom-up estimation EVM and Monte Carlo
simulations (Batselier and Vanhoucke, 2016)
6. Application of RCF to Bujagali hydropower dam project increased accuracy of the cost-benefit analysis (Awojobi and Jenkins, 2016)
7. A study of 399 political forecasters shows that those trained and using RCF, taking different perspectives, and post-mortem analyses
produced more accurate forecasts (Chang, Chen, Mellers, and Tetlock, 2016)
8. Application of RCF on 369 Turkish public works projects resulted in reasonably accurate predictions (Bayram and Al-Jibouri, 2017)
9. Integrating RCF into EVM on 23 construction projects produced more accurate predictions of schedule performance (Batselier and
Vanhoucke, 2017)
10. RCF on 222 chemical industry projects proved effective for large homogenous projects but useless for less homogenous projects with little
historical data (Walcak and Majchrzak, 2018)
11. RCF improved the estimates of the cost of contaminated spoil removal in 3 nuclear projects (Devine, 2019)
12. A re-signaling project in Denmark applied RCF but still overran the budget because managers re-introduced optimism when selecting the
reference class (Themsen, 2019)
13. A modified RCF approach to estimate the remaining schedule to complete was accurate to 5 percentage points in 4 offshore oil and gas
projects (Dehghan et al., 2020)
14. RCF led to less optimistic forecasts in 322 project forecasts conducted as part of an experimental study (Friesdorf, 2020)
15. Providing RCF information to guide schedule forecasts in 139 experimental estimates improved the forecast accuracy, but more detailed
information about the task did not (Lorko et al., 2020)
16. The application of RCF to oil and gas production rates for the Norwegian Continental Shelf reduced optimism bias and increased forecast
accuracy
from 33% to 77% (at P80) (Jehan and Storsveen, 2020)
17. The first-ever RCF application in Germany, on Stuttgart 21, would have predicted the current cost overrun (Steininger et al., 2021)
18. The average cost overrun of UK major projects has reduced from 50% to 5% following the introduction of RCF (Park, 2021).
53
A typical conclusion was drawn by
Batselier and Vanhoucke (2016),
who said: "The conducted
evaluation is entirely based on
real-life project data and shows
that RCF indeed performs best, for
both cost and time forecasting, and
therefore supports the practical
relevance of the technique.”
• Introduced as Government Policy in major projects in the UK in 2004;
updated in 2021 for Department for Transport* and currently by Treasury
• Hong Kong’s DEVB introduced RCF starting in 2012**
• In 2019 adopted as policy in Ireland’s Spending Code and first adopted by Transport
Infrastructure Ireland in 2020
54. We help clients
navigate the UK
Government’s
business case
and approval
process for
projects & and
programmes.
55. CONFIDENTIAL & PROPRIETARY
Any use of this material without specific permission of Oxford Global Projects is strictly prohibited
Our definition of risk
Risk = Negative uncertainty (downside)
Uncertainty = More than one possible outcome, i.e., “more things can happen than will
happen”
Positive uncertainty = Opportunity (upside)
Avg
Cost, schedule
or benefit
1sd 2sd
55
56. 56
M+ Museum in Hong Kong
• Hong Kong's M+ Museum (set opening date at RCF80;
managed to hit that target).
• From an initial HK$21.6 billion ($2.75 billion) to more
than HK$47.1 billion ($6 billion) after a reevaluation in
2013 and almost HK$70 billion ($8.91 billion) in 2021.
(M+ itself had an initial cost of HK$5.9 billion [$750
million] that city authorities confirmed has been
exceeded). On a broader scale, despite the district’s built
progress, there is still a lack of clear proposed public
policy that would foster local art production, a void
which paints the scheme as tourism-oriented rather than
for the benefit of the city’s arts scene.
CONFIDENTIAL & PROPRIETARY
Any use of this material without specific permission of Oxford Global Projects is strictly prohibited
https://www.scmp.com/news/hong-kong/hong-kong-economy/article/3103507/head-hong-kongs-west-kowloon-cultural-district
57. Cost and schedule overrun
Cost overrun is calculated as 𝐴𝑐𝑡𝑢𝑎𝑙 𝑝𝑟𝑜𝑗𝑒𝑐𝑡 𝑐𝑜𝑠𝑡
𝐸𝑠𝑡𝑖𝑚𝑎𝑡𝑒𝑑 𝑝𝑟𝑜𝑗𝑒𝑐𝑡 𝑐𝑜𝑠𝑡
Schedule overrun is calculated as 𝐴𝑐𝑡𝑢𝑎𝑙 𝑝𝑟𝑜𝑗𝑒𝑐𝑡 𝑑𝑢𝑟𝑎𝑡𝑖𝑜𝑛
𝐸𝑠𝑡𝑖𝑚𝑎𝑡𝑒𝑑 𝑝𝑟𝑜𝑗𝑒𝑐𝑡 𝑑𝑢𝑟𝑎𝑡𝑖𝑜𝑛
Actual project cost refers to total project cost, which
includes all costs that materialised in the project.
Estimated project cost is the most likely project cost
estimate. Same for schedule.
As such, the overrun RCF data represent how much
additional budget or time projects needed to complete.
-30%
-20%
-10%
0%
10%
20%
30%
40%
50%
60%
70%
5% 15% 25% 35% 45% 55% 65% 75% 85% 95%
57
58. Productivity 1995-Today
(GDP created by 1 hour of work in each industry baselined to 1995 = 100)
Note: 27 EU countries 58
100
125
150
175
200
1995 2000 2005 2010 2015 2020
Year
Productivity
per
hour
worked
(1996=100) Construction
Finance
ICT
Industry
Manufacturing
Prof. services
Trade
ICT
Manufacturing
Industry
Finance
Trade
Construction
Professional services