Downloaded 91 times
![Linear
Name – Constant
Equation –
Domain – (-∝,∝)
Range – [b]
y b=](https://image.slidesharecdn.com/professionalstudiespowerpoint-140311090905-phpapp01/75/Functions-for-Grade-10-11-2048.jpg)
![Trigonometric Functions
Name – Sine
Equation -y = a sin bx + c
Domain - (-∝,∝)
Range – [ 1. -1 ]
amplitude = a
period =
b
360°
phase shift = b
Vertical shift =c](https://image.slidesharecdn.com/professionalstudiespowerpoint-140311090905-phpapp01/75/Functions-for-Grade-10-25-2048.jpg)
![Trigonometric Functions
Name – Cosine
Equation - y = acosbx + c
amplitude = a
period =
b
360°
phase shift = b
Vertical shift =c
Domain - (-∝,∝)
Range – [ 1. -1 ]](https://image.slidesharecdn.com/professionalstudiespowerpoint-140311090905-phpapp01/75/Functions-for-Grade-10-26-2048.jpg)


This document discusses functions and their properties. It defines a function as a special relation where each first element is paired with exactly one second element. Functions are represented as sets of ordered pairs. The domain of a function is the set of all possible x-values, while the range is the set of all possible y-values. Functions can be represented graphically and through equations, and can be transformed through shifts, reflections, and stretching/shrinking. Common function families include linear, quadratic, exponential, and trigonometric functions.
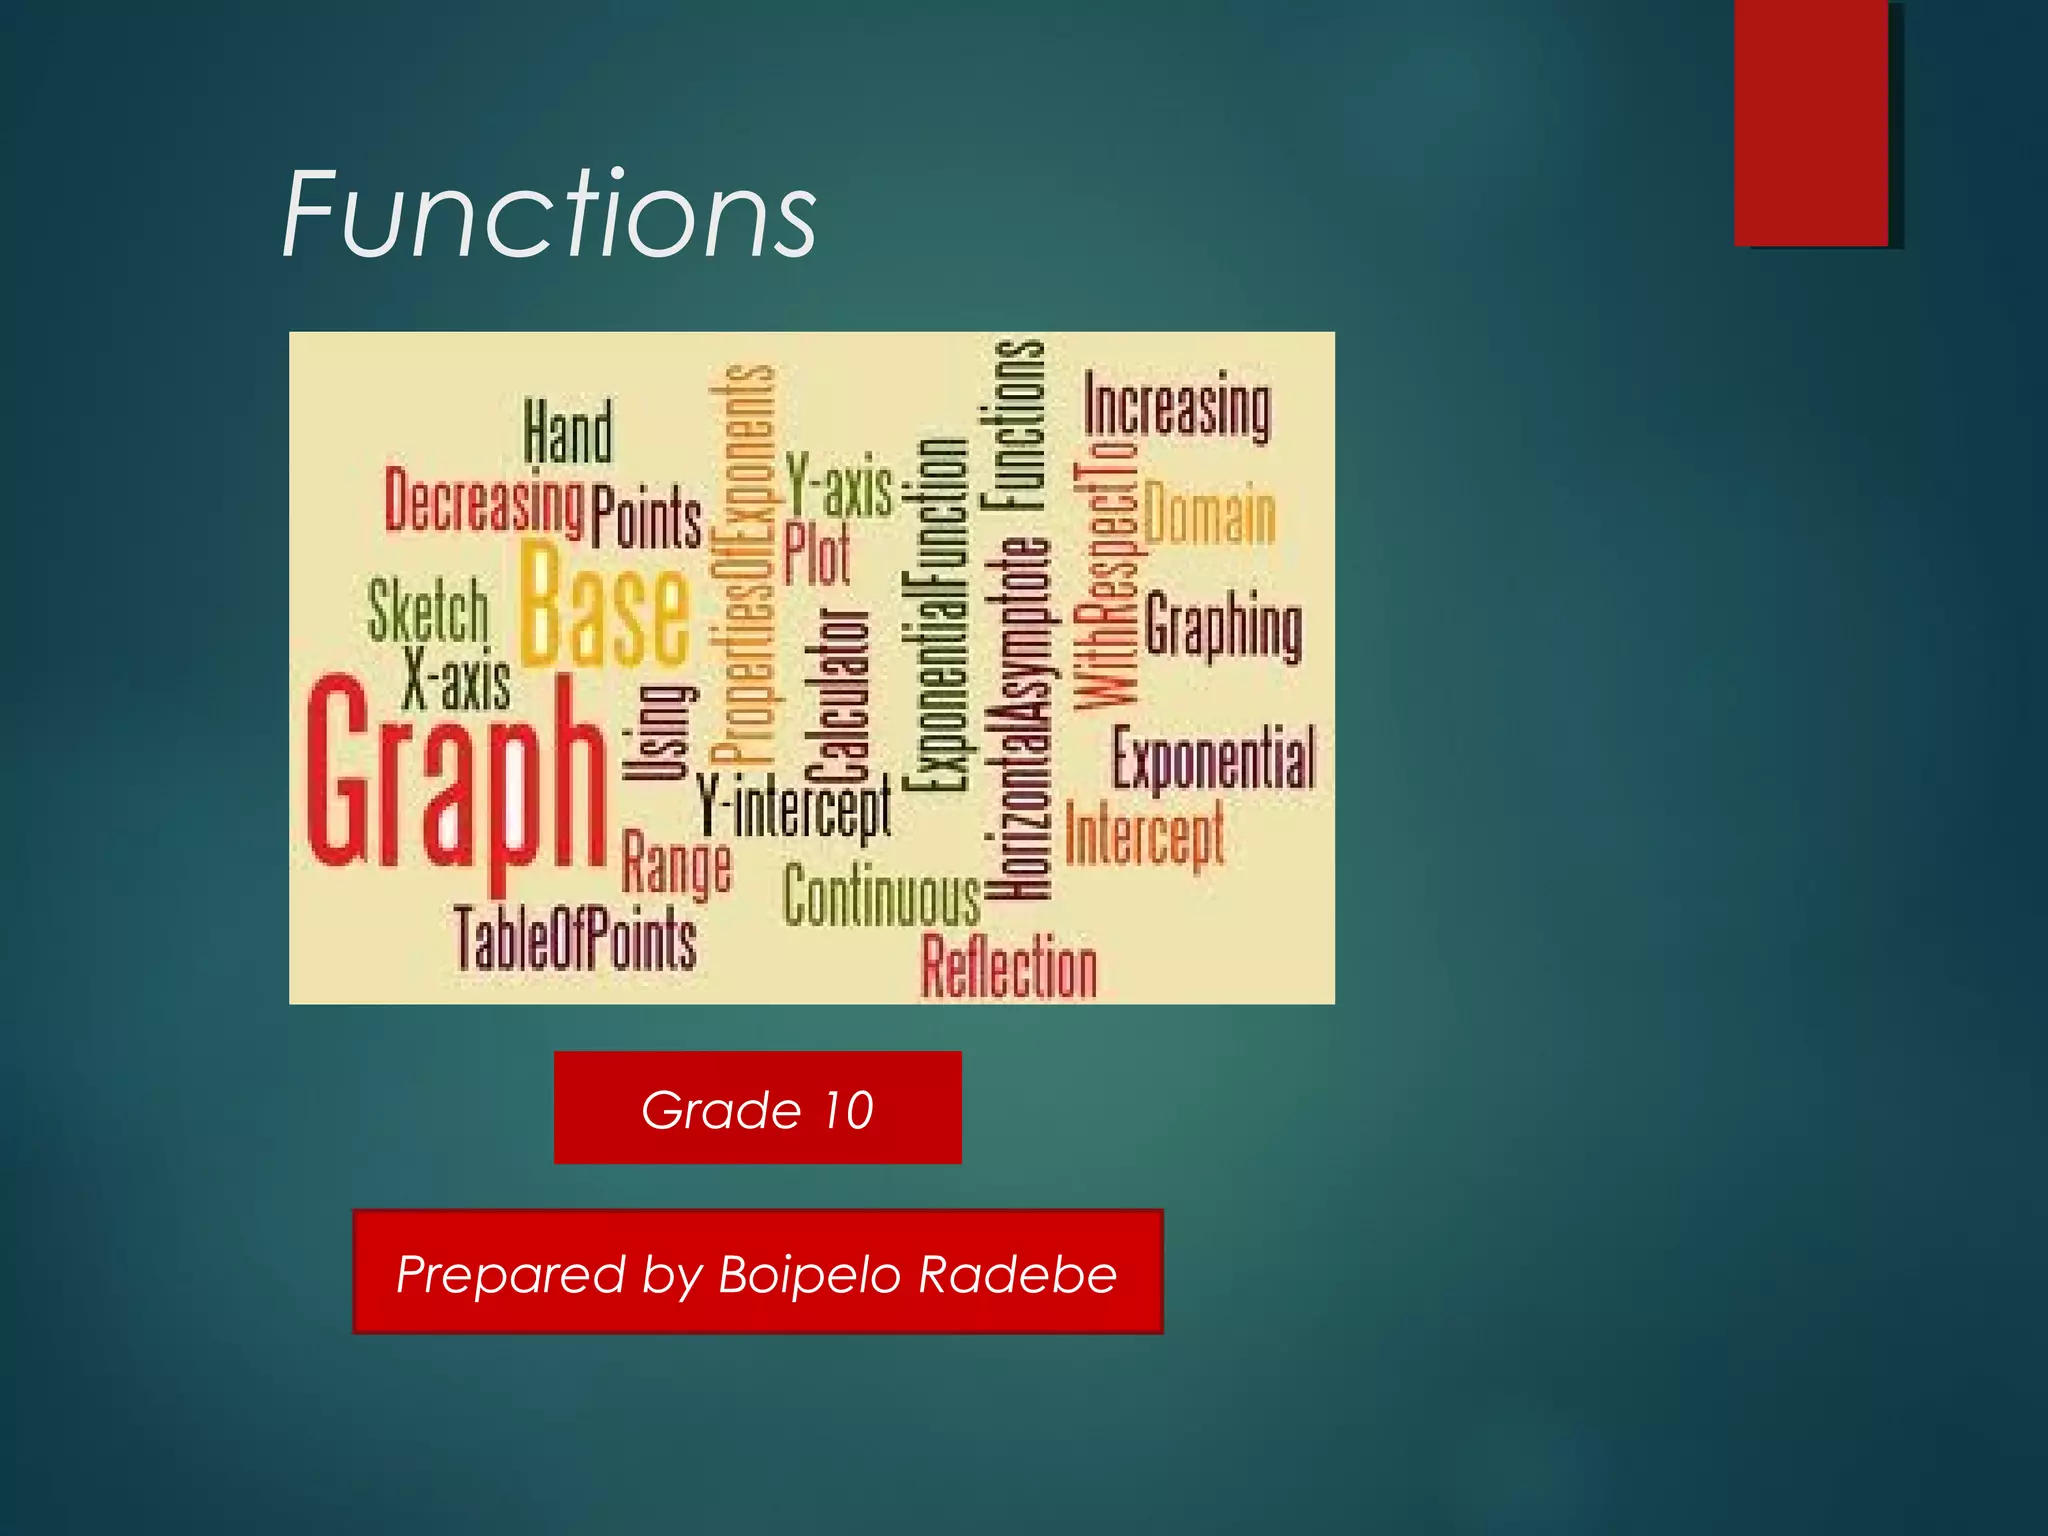
Introduction to the concept of functions in mathematics, prepared for Grade 10.
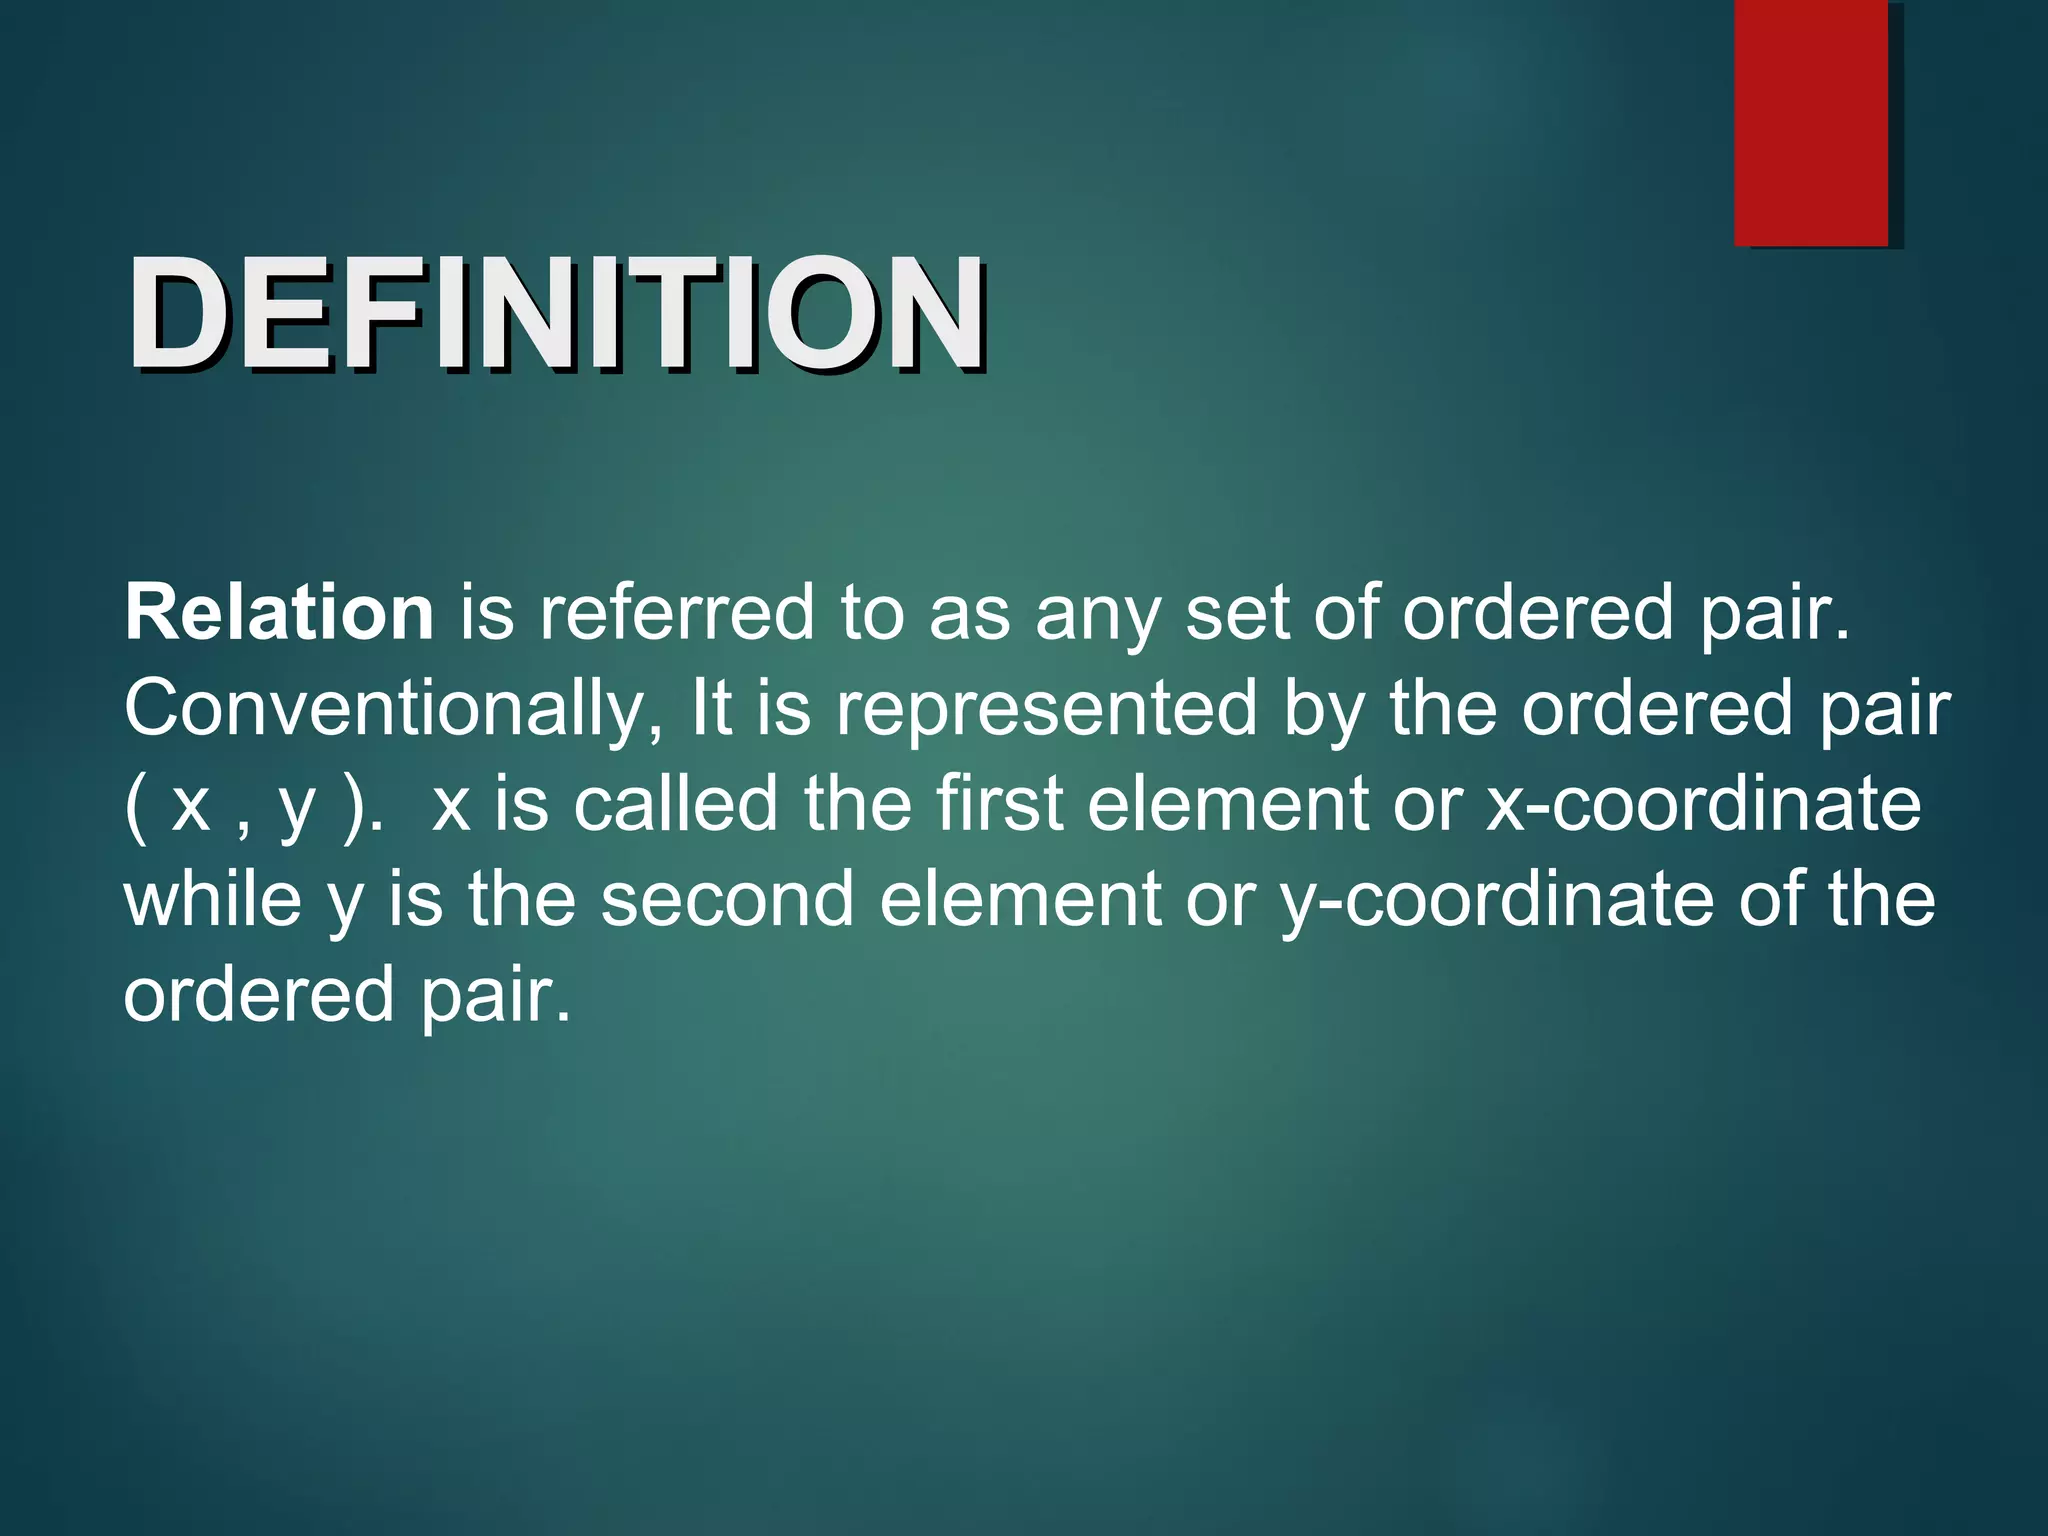
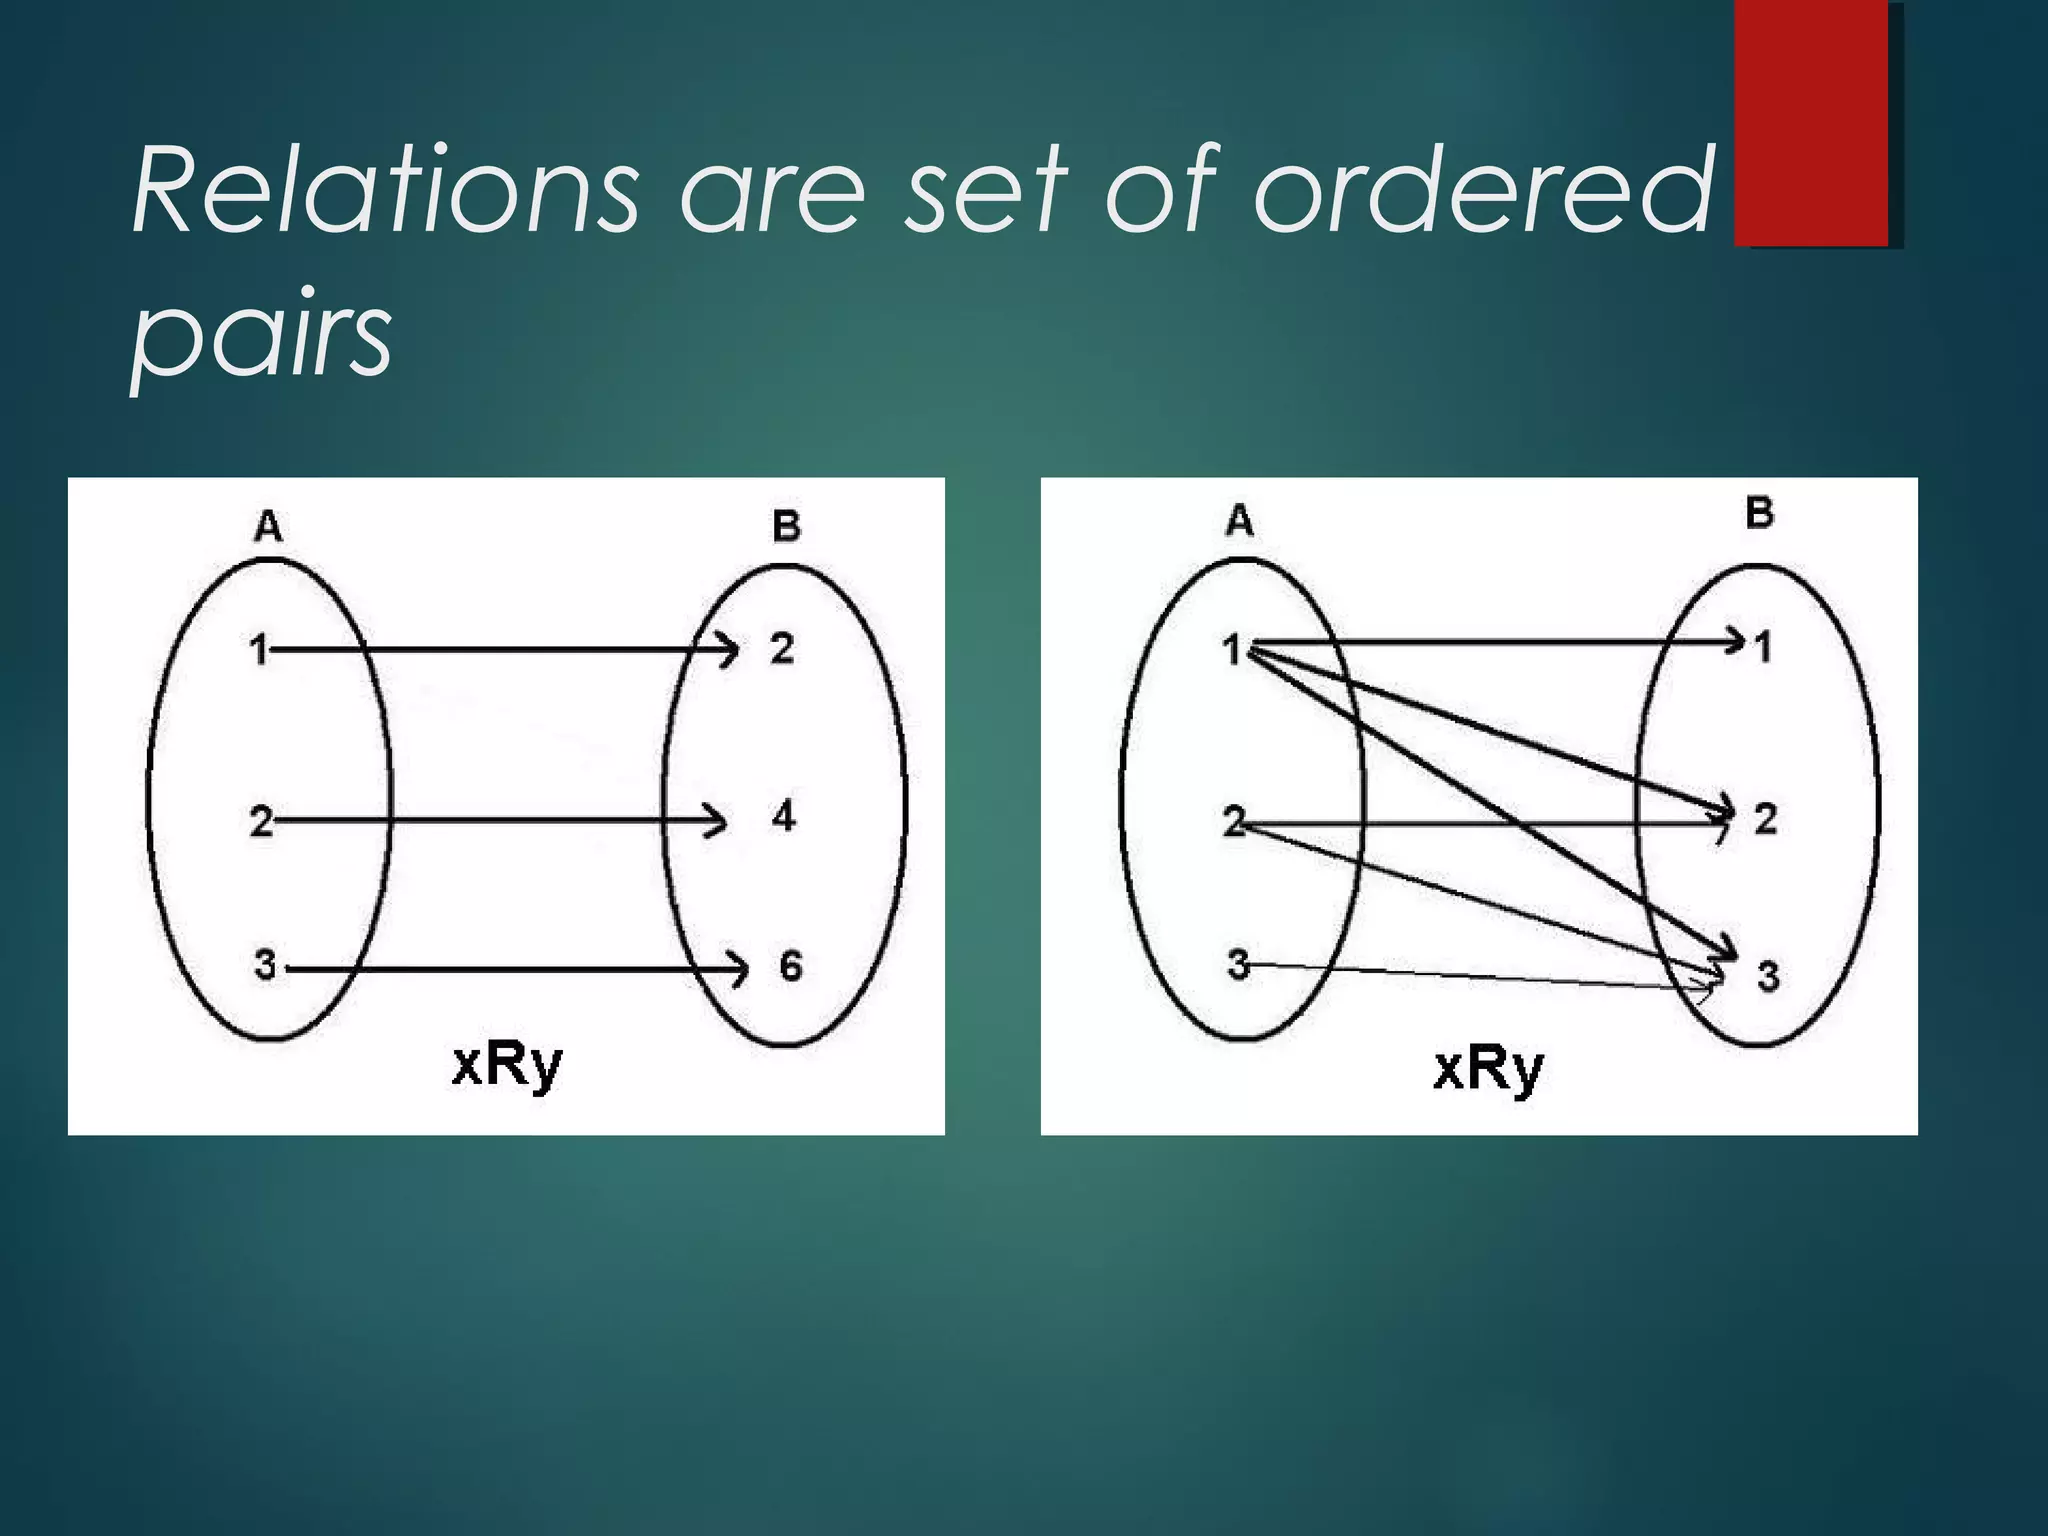
Relations are defined as sets of ordered pairs (x, y), where x is the x-coordinate and y is the y-coordinate.
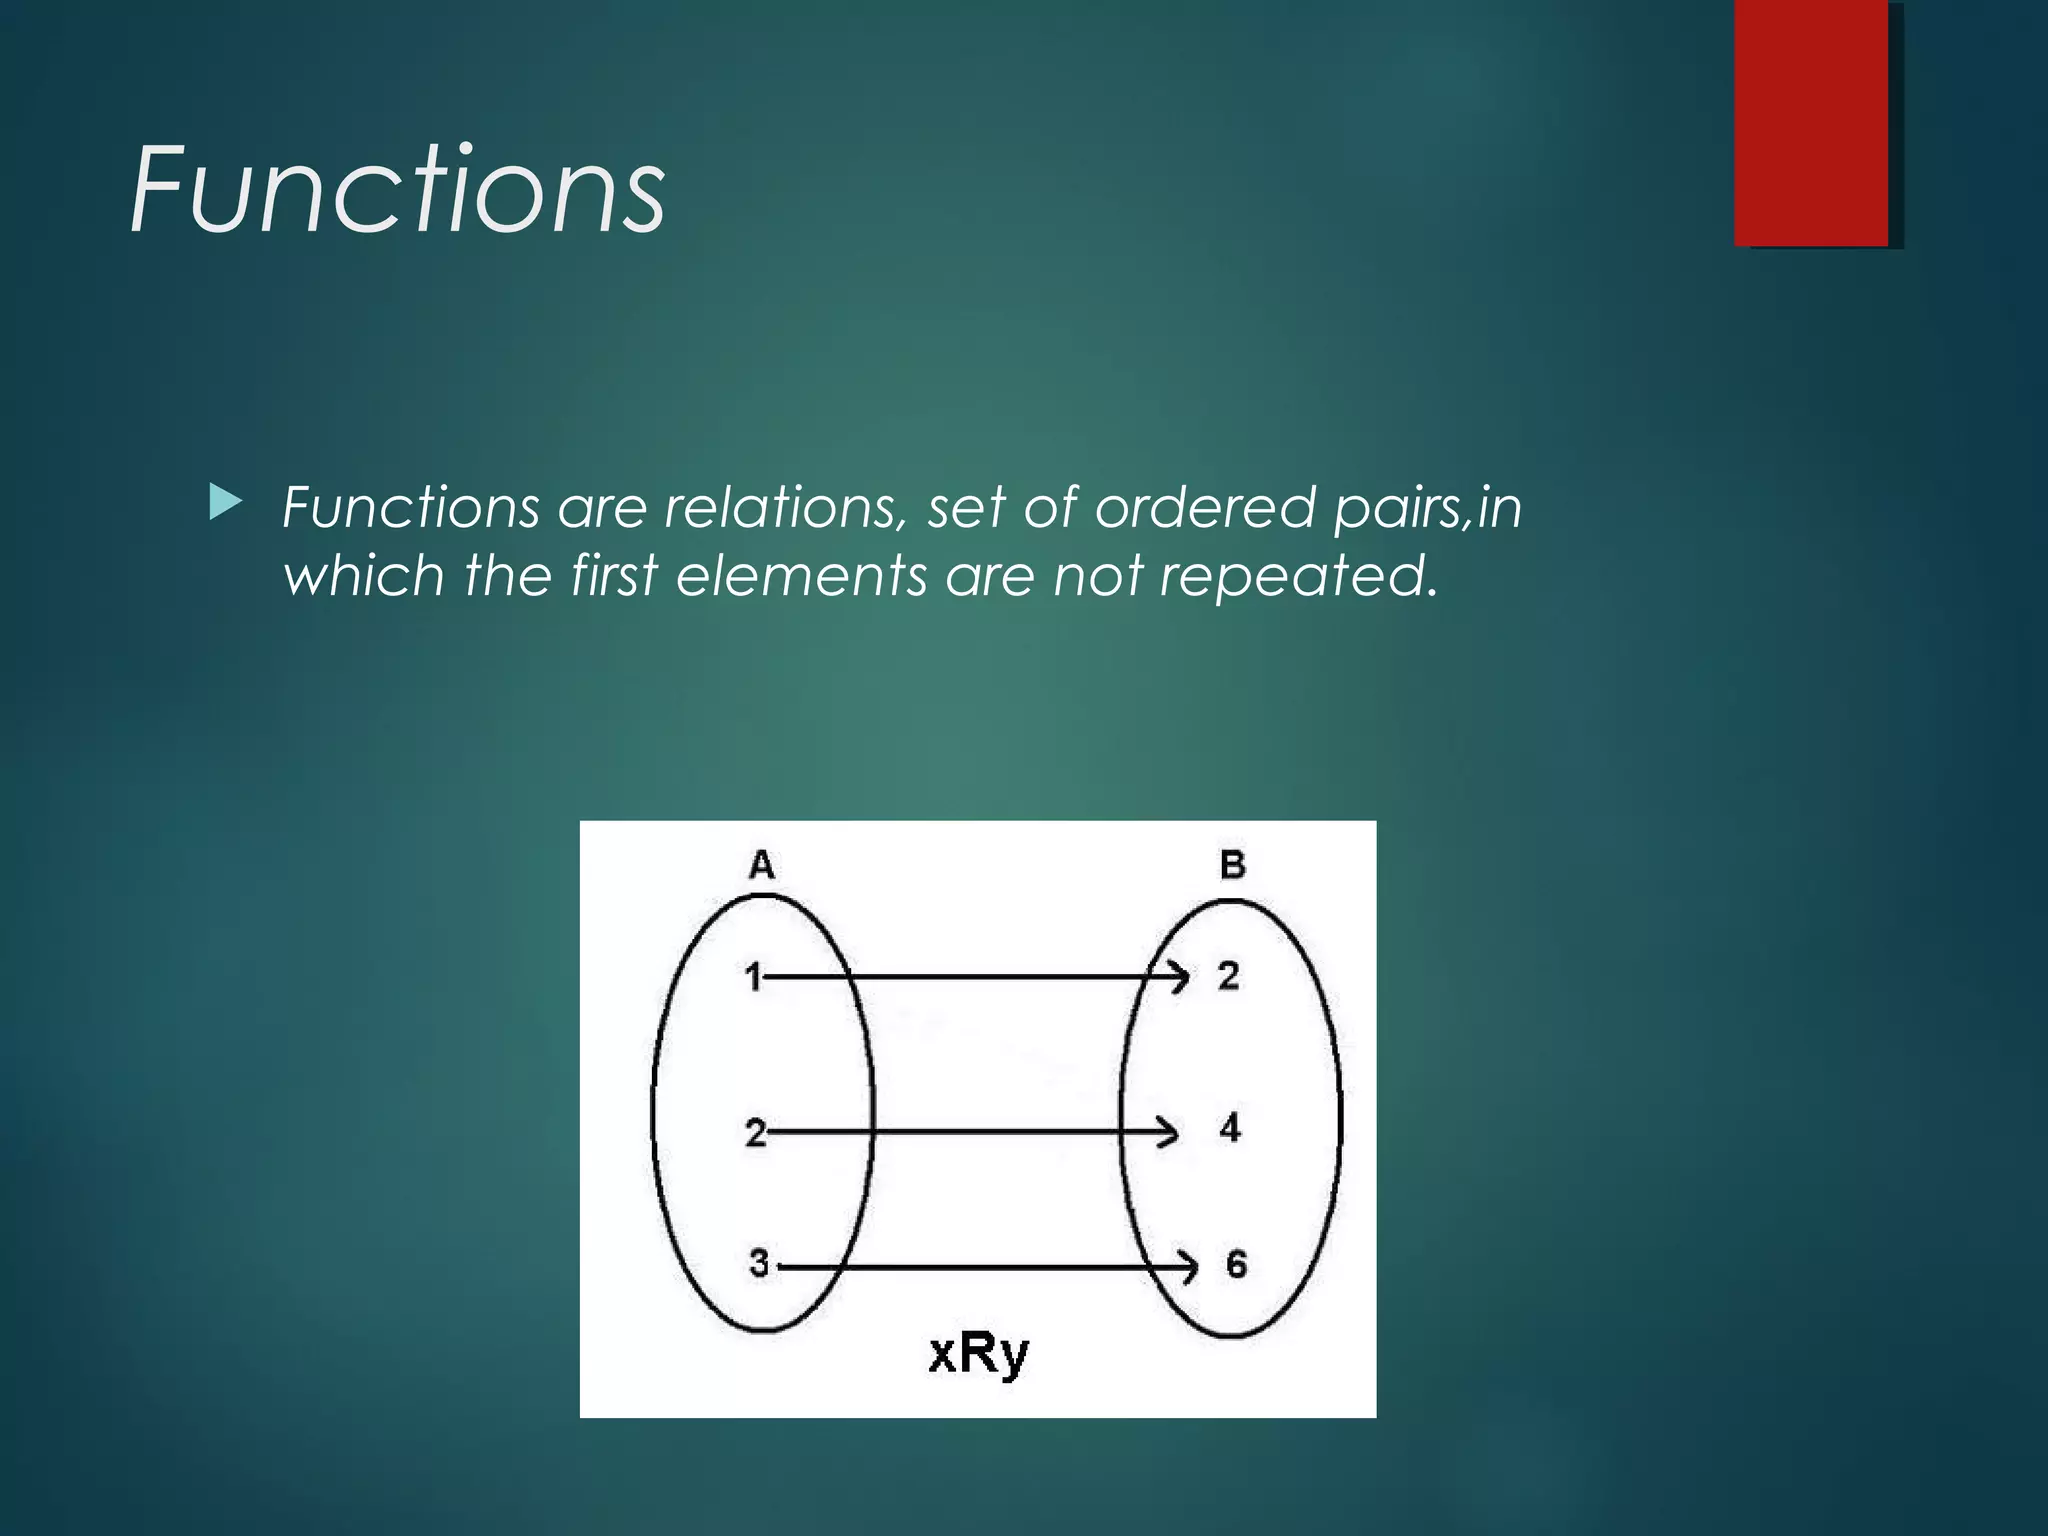
Functions are specific types of relations where every first element has a unique second element, forming a set of ordered pairs.
Introduction to function notation using letters like f, g, h. The notation f(x) denotes the image of x.
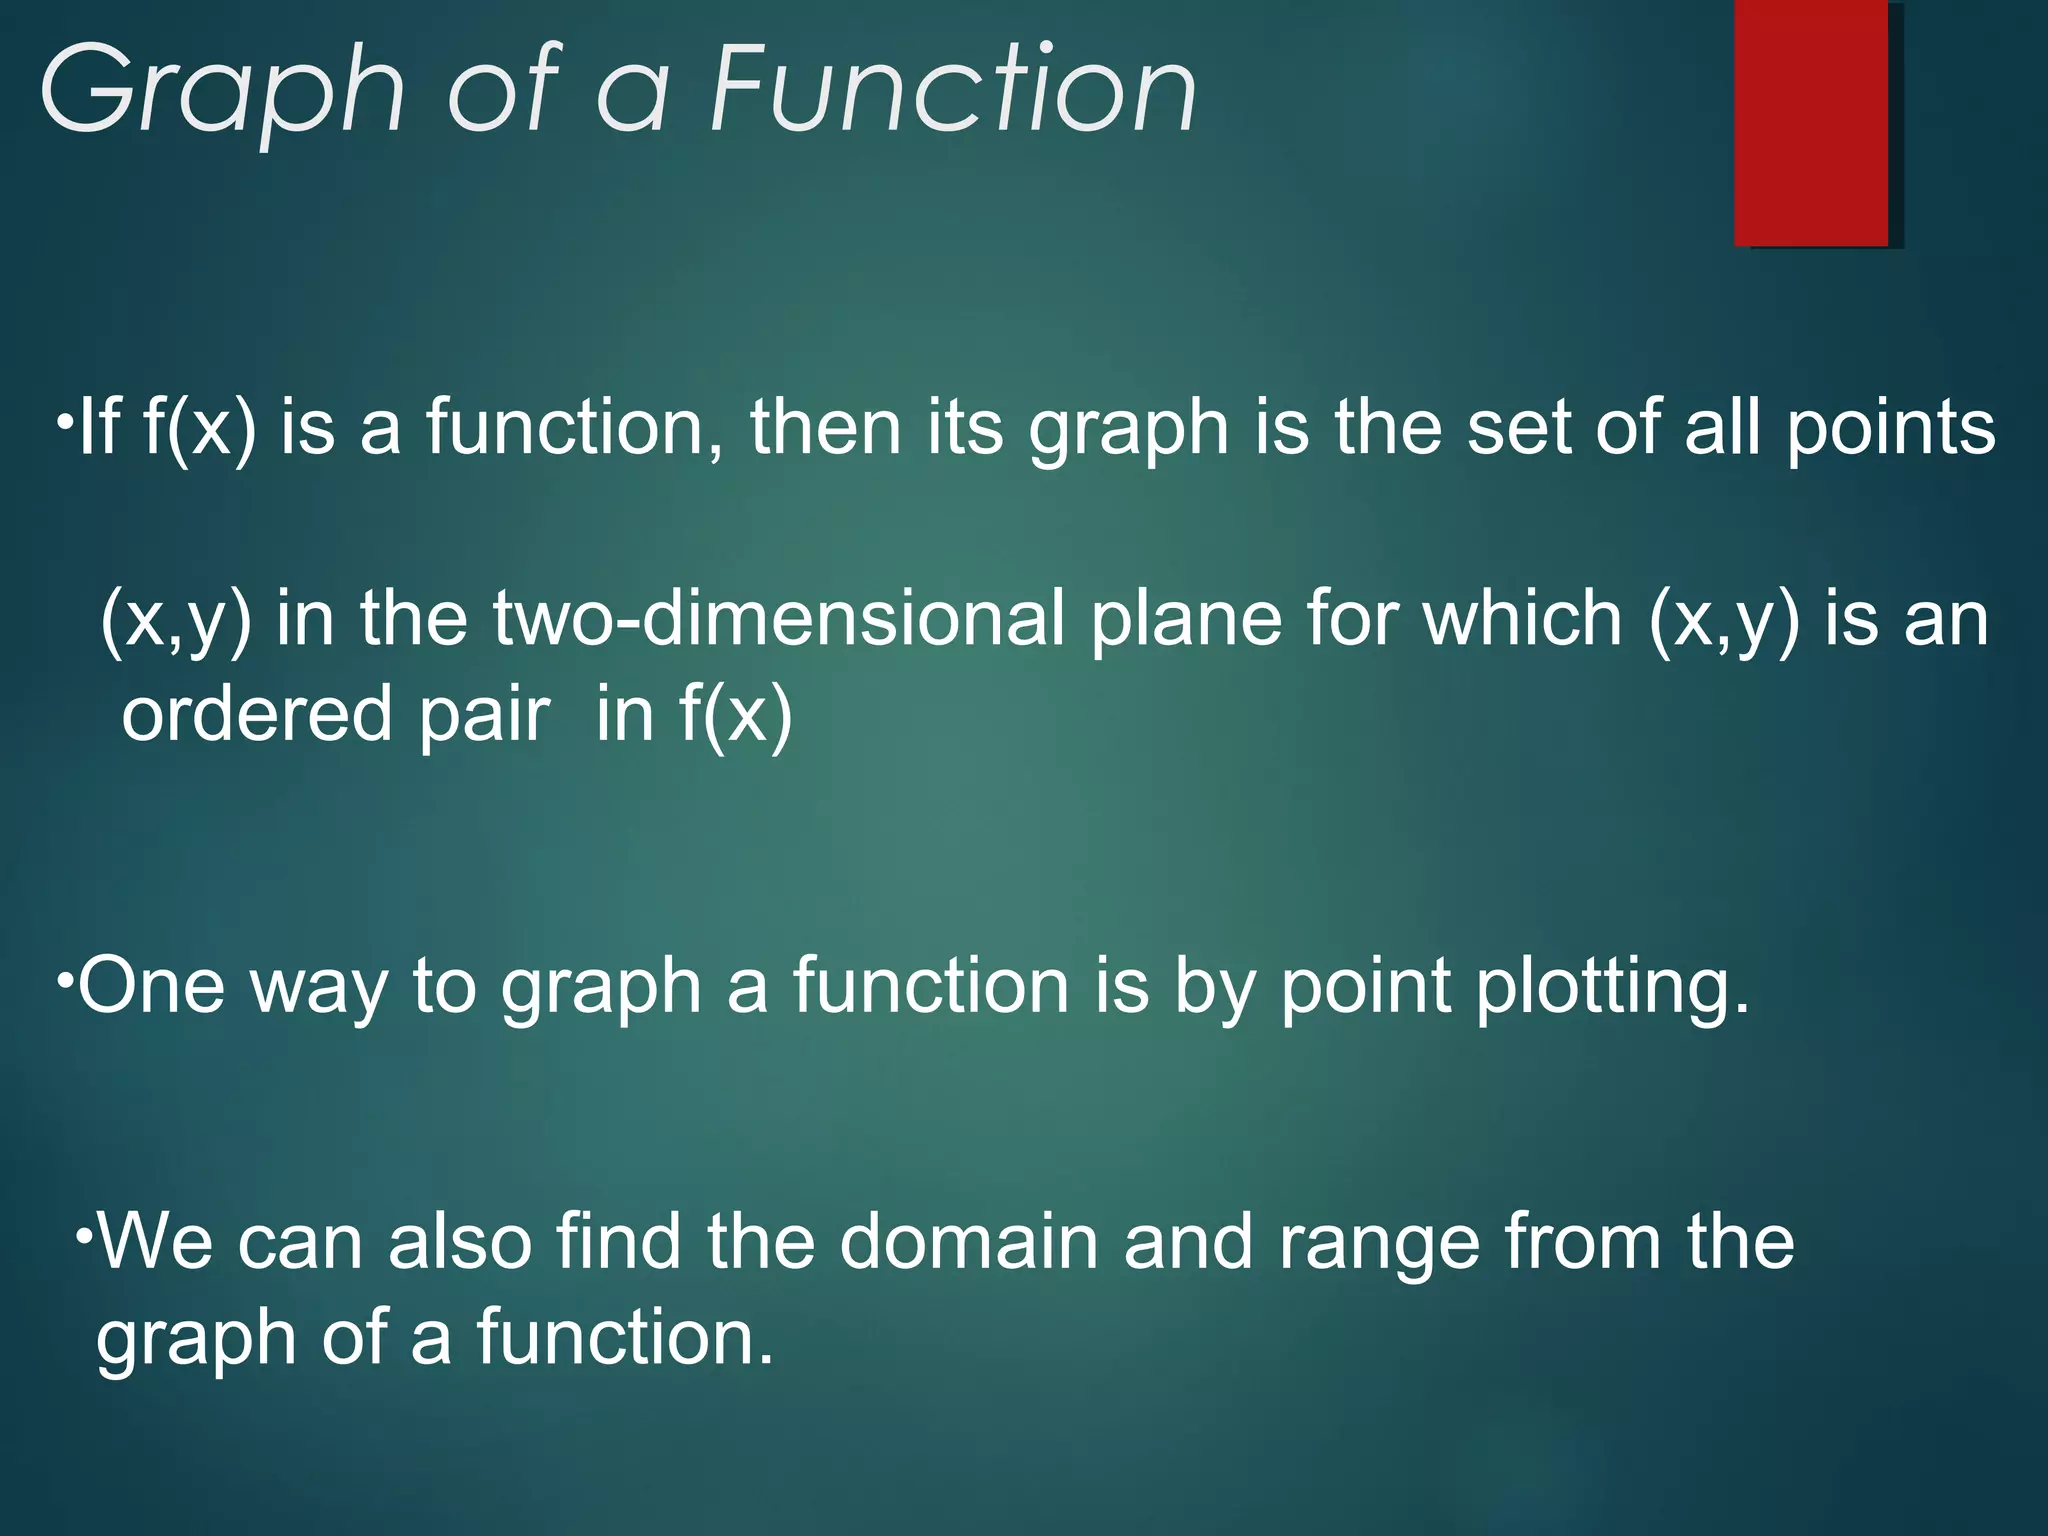
Graphs represent functions as sets of points (x, y) in a two-dimensional plane, highlighting the domain and range.
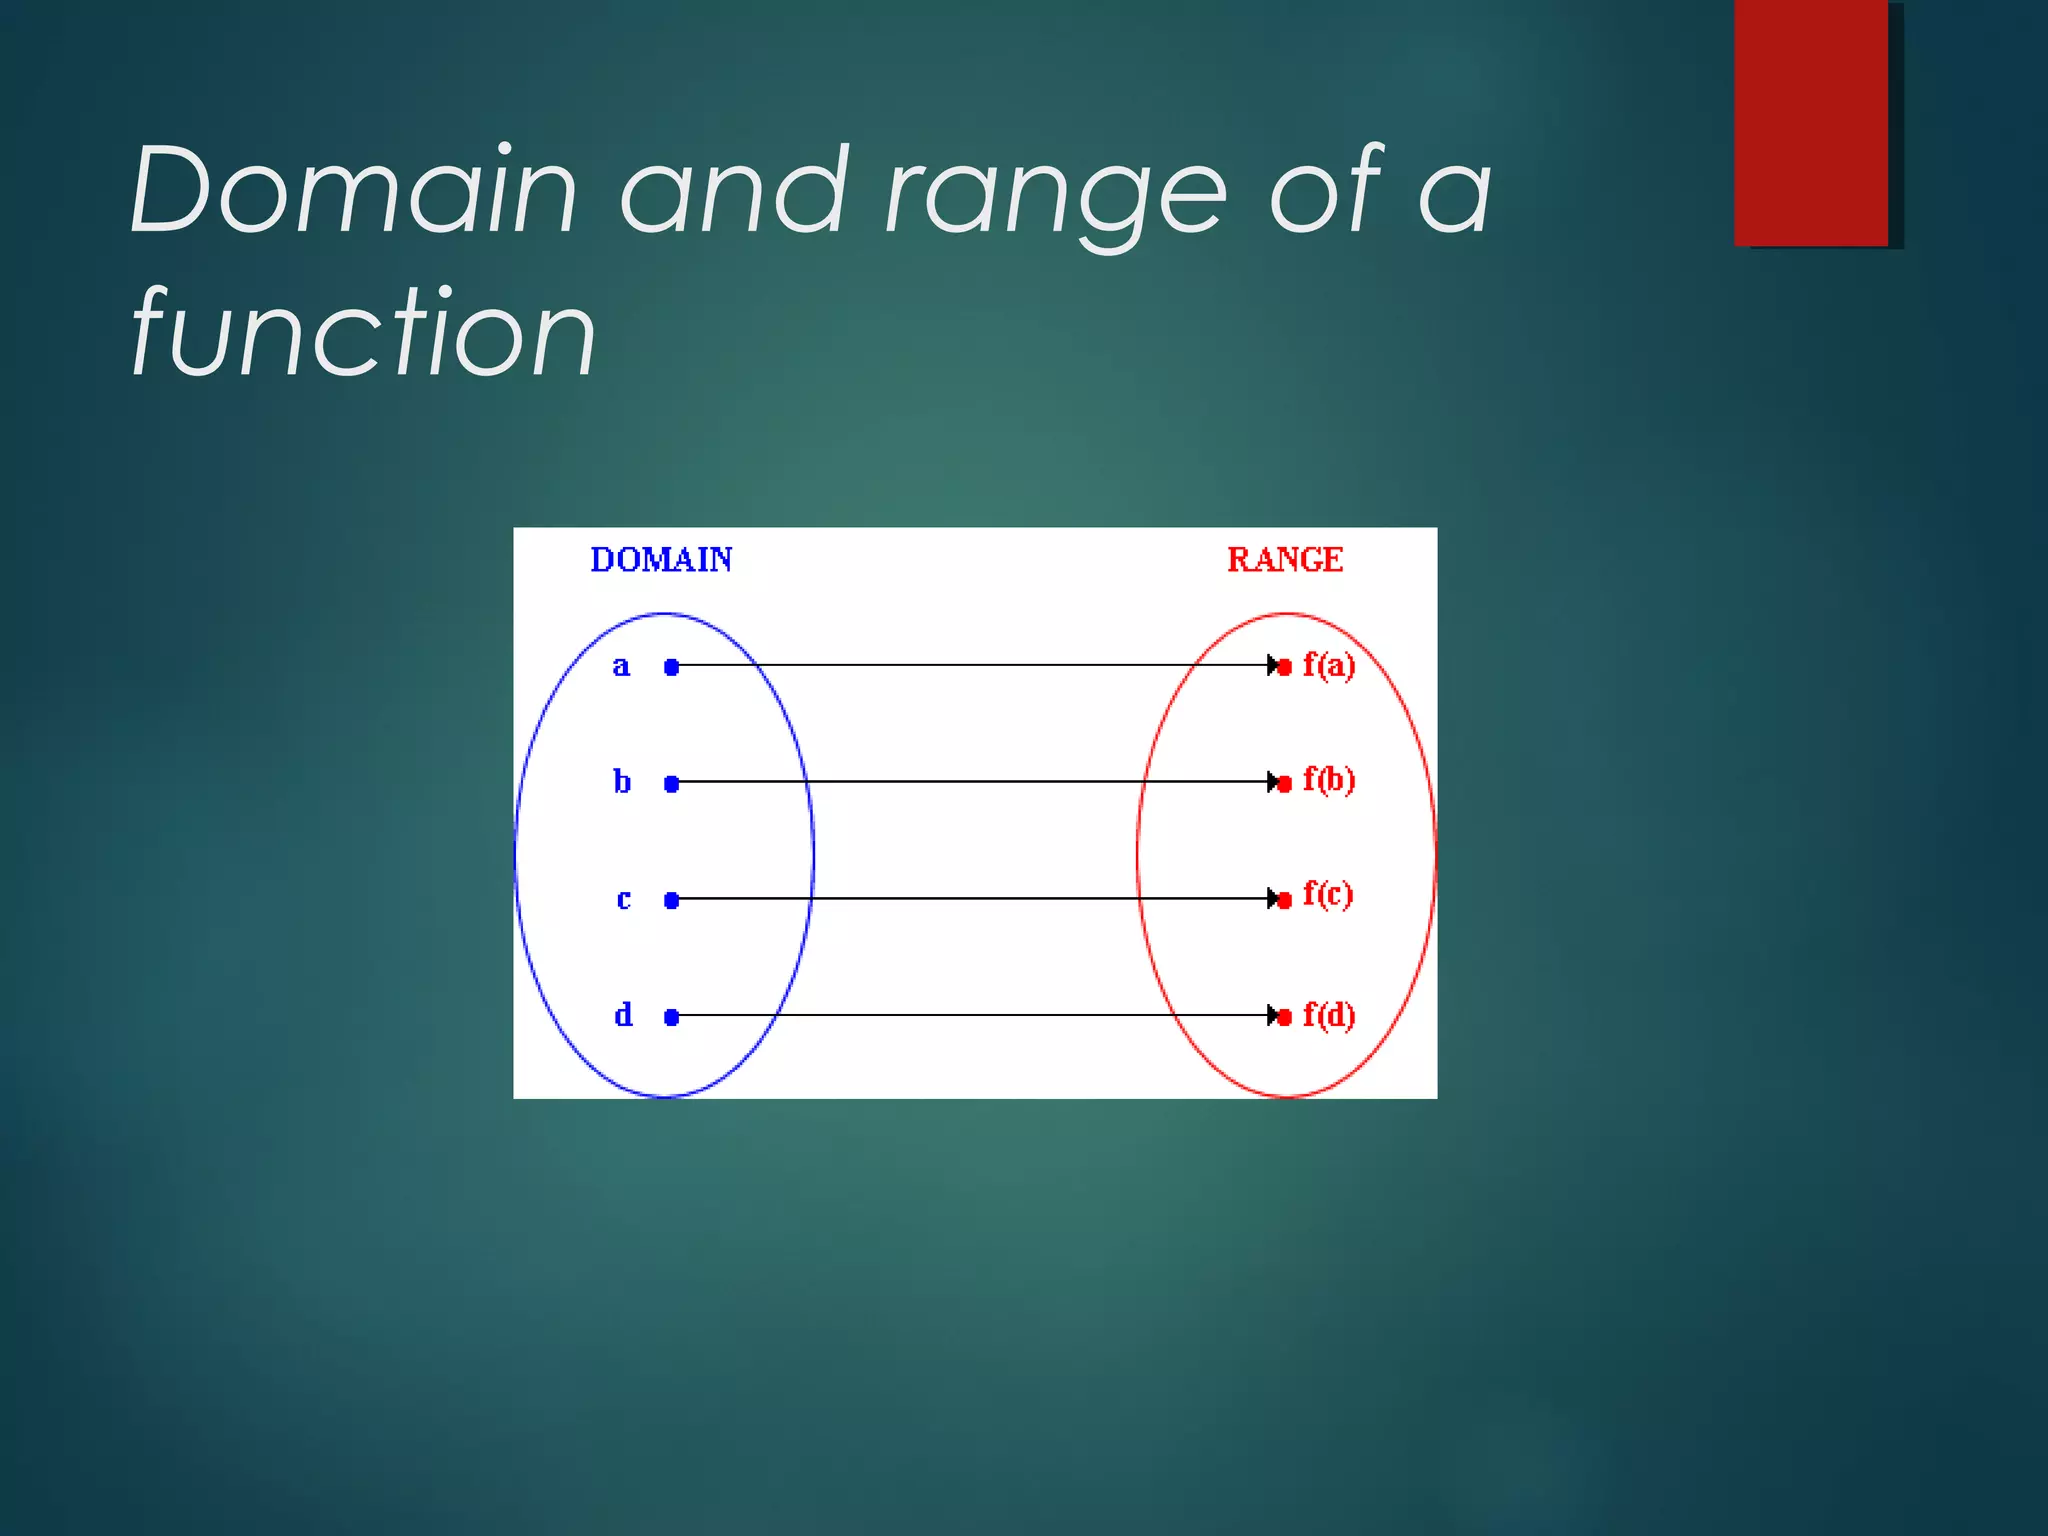
Definition of domain (all x-values) and range (all y-values) of a function, based on ordered pairs.
Introduction to 7 function families and essential elements like name, equation, domain, and range.
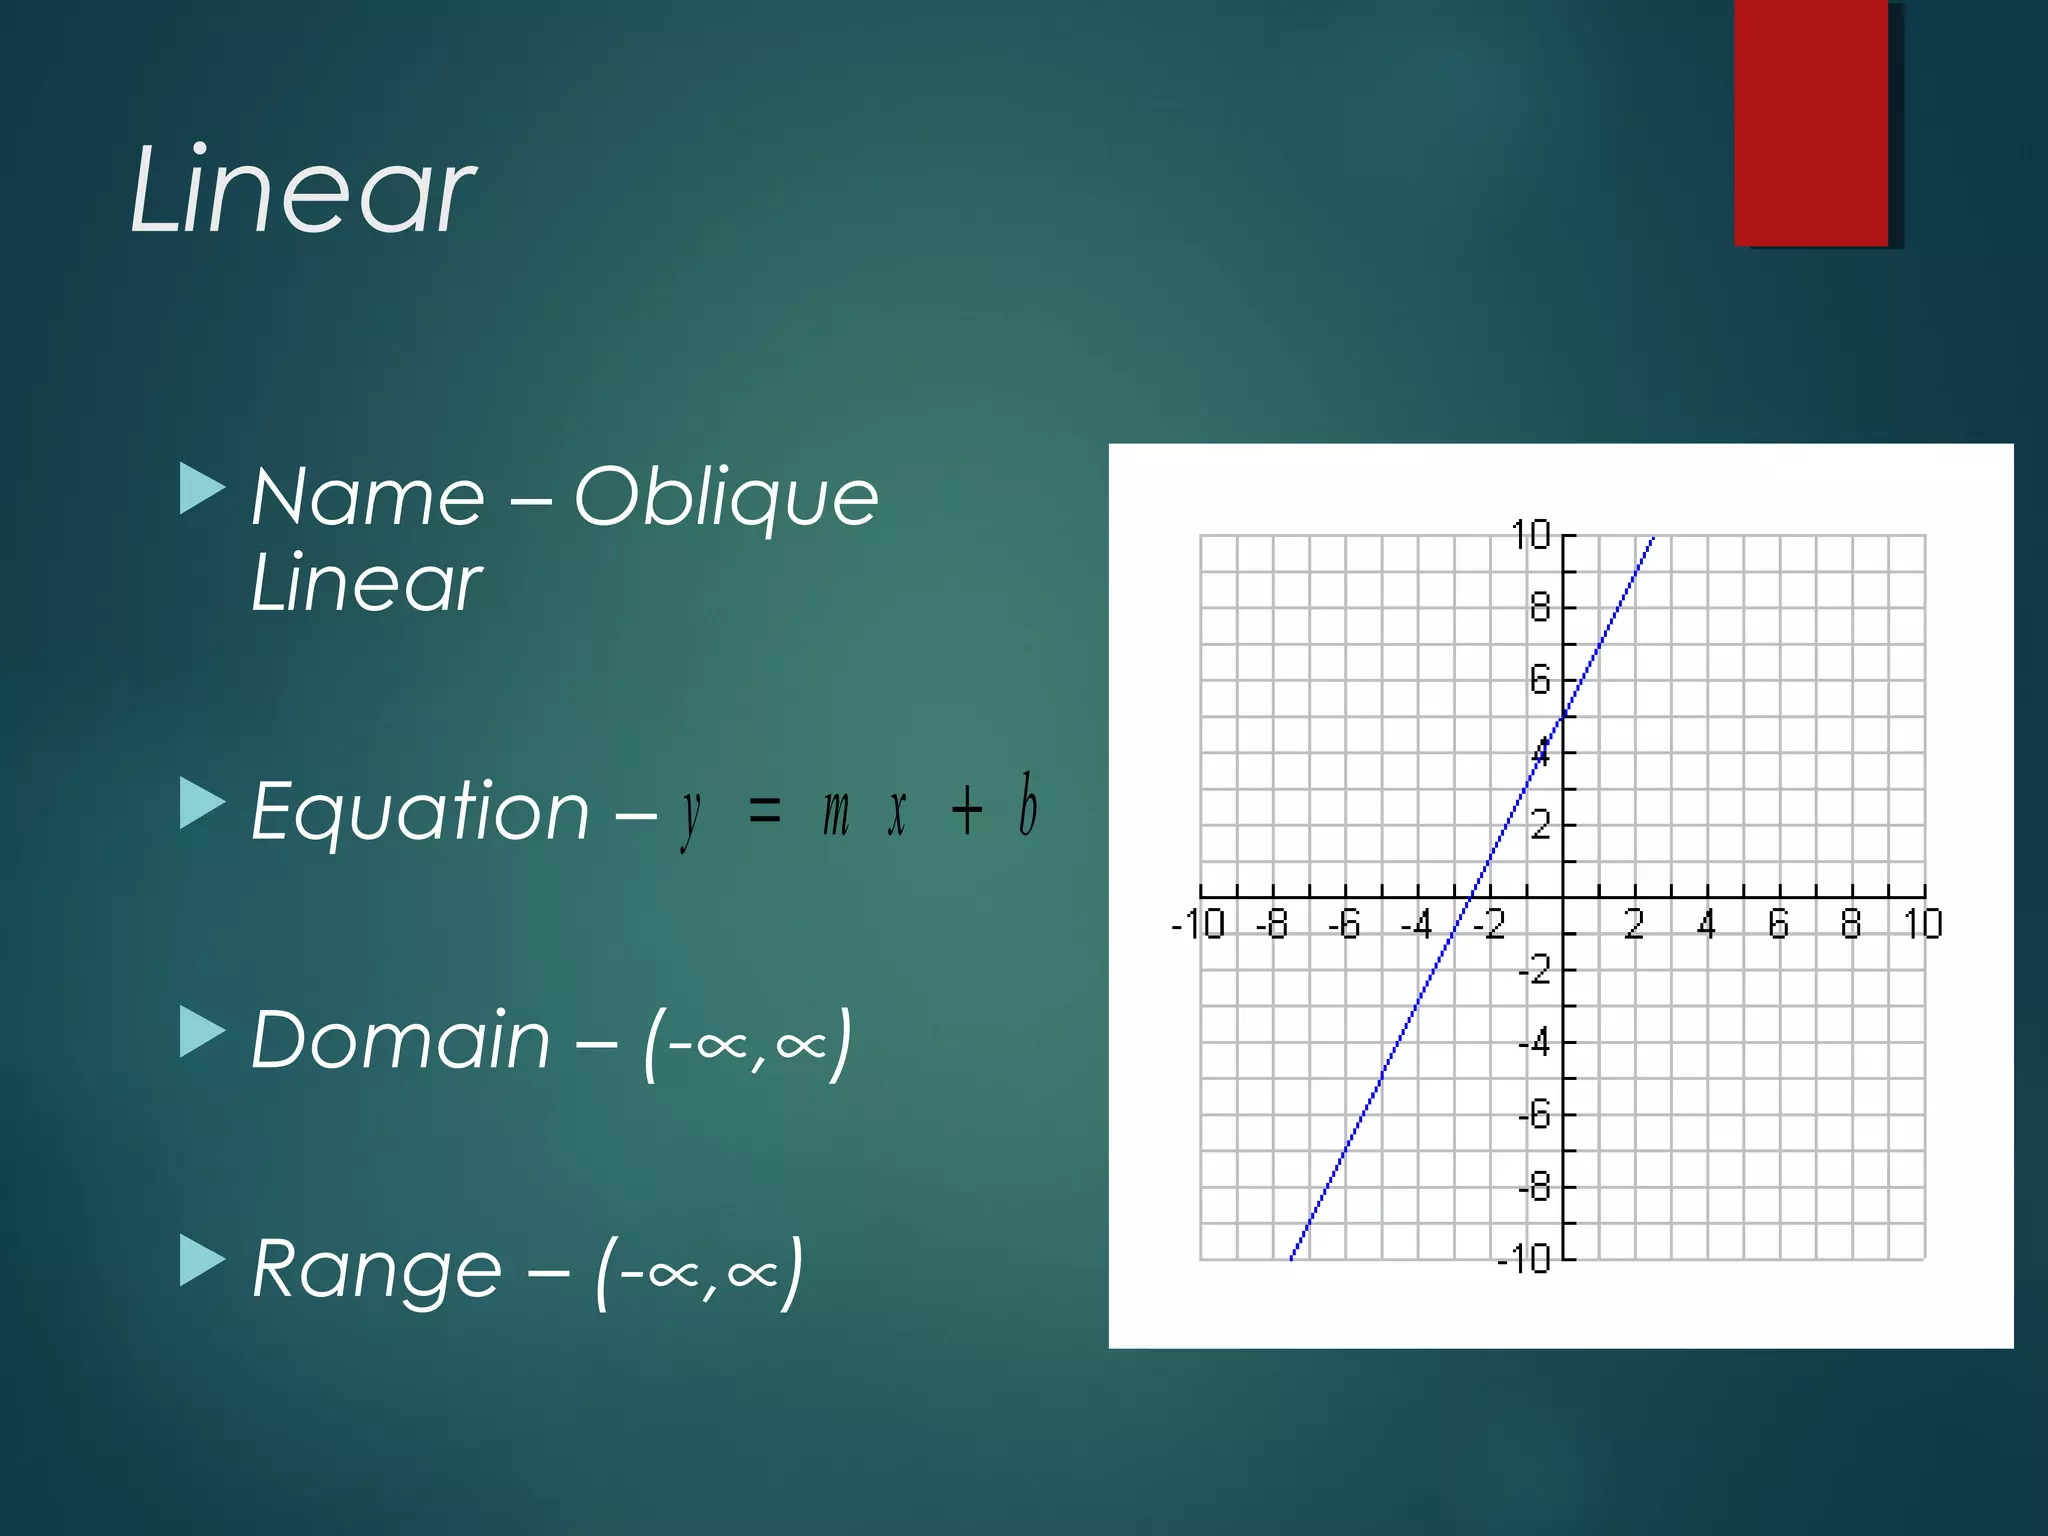
Details of linear functions including constant and oblique forms, covering their equations, domains, and ranges.
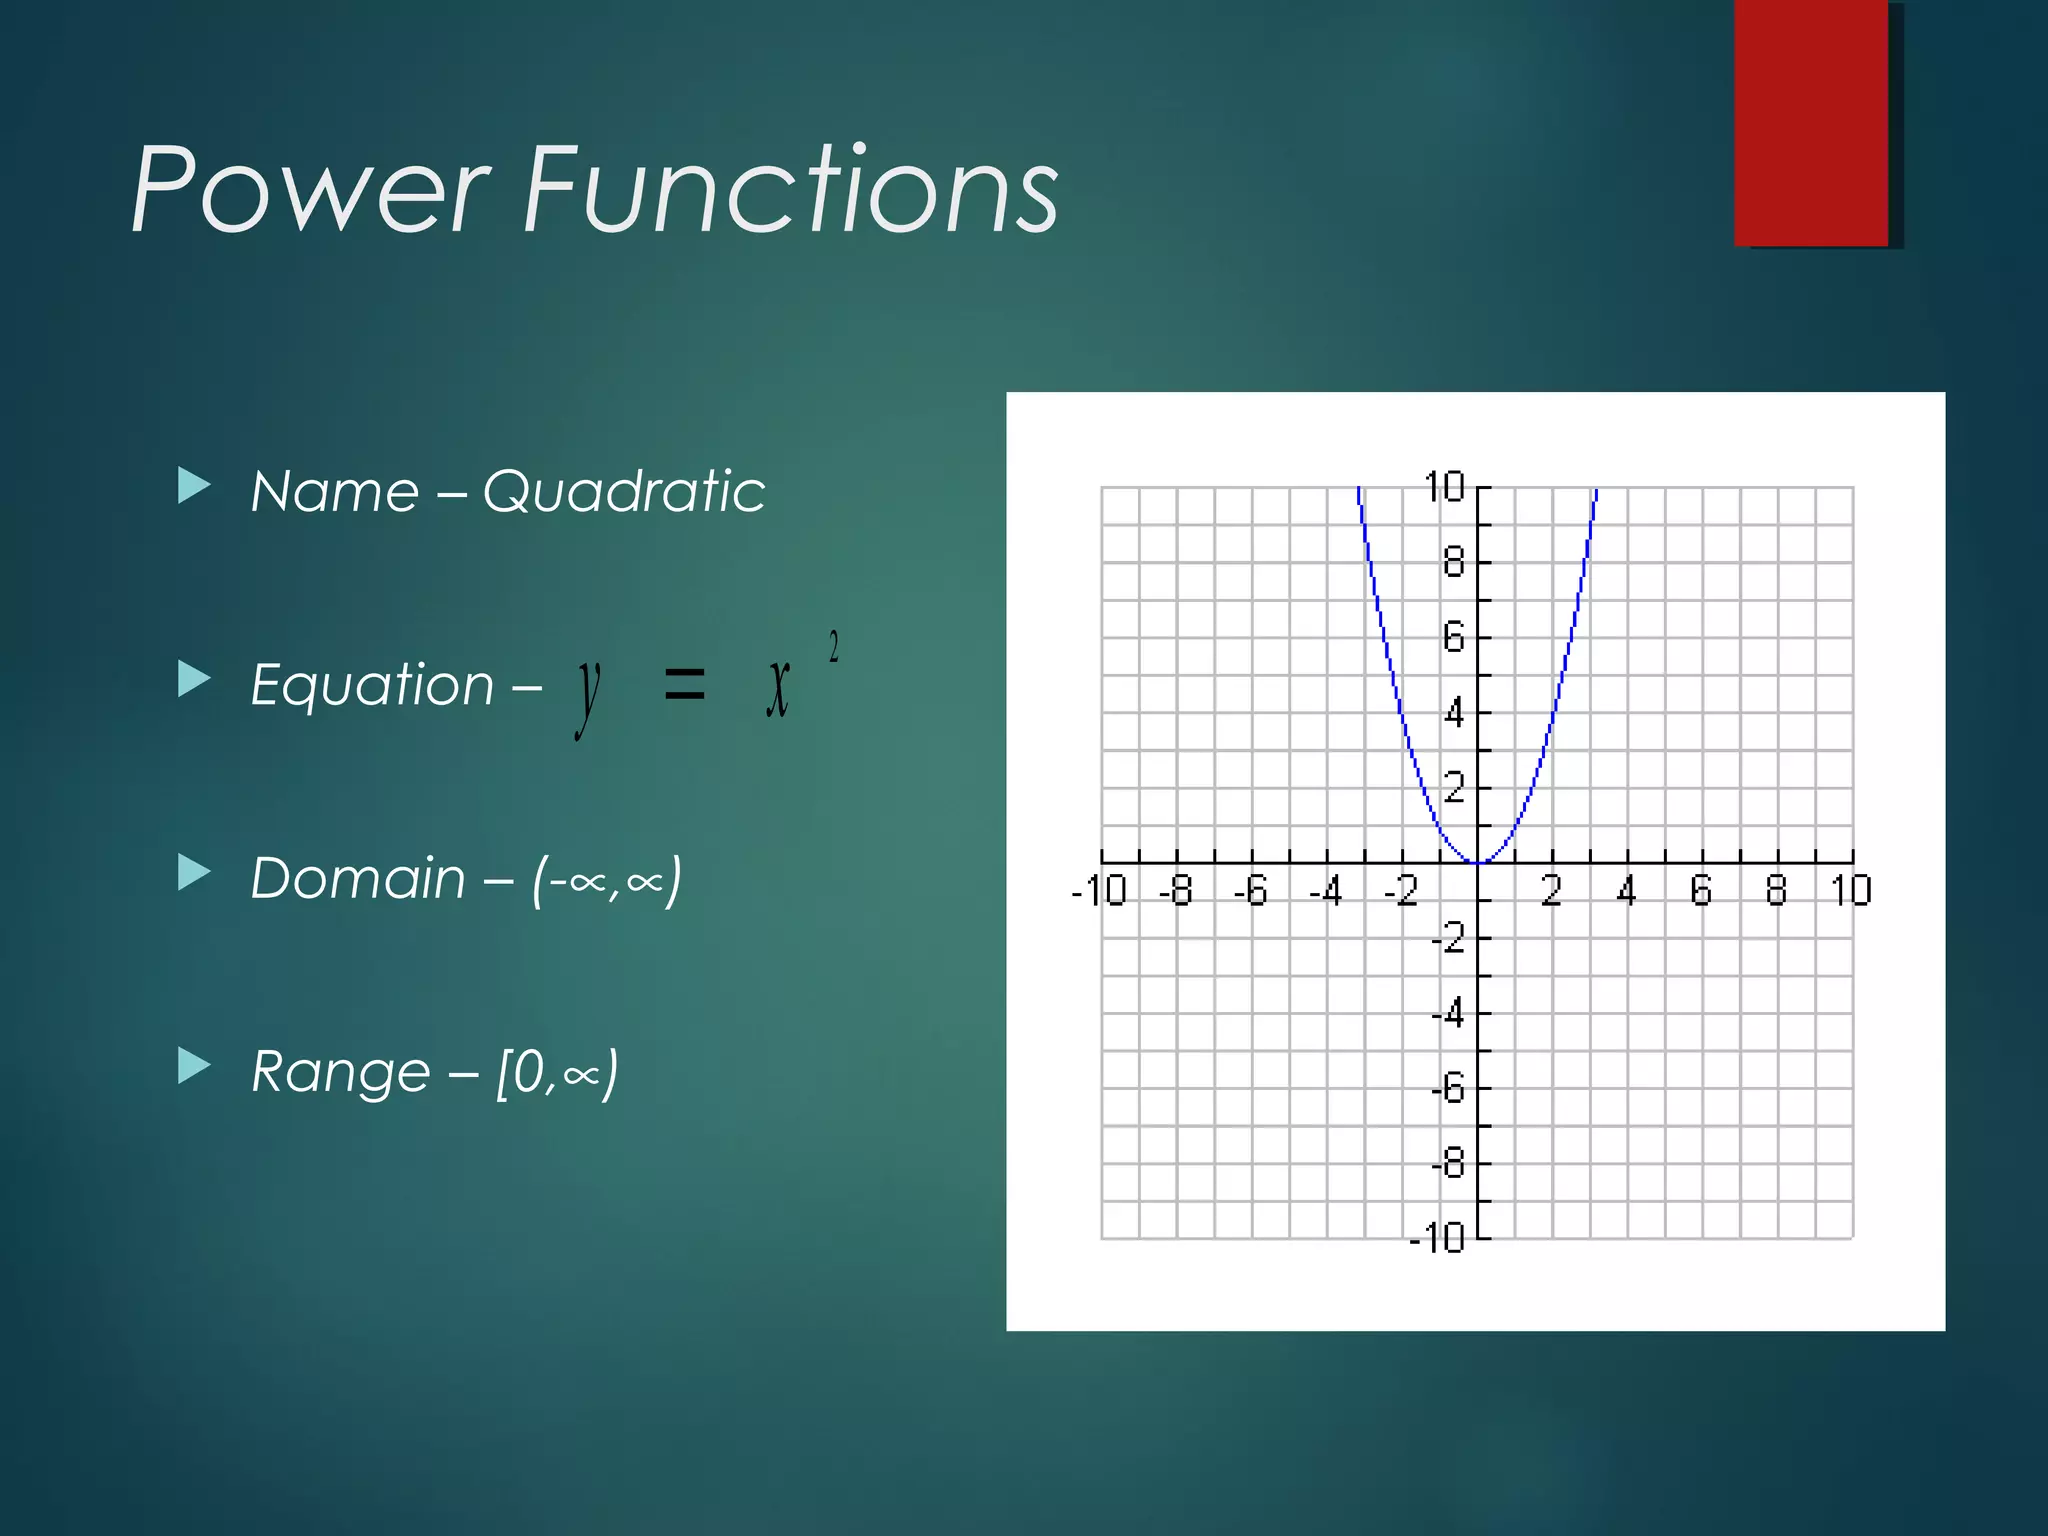
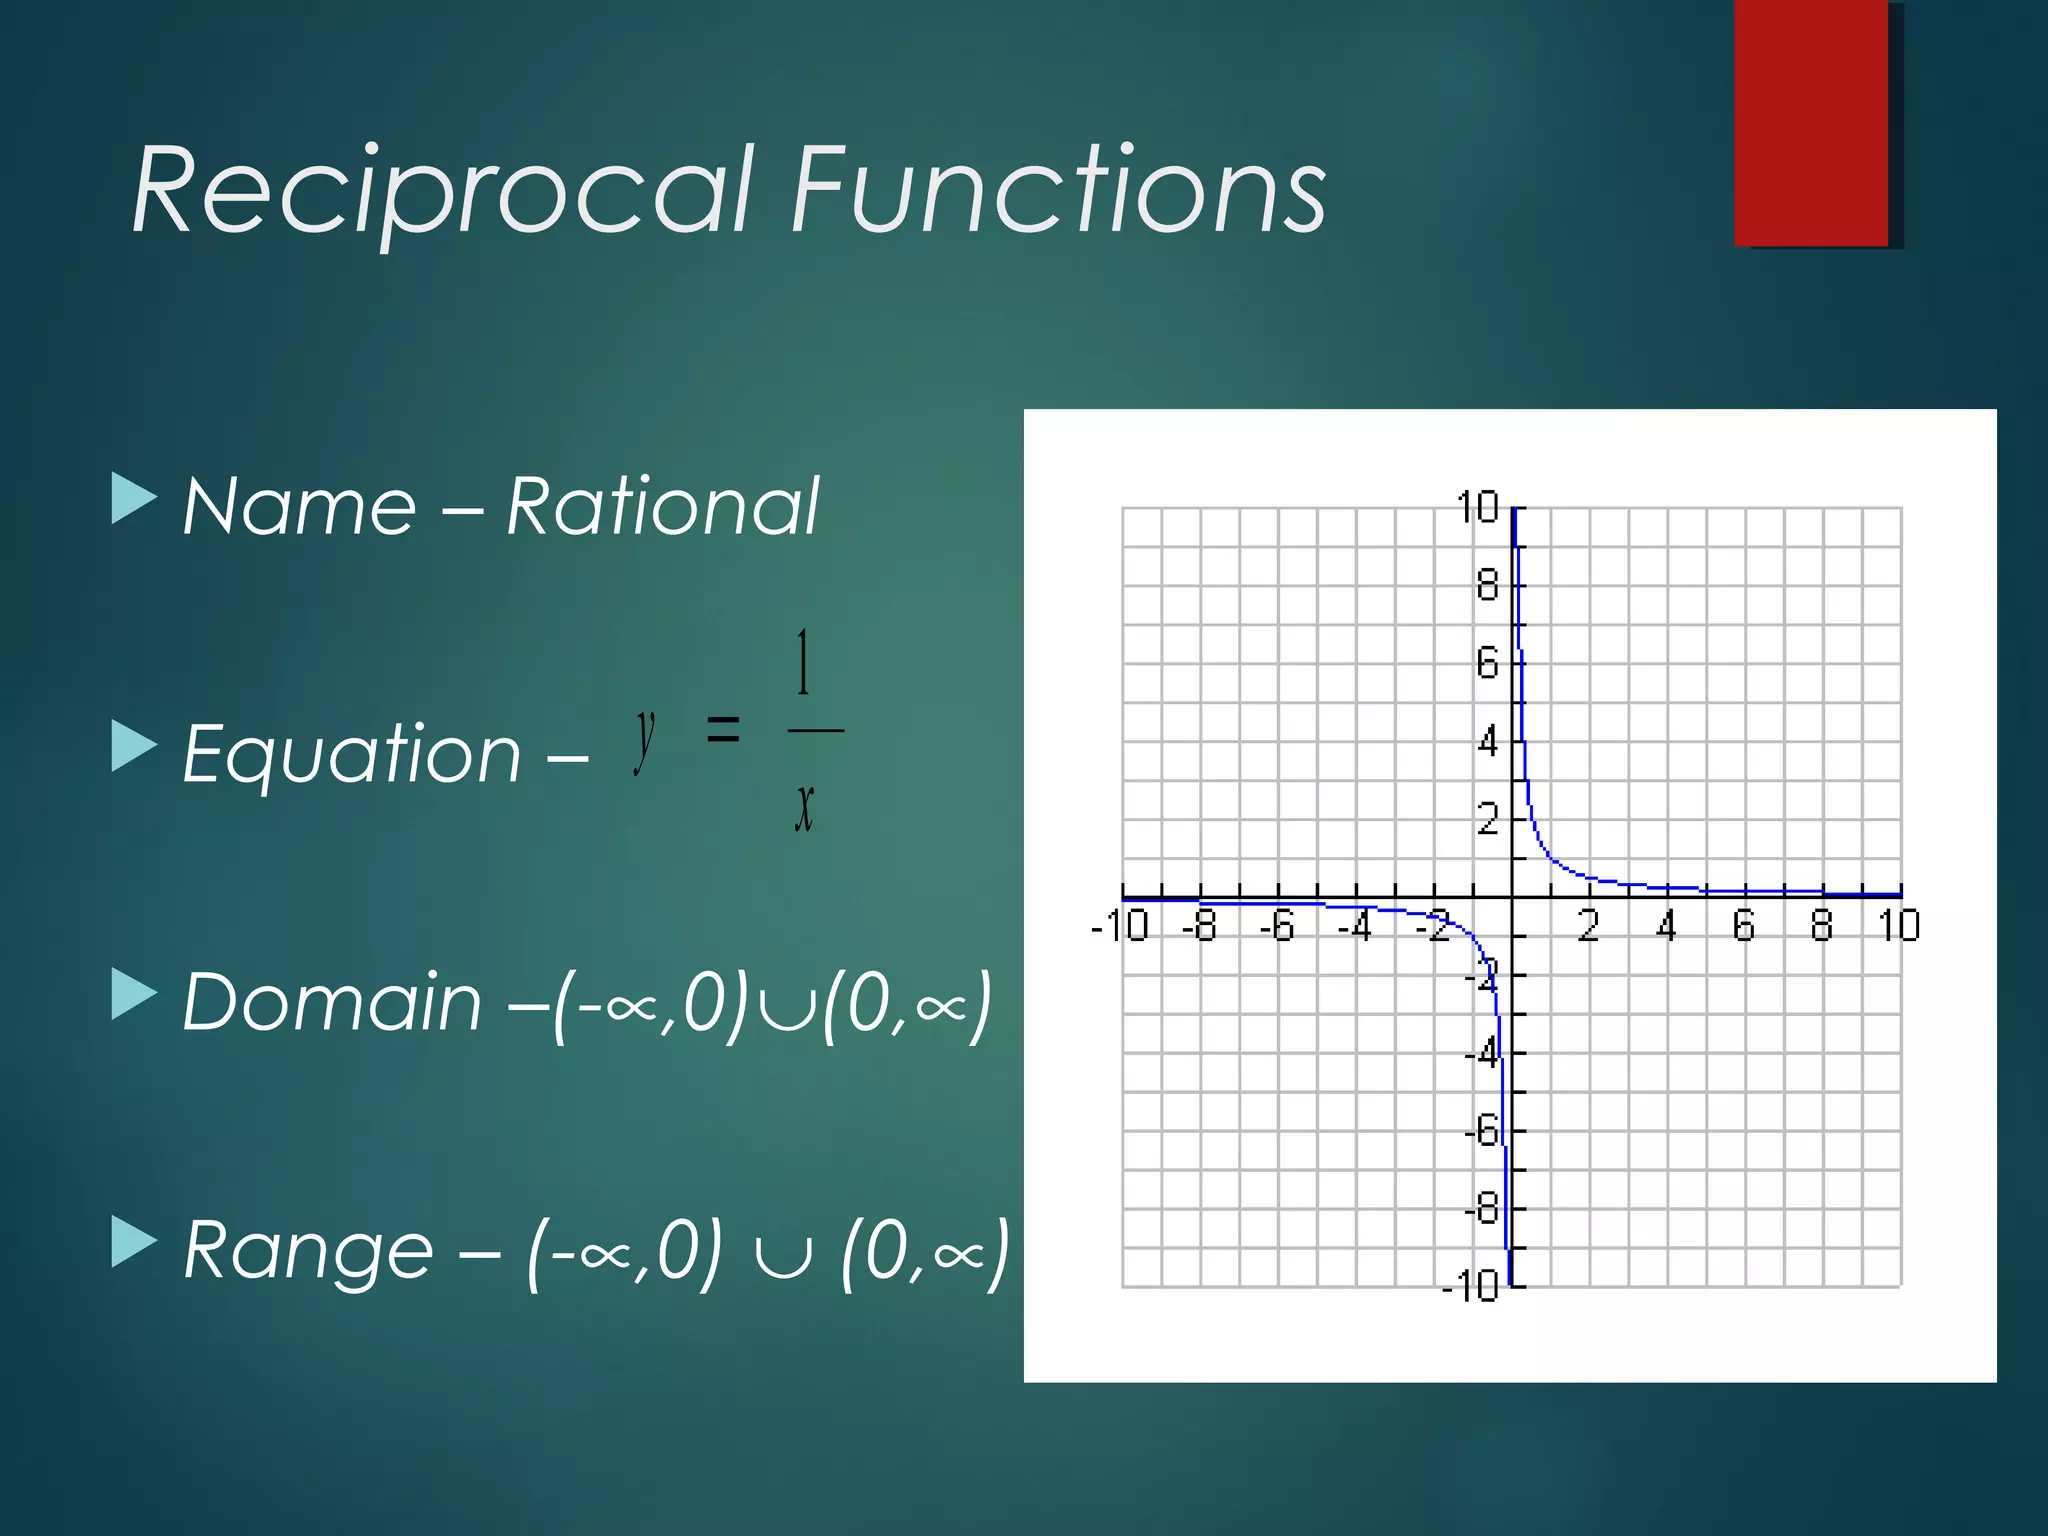
Information on quadratic (power) and rational (reciprocal) functions with respective equations, domains, and ranges.
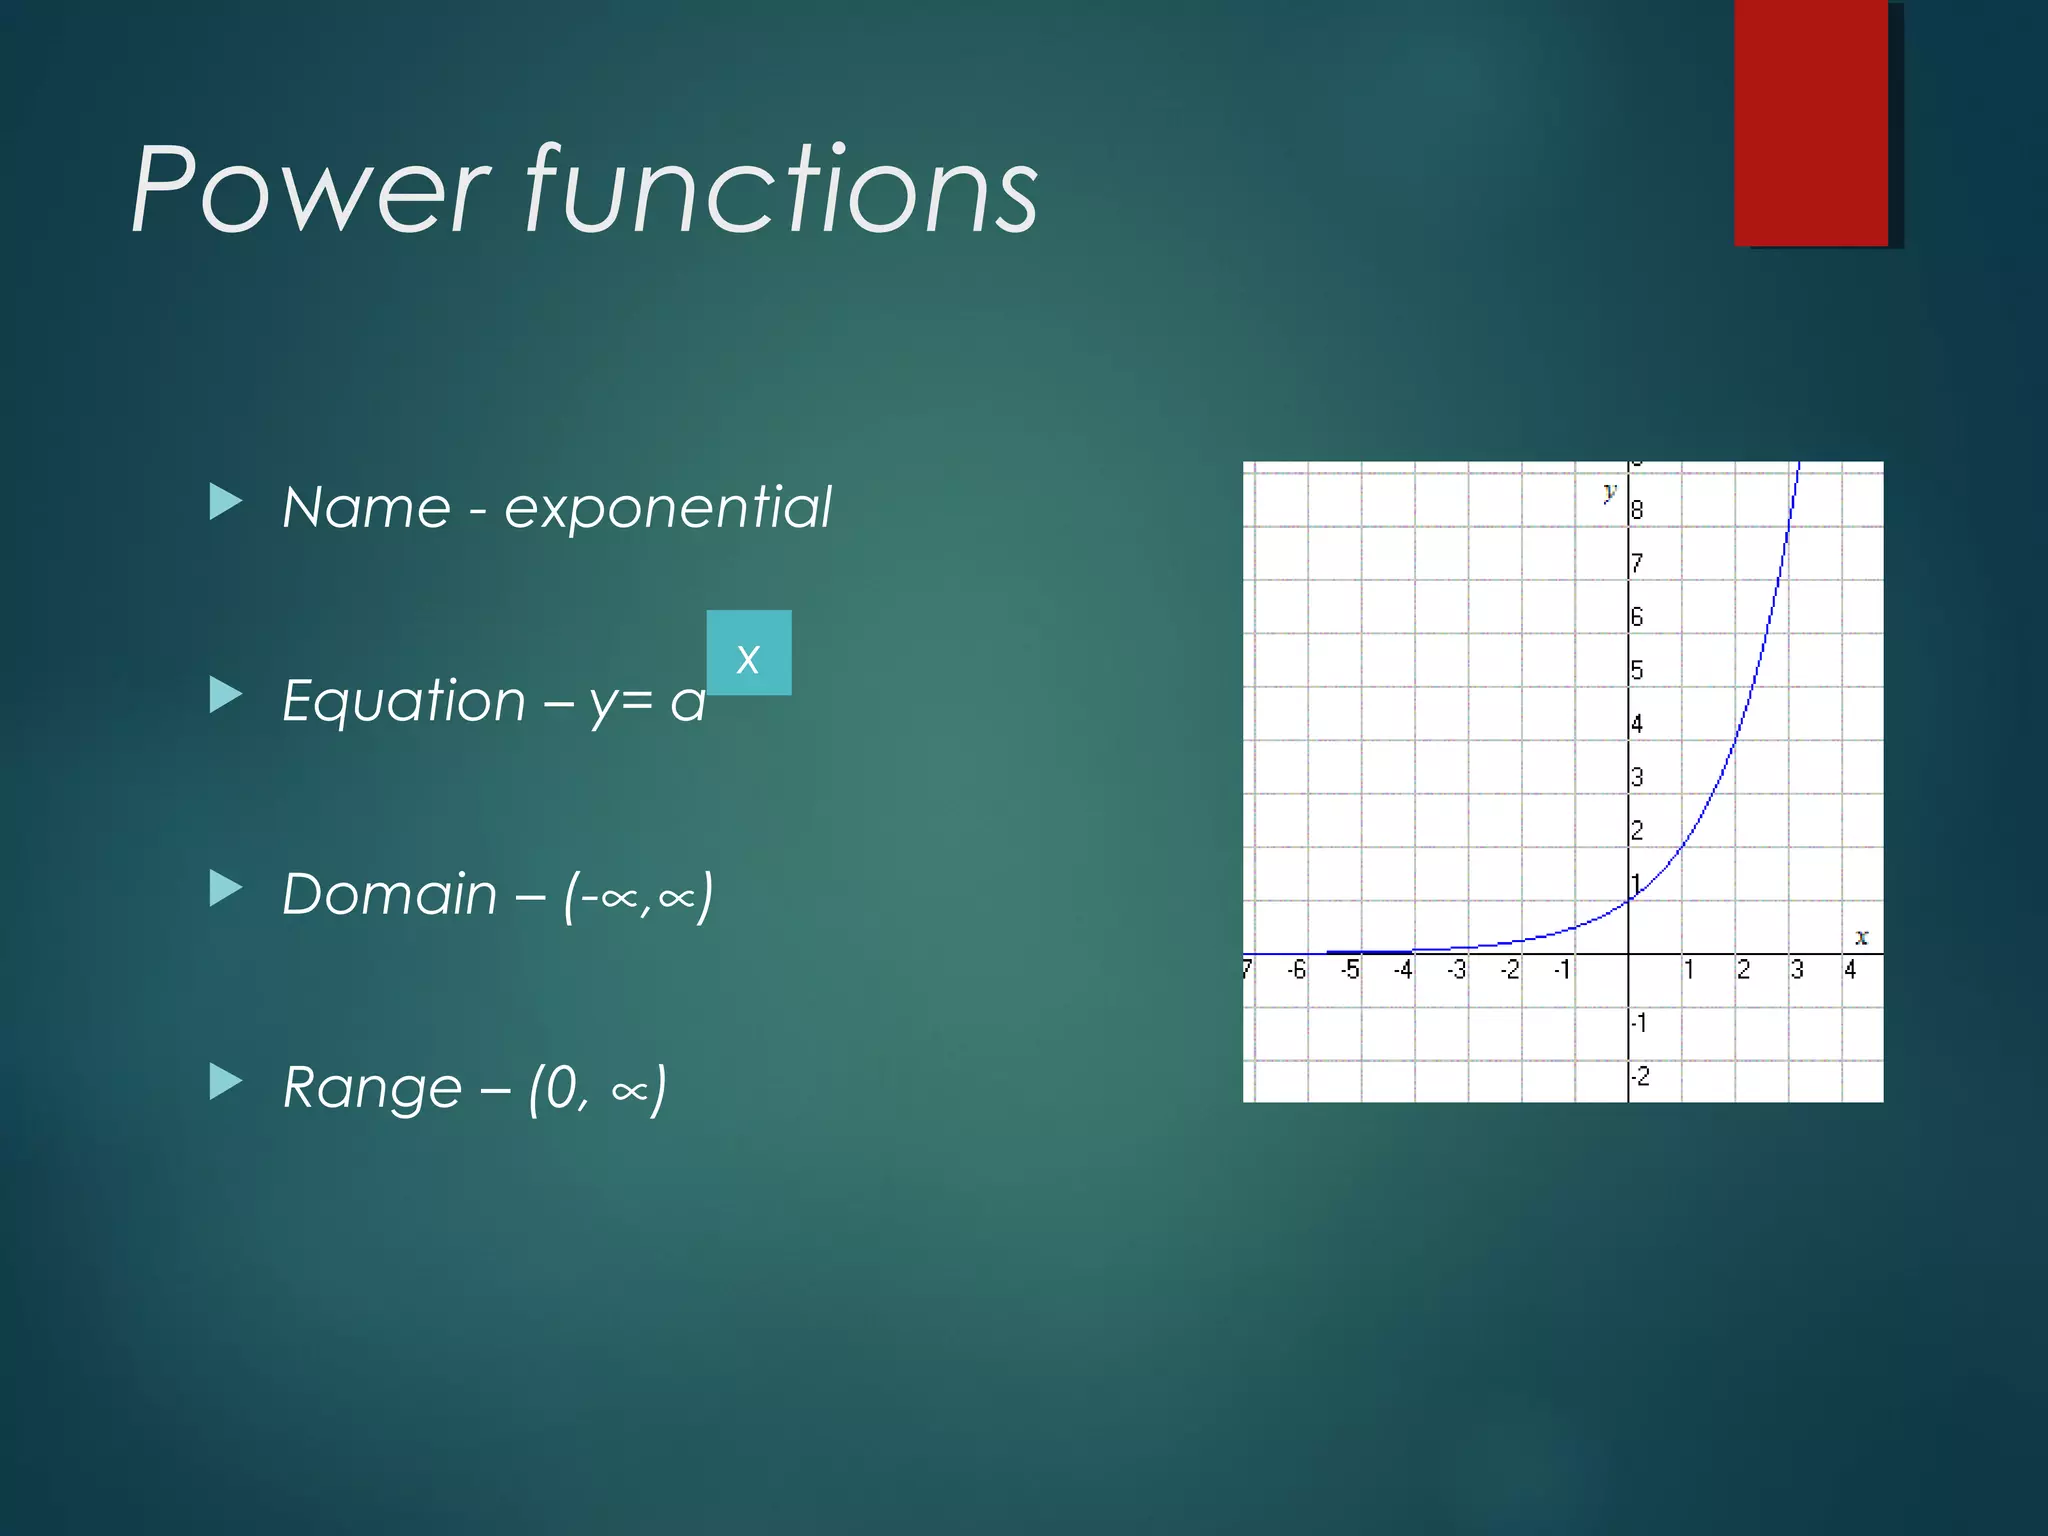
Exponential functions characterized by y = a^x, covering their domains and ranges.
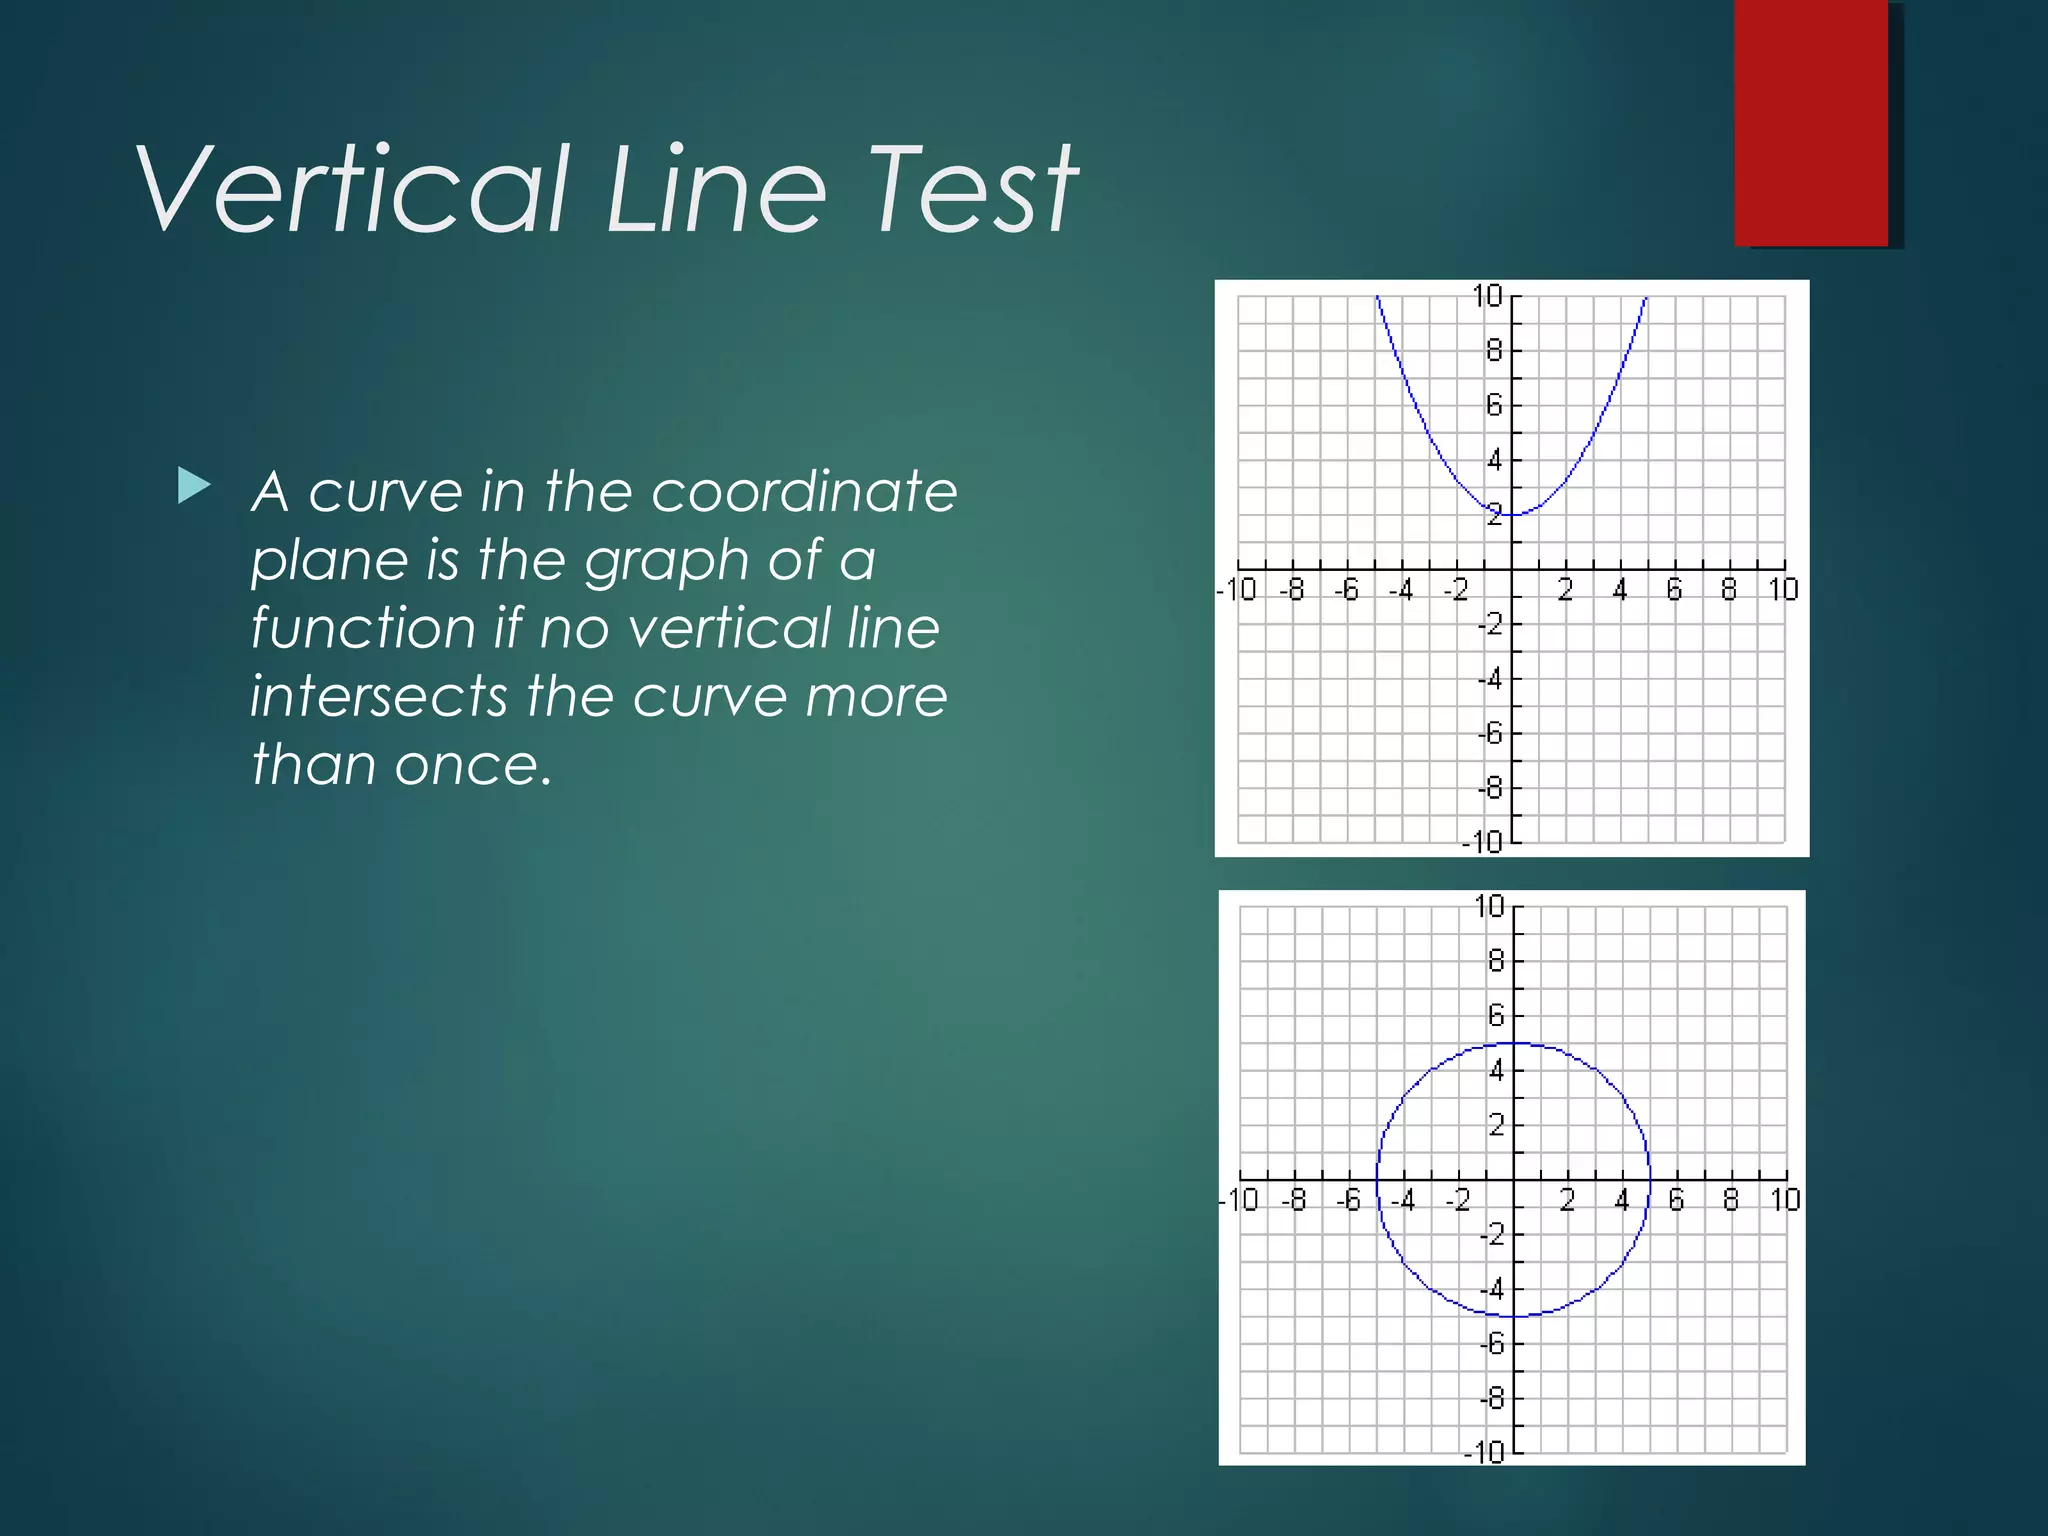
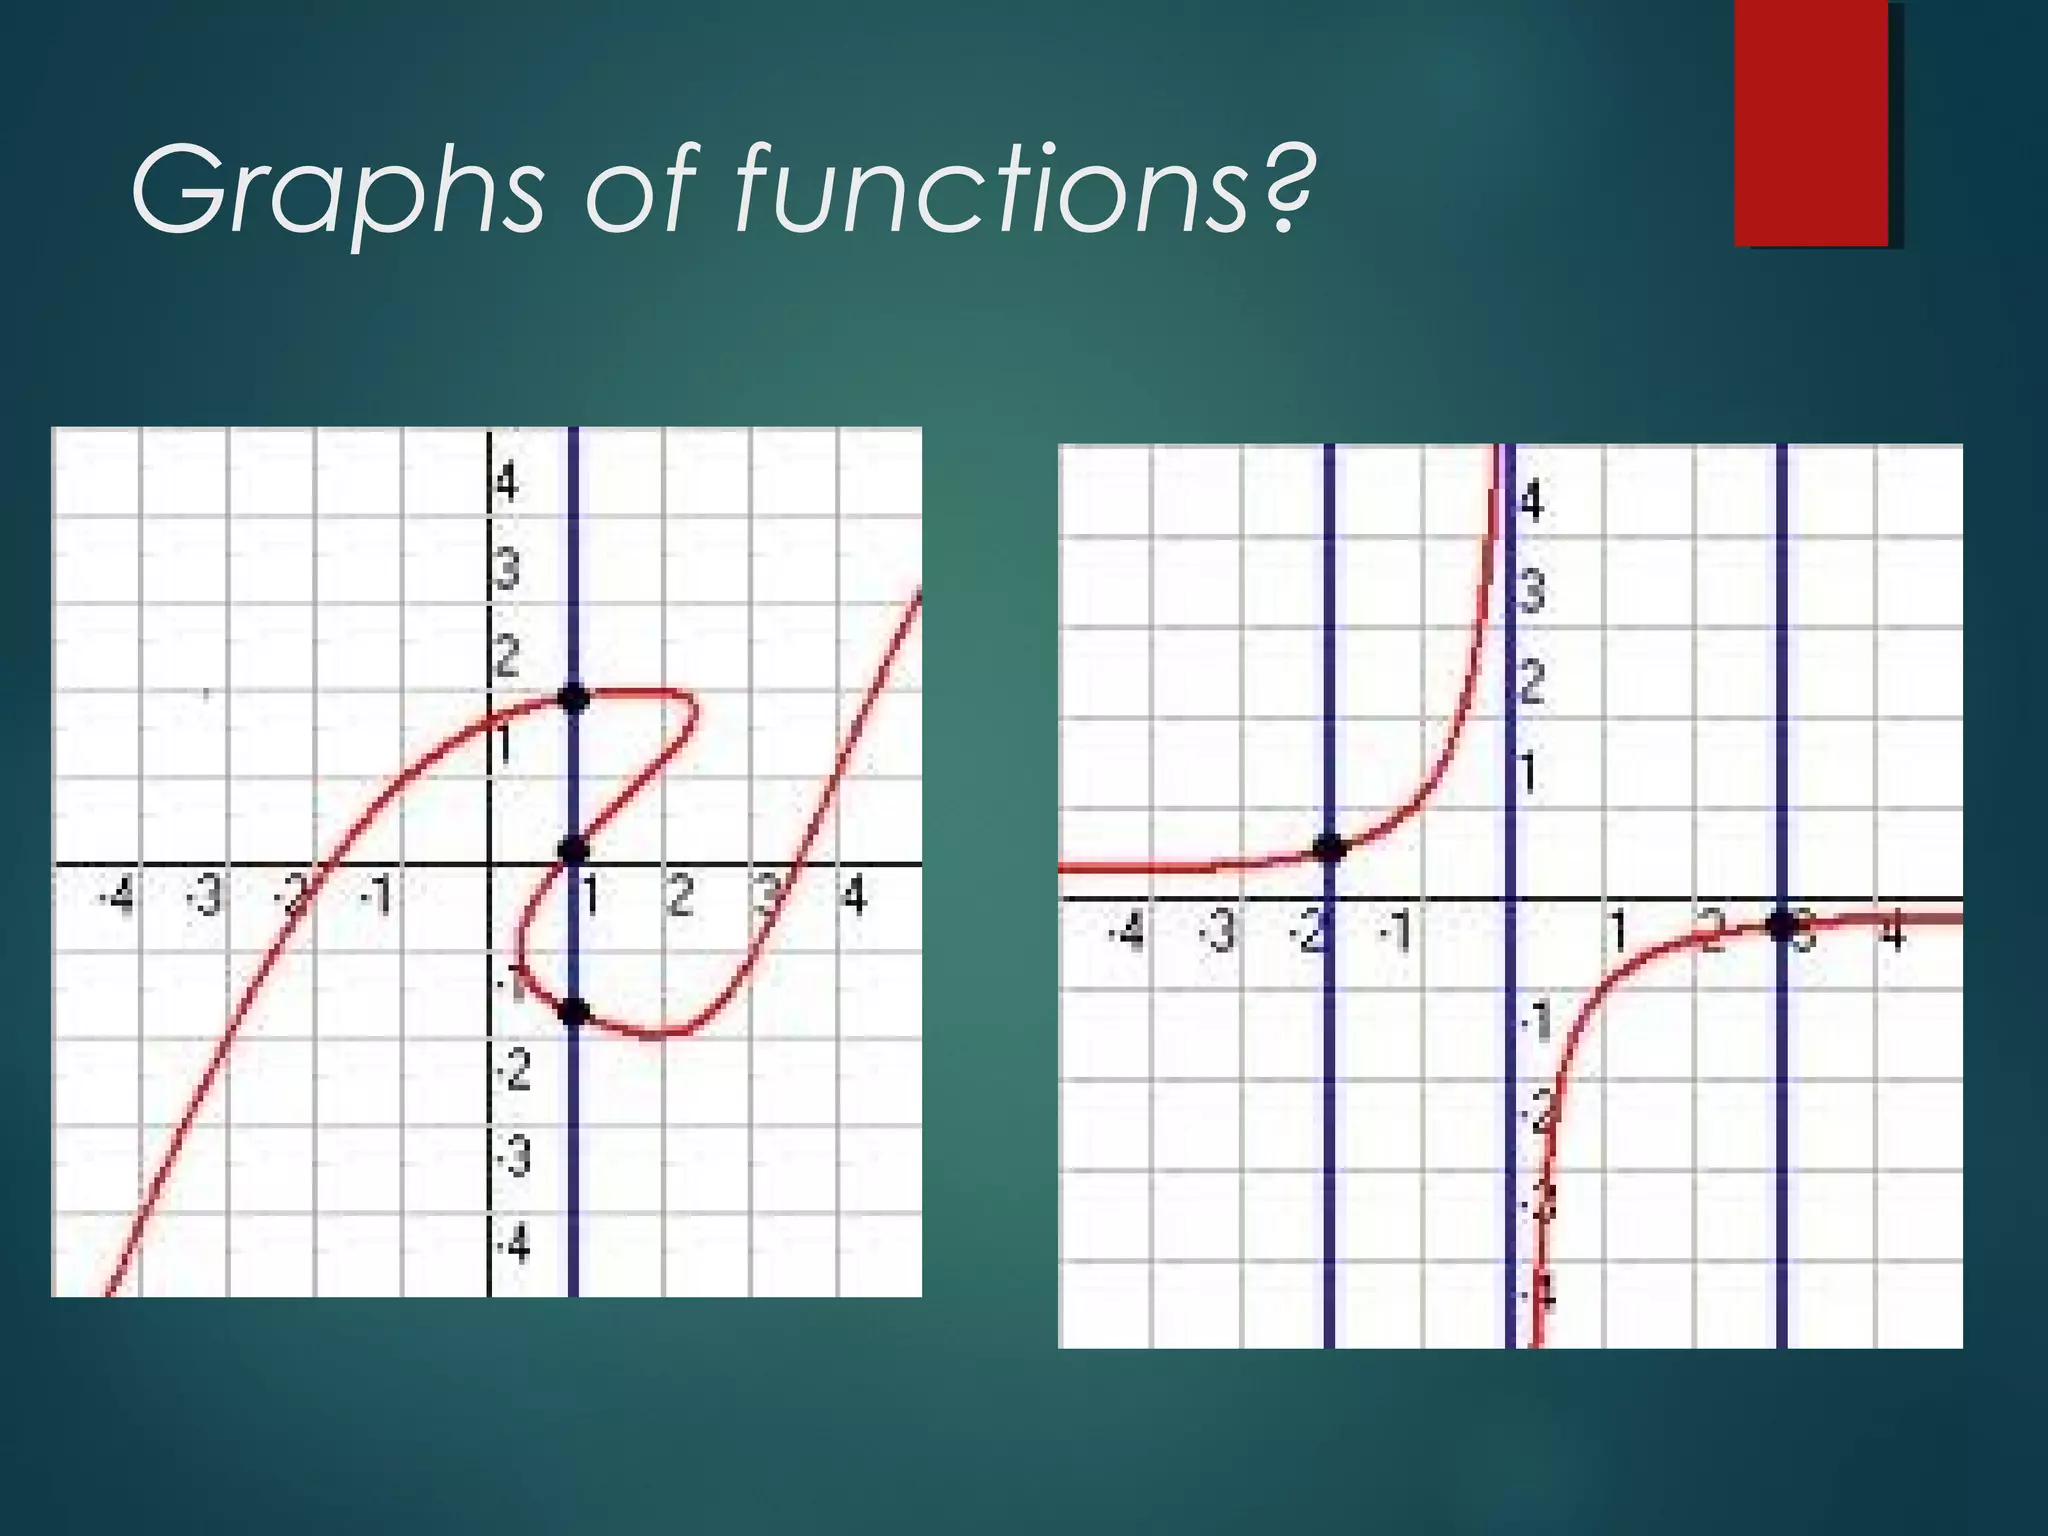
Criteria for determining if a curve is a function through the vertical line test.
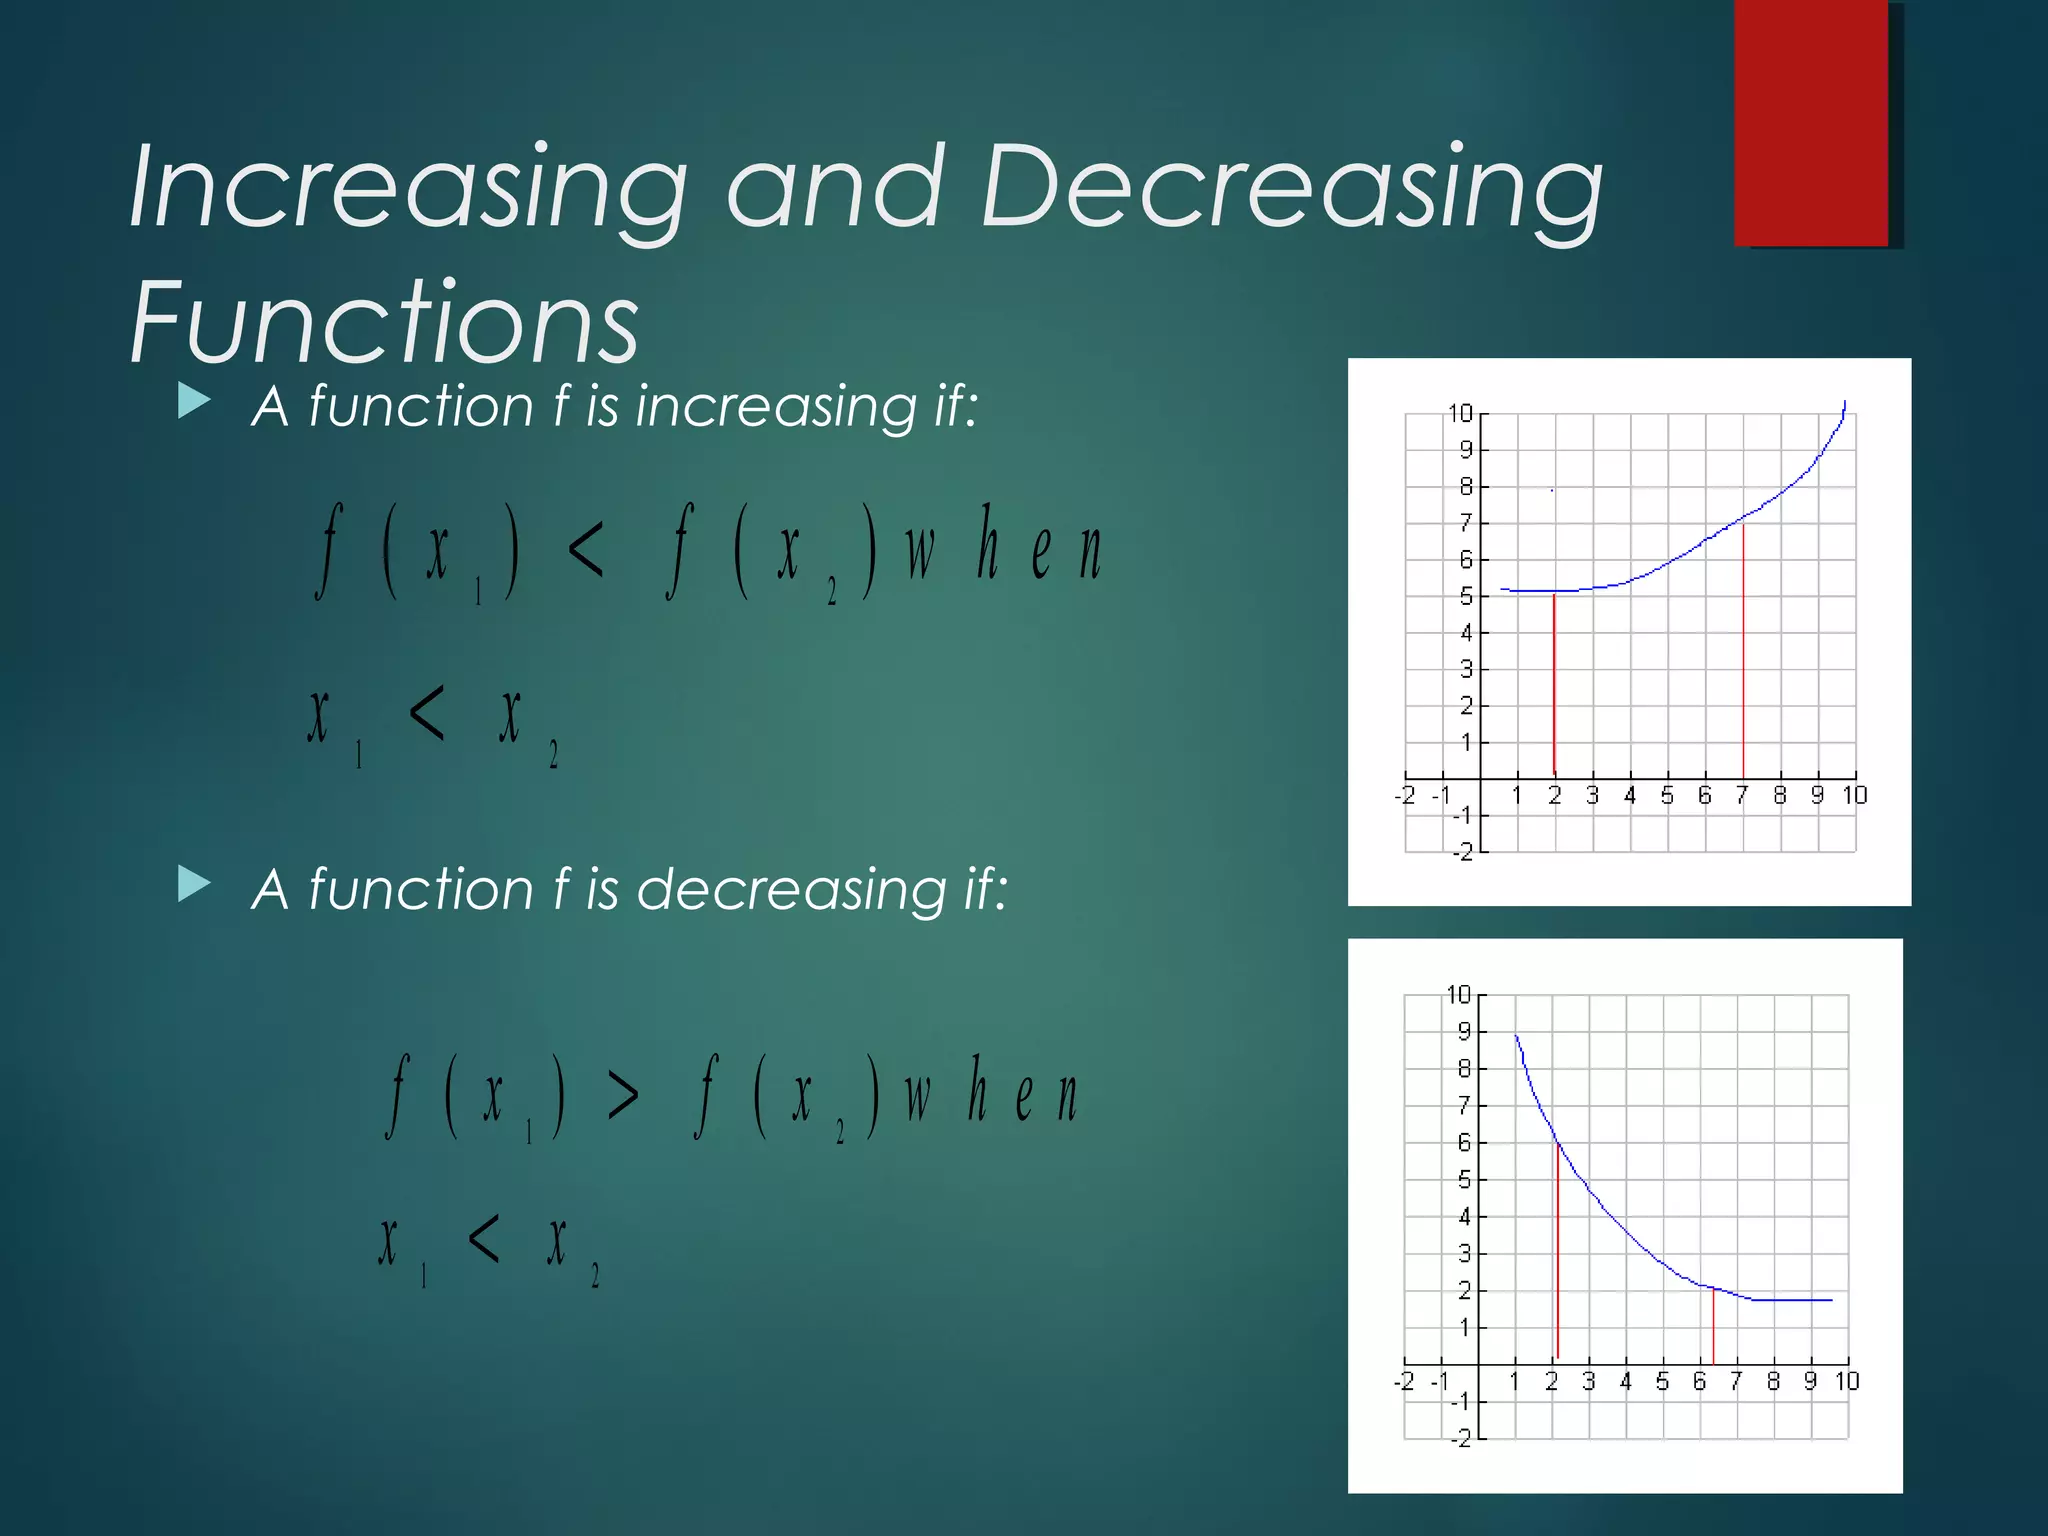
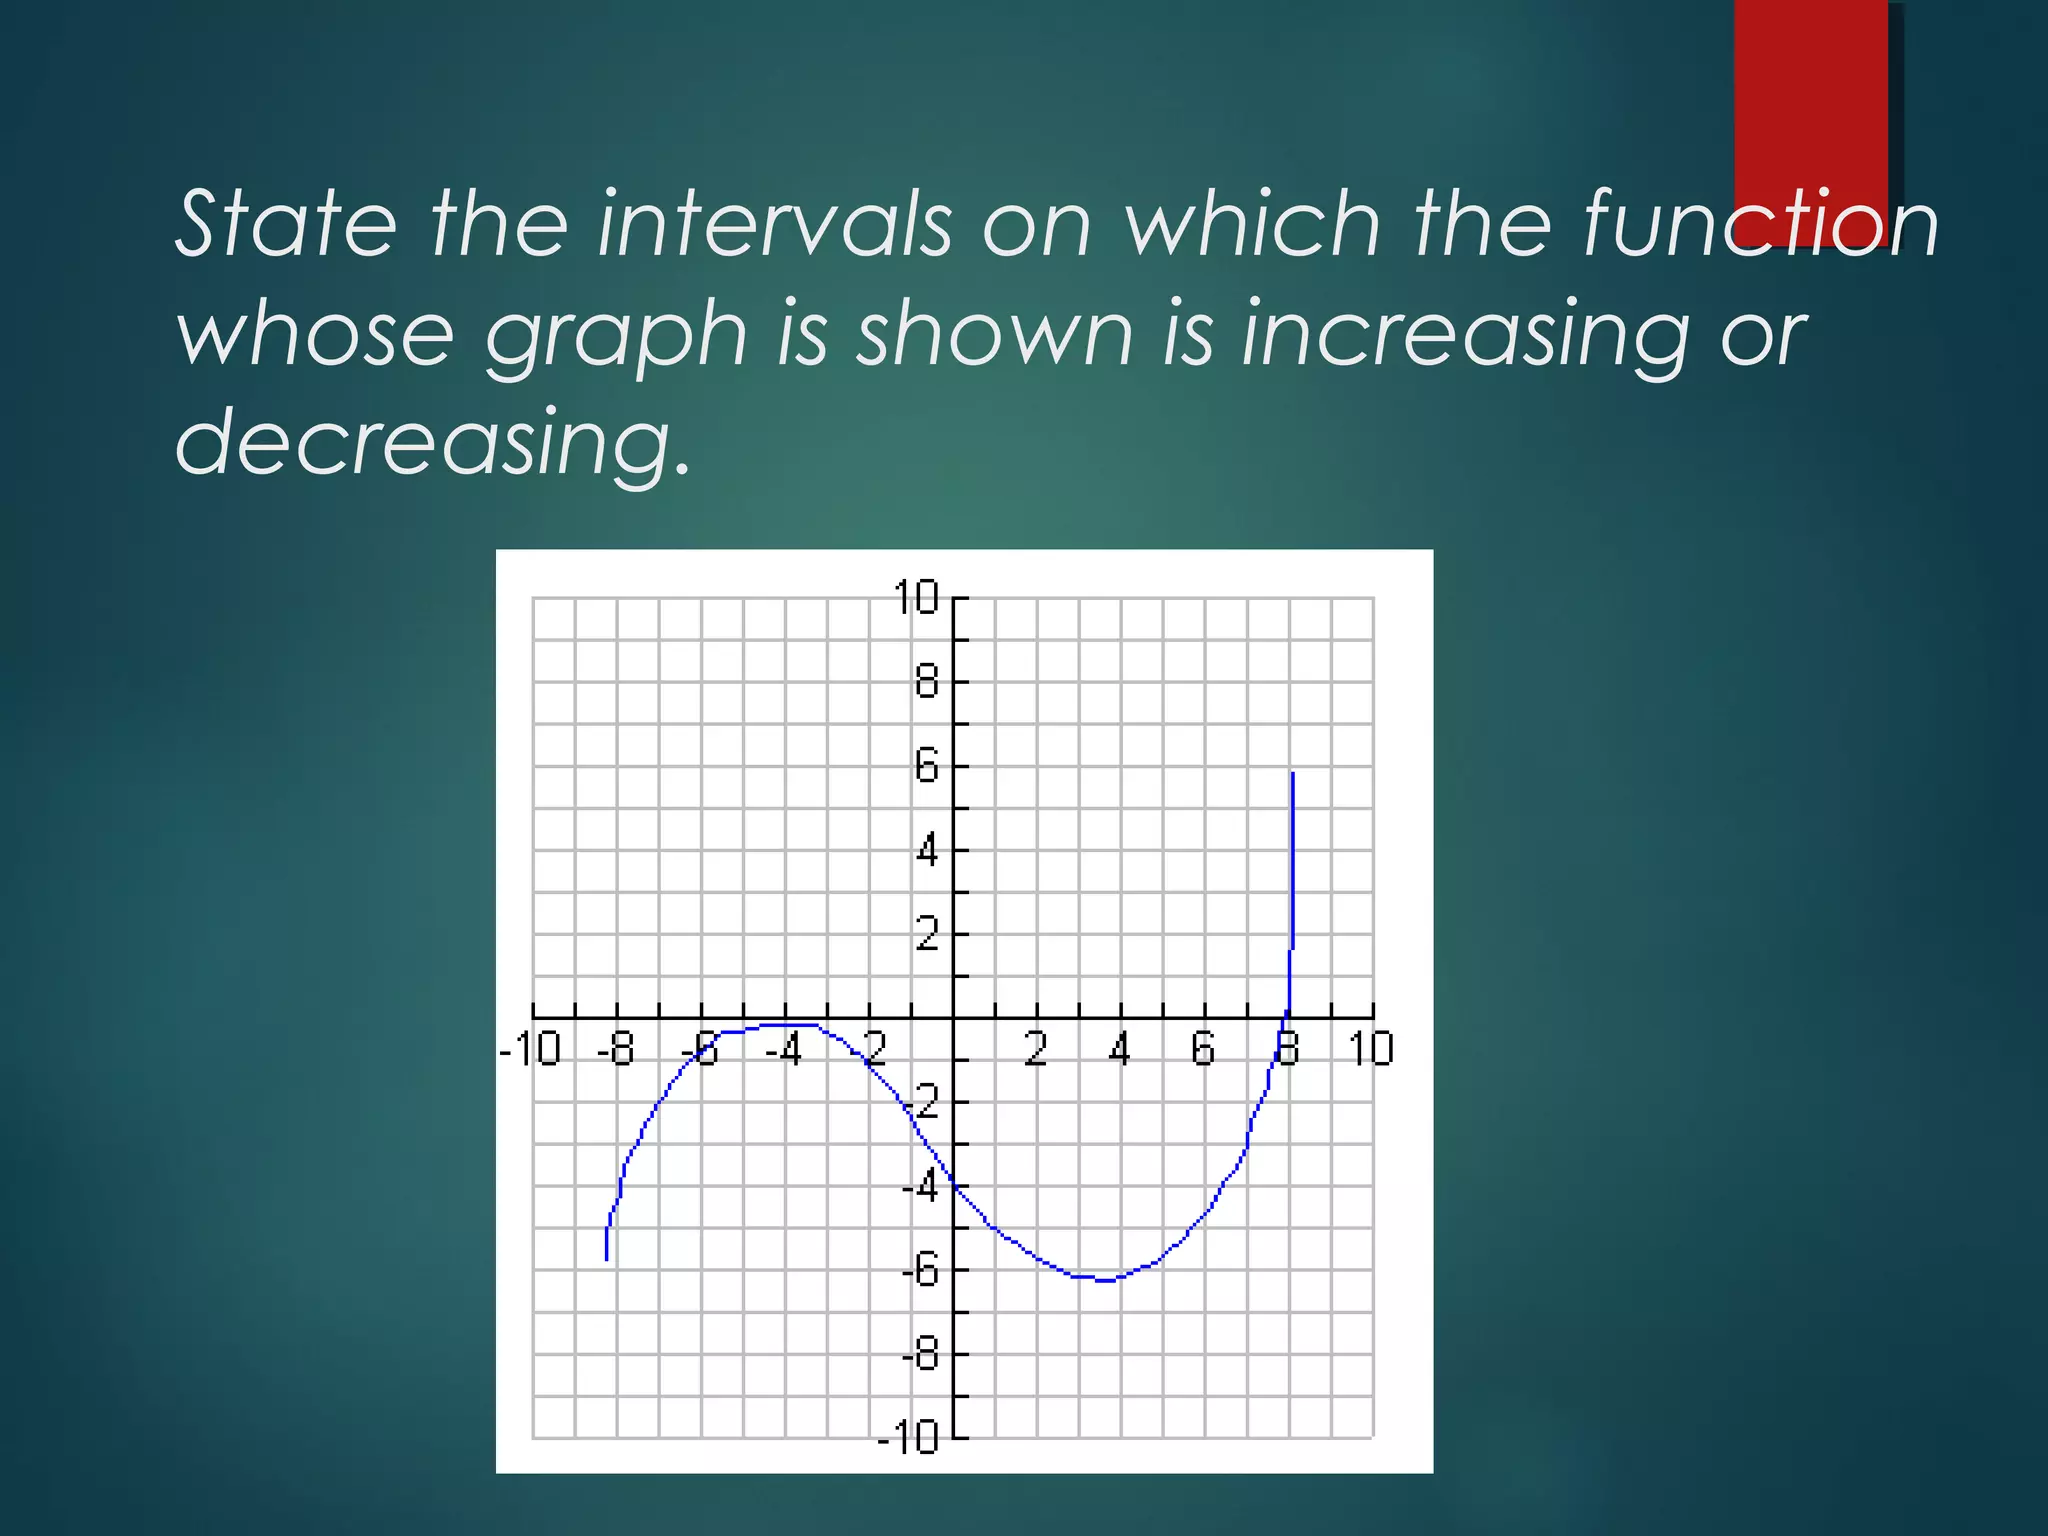
Explanation of increasing and decreasing functions with conditions for each type and an applied question.
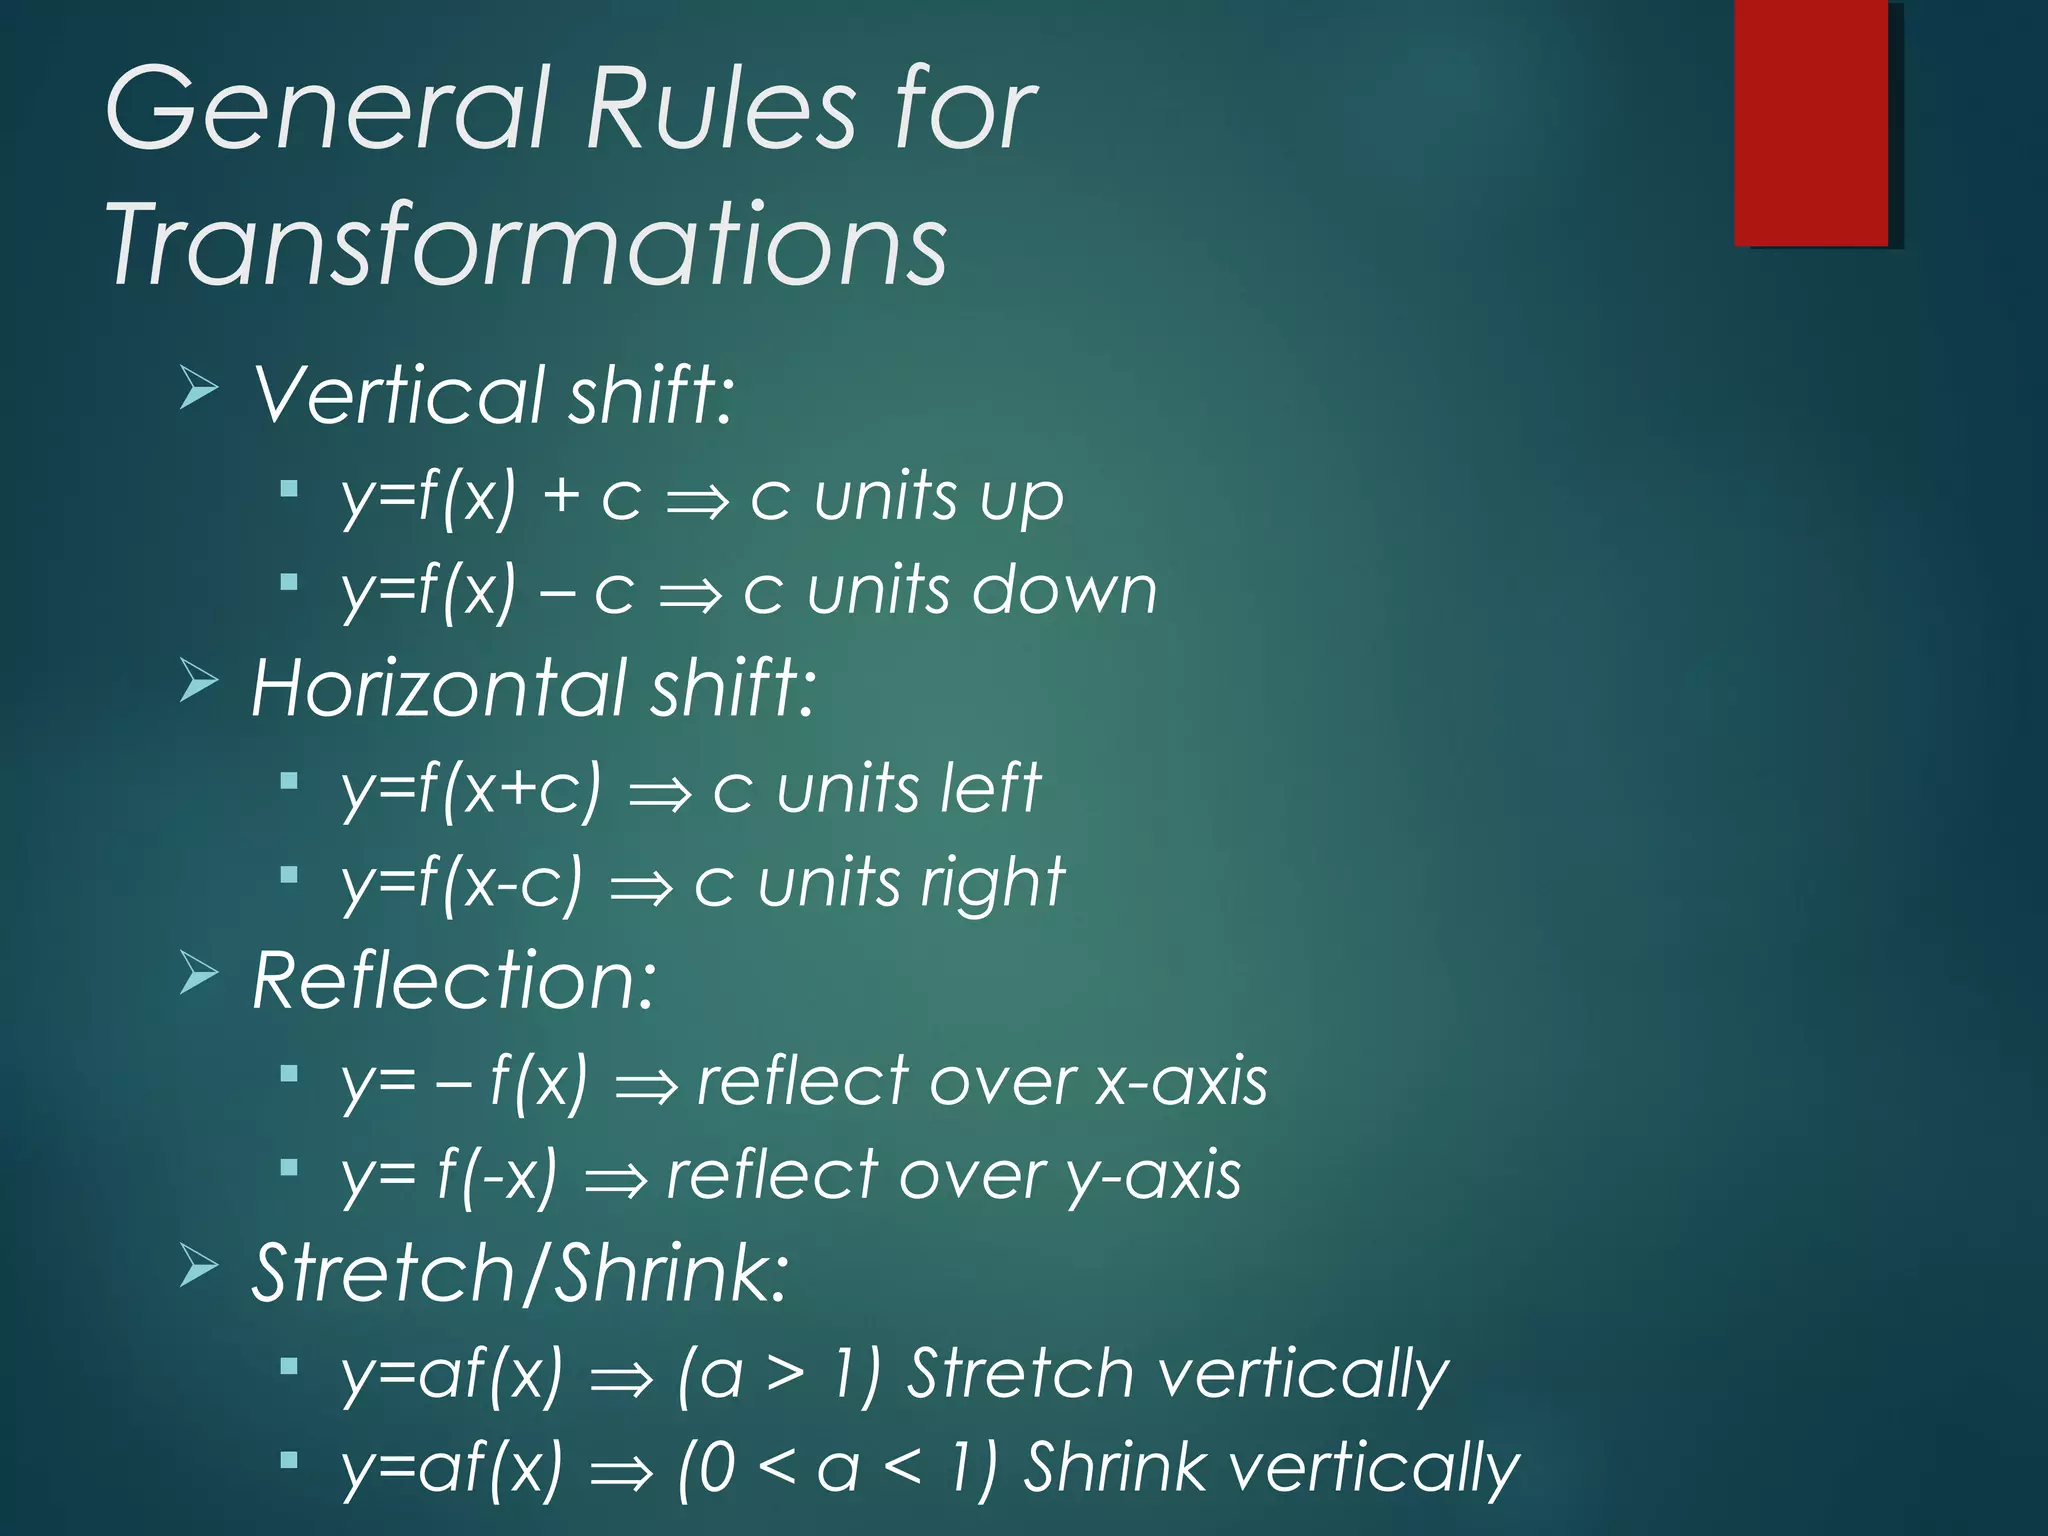
Various transformations of functions, including vertical/horizontal shifts, reflections, and stretches/shrinks.
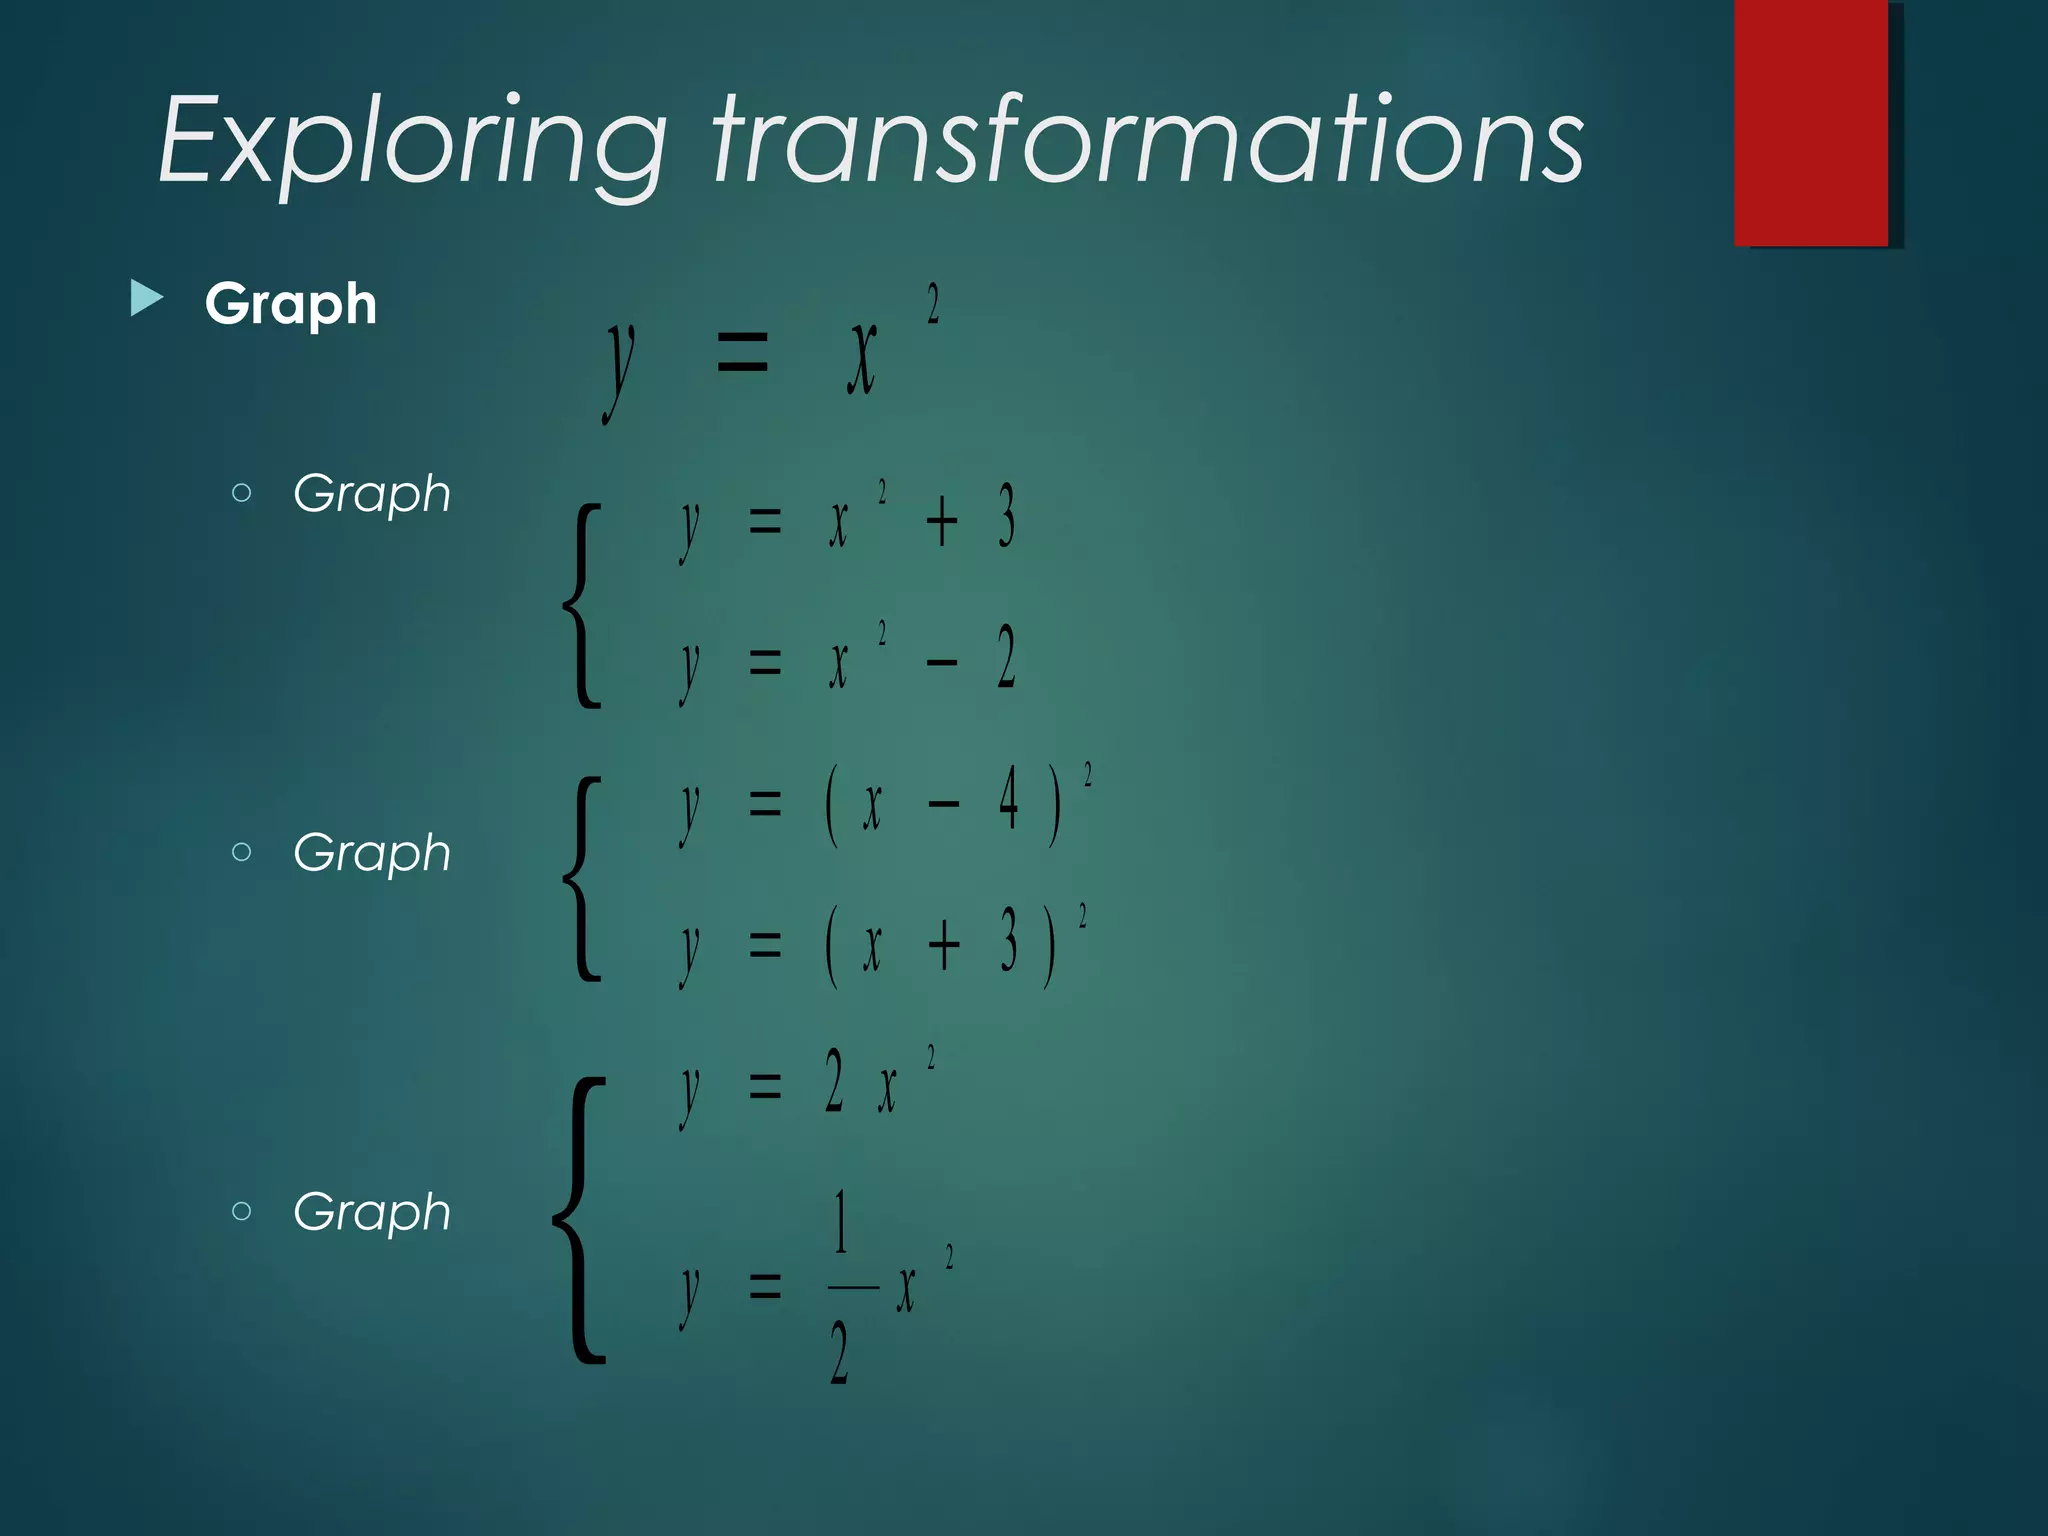
Graphical exploration of transformations using specific functions.
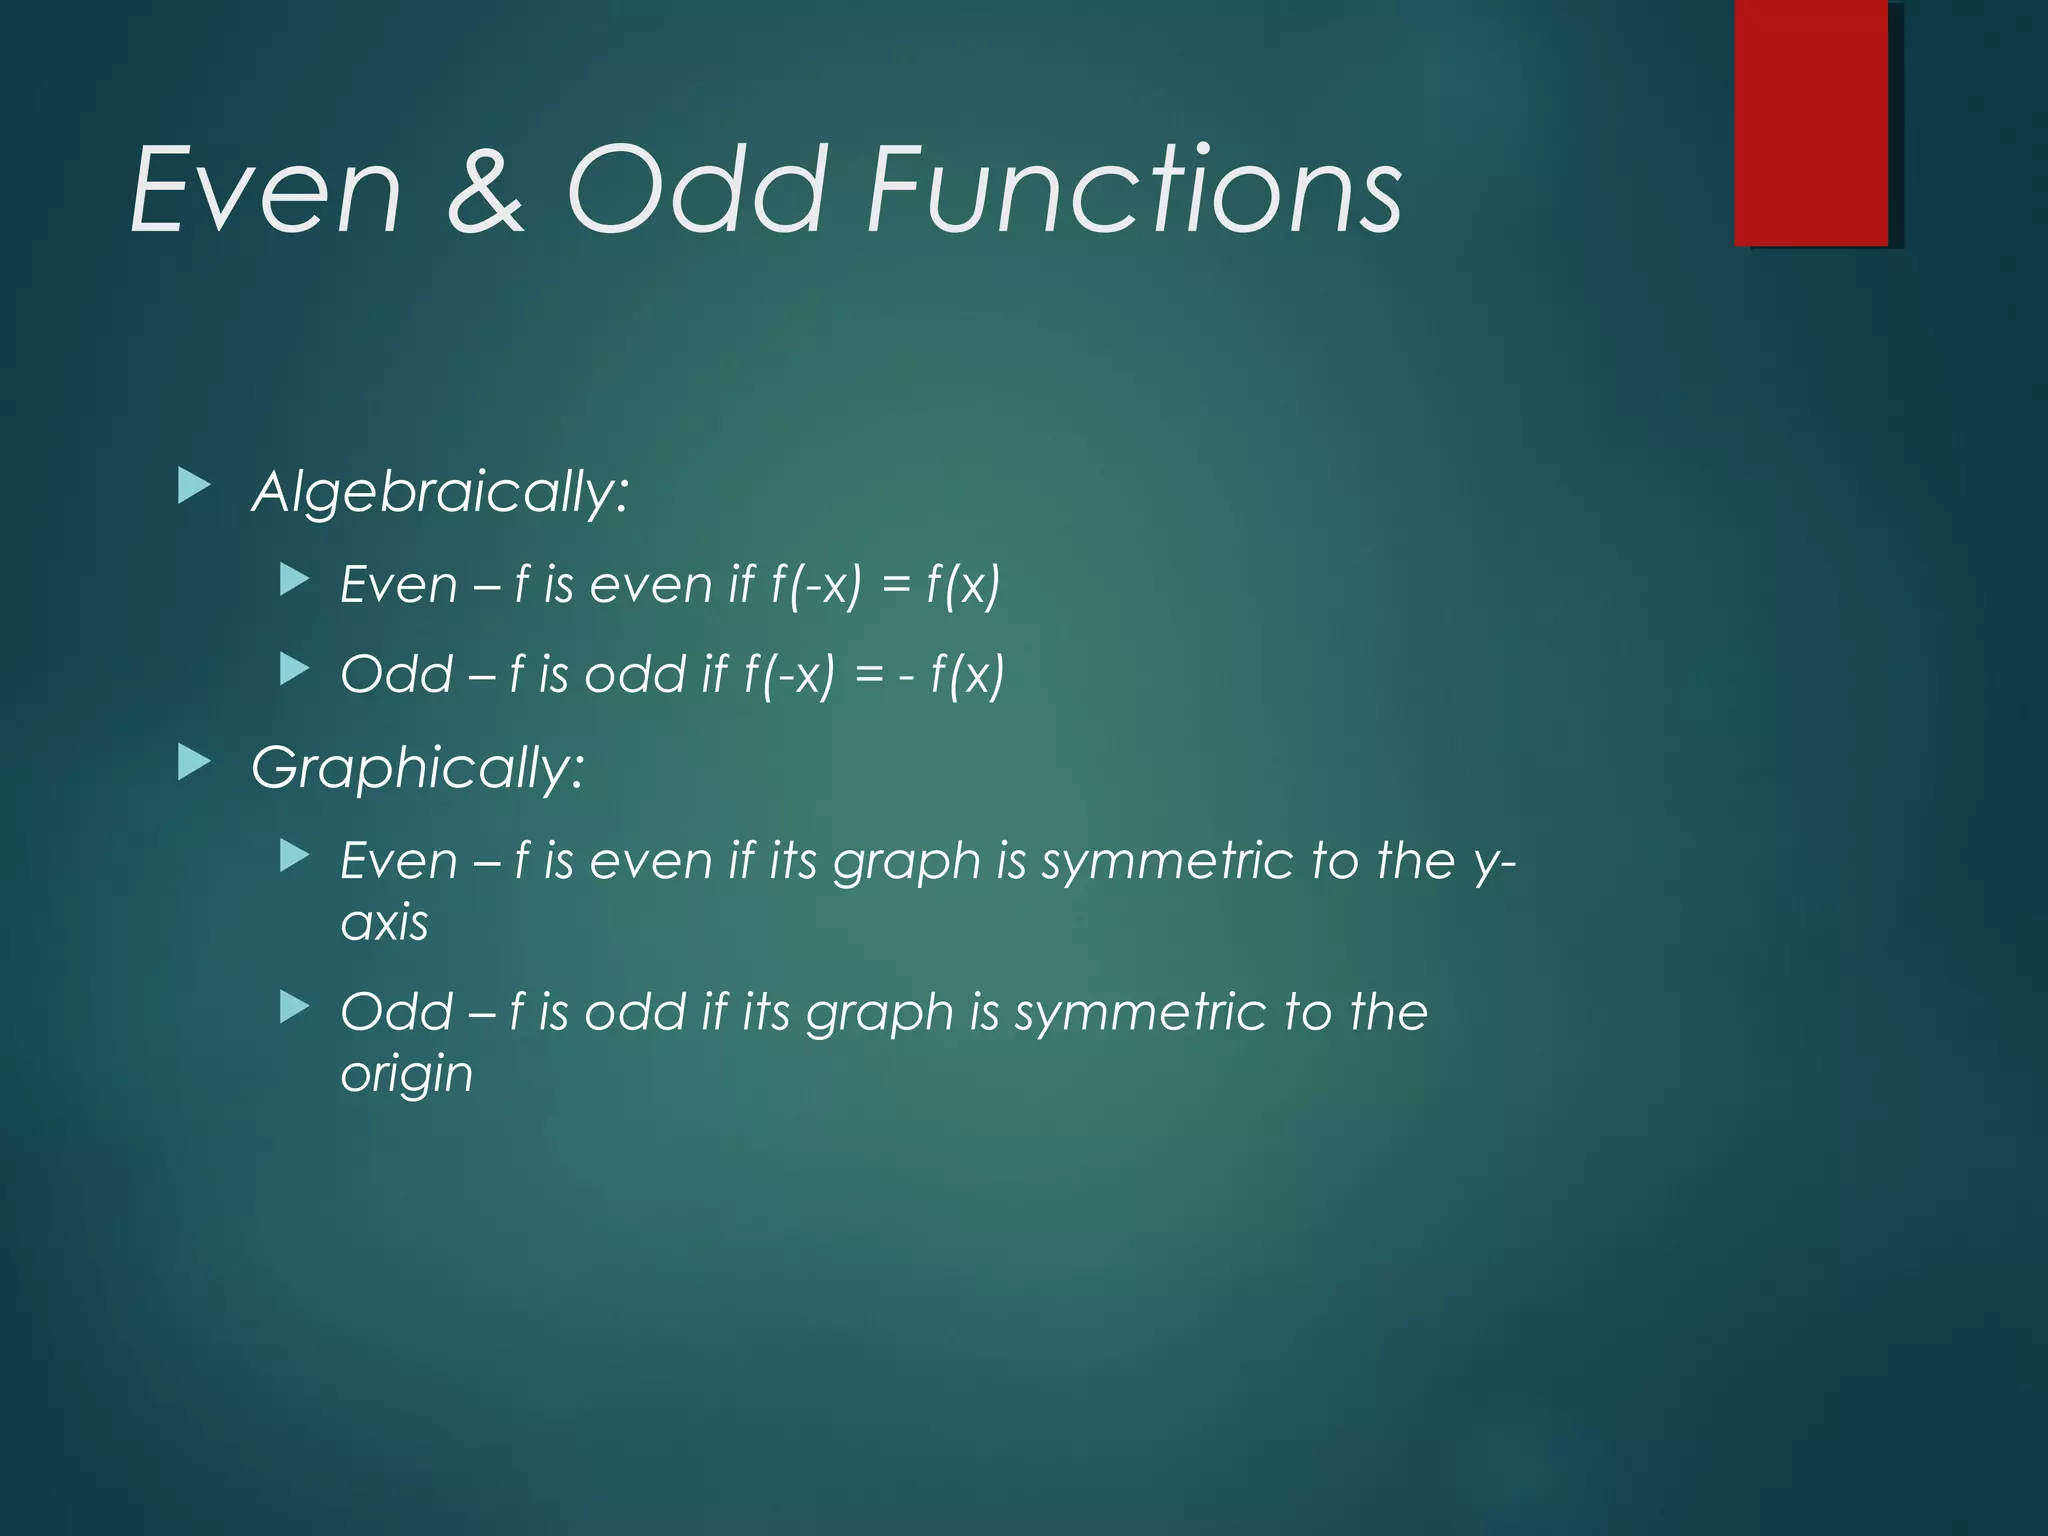
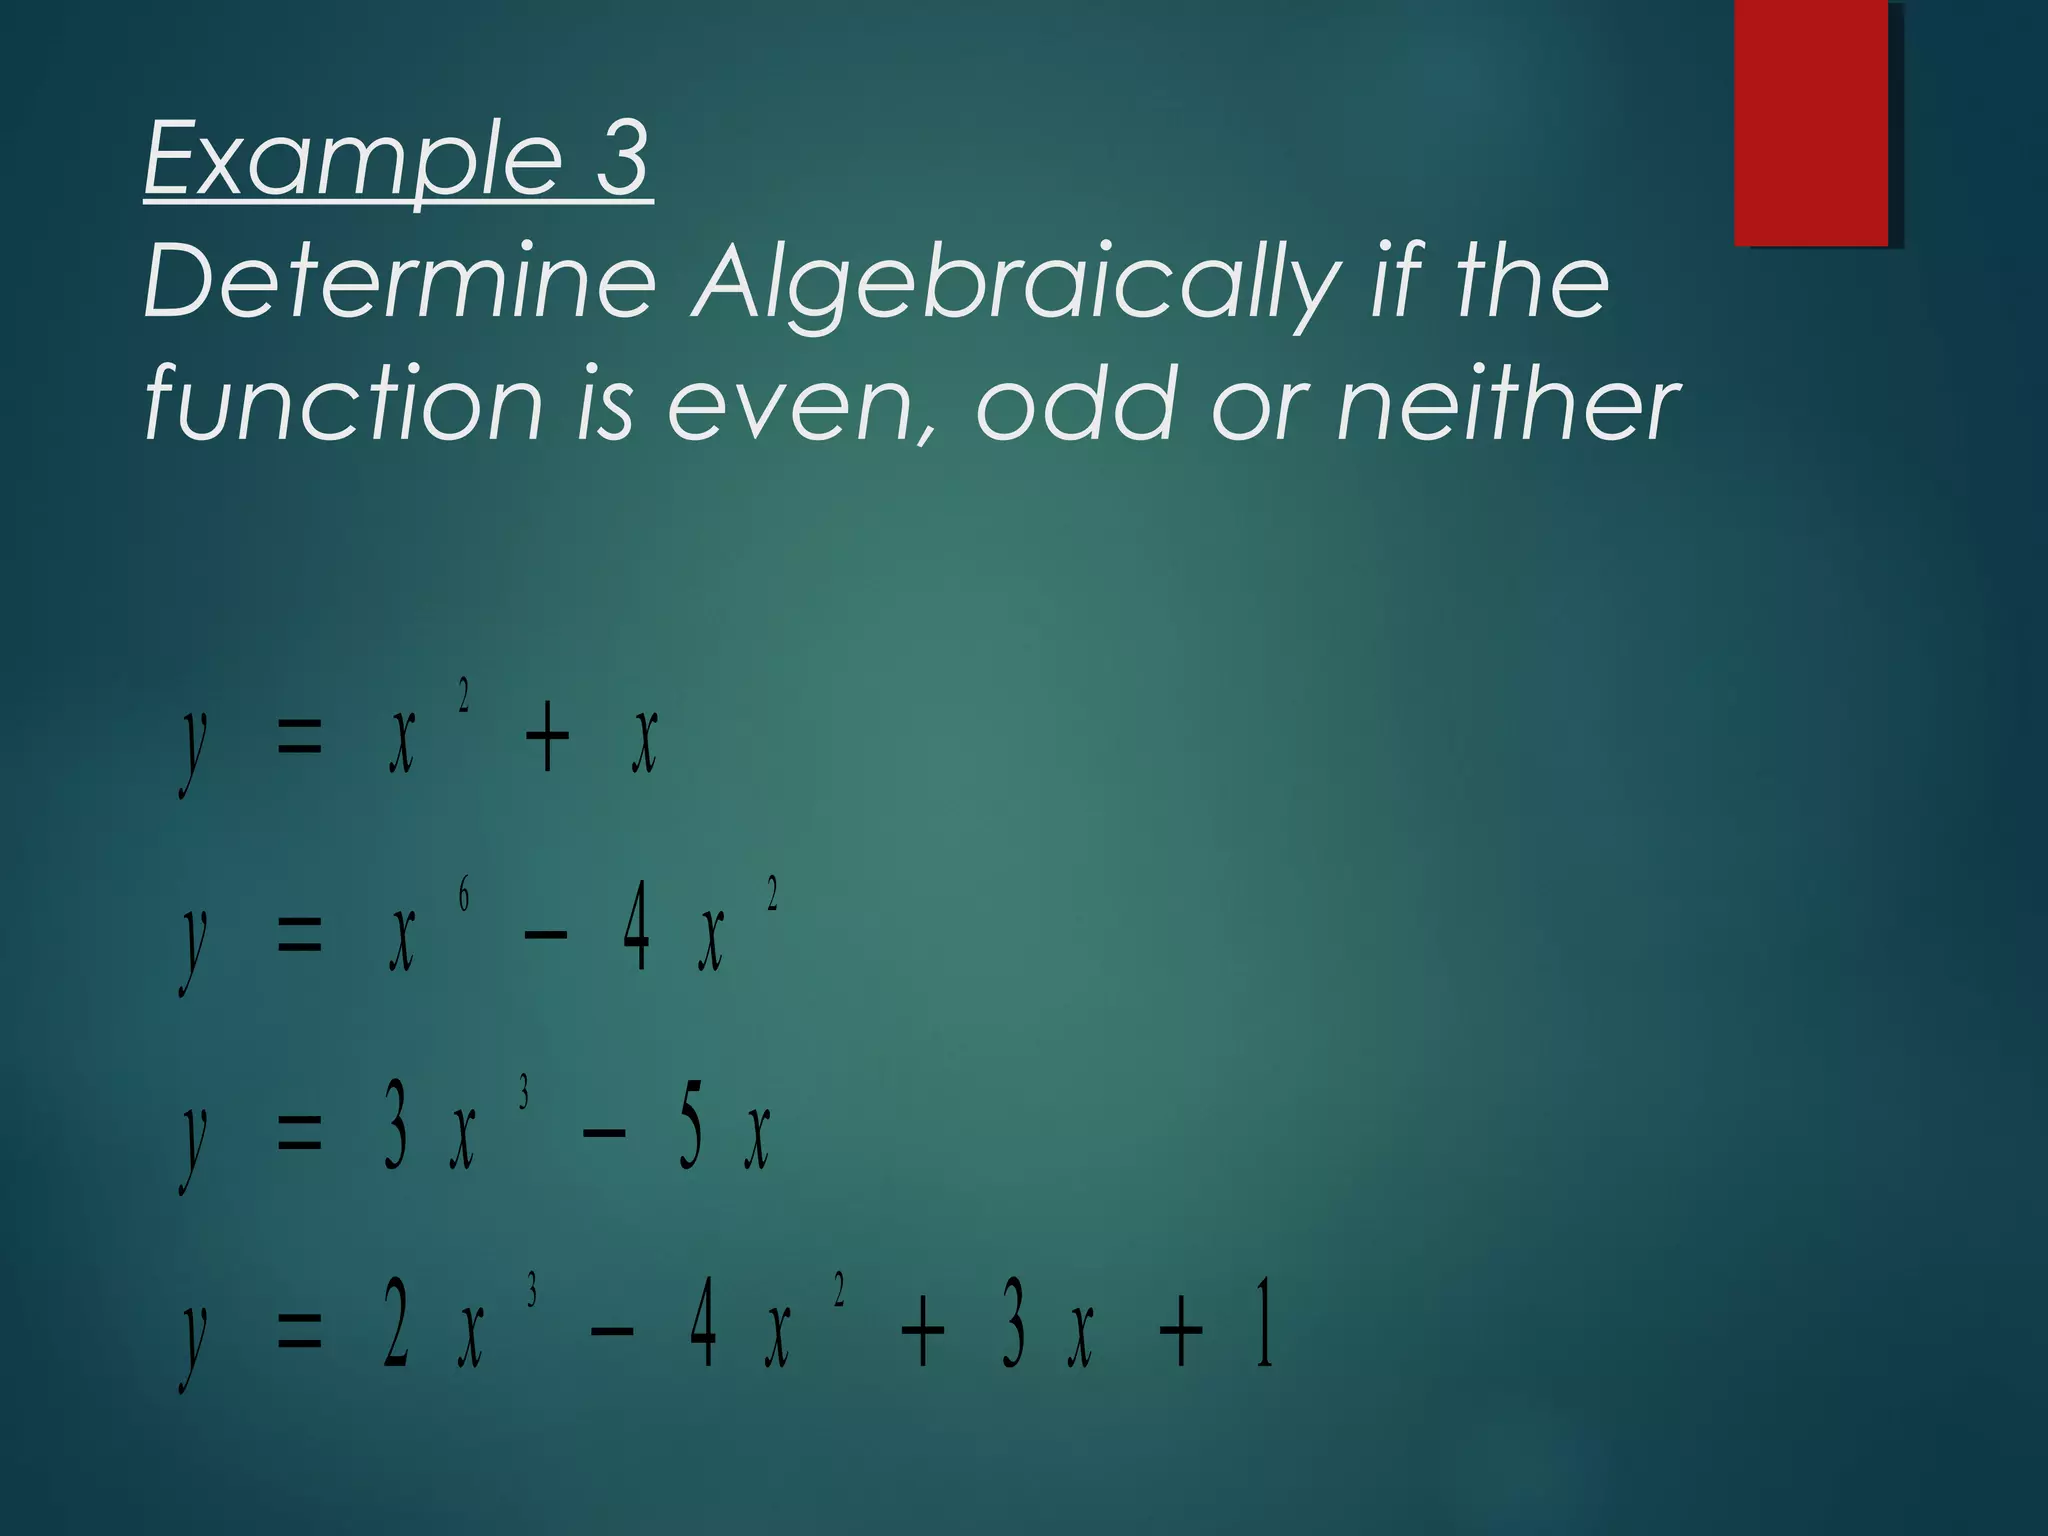
Definitions of even and odd functions both algebraically and graphically, with symmetry considerations.
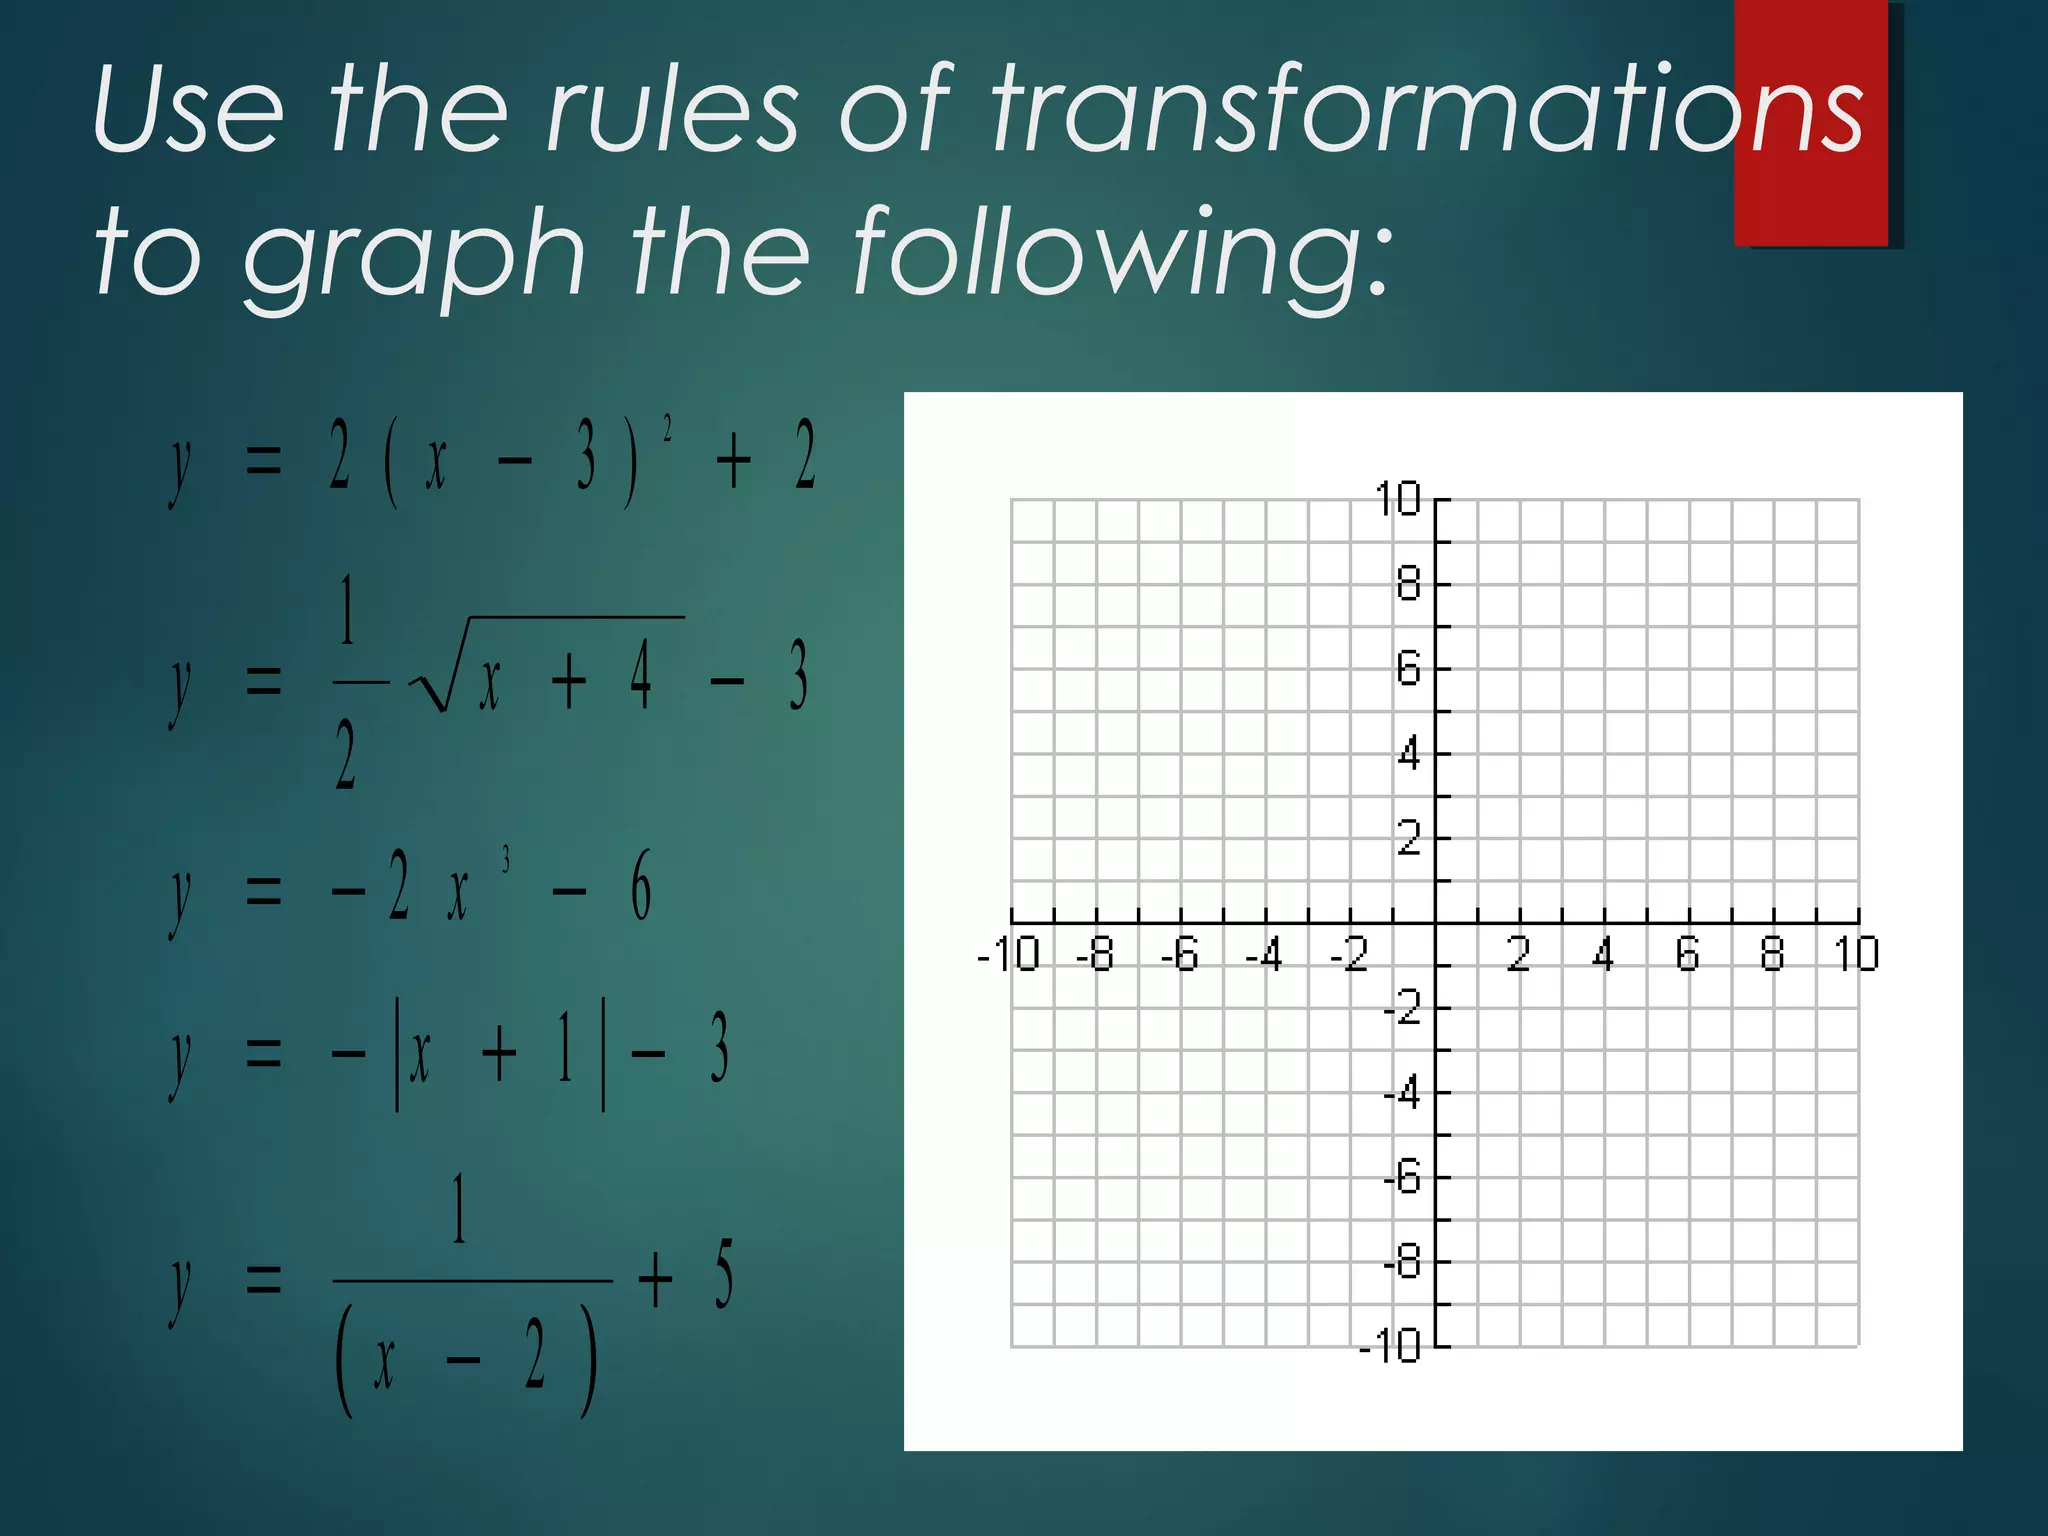
Practical examples to graph functions using transformation rules.
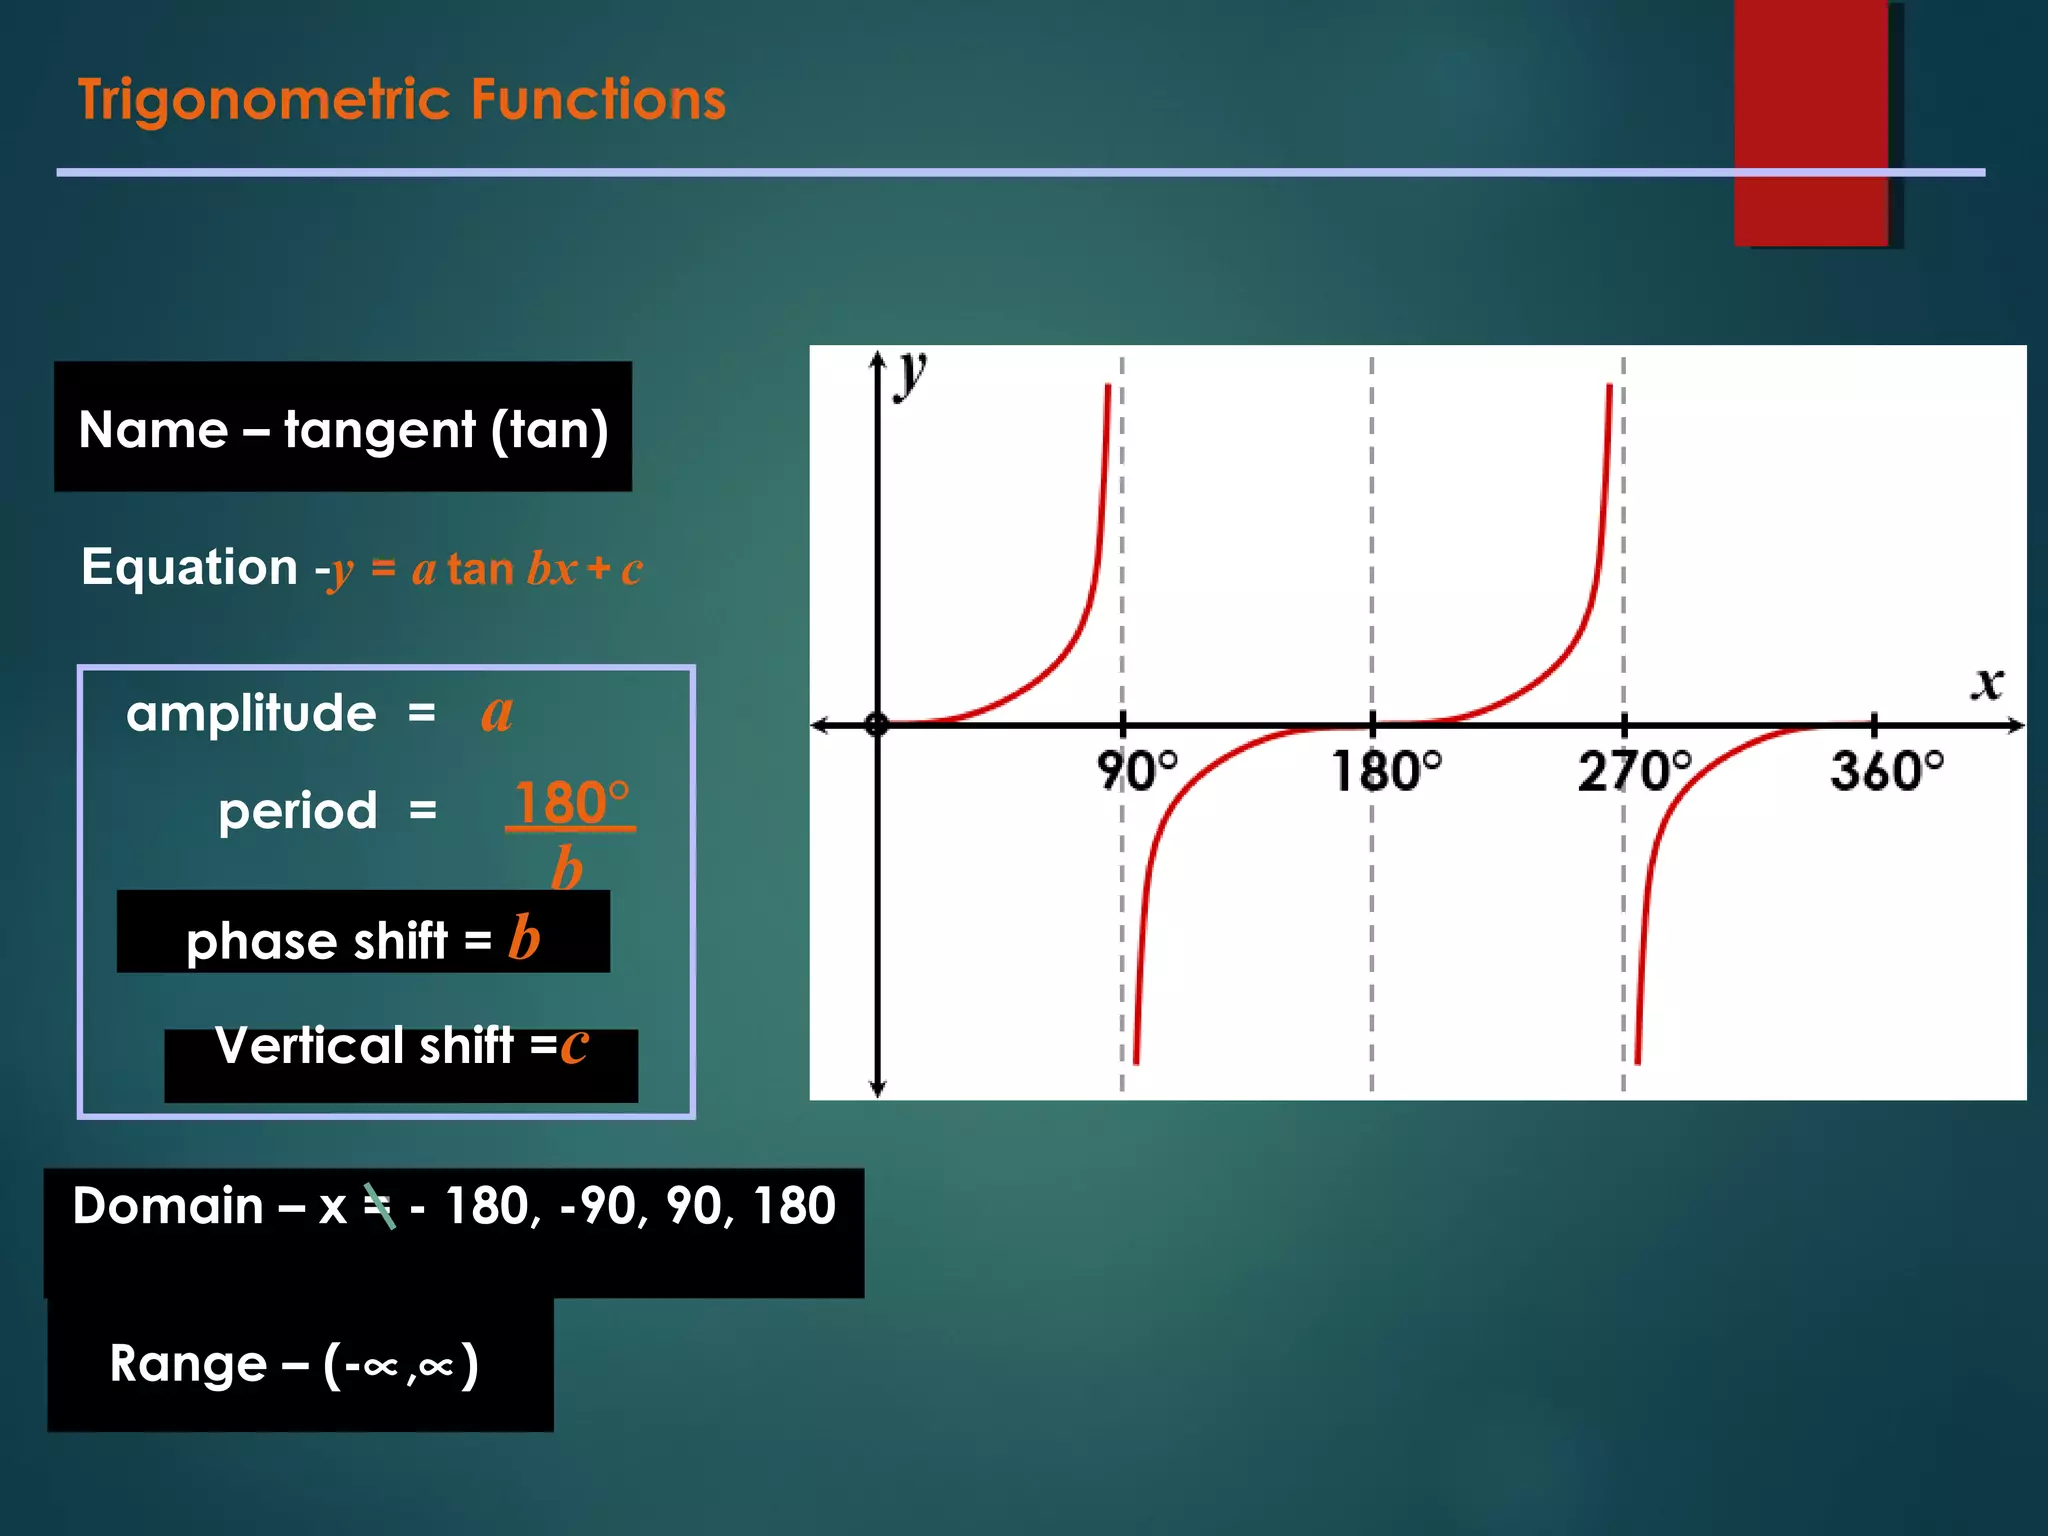
Information on trigonometric functions: sine, cosine, and tangent including their equations, domains, and ranges.
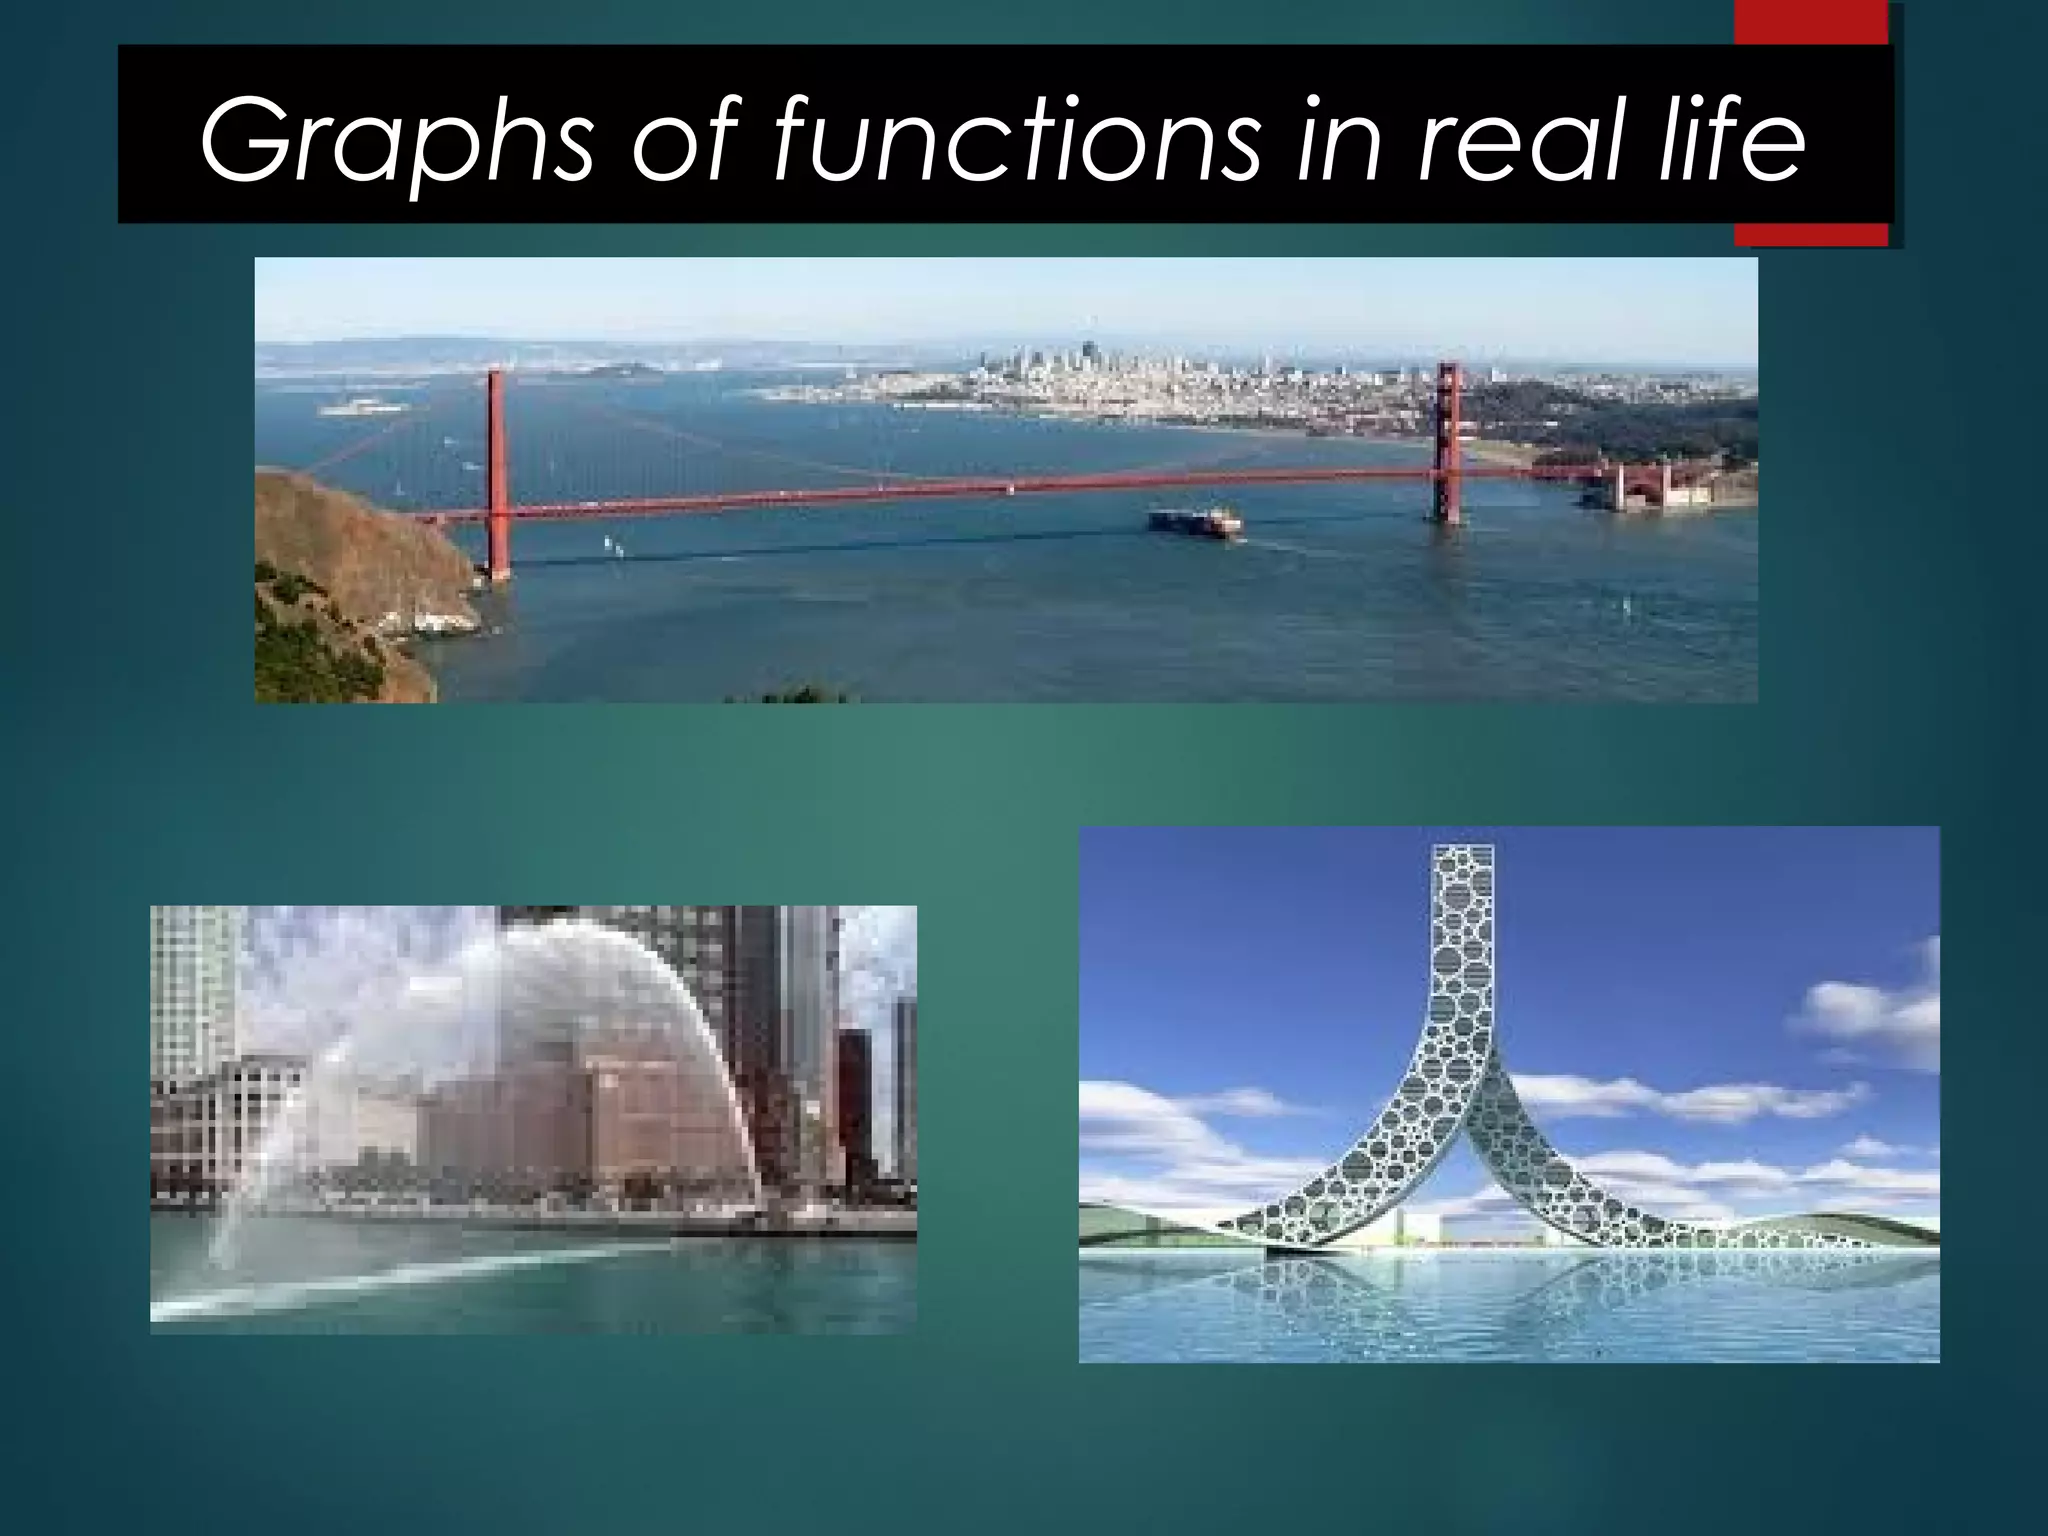
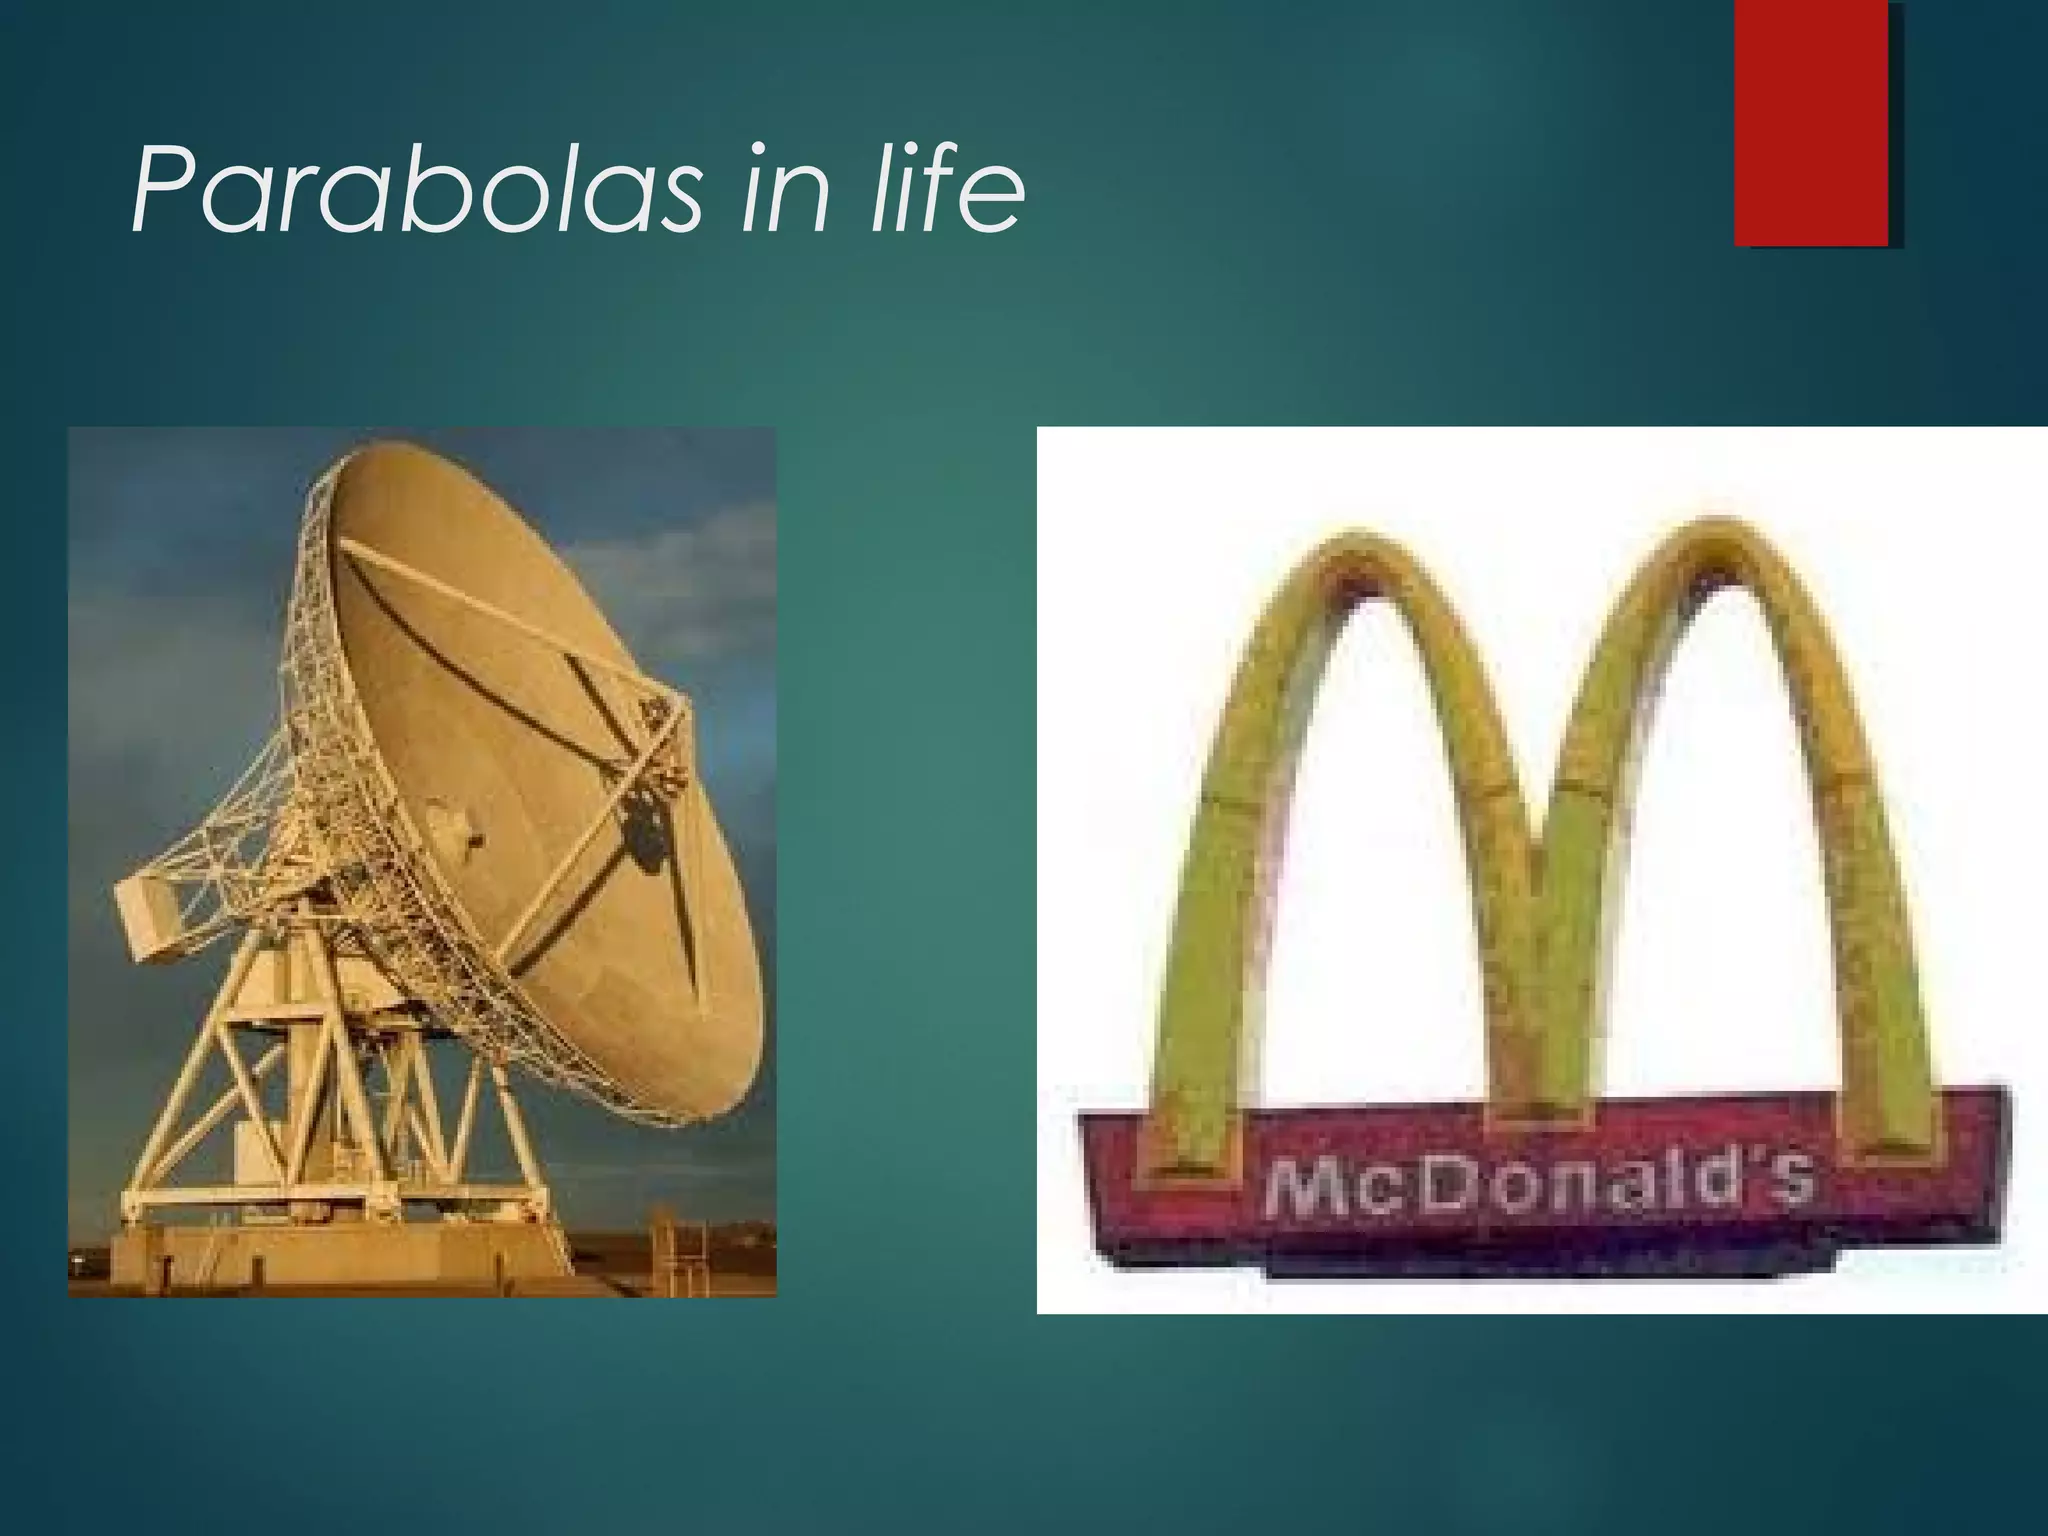
Illustration of functions and parabolas in real life and their significance, including examples.
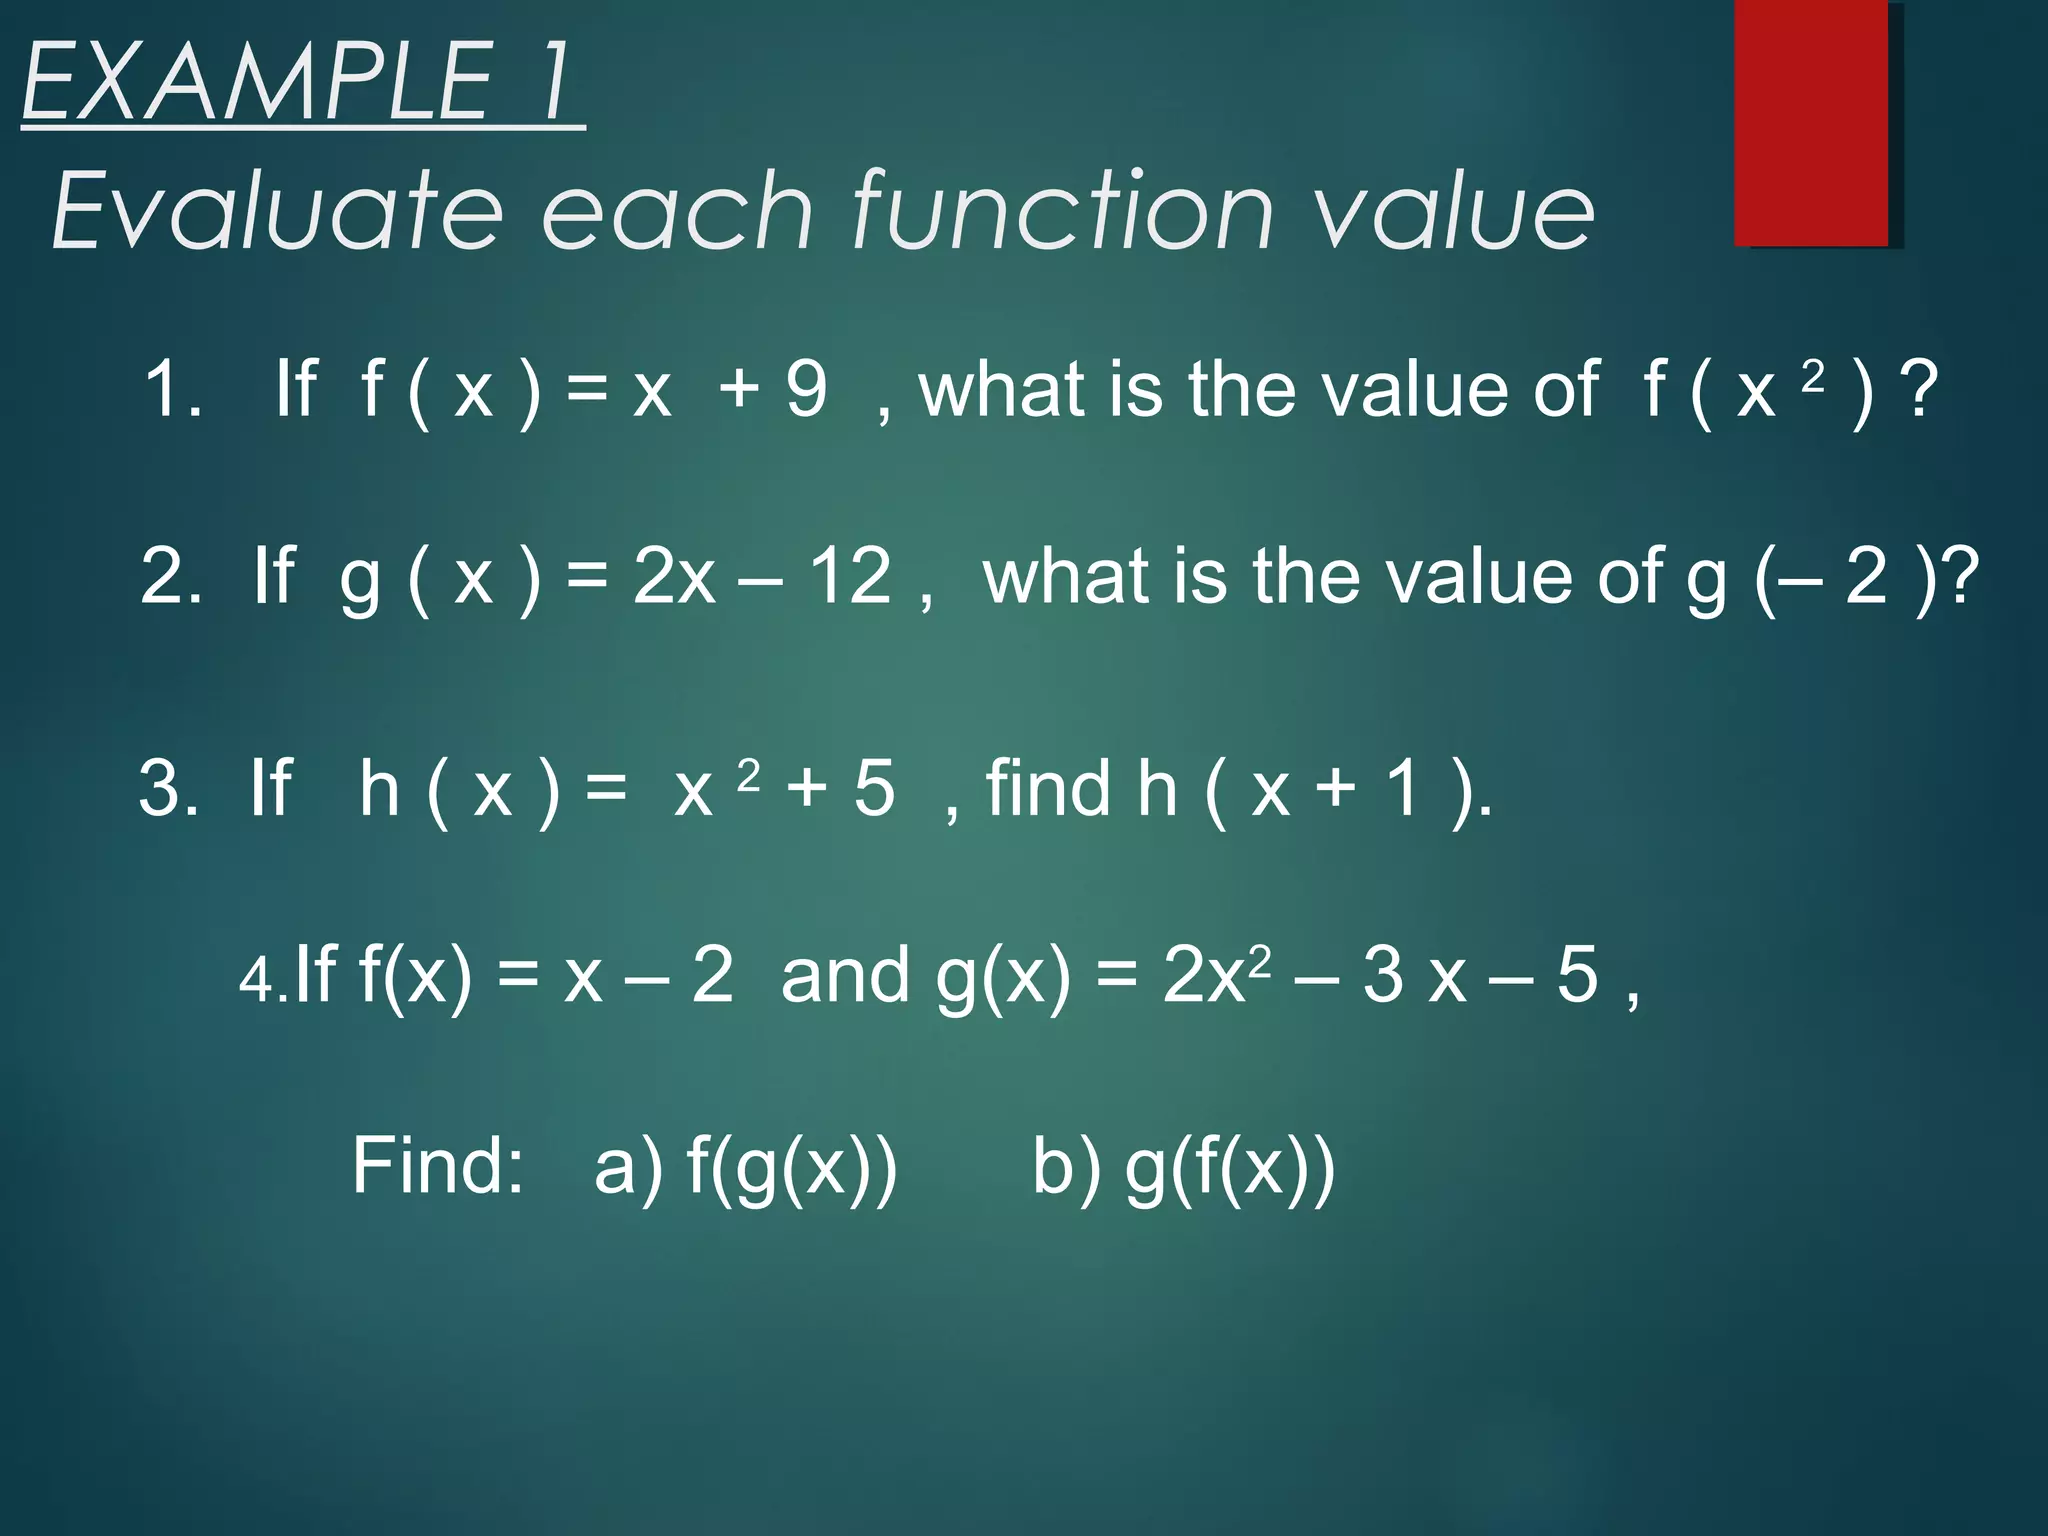
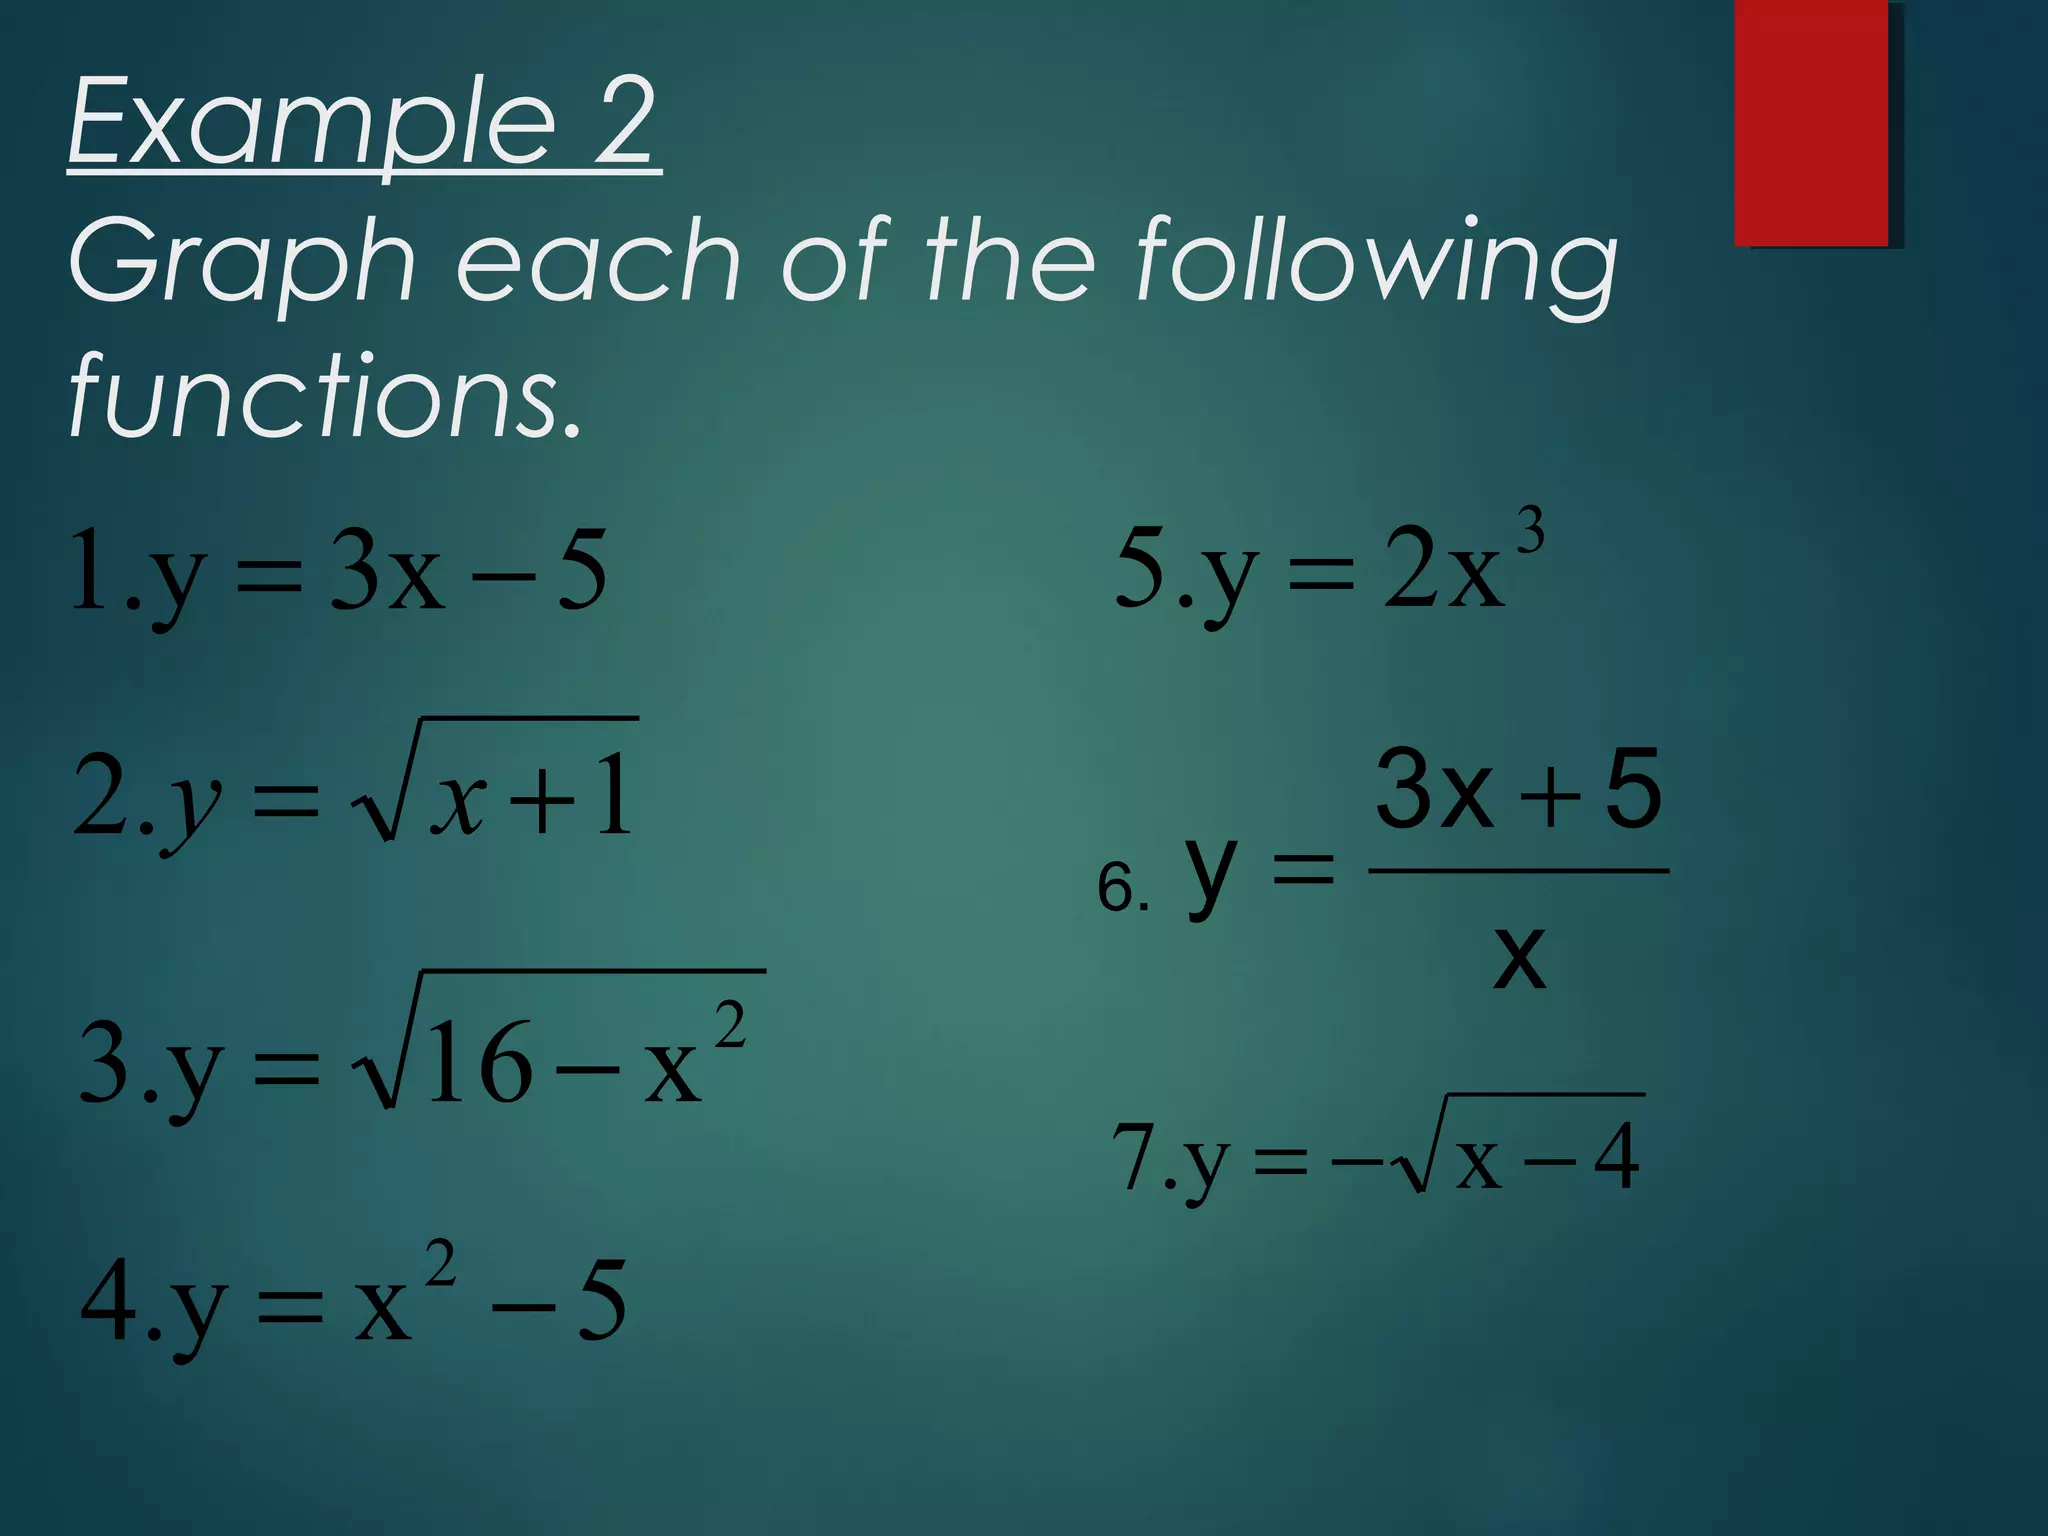
Assignments for students, including evaluating functions, graphing, and determining properties of functions.
Cited sources and references for functions and related mathematical content.
Closing remarks and thank you note at the end of the presentation.