Downloaded 114 times


This document provides information about migration in India. It begins with defining migration as the movement of people from one place to another. It then discusses internal migration within India and presents the migration model showing the source, destination, push factors, pull factors, counterstreams, and obstacles. The document further discusses stepwise migration, types of migration (internal and external), reasons for migration, job sectors (primary, secondary, tertiary, quaternary), and provides statistics on job sectors in India and New Zealand in bar graph form.
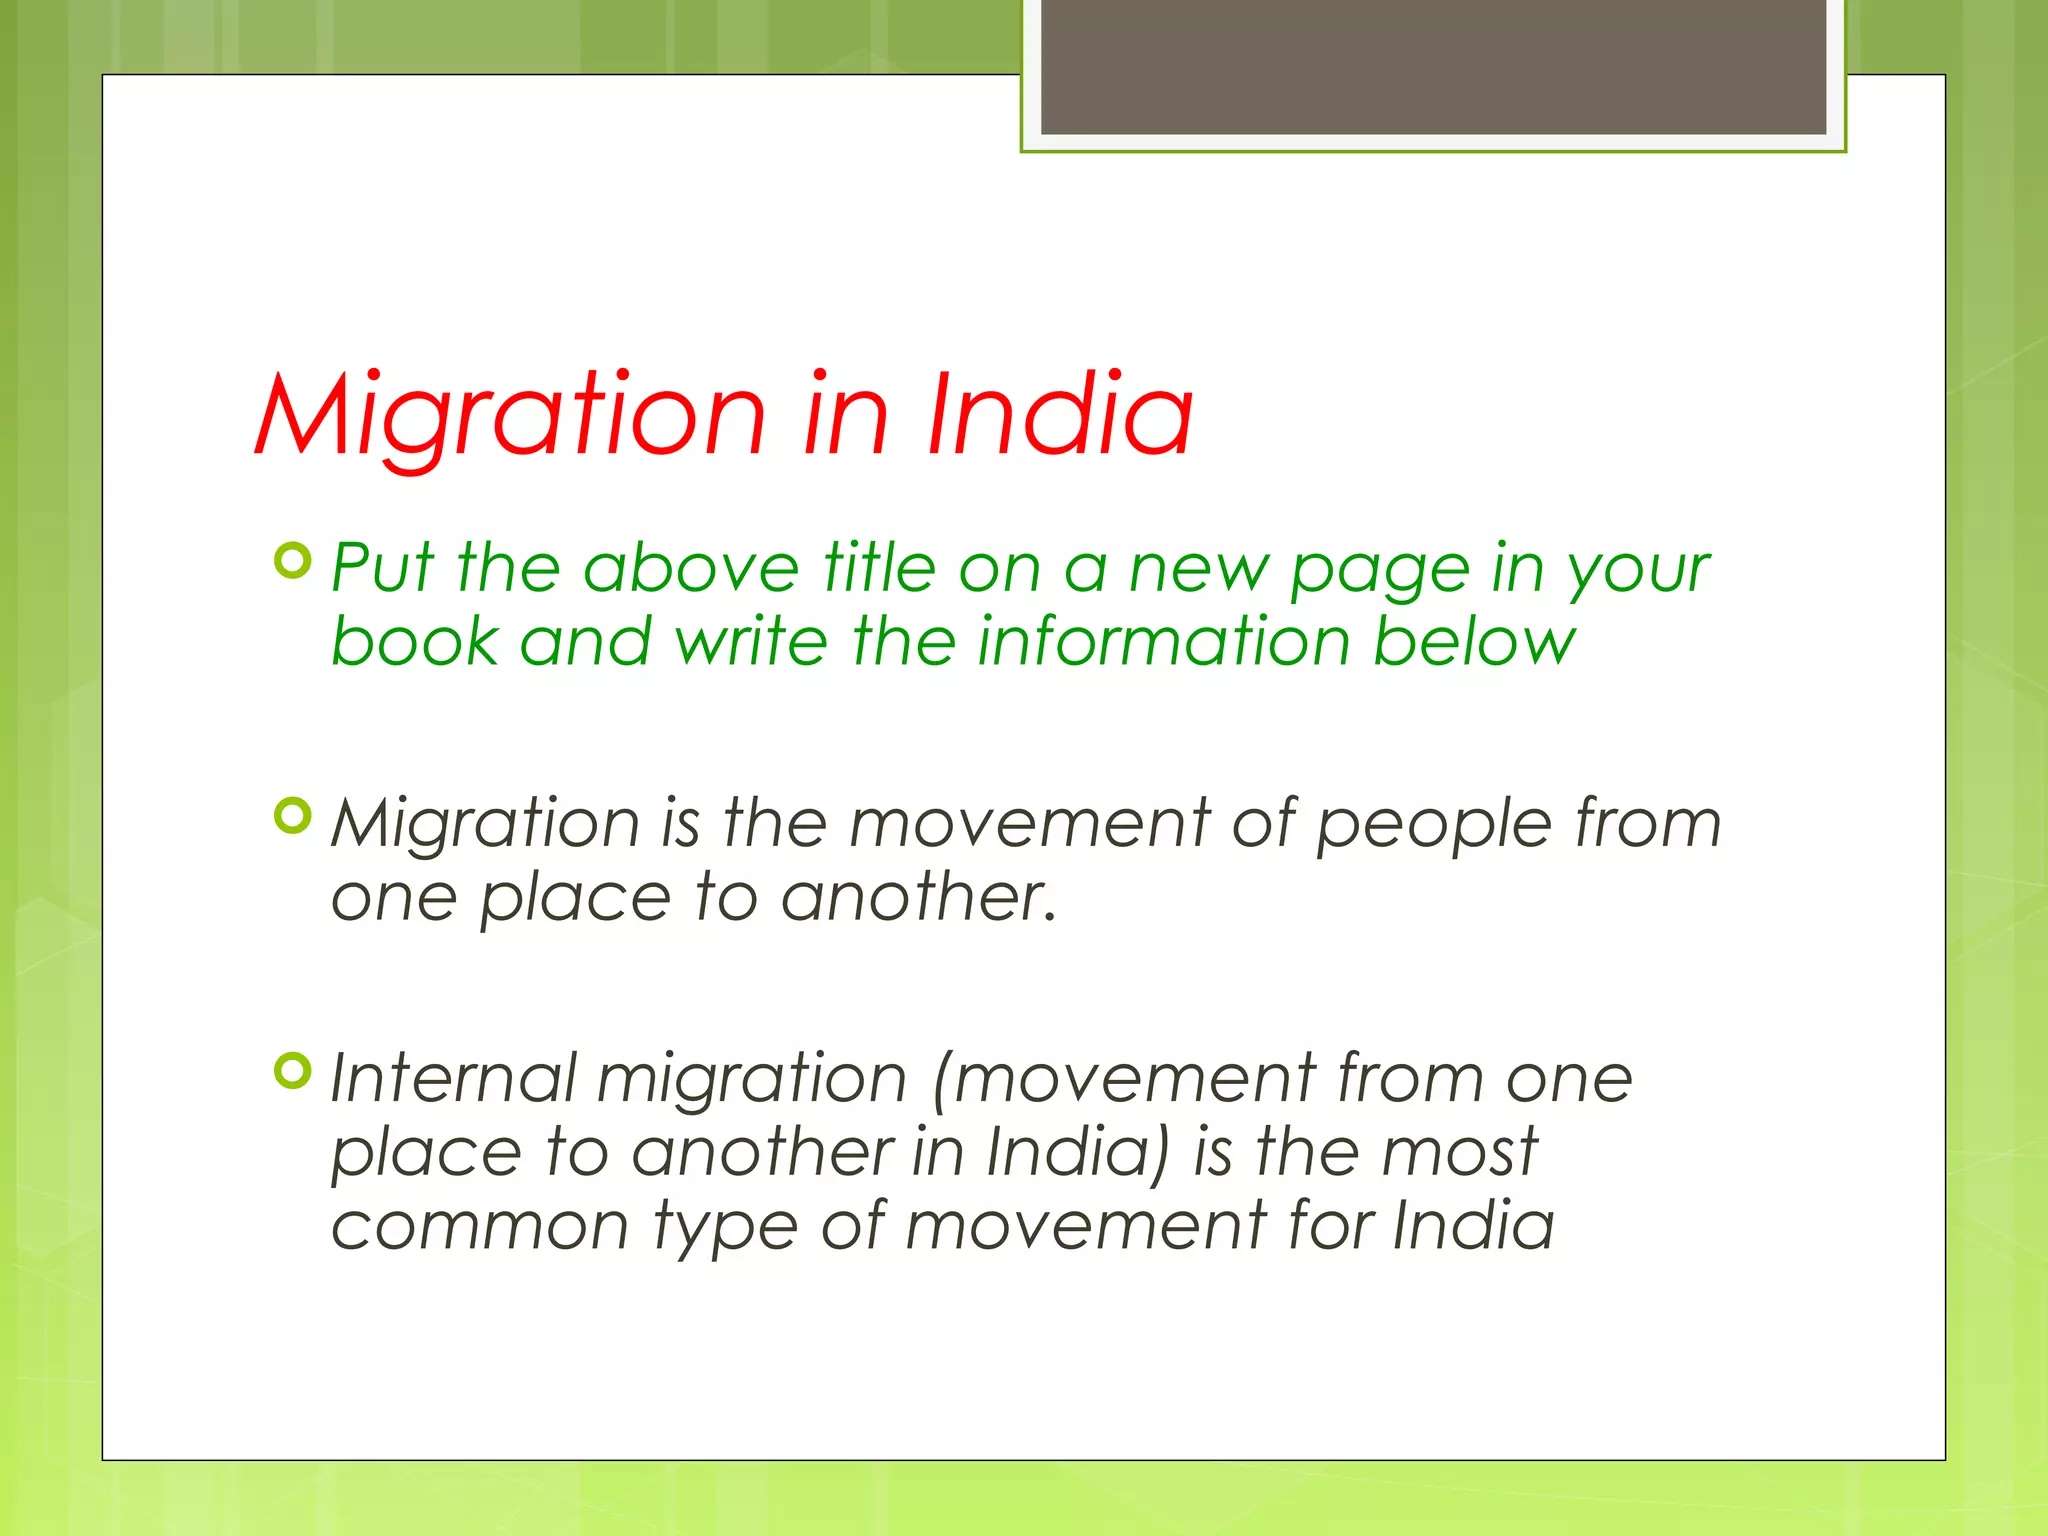
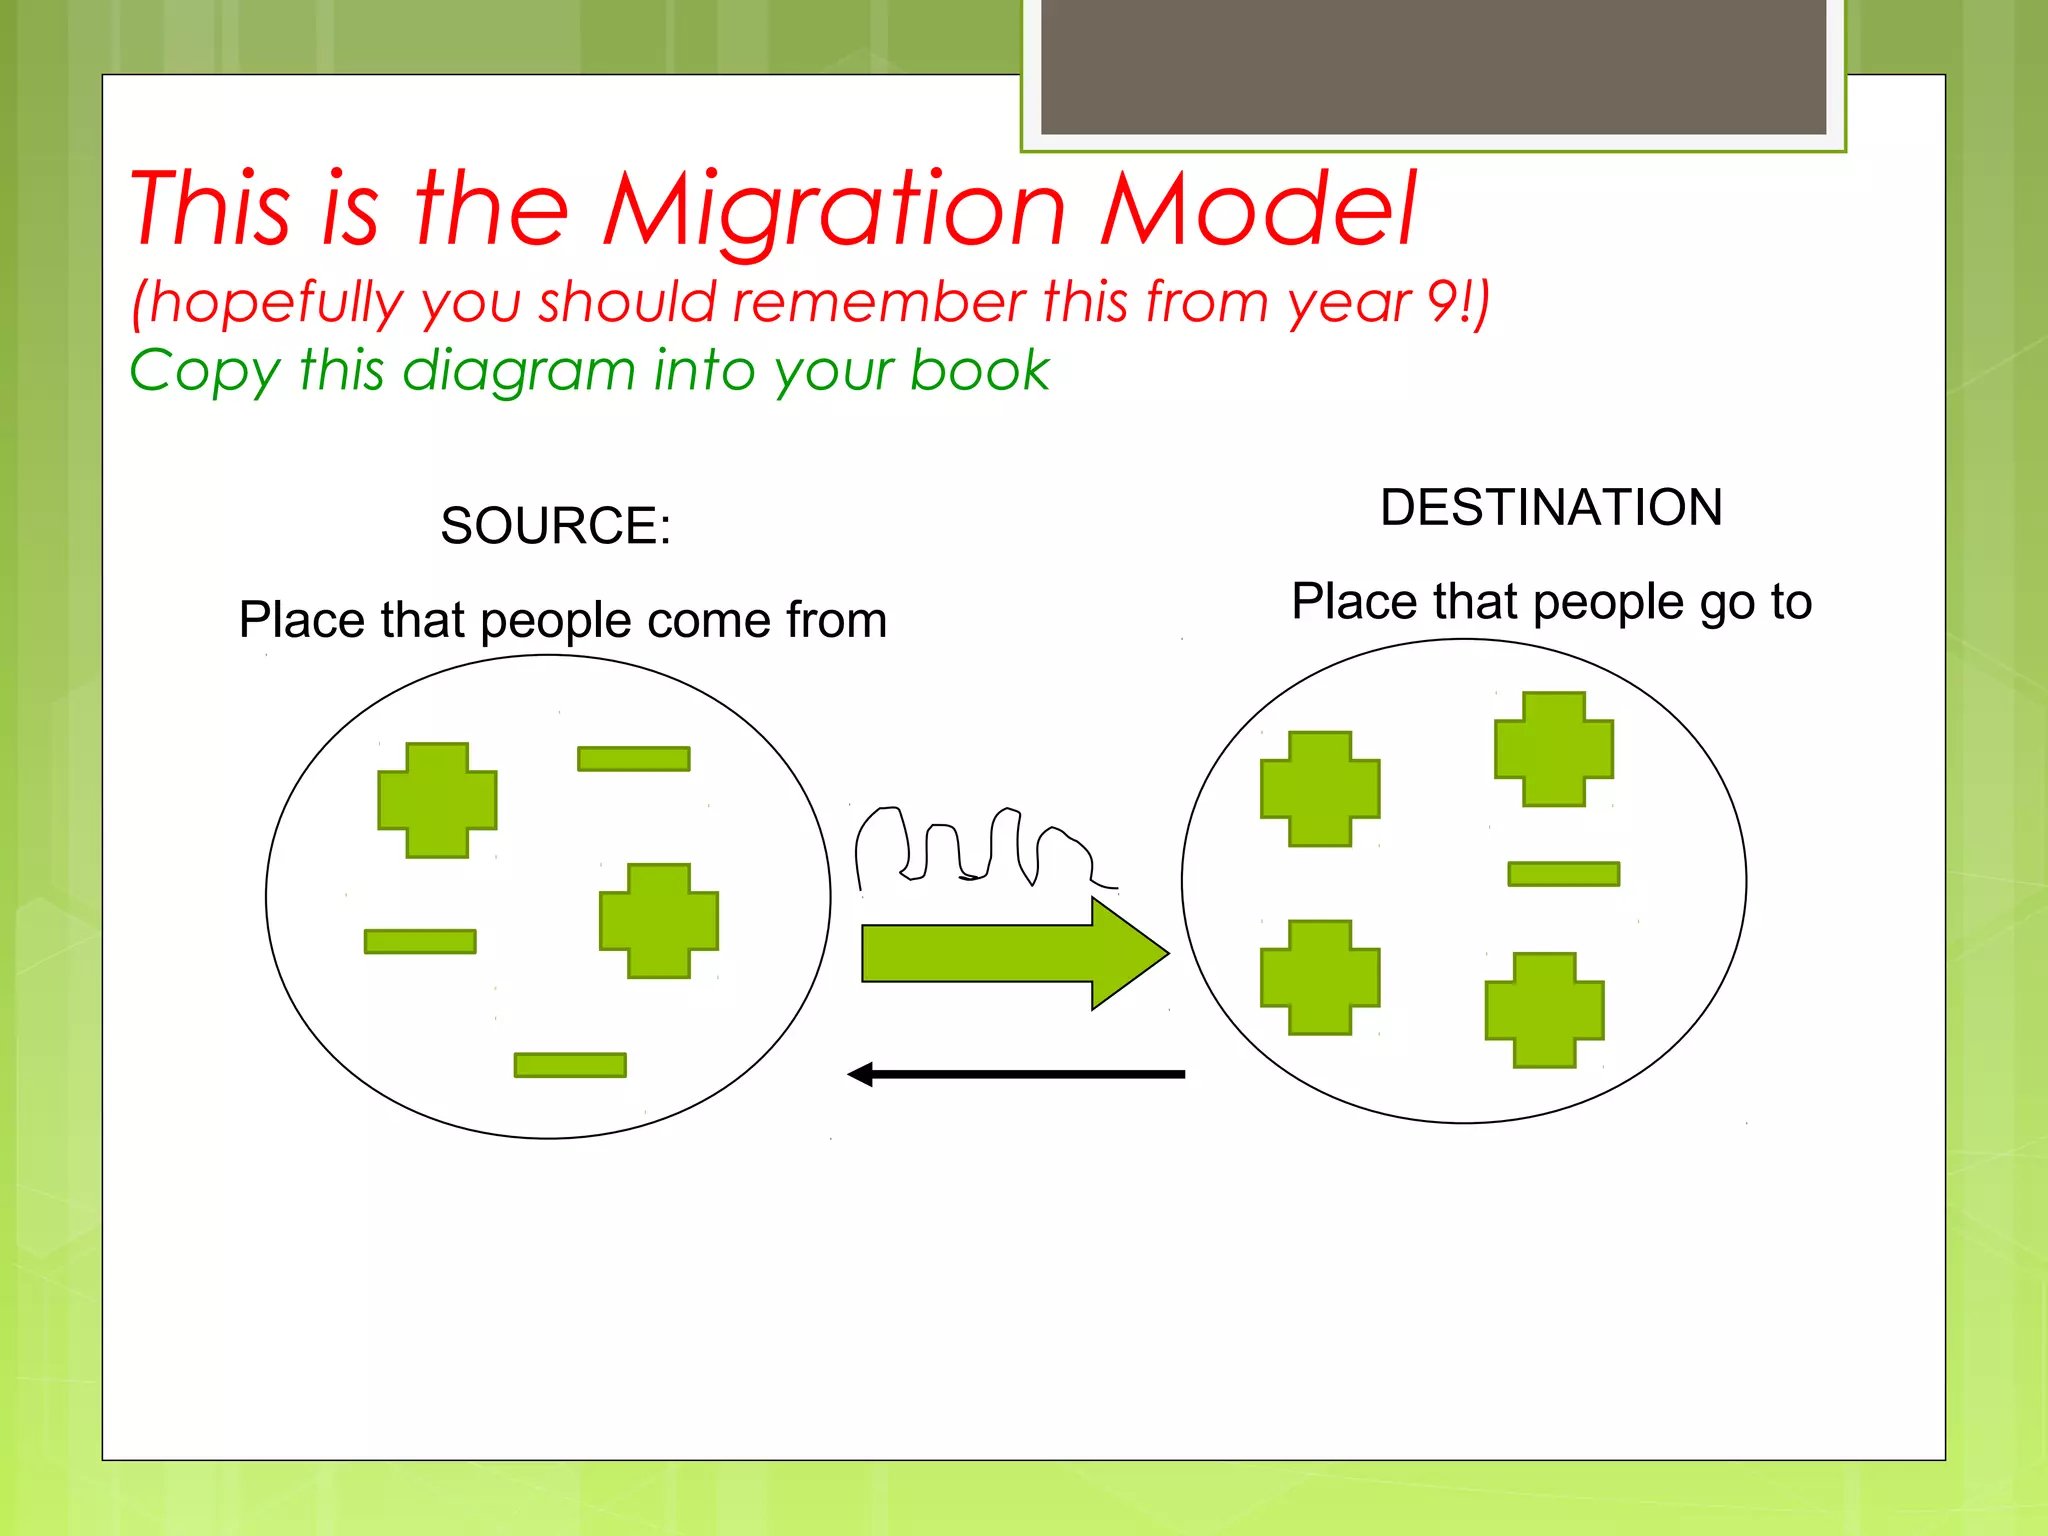
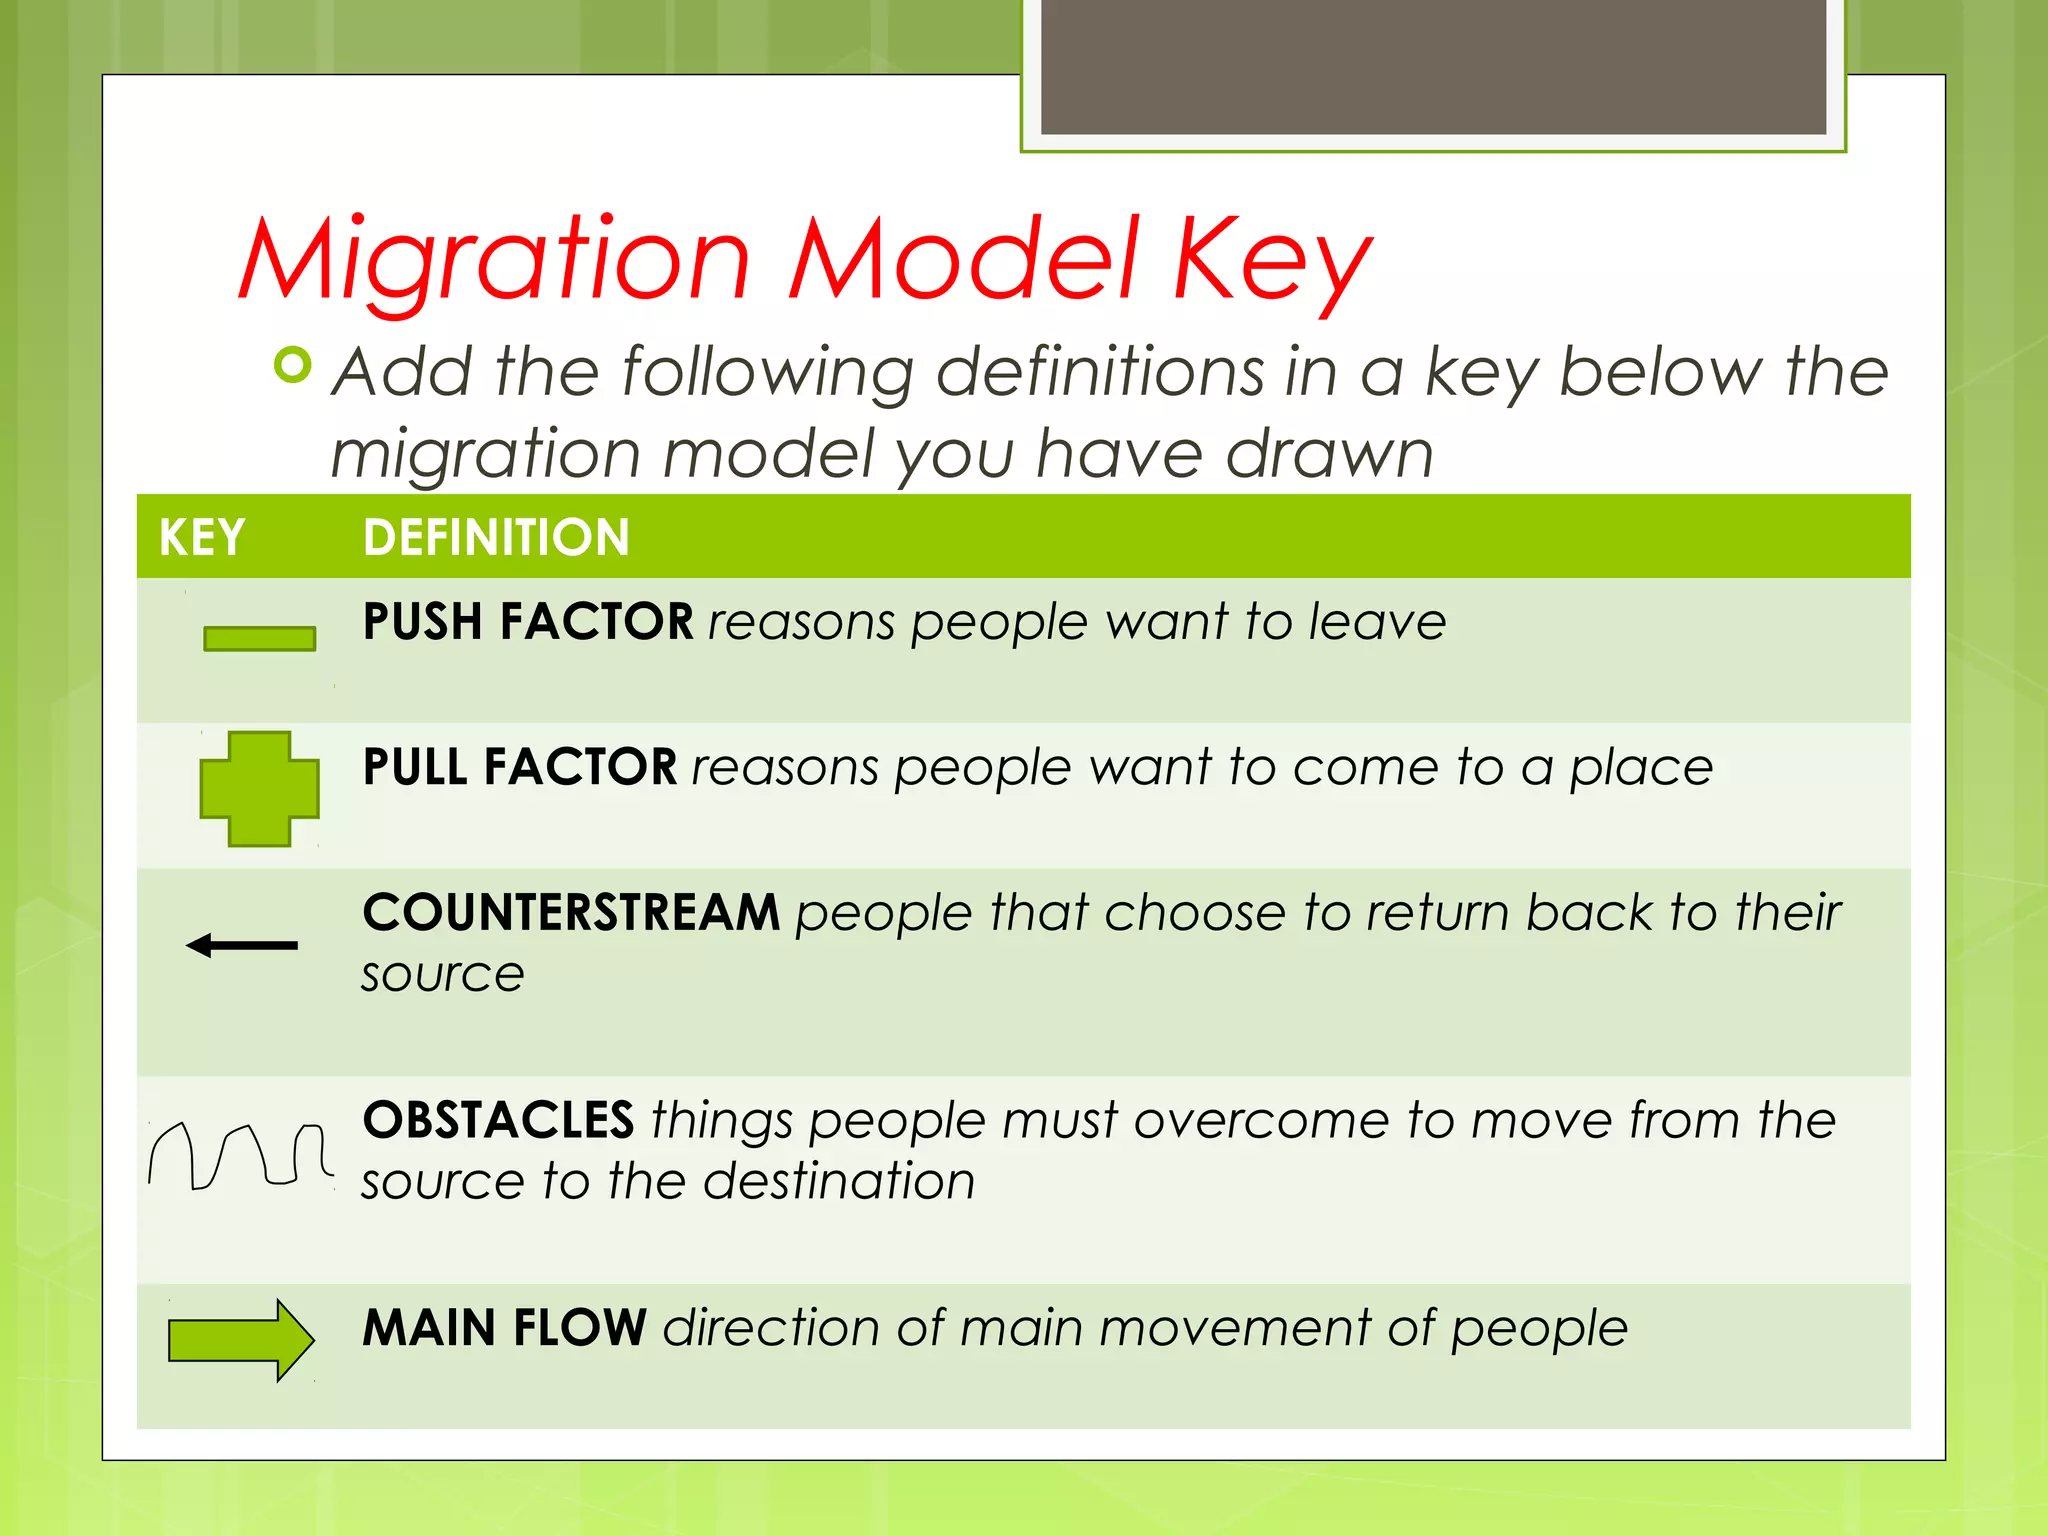
Introduction to migration; definition and types; migration model showing source and destination.
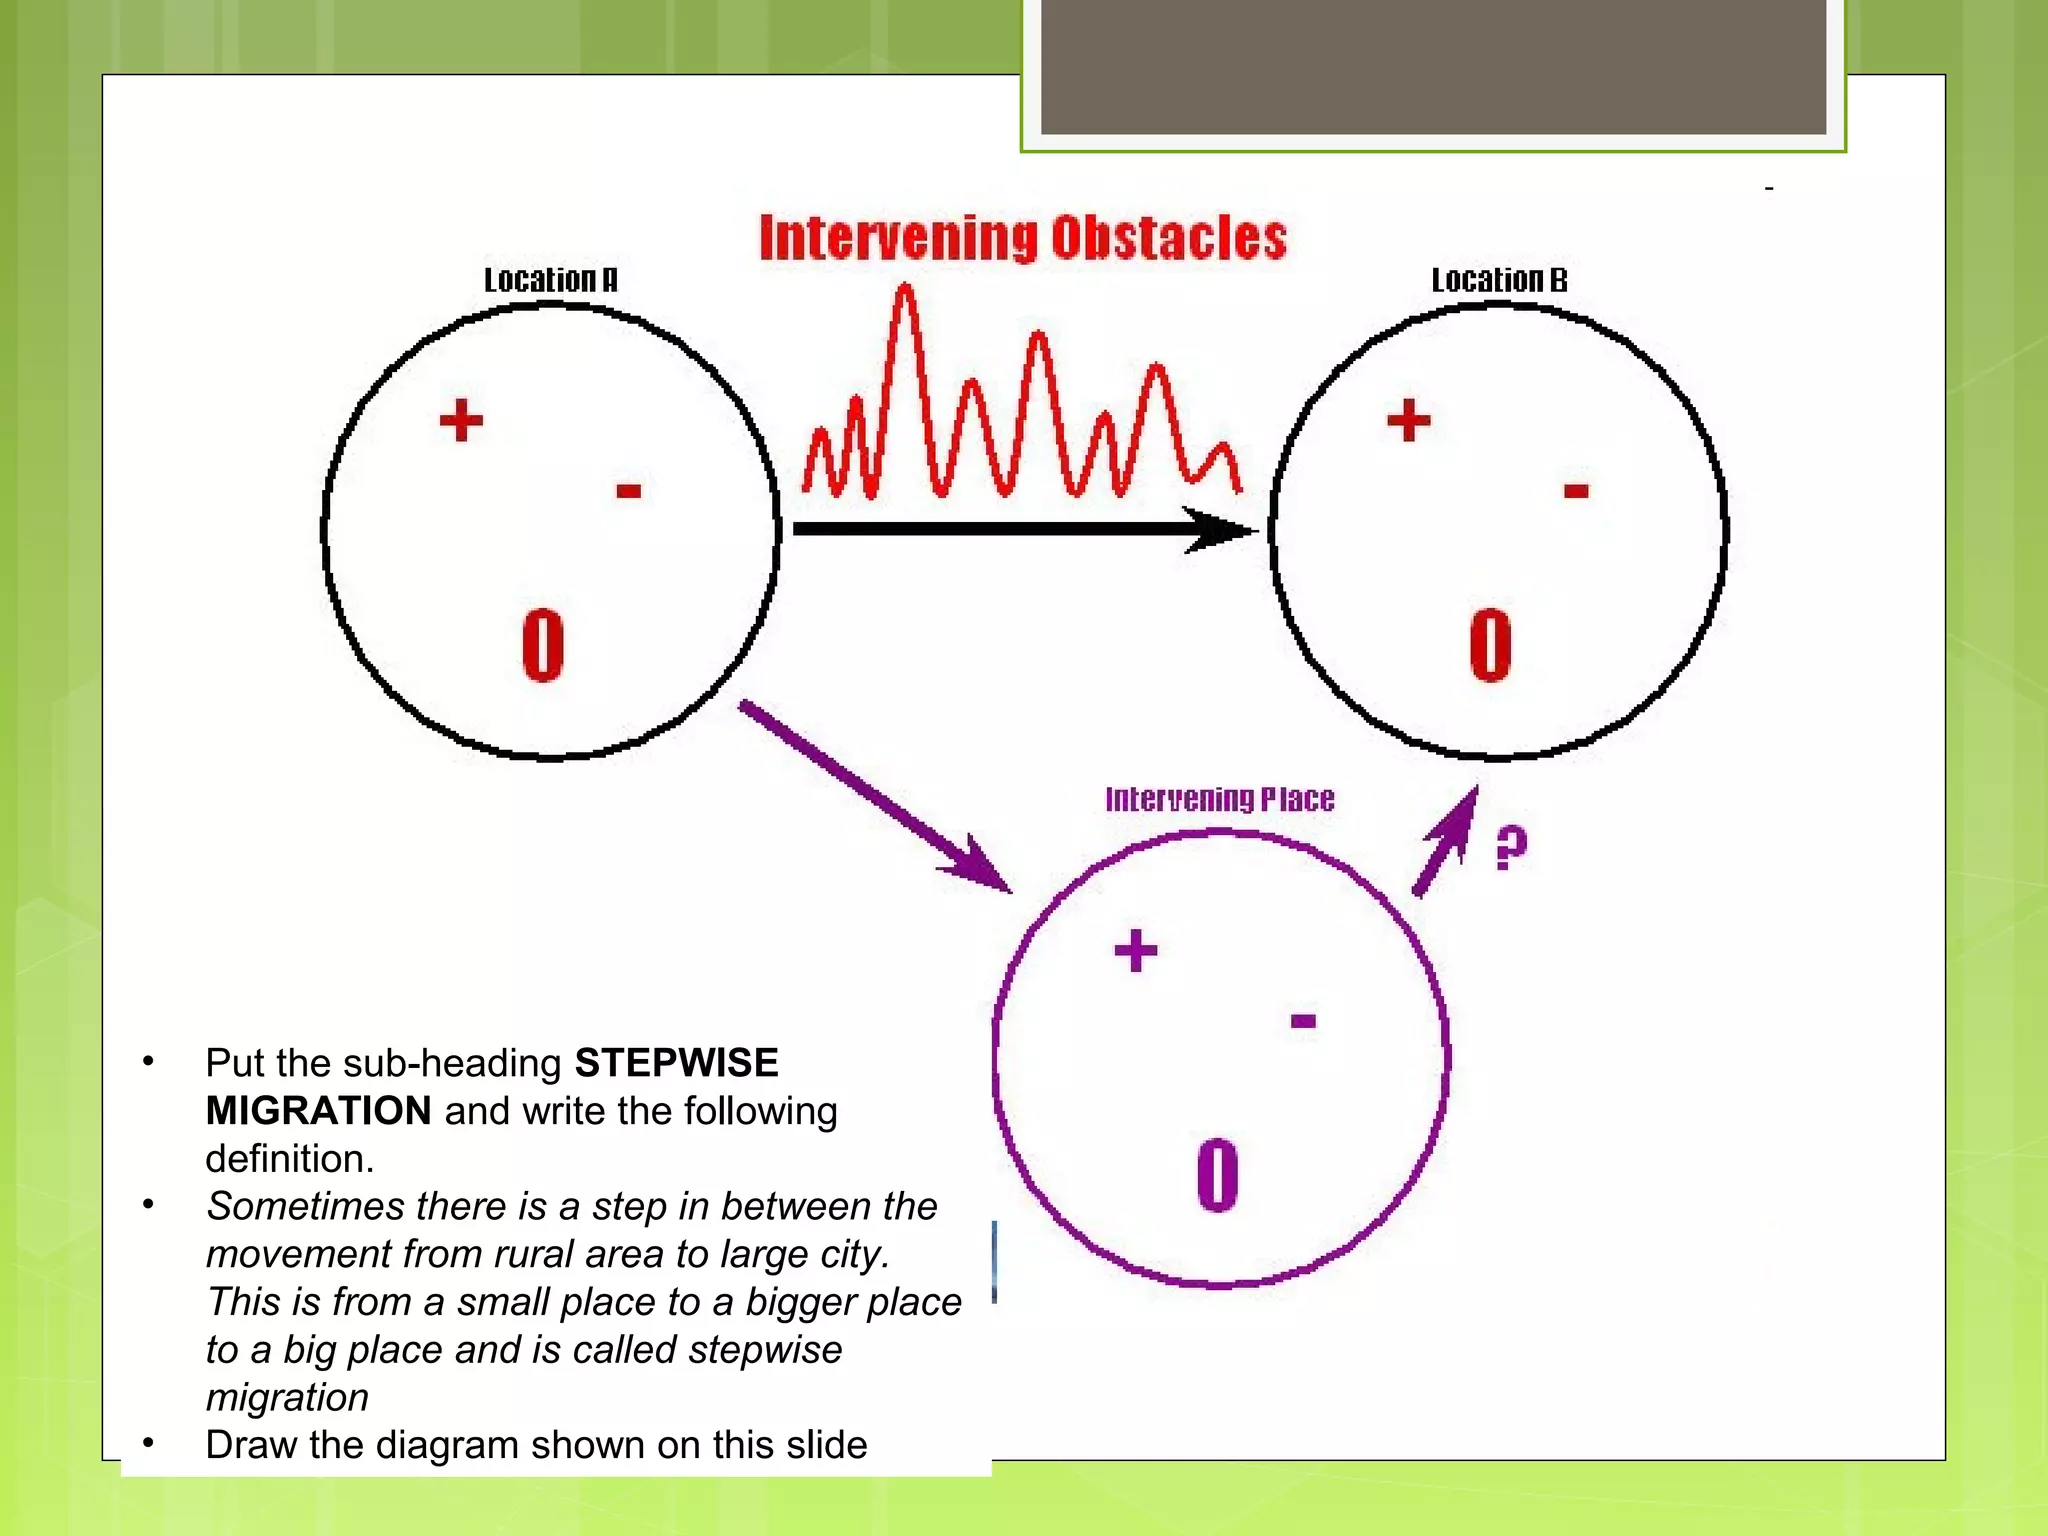
Key definitions for migration; stepwise migration defined as gradual movement to urban areas.
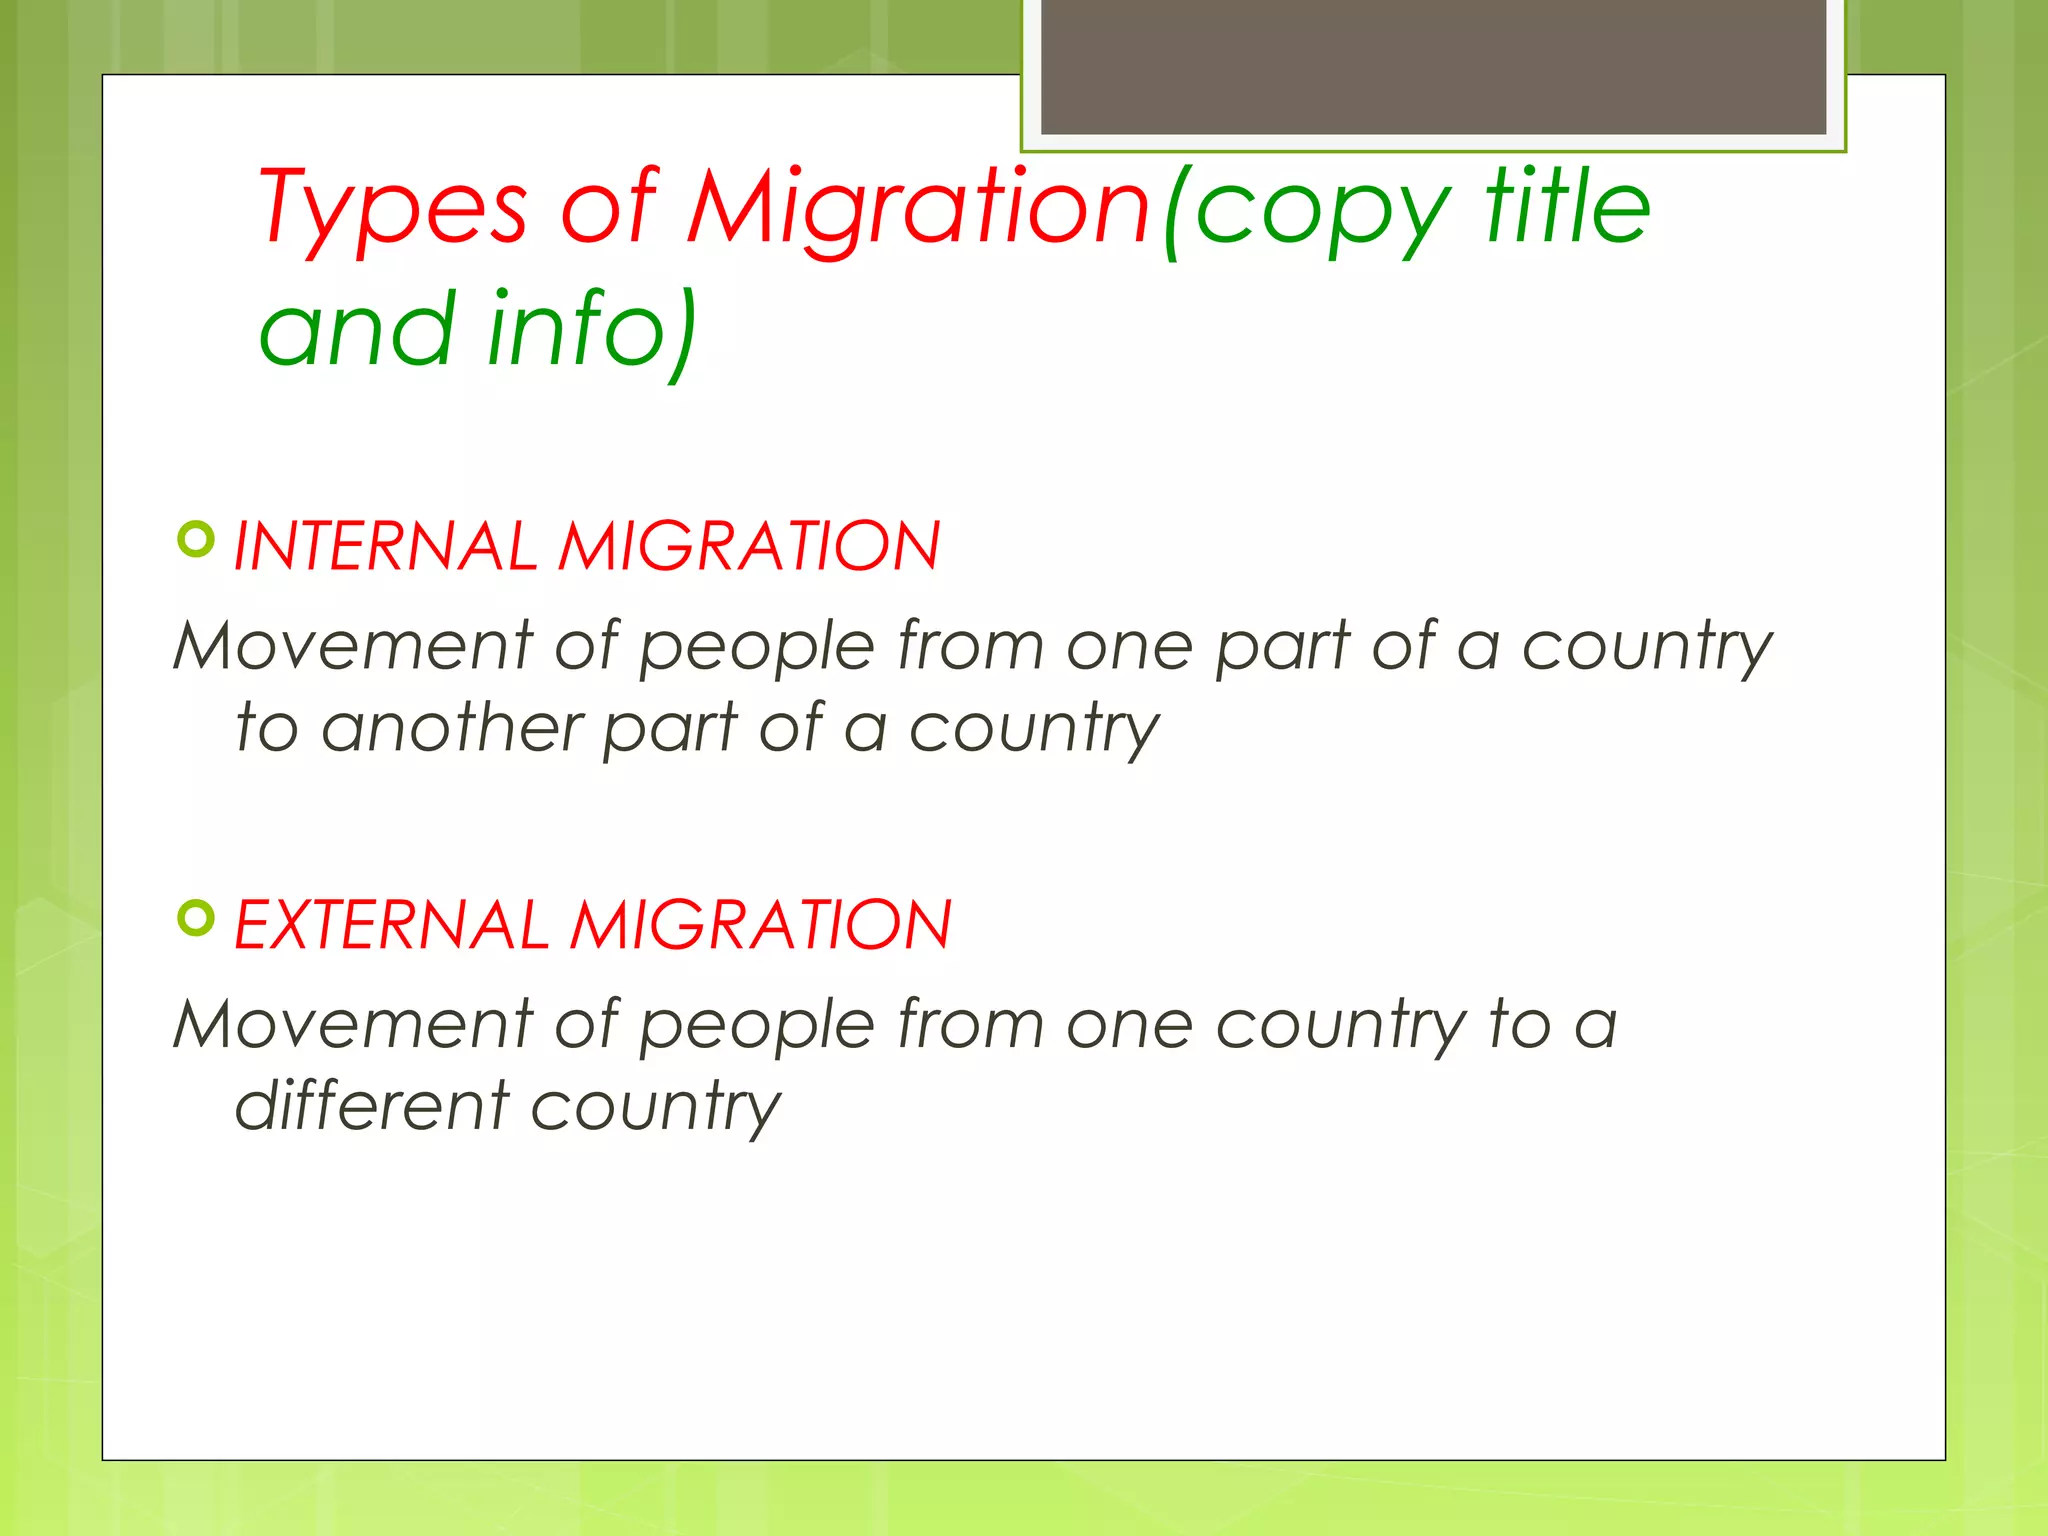
Internal migration: movement within a country; external migration: movement to another country.
Reasons for migration; common push factors include lack of jobs, poor conditions, and natural disasters.
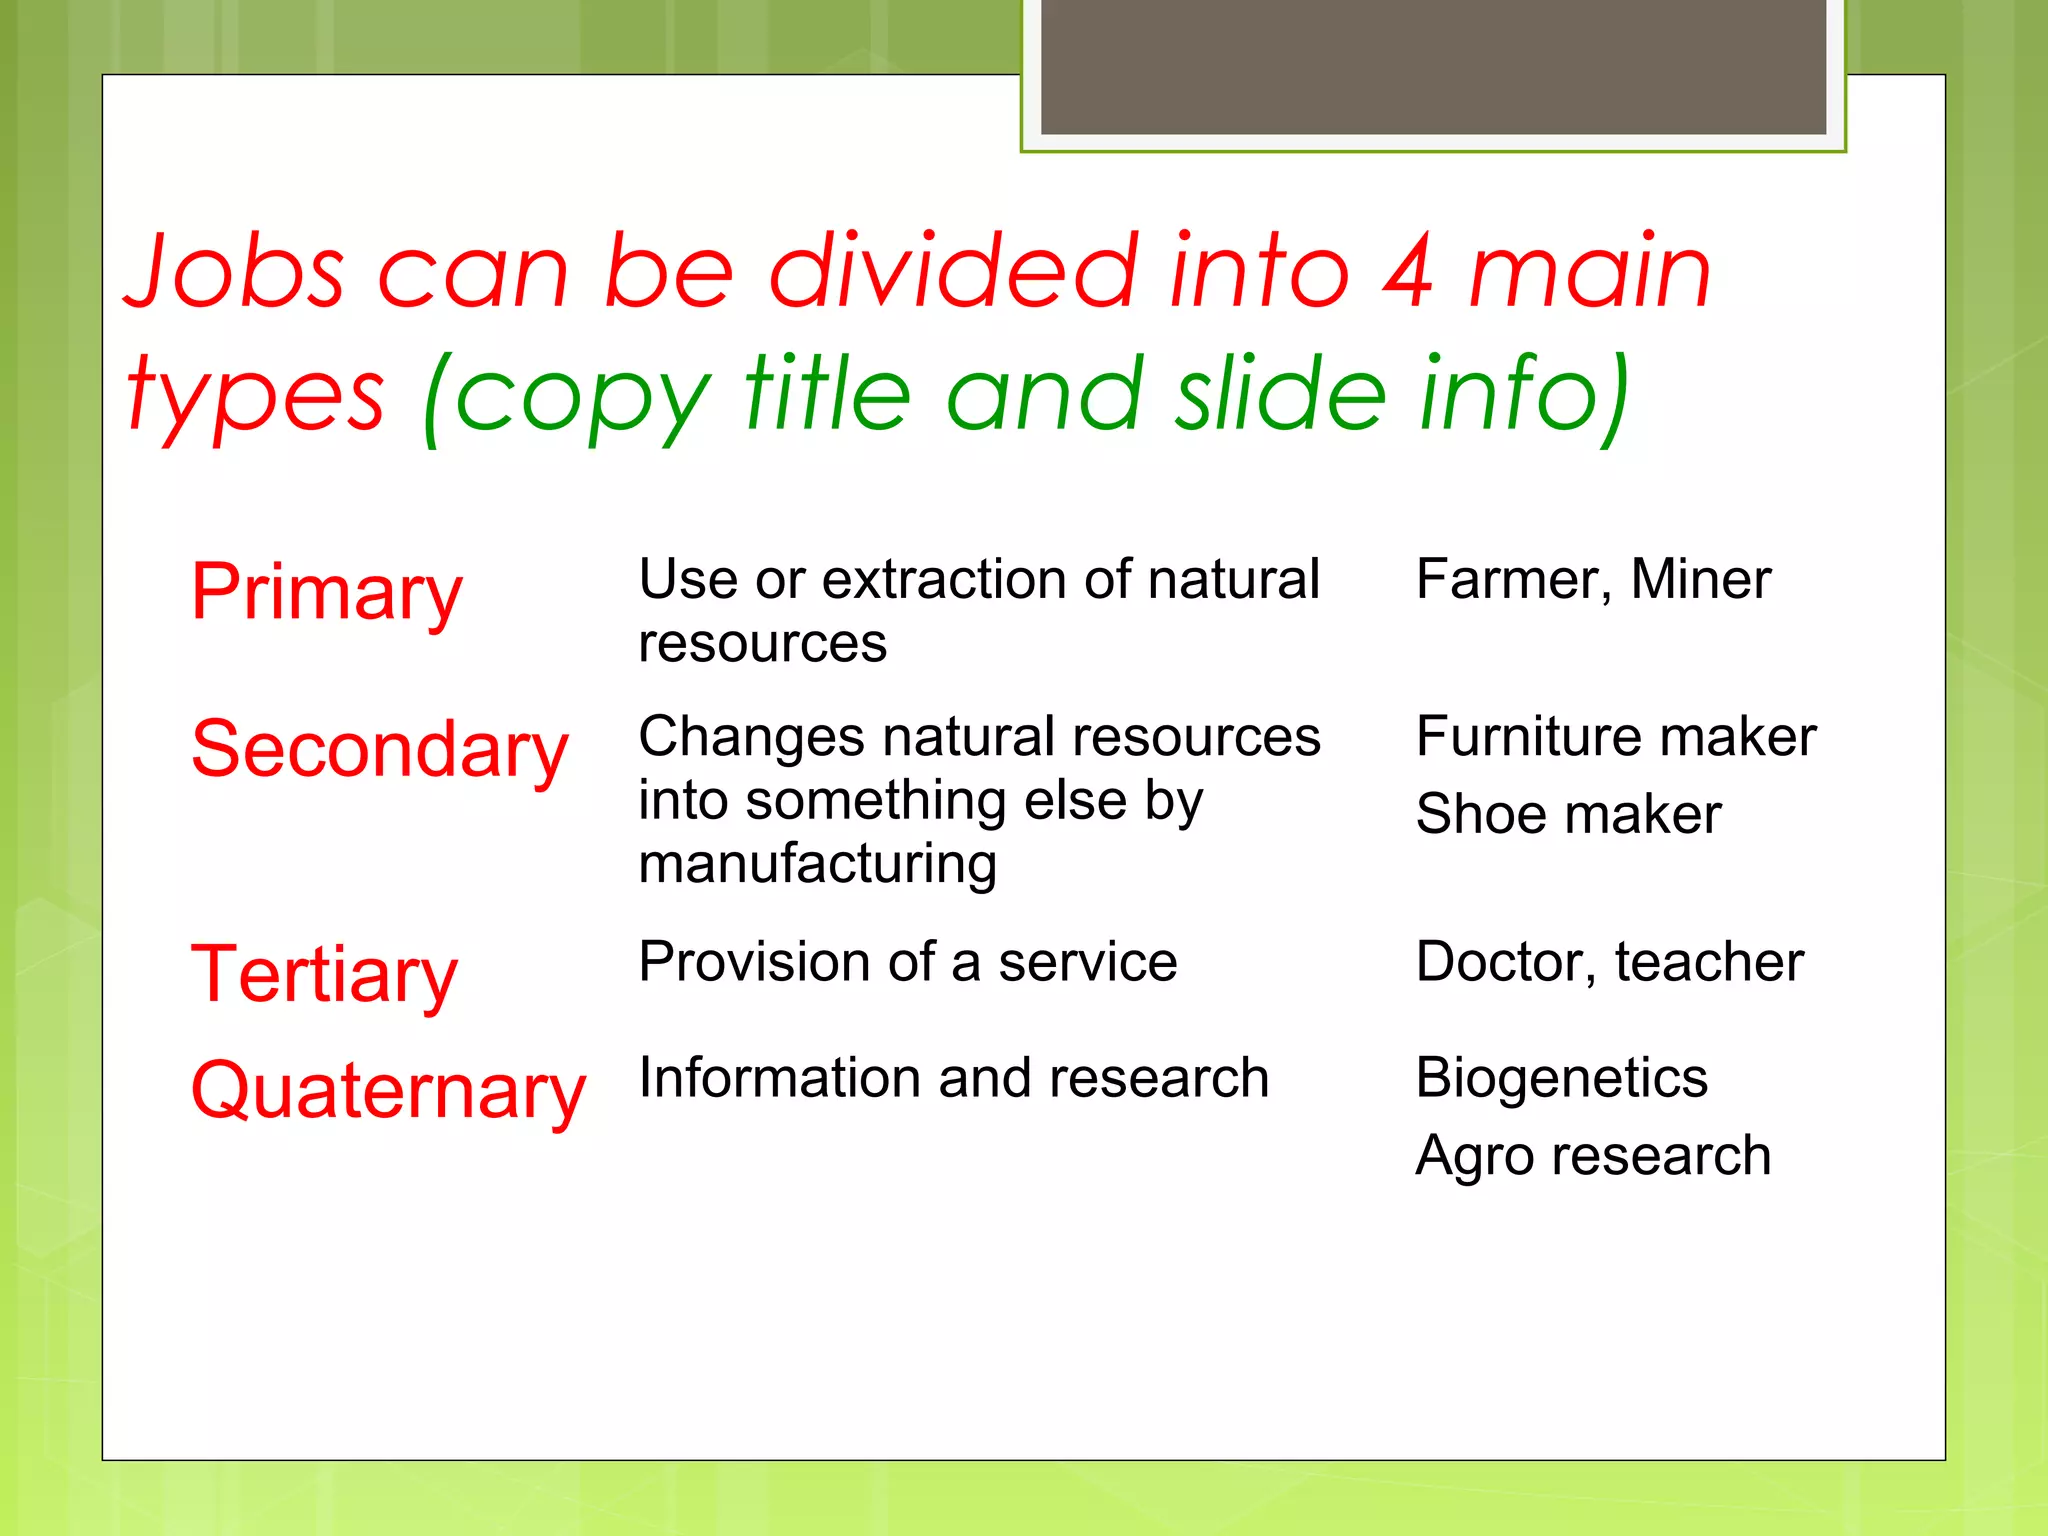
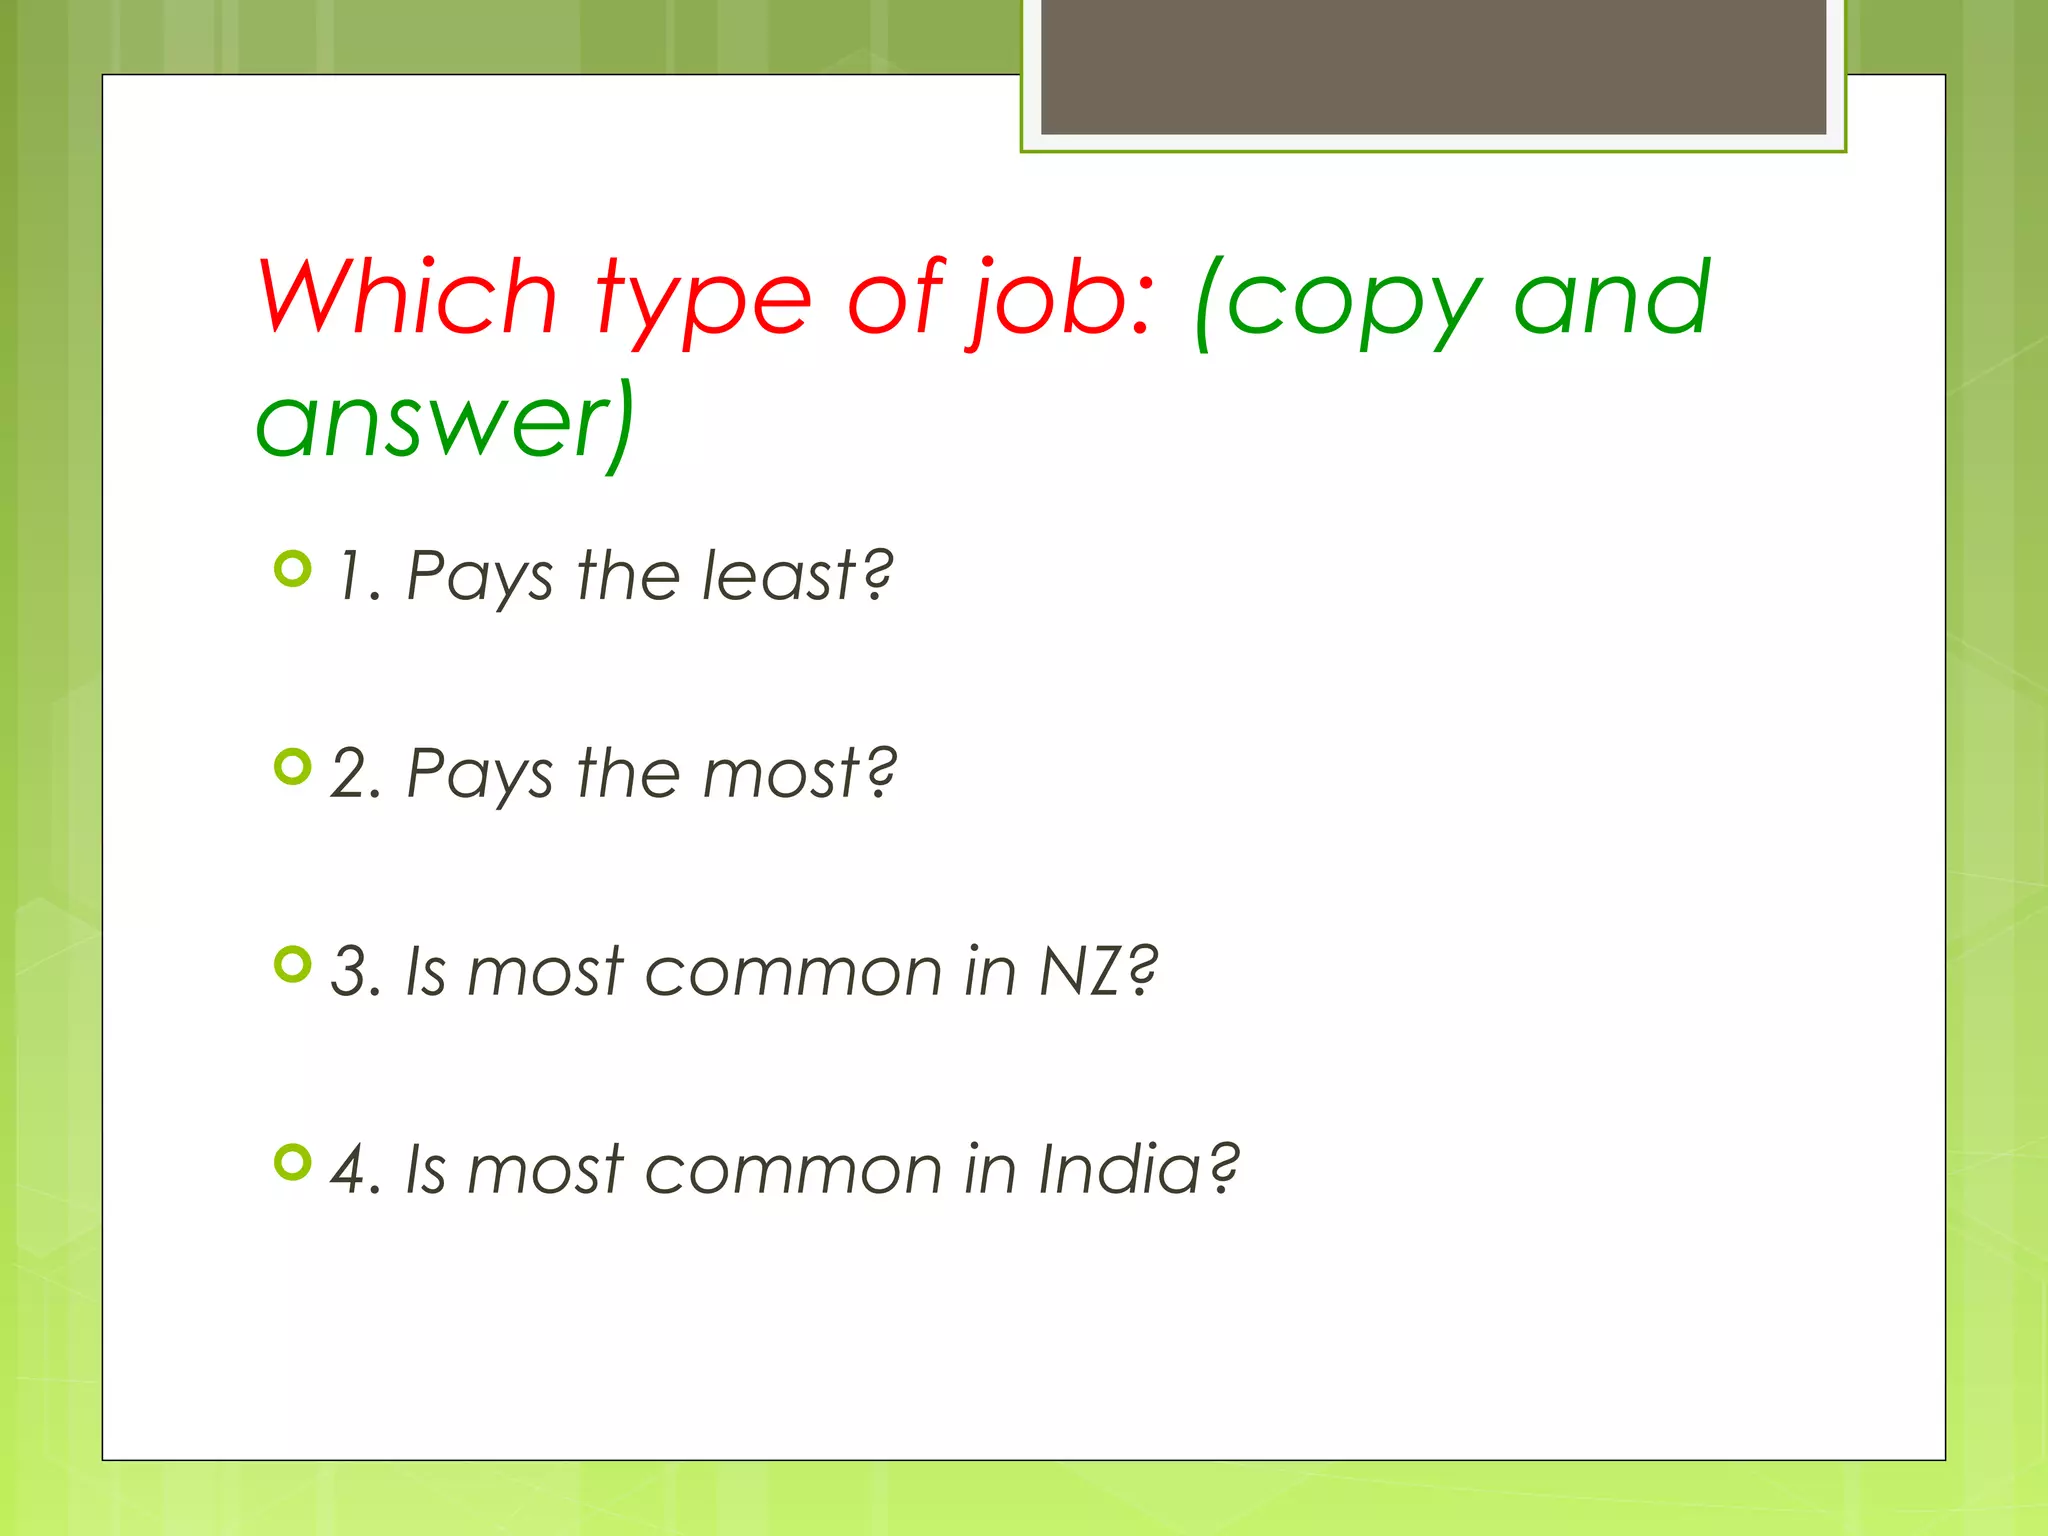
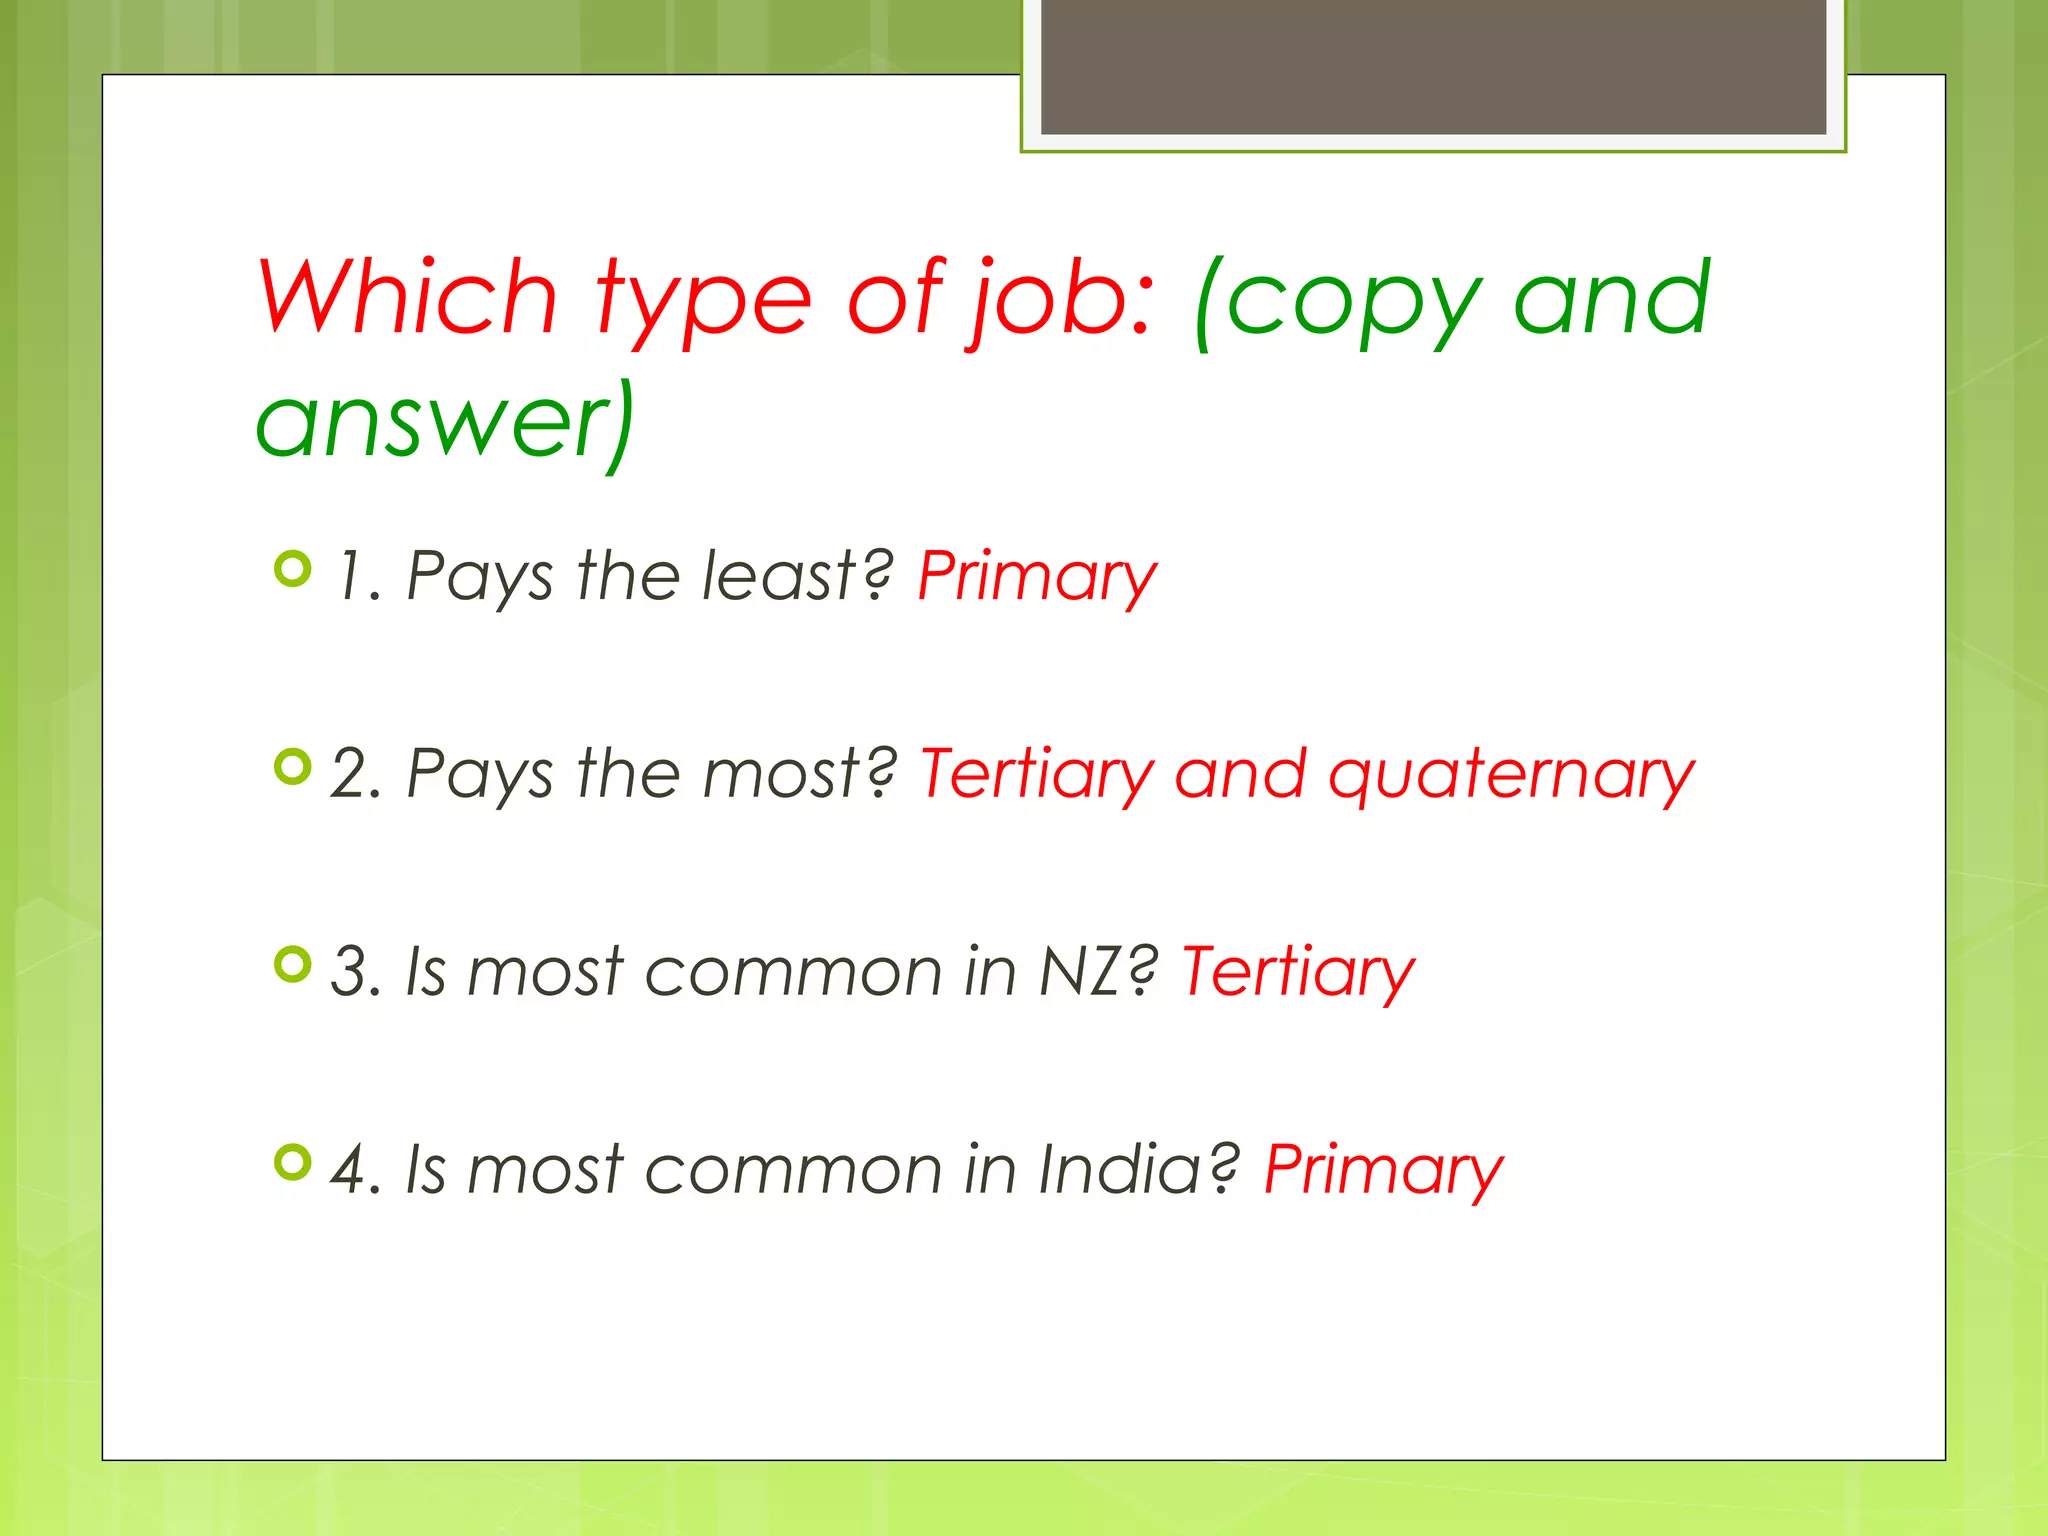
Overview of job sectors: primary, secondary, tertiary, quaternary; job payment analysis comparing NZ and India.
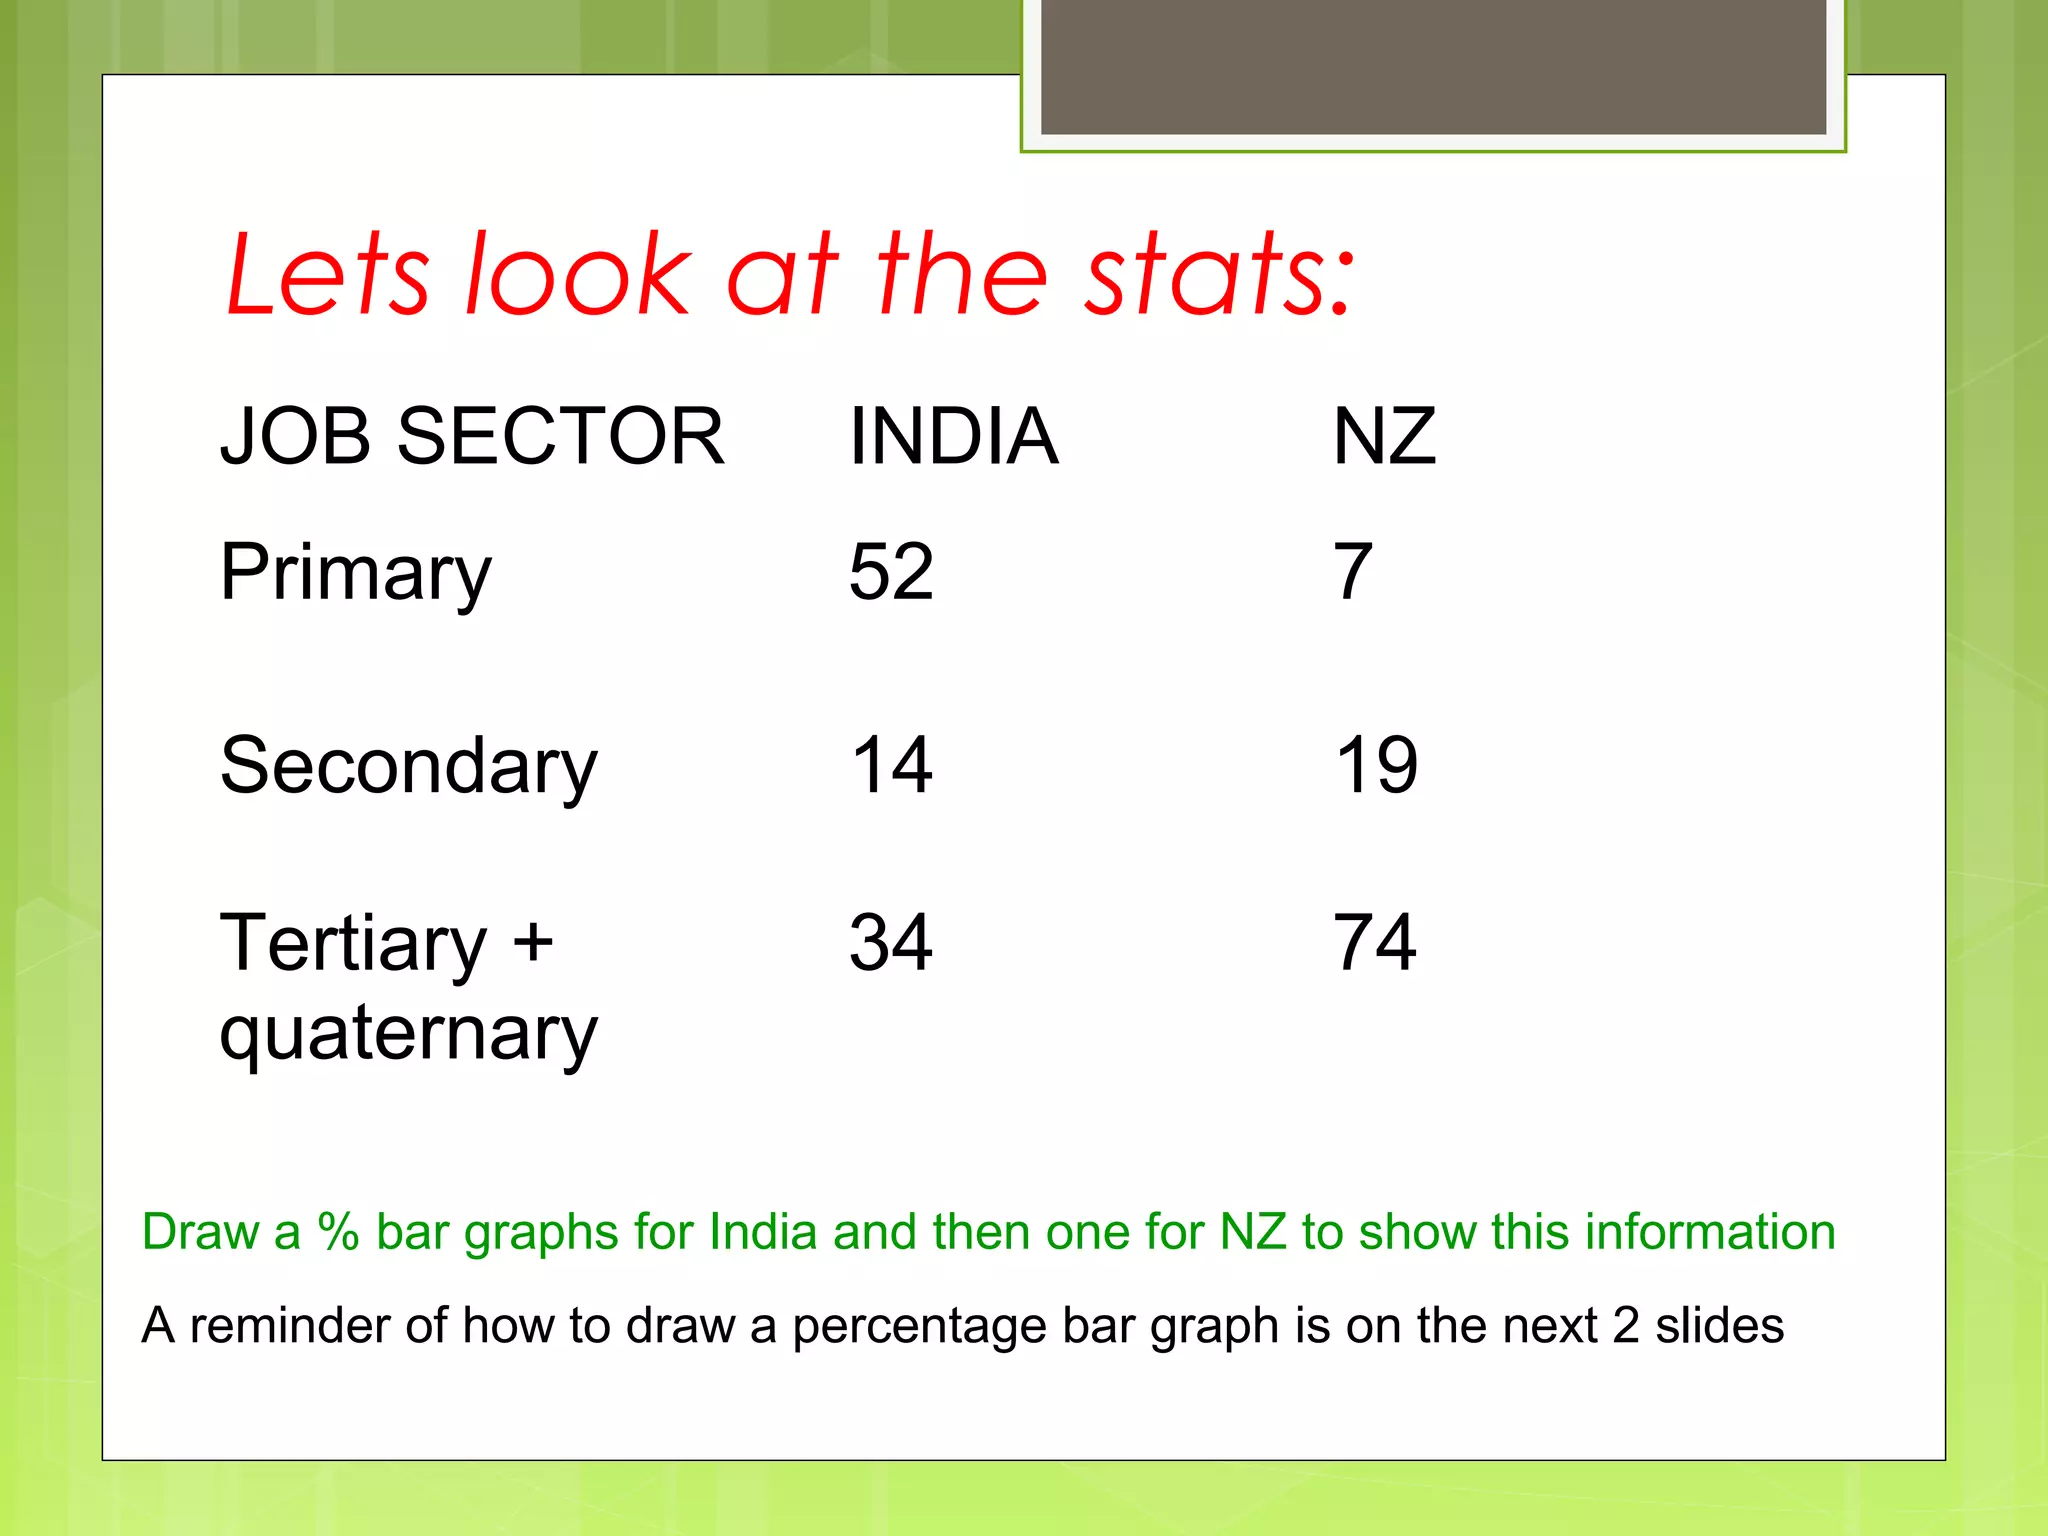
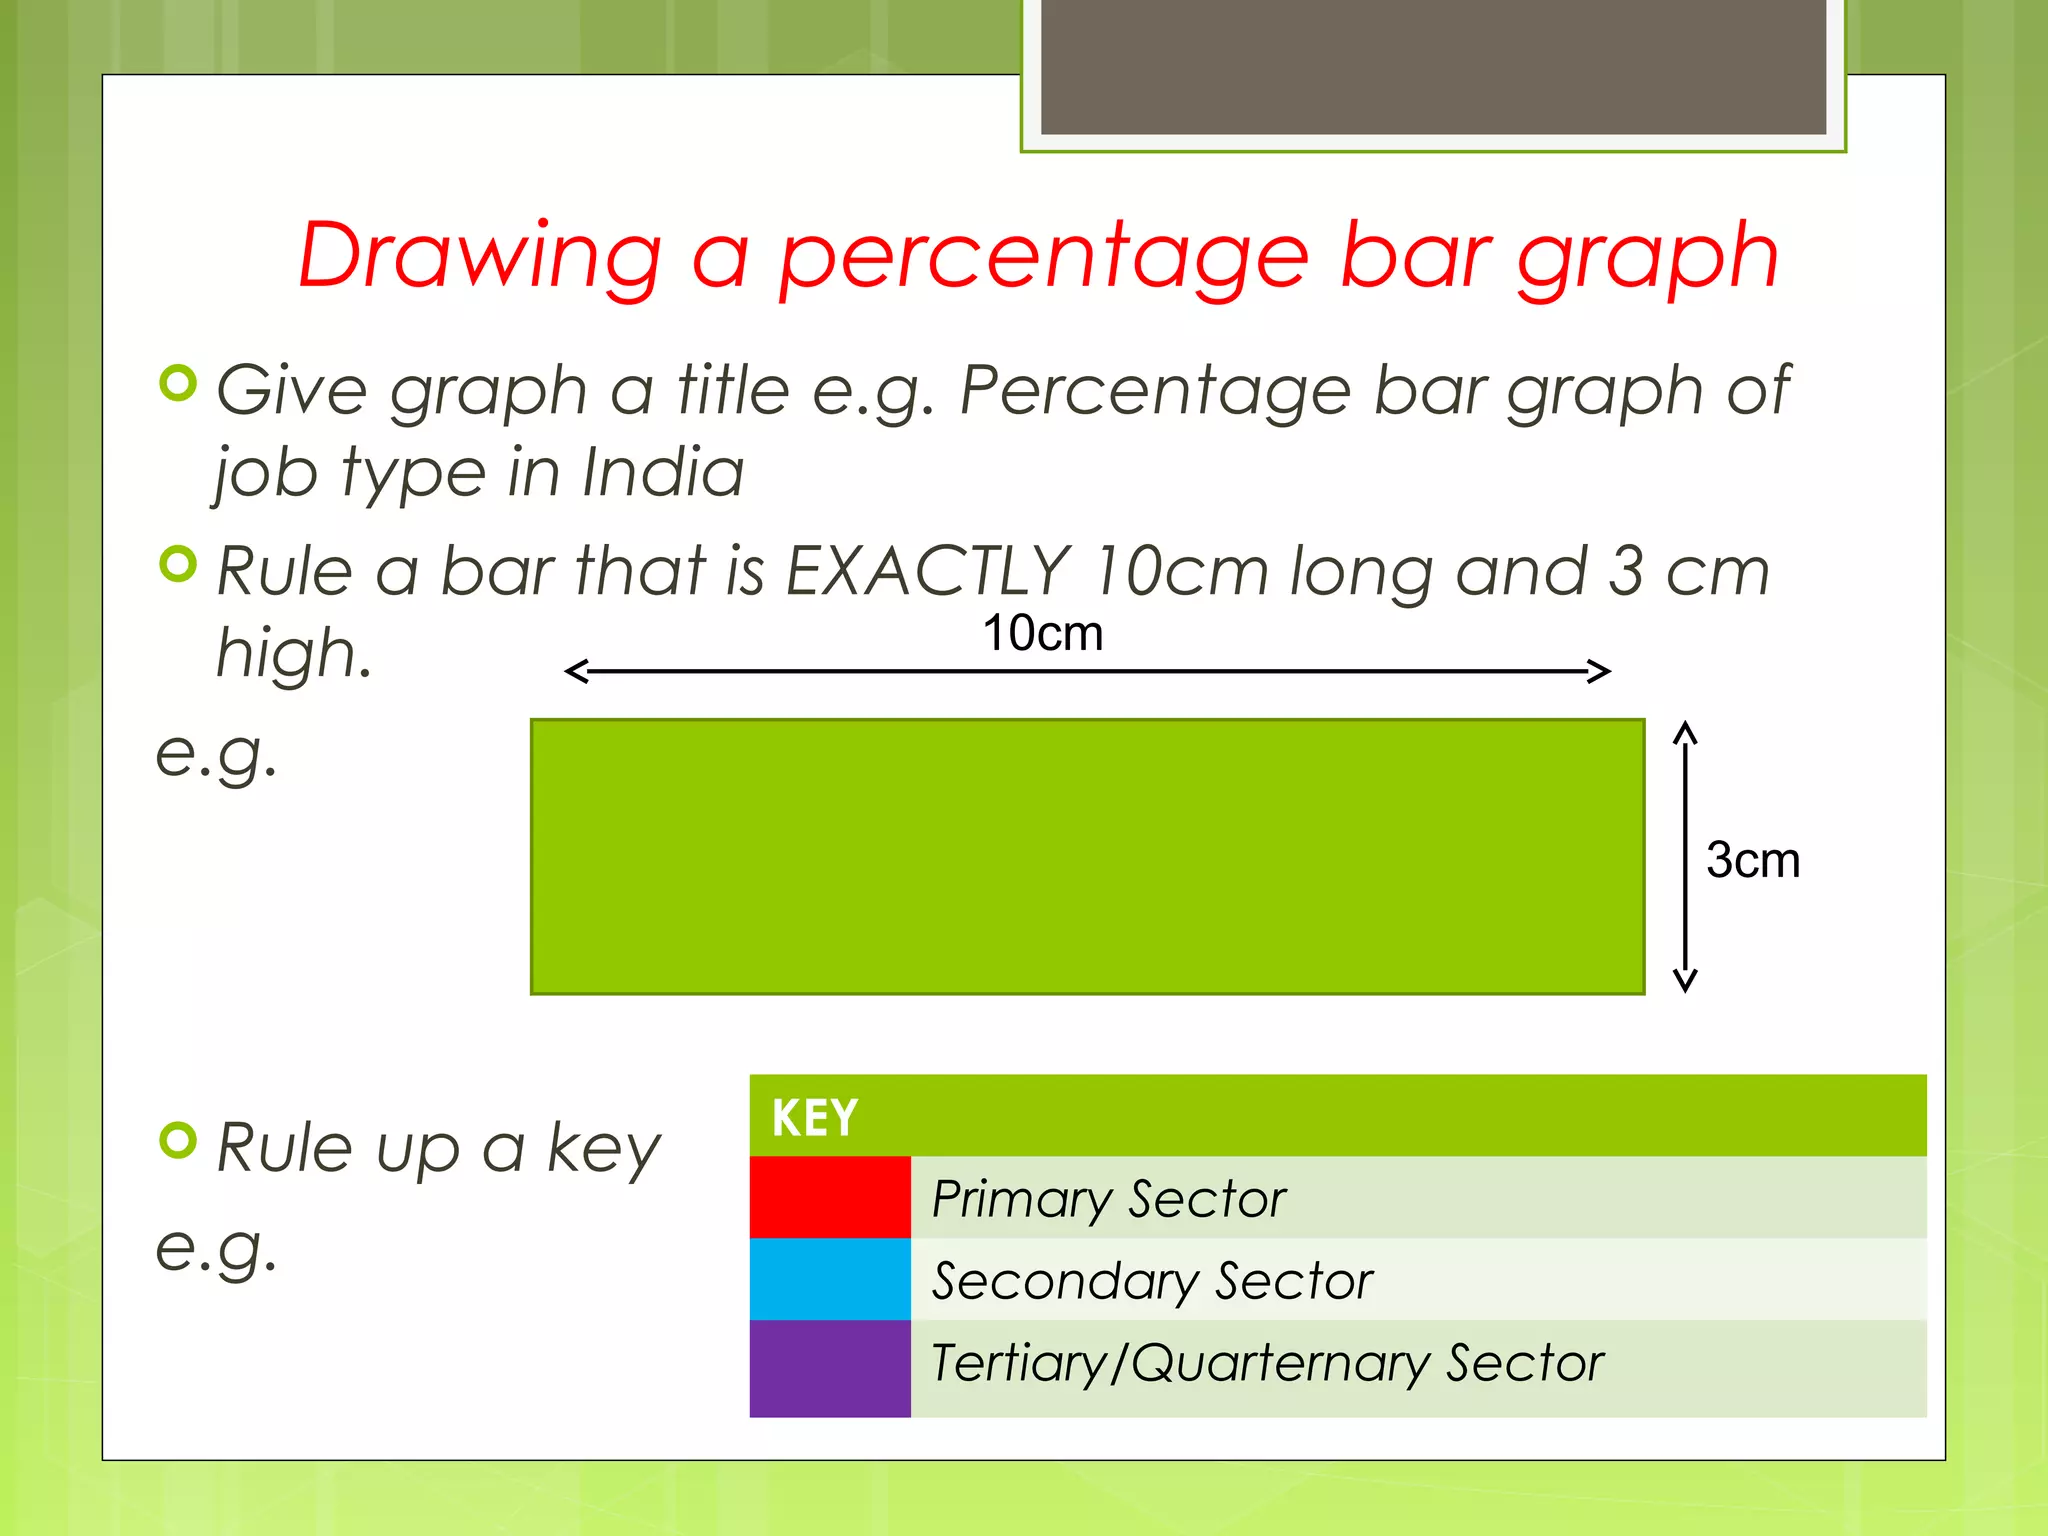
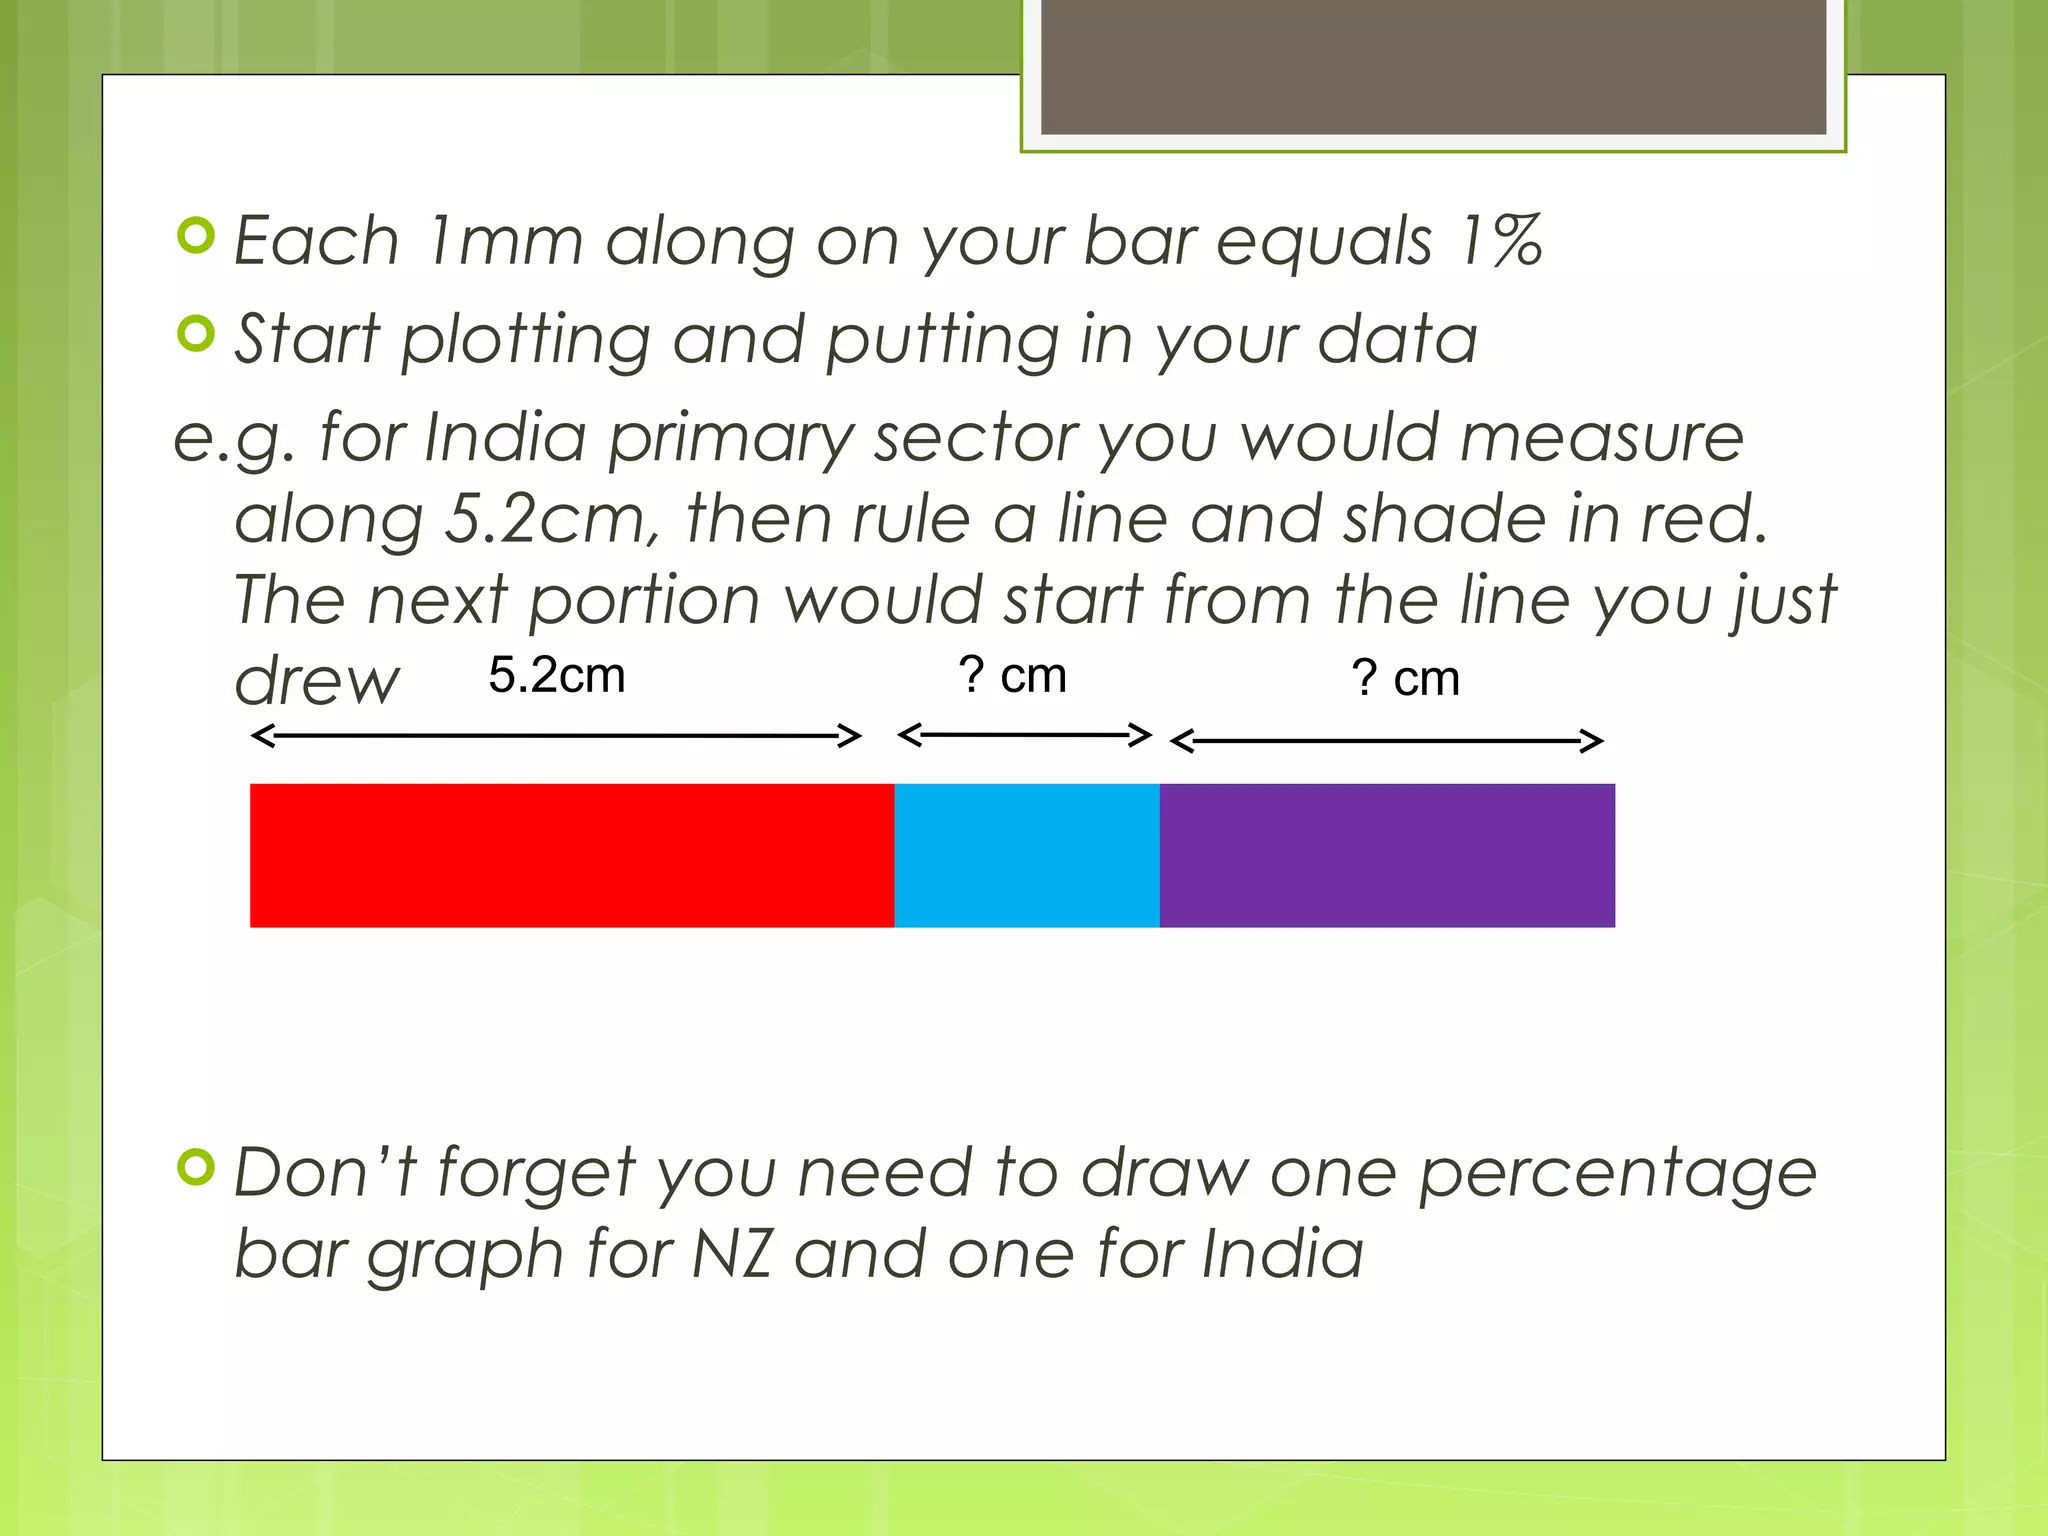
Statistical comparison of job sectors in India and NZ; includes instructions for creating percentage bar graphs.