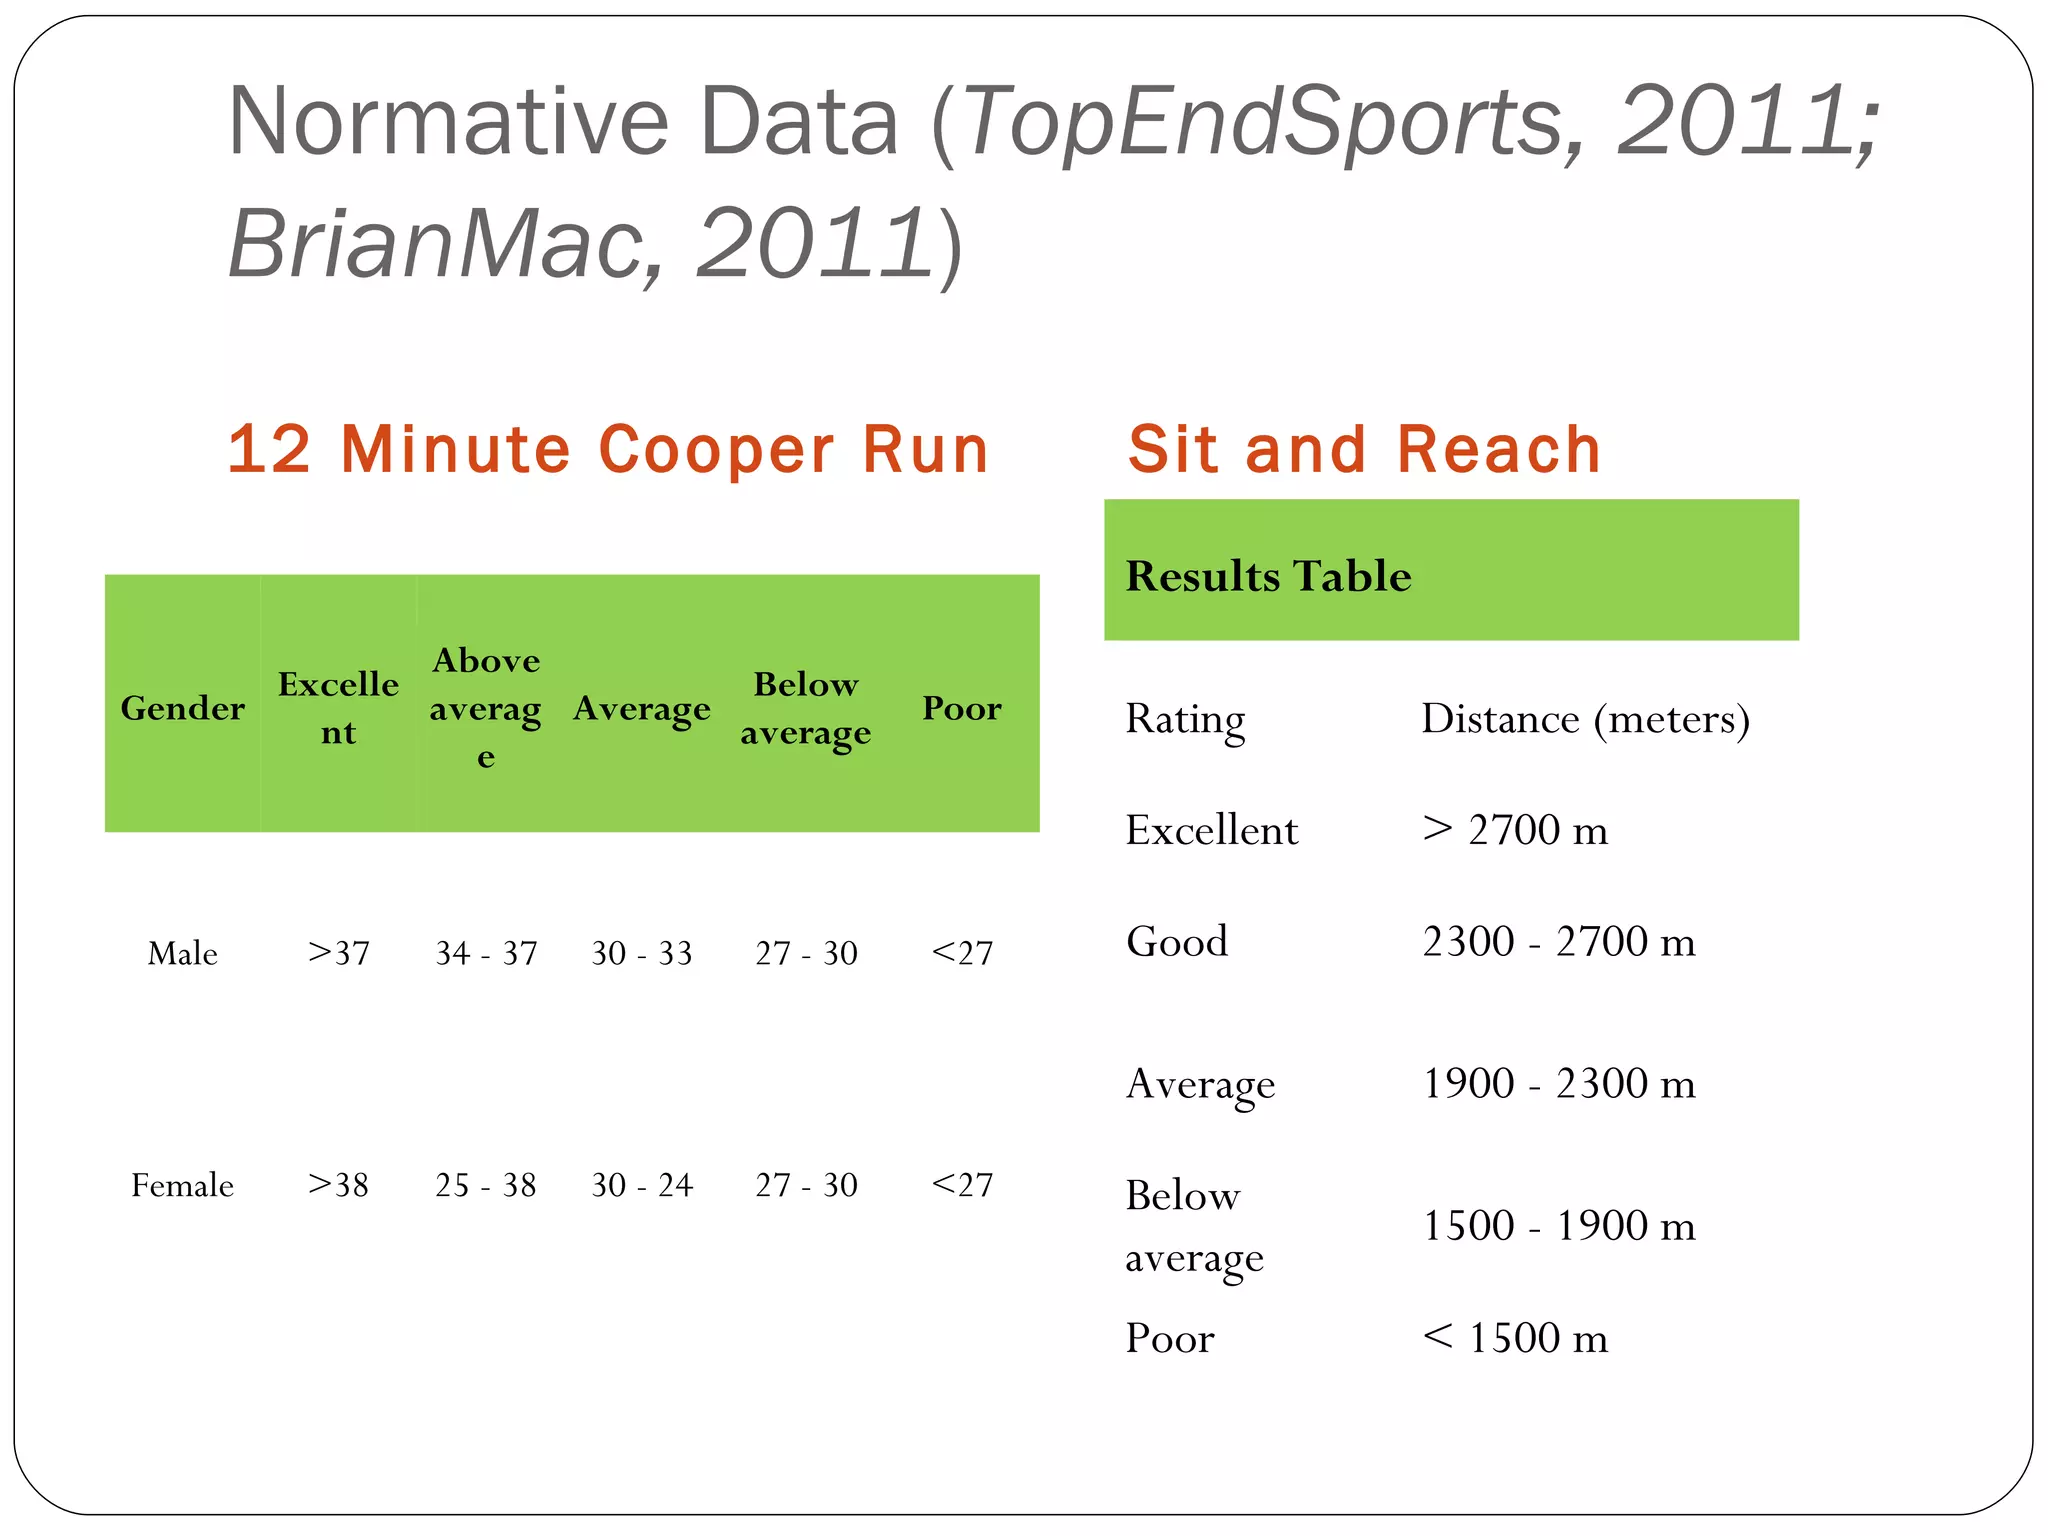
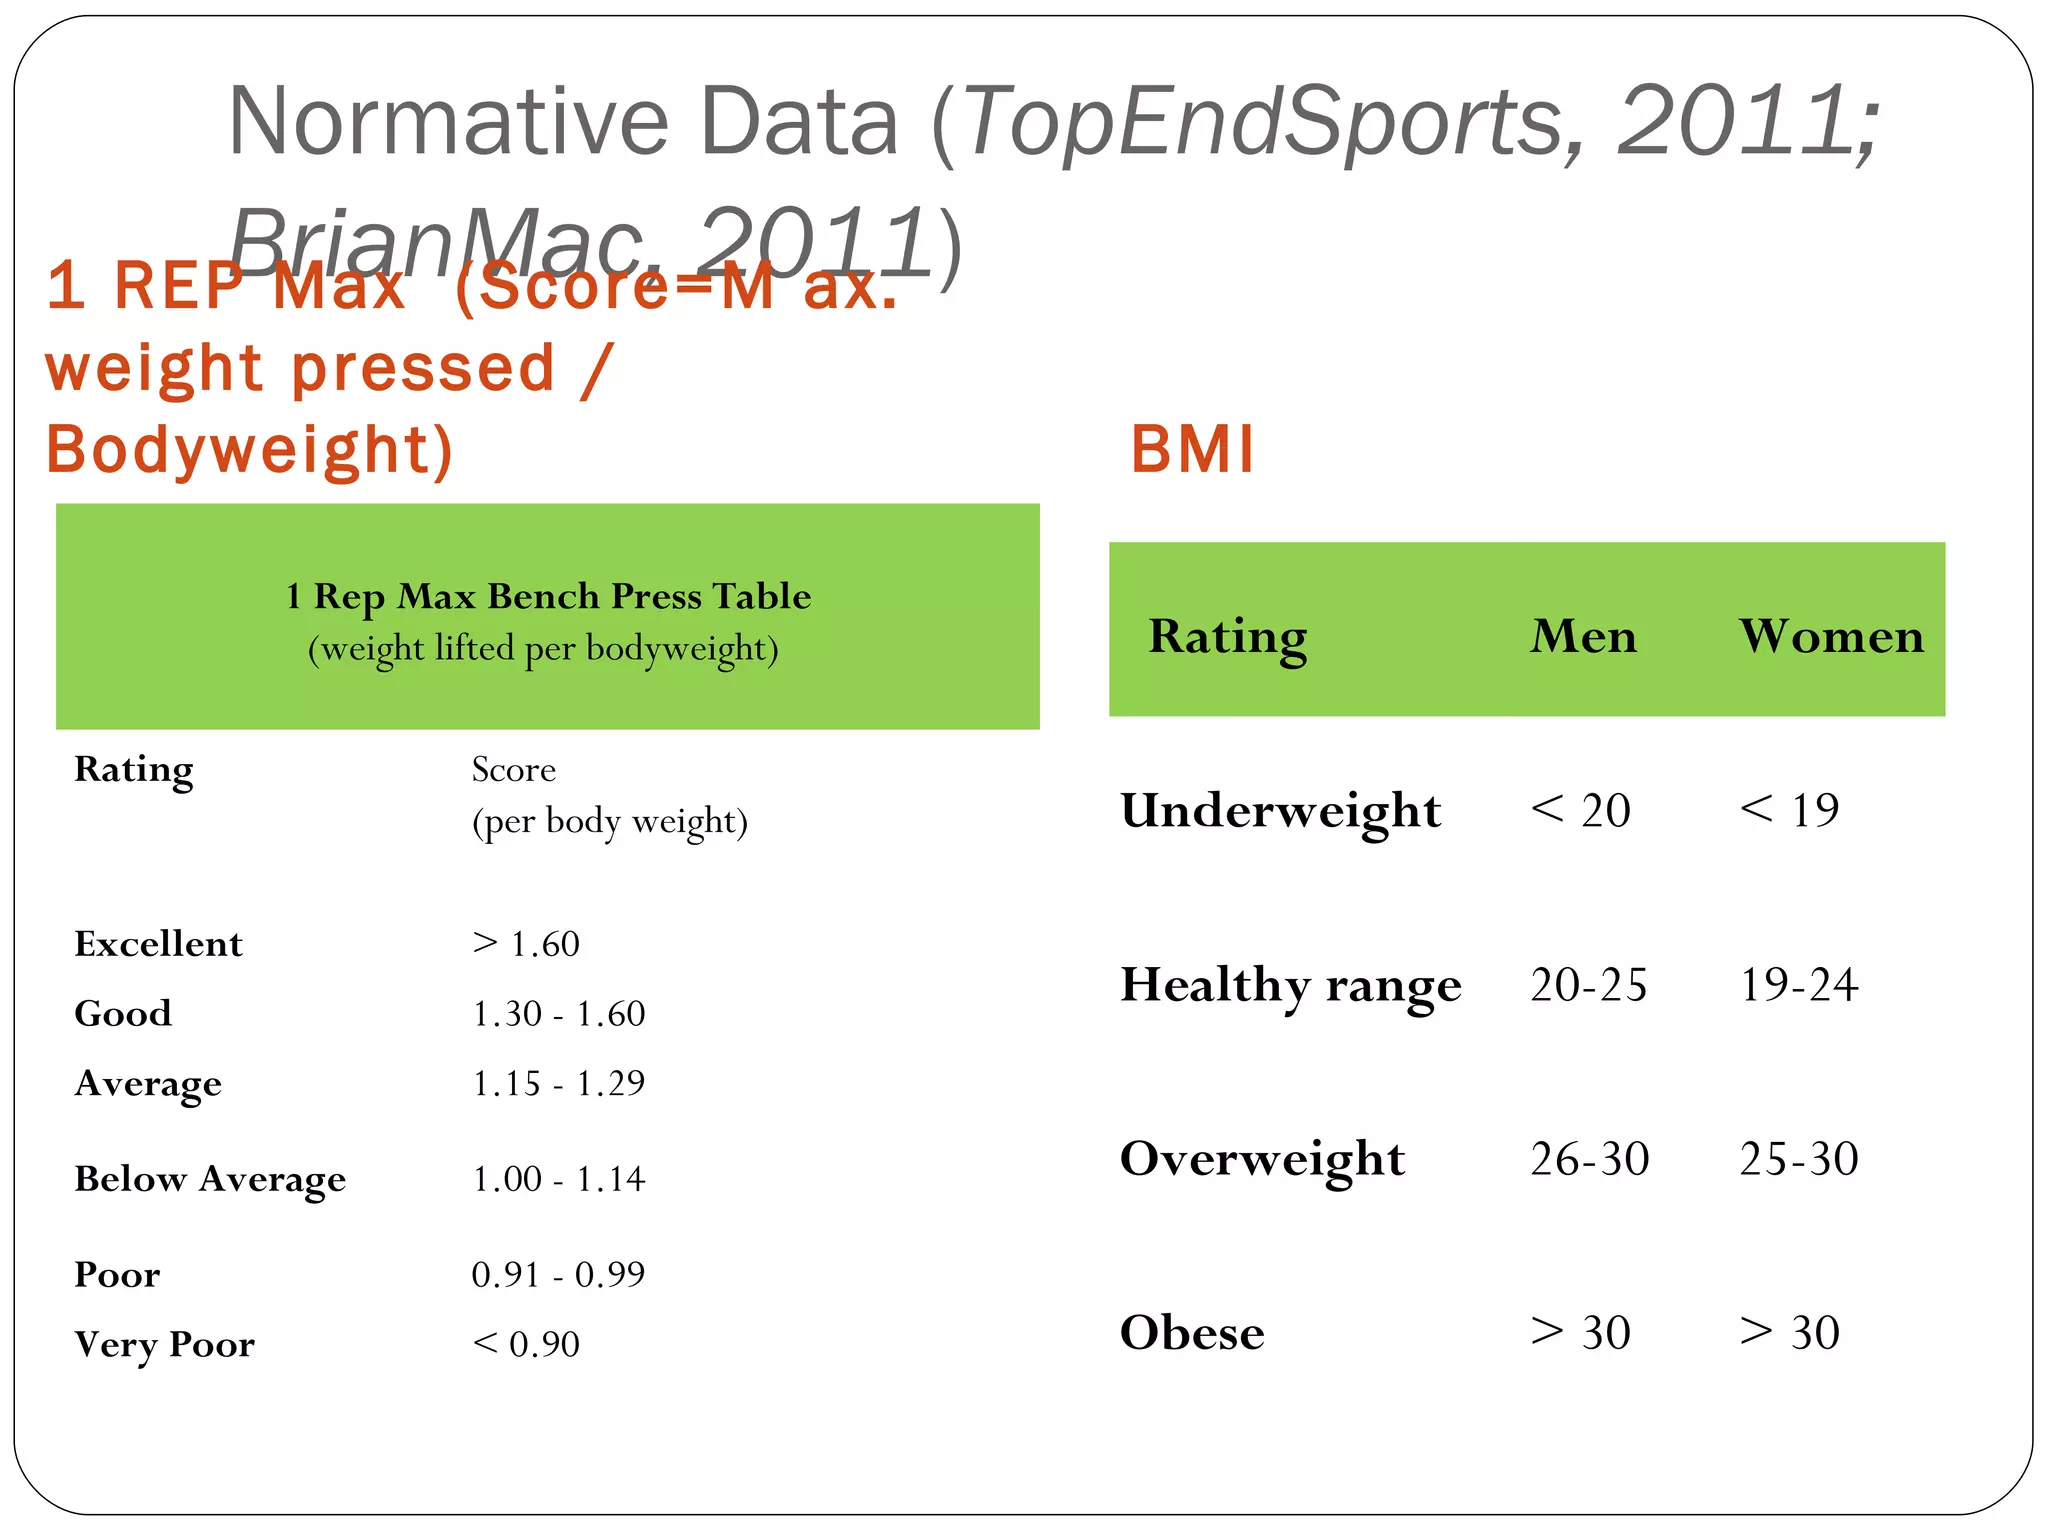
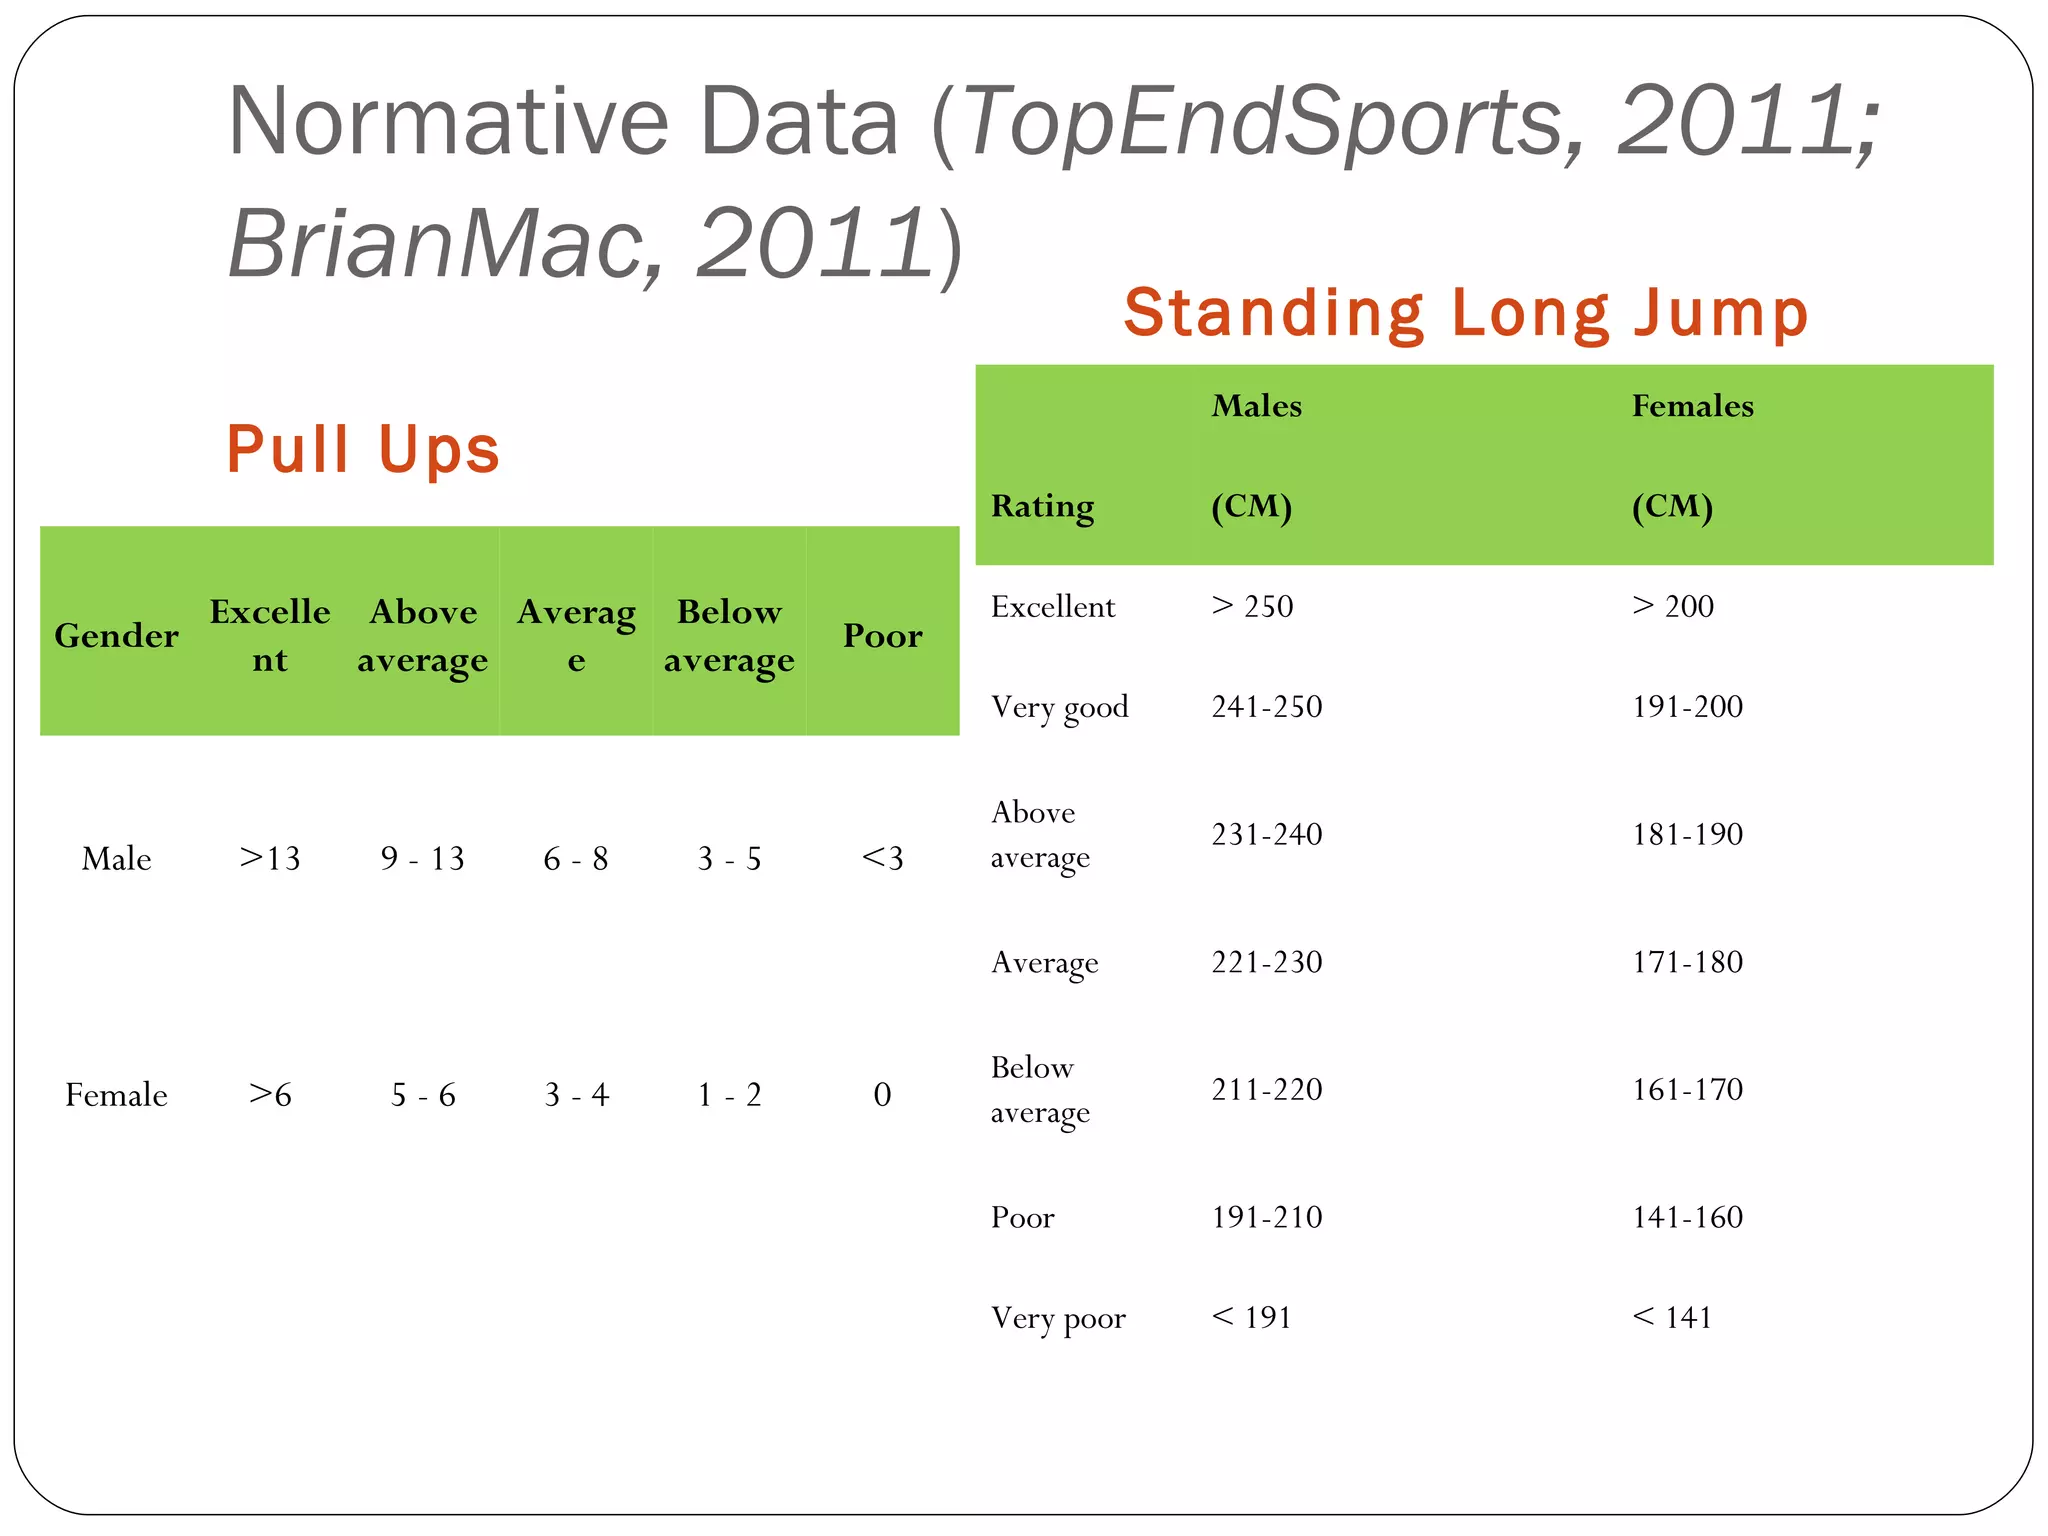
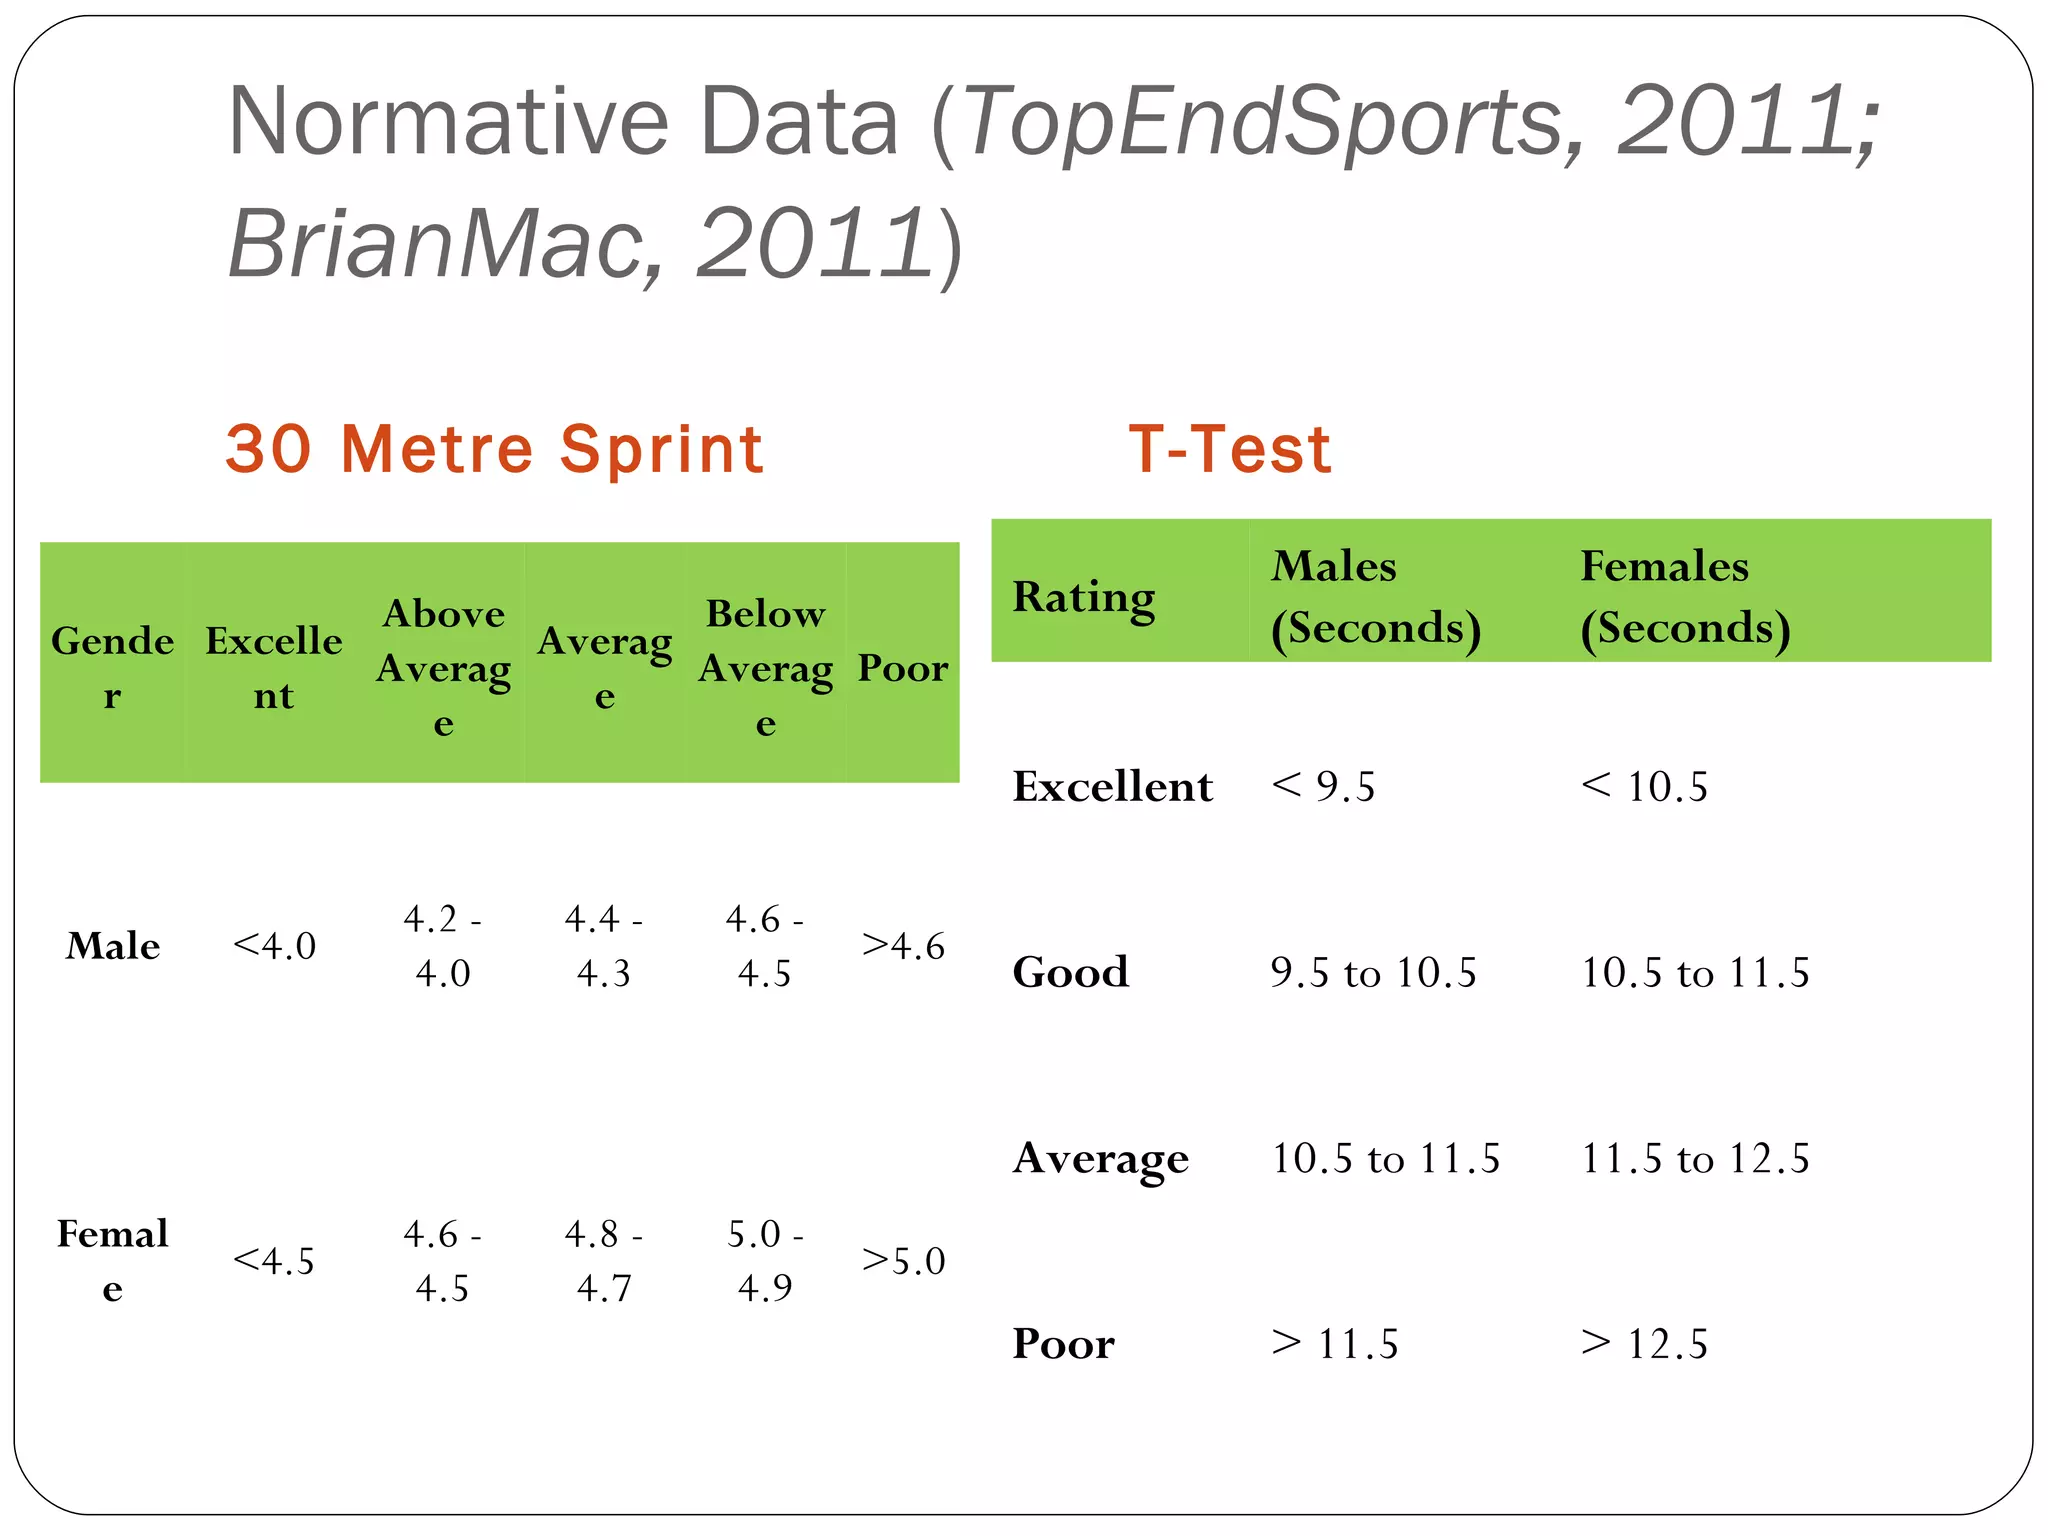
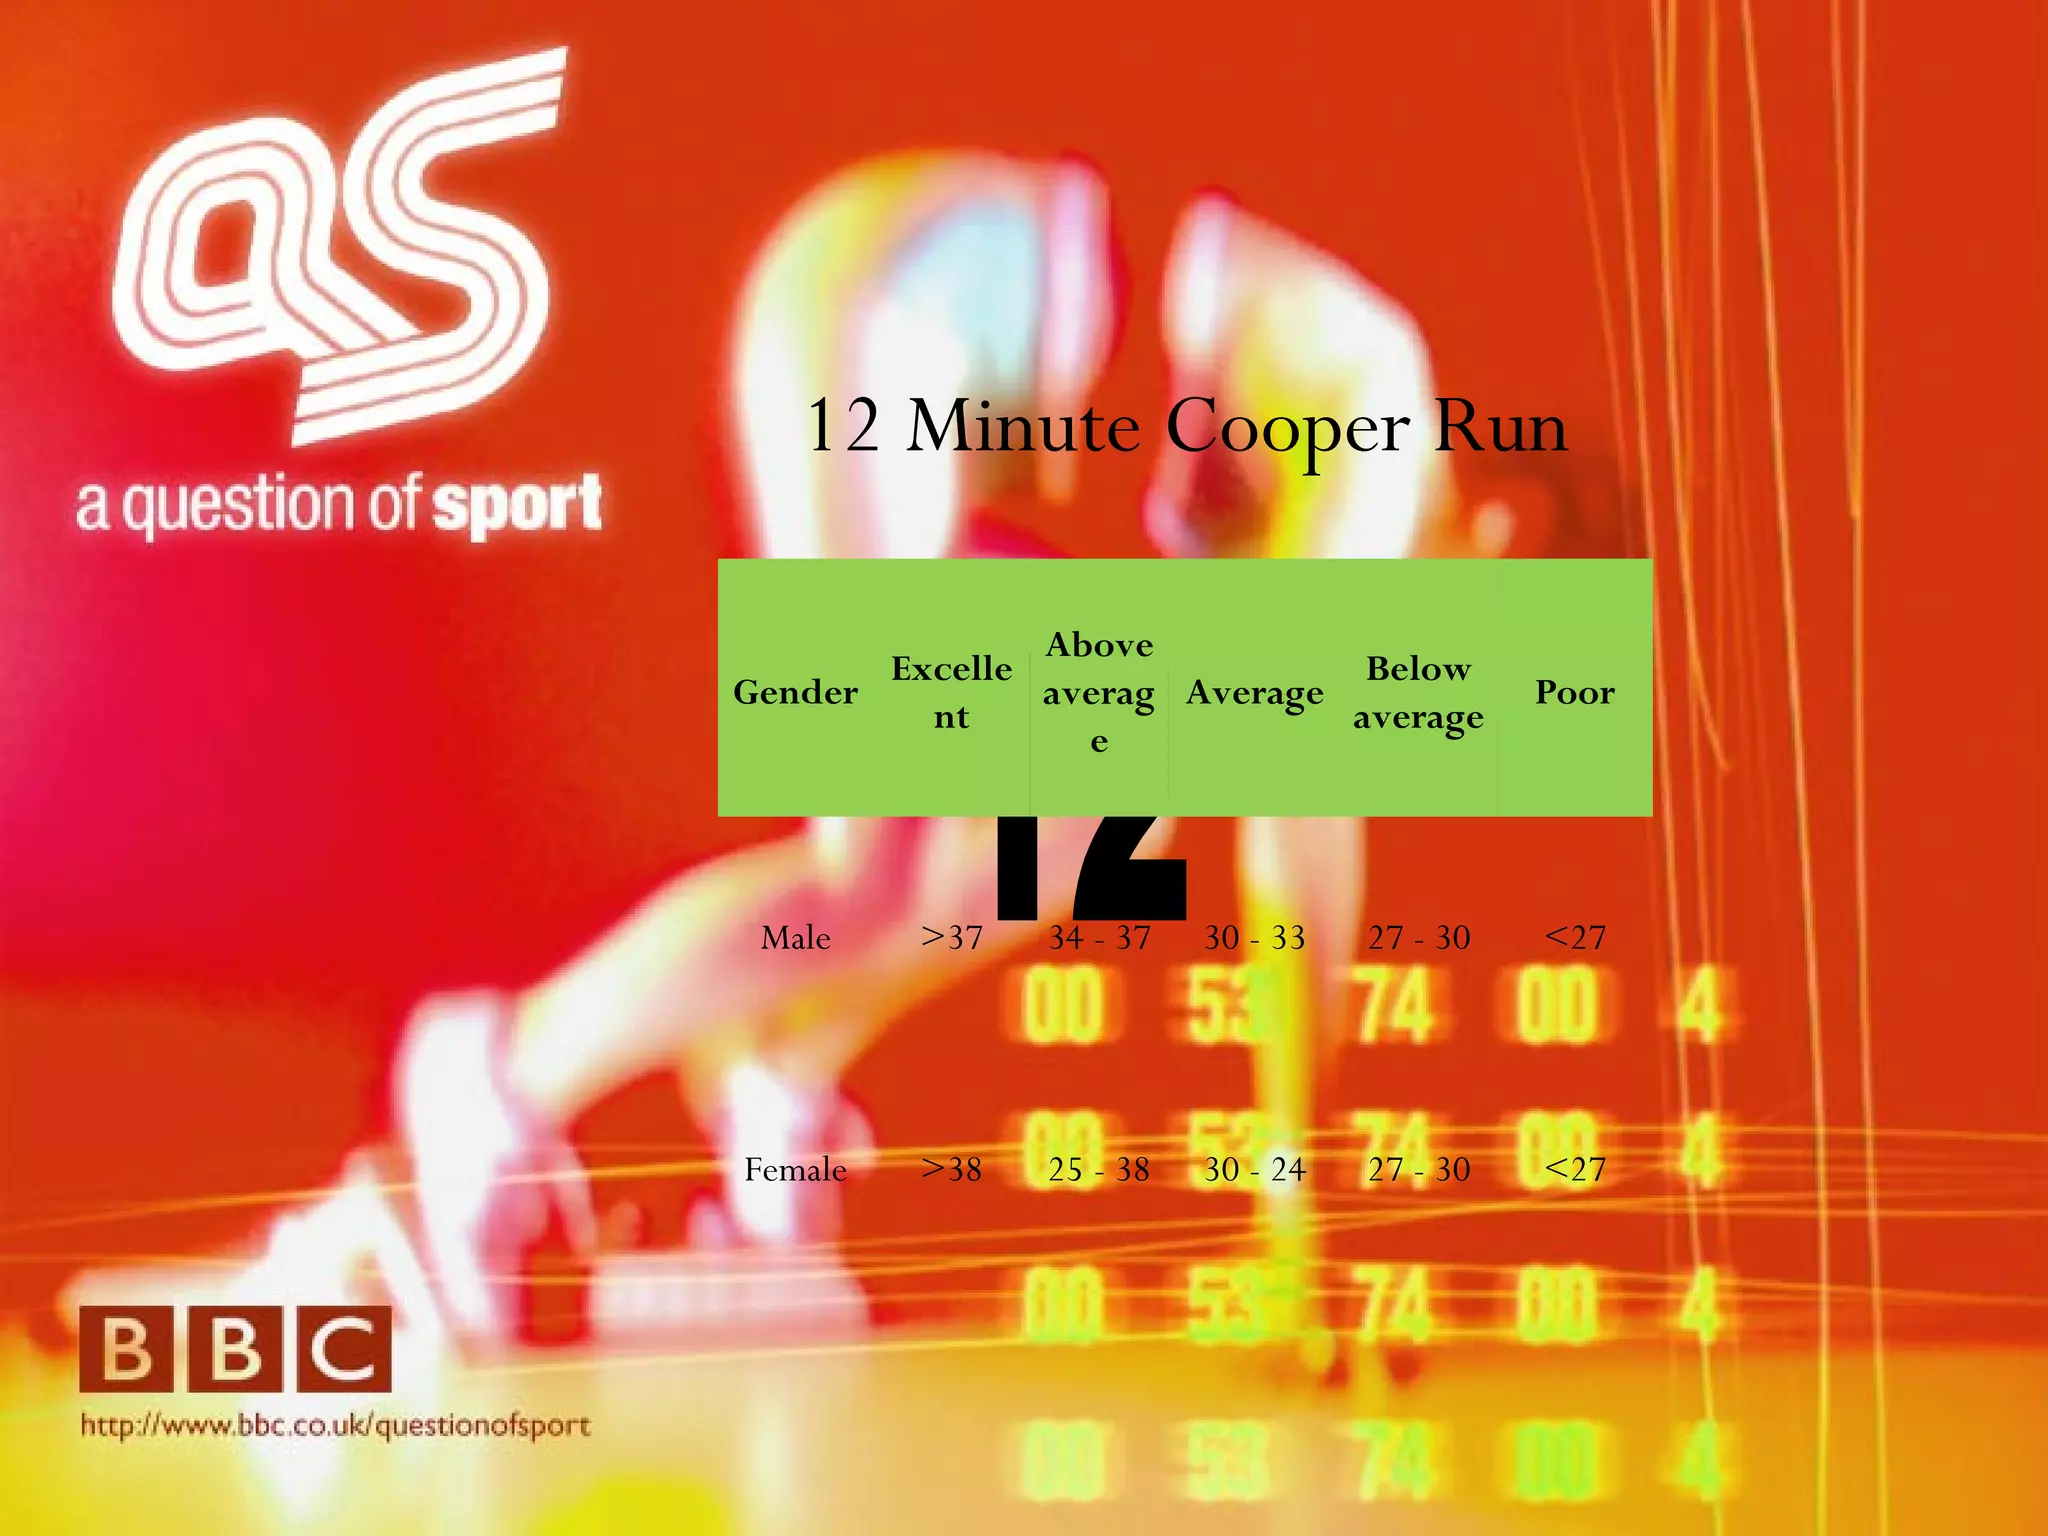
Evaluating Results Lloyd Dean Fitness Testing and Training
Aims Interpret test results and results and personal level of fitness (P5) Explain test results and personal level of fitness, identifying strengths and areas for improvement (M2) Evaluate test results and personal level of fitness, considering the level required to achieve excellence in a selected sport (D1) (Task 2)
Critical Thinking What do we mean by Normative Data? For each fitness test explain the positives and negatives of the procedure related to  YOU
How To Go From Zero to Hero?!
Normative Data ( TopEndSports, 2011; BrianMac, 2011 ) 12 Minute Cooper Run Sit and Reach Gender Excellent Above average Average Below average Poor Male >37 34 - 37 30 - 33 27 - 30 <27 Female >38 25 - 38 30 - 24 27 - 30 <27 Results Table Rating Distance (meters)  Excellent > 2700 m  Good 2300 - 2700 m  Average 1900 - 2300 m  Below average  1500 - 1900 m  Poor < 1500 m
Normative Data ( TopEndSports, 2011; BrianMac, 2011 ) 1 REP Max  (Score=M ax. weight pressed / Bodyweight) BMI 1 Rep Max Bench Press Table (weight lifted per bodyweight)  Rating Score  (per body weight)  Excellent > 1.60  Good 1.30 - 1.60  Average 1.15 - 1.29  Below Average  1.00 - 1.14  Poor 0.91 - 0.99  Very Poor  < 0.90    Rating Men Women Underweight  < 20  < 19  Healthy range  20-25  19-24  Overweight  26-30  25-30  Obese  > 30  > 30
Normative Data ( TopEndSports, 2011; BrianMac, 2011 ) Pull Ups Standing Long Jump Gender Excellent Above average Average Below average Poor Male >13 9 - 13 6 - 8 3 - 5 <3 Female >6 5 - 6 3 - 4 1 - 2 0   Males  Females  Rating  (CM)  (CM)  Excellent  > 250  > 200  Very good  241-250  191-200  Above average  231-240  181-190  Average  221-230  171-180  Below average  211-220  161-170  Poor  191-210  141-160  Very poor  < 191  < 141
Normative Data ( TopEndSports, 2011; BrianMac, 2011 ) 30 Metre Sprint  T-Test Gender Excellent Above Average Average Below Average Poor Male <4.0 4.2 - 4.0 4.4 - 4.3 4.6 - 4.5 >4.6 Female <4.5 4.6 - 4.5 4.8 - 4.7 5.0 - 4.9 >5.0 Rating Males (Seconds)  Females (Seconds)  Excellent < 9.5 < 10.5 Good  9.5 to 10.5 10.5 to 11.5 Average 10.5 to 11.5 11.5 to 12.5 Poor > 11.5  > 12.5
A Question of Sport
Picture Round
1 Point for basic answer 2 Point’s for explaining your answer 3 Point’s for evaluating answer
1 2 3 4 5 6 9 10 11 12 7 8
1
1 2 3 4 5 6 9 10 11 12 7 8
2
1 2 3 4 5 6 9 10 11 12 7 8
3 Gender Excellent Above average Average Below average Poor Male >37 34 - 37 30 - 33 27 - 30 <27 Female >38 25 - 38 30 - 24 27 - 30 <27
1 2 3 4 5 6 9 10 11 12 7 8
4
1 2 3 4 5 6 9 10 11 12 7 8
5
1 2 3 4 5 6 9 10 11 12 7 8
6
1 2 3 4 5 6 9 10 11 12 7 8
7
1 2 3 4 5 6 9 10 11 12 7 8
8
1 2 3 4 5 6 9 10 11 12 7 8
9
1 2 3 4 5 6 9 10 11 12 7 8
10
1 2 3 4 5 6 9 10 11 12 7 8
11
1 2 3 4 5 6 9 10 11 12 7 8
12 12 Minute Cooper Run Gender Excellent Above average Average Below average Poor Male >37 34 - 37 30 - 33 27 - 30 <27 Female >38 25 - 38 30 - 24 27 - 30 <27
1 2 3 4 5 6 9 10 11 12 7 8

Normative data and evaluation

  • 1.
    Evaluating Results LloydDean Fitness Testing and Training
  • 2.
    Aims Interpret testresults and results and personal level of fitness (P5) Explain test results and personal level of fitness, identifying strengths and areas for improvement (M2) Evaluate test results and personal level of fitness, considering the level required to achieve excellence in a selected sport (D1) (Task 2)
  • 3.
    Critical Thinking Whatdo we mean by Normative Data? For each fitness test explain the positives and negatives of the procedure related to YOU
  • 4.
    How To GoFrom Zero to Hero?!
  • 5.
    Normative Data (TopEndSports, 2011; BrianMac, 2011 ) 12 Minute Cooper Run Sit and Reach Gender Excellent Above average Average Below average Poor Male >37 34 - 37 30 - 33 27 - 30 <27 Female >38 25 - 38 30 - 24 27 - 30 <27 Results Table Rating Distance (meters) Excellent > 2700 m Good 2300 - 2700 m Average 1900 - 2300 m Below average 1500 - 1900 m Poor < 1500 m
  • 6.
    Normative Data (TopEndSports, 2011; BrianMac, 2011 ) 1 REP Max (Score=M ax. weight pressed / Bodyweight) BMI 1 Rep Max Bench Press Table (weight lifted per bodyweight) Rating Score (per body weight) Excellent > 1.60 Good 1.30 - 1.60 Average 1.15 - 1.29 Below Average 1.00 - 1.14 Poor 0.91 - 0.99 Very Poor < 0.90   Rating Men Women Underweight < 20 < 19 Healthy range 20-25 19-24 Overweight 26-30 25-30 Obese > 30 > 30
  • 7.
    Normative Data (TopEndSports, 2011; BrianMac, 2011 ) Pull Ups Standing Long Jump Gender Excellent Above average Average Below average Poor Male >13 9 - 13 6 - 8 3 - 5 <3 Female >6 5 - 6 3 - 4 1 - 2 0   Males Females Rating (CM) (CM) Excellent > 250 > 200 Very good 241-250 191-200 Above average 231-240 181-190 Average 221-230 171-180 Below average 211-220 161-170 Poor 191-210 141-160 Very poor < 191 < 141
  • 8.
    Normative Data (TopEndSports, 2011; BrianMac, 2011 ) 30 Metre Sprint T-Test Gender Excellent Above Average Average Below Average Poor Male <4.0 4.2 - 4.0 4.4 - 4.3 4.6 - 4.5 >4.6 Female <4.5 4.6 - 4.5 4.8 - 4.7 5.0 - 4.9 >5.0 Rating Males (Seconds) Females (Seconds) Excellent < 9.5 < 10.5 Good 9.5 to 10.5 10.5 to 11.5 Average 10.5 to 11.5 11.5 to 12.5 Poor > 11.5 > 12.5
  • 9.
  • 10.
  • 11.
    1 Point forbasic answer 2 Point’s for explaining your answer 3 Point’s for evaluating answer
  • 12.
    1 2 34 5 6 9 10 11 12 7 8
  • 13.
  • 14.
    1 2 34 5 6 9 10 11 12 7 8
  • 15.
  • 16.
    1 2 34 5 6 9 10 11 12 7 8
  • 17.
    3 Gender ExcellentAbove average Average Below average Poor Male >37 34 - 37 30 - 33 27 - 30 <27 Female >38 25 - 38 30 - 24 27 - 30 <27
  • 18.
    1 2 34 5 6 9 10 11 12 7 8
  • 19.
  • 20.
    1 2 34 5 6 9 10 11 12 7 8
  • 21.
  • 22.
    1 2 34 5 6 9 10 11 12 7 8
  • 23.
  • 24.
    1 2 34 5 6 9 10 11 12 7 8
  • 25.
  • 26.
    1 2 34 5 6 9 10 11 12 7 8
  • 27.
  • 28.
    1 2 34 5 6 9 10 11 12 7 8
  • 29.
  • 30.
    1 2 34 5 6 9 10 11 12 7 8
  • 31.
  • 32.
    1 2 34 5 6 9 10 11 12 7 8
  • 33.
  • 34.
    1 2 34 5 6 9 10 11 12 7 8
  • 35.
    12 12 MinuteCooper Run Gender Excellent Above average Average Below average Poor Male >37 34 - 37 30 - 33 27 - 30 <27 Female >38 25 - 38 30 - 24 27 - 30 <27
  • 36.
    1 2 34 5 6 9 10 11 12 7 8