1. Chapter 1
The Clinical Biochemistry Laboratory the use and the
requirements of laboratory
Objective of the session
To make the students aware of the basic setup of laboratory, the
1.
procedure for sample collection, separation to the analysis.
Introduction :
Clinical Biochemistry tests comprise over one third of all hospital laboratory
investigation. clinical biochemistry is that branch of laboratory medicine in
which chemical and biochemical methods are applied to the study of disease
while in theory this embraces all non-morphological studies, in practice it is
usually, though not exclusively, confined to studies on blood and urine
because of the relative ease in obtaining such specimens although analysis
are made on other body fluids such as gastric aspirate and cerebrospinal
fluid.
The use of Biochemical tests :Biochemical investigations are involved, to varying degrees, in every branch
of clinical medicine.
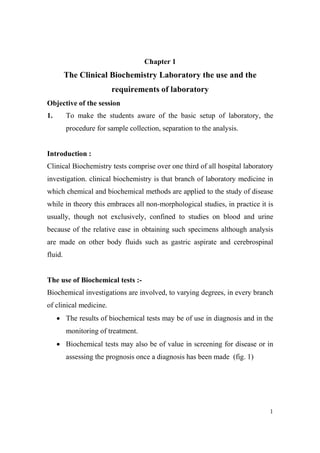
• The results of biochemical tests may be of use in diagnosis and in the
monitoring of treatment.
• Biochemical tests may also be of value in screening for disease or in
assessing the prognosis once a diagnosis has been made (fig. 1)
1
2. • The biochemistry laboratory is often involved in research into the
biochemical basis of disease and in clinical trials of new drugs.
Treatment
Diagnosis
Biochemistry
Report
Sugar –110mg/dl
Urea – 62mg/dl
Creatinine-1.8mg/dl
Screening
Prognosis
Fig. 1 How Biochemical Tests are used
The use of the laboratory :Every biochemistry analysis should attempts to answer a question which the
clinician has posed about the patient obtaining the correct answer can often
seem to be fraught with difficulty.
Basic steps for drawing a blood specimen
1.
Preparation for blood collection.
(A)
The information given on the blood request form should be
recorded on the specimen labels essential items include the
following.
a.
Patients complete name and age.
b.
Identification number.
2
3. (B)
The specimen containers should be labeled appropriated
before the specimen collection.
2.
Ascertaining whether the patient to fast such care is needed to
ensure accurate results.
3.
The technician must gain the patients confidence and assure him
that, although the venipuncture will be slightly painful, it will be
short duration.
4.
Positioning the patient
(a)
The patient should be made to sit comfortably in a chair
and should position his arm straight from the shoulder
and it should not bent at the elbow.
(b)
If the patient wants to lie down, let the patient to lie
comfortably on the back, the patient should extent the
arm straight from the shoulder.
Requirement of Blood Collection
1.
Collection tubes.
2.
Sterilized syringes and needles.
3.
Sprit or 70% ethanol.
4.
Cotton.
Blood collection :•
Compare the requisition form and labeling the tubes.
•
Selecting Vein site.
•
Applying the tourniquet.
•
Cleaning the area.
3
4. •
Inspecting the needles and syringes.
•
Performing the venipuncture.
Separation of serum :1.
Allow the blood to clot.
2.
Loosen the clot slowly and centrifuge the supernatant fluid.
3.
By using a pipette, separate the serum from blood cells and store it in
a clean & day test tube.
Sampling errors
There are a number of potential errors which may contribute to the success
or failure of the laboratory to provide the correct answers to the clinician's
question. Some of these problems arise when a clinician first obtains
specimens from the patient.
• Blood sampling technique. Difficulty in obtaining a blood specimen
may lead to haemolysis with consequent release of potassium and
other red cells constituents. results for these will be falsely elevated.
• Prolonged stasis during venepuncture. Plasma water diffuses into the
interstitial space and the serum or plasma sample obtained will be
concentrated. Proteins and protein-bound components of plasma such
as calcium or thyroxine will be falsely elevated.
• Insufficient specimen. Each biochemical analysis requires a certain
volume of specimen to enable the test to be carried out it may prove to
the impossible for the laboratory to measure everything requested on a
small volume specimen.
4
5. • Errors in timing. The biggest source of error in the measurement of
any analyte in a 24-hour urine specimen is in the collection of an
accurately timed volume of urine.
• Incorrect specimen container. For may analyses the blood must be
collected into a container with anticoagulant and preservative. For
example, samples for glucose should be collected into a special
container containing fluoride which inhibites glycolysis; otherwise the
time taken to deliver the sample to the laboratory can affect the result.
If a sample is collected into the wrong container, it should never be
decanted into another type of tube. for example, blood which has
been exposed even briefly to EDTA (an anticoagulant used in sample
containers for lipids) will have a markedly reduced calcium
concentration, approaching zero.
• Inappropriate sampling site. Blood samples should not be taken
'down-stream' from an intravenous drip. It is not unheard of for the
laboratory to receive a blood glucose request on a specimen taken
from an intravenous drip. It is not unheard of for the laboratory to
receive a blood glucose request on a specimen taken from the same
arm into which 5% glucose is being infused. Usually the results are
biochemically incredible but it is just possible that they may be acted
upon, with disastrous consequences for the patient.
• Incorrect specimen storage. A blood sample stored overnight before
being sent to the laboratory will show falsely.
5
6. Biochemical Answer
An
Clinical Question
Request form with
clinical data
Reporting
Interpretation
Patient sampled
Collation
Transit to lab
Quality control
Reception and
ID
Analysis
Fig. 2 Circuit diagram of clinical biochemistry process.
Analysing the specimen
Once the form and specimen arrive at the laboratory reception, they are
matched with a unique identifying number or bar code. The average lab
receives many thousands of requests and samples each day and it is
important that all are clearly identified and never mixed up.
proceed through the laboratory as shown in figure 2.
Samples
All analytical
procedures are quality controlled and the laboratory strives for reliability.
Once the results are available they are collated and a report is issued.
Cumulative reports allow the clinician to see at a glance how the most recent
result (s) compare with those tests performed previously, providing an aid to
the monitoring of treatment.
6
7. Methodology of its teaching :- lecture with few C.D. demonstration.
Evaluation of the session :- Asking queries regarding the lecture.
7
8. Chapter 2
The Interpretation Of Results
Objective of the session :1.
To teach the interpretation of results.
The laboratory report
It can take considerable effort, and expense, to produce what may seen to be
just numbers on pieces of paper, understanding what these numbers mean is
of crucial importance if the correct diagnosis is to be made, or if the patients
treatment is to be changed. Usually results of tests carried out in clinical
chemistry are reported in units of concentration or of activity.
CO CE TRATIO
Units of concentration contain both units of quantity and units of volume.
The amount of substance present can be expressed in grams, equivalents, or
moles or divisions of these ie. milligrams, milliequivalents millimoles etc.
similarly the volume can be expressed in liters milliliters or deciliters
(100 ml).
For many substances the usual units of concentration has been in mg per 100
ml. This form had replaced the earlier less defined form of mg% which
should no longer be used as the use of % to mean per 100 ml here differs
from the general use of (%) to more recently deciliter has been proposed as a
term for 100 ml. Just as a milliliter is one thousand of a liter so a 100 ml. is
one tenth of a liter (a deci-litre) so units have changed from mg % to mg/100
ml to mg (dl) without any numerical change.
8
9. Serum electrolytes are usually expressed in mill equivalent per liter and
protein and albumin in grams per 100 ml.
"S. I. " UNITS
For many purpose e.g., calculation of osmolarity or electrolyte balance it
would be convenient to have all results expressed in the same units, this
would also help avoid confusion when results are compared from one
laboratory to another or in the evaluation of results by medical staff are used
to different units, for these reasons standard international units for reporting
results have been recommended. As with many changes there has been
resistance to the change over to the new units especially among the medical
profession. But as the newer text books and reviews use these units. they are
gaining international acceptance.
The S.I. (Standard International) units apply to clinical chemistry as follows.
1.
Where the molecular weight of the substance being measured in
known, the units of quantity should be the mole_submultiple of a
mole. e.g., milimoles and Micromoles.
2.
The units of volume should be the liter. Units of concentration. will
there fore be millimoles per liter etc.
e.g., sodium of .140 m eg/l in S.I. units is 140 m mol/l.
glucose of 180 mg/100 ml in S.I. units is 10 m mol/l
3.
When the molecular weight is not known, the for example for serum
protein or albumin determinations the concentration should be
expressed in grams per liter i.e. 7.0 g/100 ml becomes 70 g/l.
9
10. Units of activity
Usually activities are measured in clinical chemistry as an index of the
concentration of certain enzymes, or enzymatic processes e.g. prothrombin
activity.
Activity is a measure of the rate at which a process takes place. Enzymatic
activity is usually estimated by measuring the rate at which a substrate is
converted to a product.
This activity is affected by many things e.g.
temperature, time over which the activity is measured, incubation conditions
etc. All of these must be defined when reporting the activity and so units or
activity include fixed values for each variant. As the combination of the
variations as large so many different such units are in use. International
standardization of all these variables is almost impossible and as such the
international unit of enzyme activity has not been widely accepted the units
for each such test in the laboratory should be clear to all concerned.
Reporting results
There is a certain error in all results. Usually laboratory will claim 95 %
confidence in its result i.e. plus or minus two standard deviation. Thus a
blood sugar report of 100 mg/100 ml with a standard deviation of 1 mg per
100 ml would really be 100 + 2 mg/100 ml. For simplicity the variation is
not usually reported with the individual result. The standard deviation for
the method should be indicated and the result given with the understanding
that the variation is understood.
10
11. Significant figures
From mathematical calculations results may be obtained to many decimal
places but these will not usually be significant. The final result cannot be
accurate to a greater degree than the sum of the errors through the test allow
e.g. error in pipetting sample. or standard error in reading spectrophotometer
etc. When reporting a result then each figure given should have a meaning.
A blood sugar is not a significant part of the result would not usually be
reported as 100.2 mg/100 ml. As 0.2 mg is not a significant part of the result
for most blood sugar methods. Thus result should be rounded off to the
nearest significant figure. before reporting. What is or is not significant must
be established for each test.
Use of zeros after a decimal point can give misleading information if they
are not significant.
e.g.
7.0 g means between 6.95 and 7.05 g.
7 g means between 6.5 and 7.5 g.
Methodology of its teaching :- lecture with few C.D. demonstration.
Evaluation of the session :- Asking queries regarding the lecture.
11
12. Chapter 3
Quality Control
Objective of the session : To teach the external and internal quality control
programme
Introduction :Variation in results
Biochemical measurements vary for two reasons.
There is analytical
variation and also biological variation.
Laboratory analytical performance
A number of terms describe biochemical results. these include:
• precision and accuracy
• Sensitivity and specificity
Concentration is always dependent on two factors: the amount of solute and
the amount of solvent. The concentration of the sugar solution in the beaker
can be increased from 1 spoon/beaker (a) to 2 spoons beaker by either
decreasing the volume of solvent (b) or increasing the amount of solute (c).
• quality assurance
• reference ranges.
Precision and Accuracy
Precision is the reproducibility of an analytical method. Accuracy defines
how close the measured value is to the actual value. A good analogy is that
of the shooting target figure 3 shows the scatter of results which might be
12
13. obtained by someone with little skill, compared with that of someone with
good precision where the results are closely grouped together. Even when
the results are all close, they may not hit the centre of the target. Accuracy is
therefore poor, as if the 'sights' are off.
It is the objective in very
biochemical method to have good precision and accuracy.
Imprecise
Precise but
inaccurate
Precise and
accurate
Fig. 3 Precision and accuracy
Sensitivity and specificity
Sensitivity of an assay in a measure of how little of the analyte the method
can detect, As new methods are developed they may offer improved
detection limits which may help in the discrimination between normal
results and those in patients with the suspected disease. Specificity of a
assay related to how good the assay is at discriminating between the
requested analyte and potentially interfering substances.
Quality assurance
Every laboratory takes great pains to ensure that the methods in use continue
to produce reliable results. laboratory staff monitor performance or assay
using quality control samples to give reassurance that the method is
13
14. performing satisfactorily with the patients' specimens. These are internal
quality controls which are analysed every day or every time an assay is run.
The expected values are known and the actual results obtained are compared
with previous values to monitor performance. In external quality assurance
schemes, identical samples are distributed to laboratories; results are then
compared.
in this way, the laboratory's own internal standards are themselves assessed.
Reference ranges
Analytical variation is generally less than that from biological variables.
Biochemical test results are usually compared to a reference range
considered to represent the normal healthy state (fig. 3) Most reference
range are chosen arbitrarily to include 95% of the values found in healthy
volunteers, and hence, by definition, 5% of the population will have a result
out with the reference range.
In practice there are no rigid limits
demarcating the diseased population from the healthy; however, the further a
result is from the limits of the range, the more likely it is to represent
pathology. In some situations it is useful to define 'action limits', where
appropriate intervention should be made in response to a biochemical result.
There is often a degree of overlap between the disease state and the
'normal value' (fig. 4) A patient with an abnormal result who is found not to
have the disease is a false positive. A patient who has the disease but has a
'normal' result is a false negative.
14
15. Biological factors affecting the interpretation of results
The discrimination between normal and abnormal results is affected by
various physiological factors which must be considered when interpreting
any given result. These include:
• Sex of the patient. Reference ranges for some analytes such as serum
creatinine are different for men and women.
• Age of the patient. There may be different reference range for
neonates, children, adults and the elderly.
• Effect of diet. The sample may be inappropriate if taken when the
patient is fasting or after a meal.
• Time when sample was taken. There may be variations during the day
and night.
• Stress and anxiety. They may affect the analyte of interest.
• Posture of the patient. Redistribution of fluid may affect the result.
• Effects of exercise. Strenuous exercise can release enzymes from
tissues.
• Medical history. Infection and/or tissue injury can affect biochemical
values independently of the disease process being investigated.
• Pregnancy. The alters some reference ranges.
• Menstrual cycle. Hormone measurements will vary through the
menstrual cycle.
• Drug history. Drugs may have specific effects on the plasma
concentration of some analytes.
15
16. Others factors
When the numbers has been printed on the report from, they still have to be
interpreted in the light of a host of variable. Analytical and biological
variations have already been considered. Other factors relate to the patient.
The clinician can refer to the patient or to the clinical notes, whereas the
biochemist has only the information on the request from to consult. The
cumulation of biochemistry results is often helpful in patient management.
Technical contents :- kits of calibrators, kits of normal and elevated quality
control samples.
Methodology of its teaching :- lecture with few C.D. demonstration.
Evaluation of the session :- Asking queries regarding the lecture.
16
17. Chapter o. 4
Photometery
Objective:- To give the brief idea about the principles applied in several
kinds of analytical measurements.
Introduction of the topic:Photometery is the most common analytical technique used in clinical
biochemistry. The principle of photometery is base on the physical laws of
radiant energy or light. In this method, the intensity absorbed transmitted or
reflected, light is measured and related to the concentration of the test
substance.
Photometeric principles are applied in several kinds of analytical
measurements.
1.
Measurement of absorbed or transmitted light:
Colorimetery, spectrophotometery, atomic absorption, turbidometery.
2.
Measurement of emitted light, Flame emission photometery :
Flourometery.
Colorimetry:
Many methods for quantitative analysis of blood, urine and other
biological materials are based upon the production of a coloured compounds
in solution, the intensity of which is used as a measure of concentration.
Laws of Absorption of Light:
There are two common methods of expressing the amount of light
absorbed by a solution.
1.
By % transmittance.
17
18. 2.
By optical Density (O.D) Absorbancy (A) or Extinction (E) of the
solution.
OPTICAL DENSITY-LOG T.%=Log 100/1
Lambert Beer's Law:
The Lambert Beer law governing these relationships states that light
absorption is proportional to the number of molecules of absorbing material
through which light passes.
Absorbance, therefore changes with the
thickness of the solution and with the concentration of absorbent in a manner
characteristic for each absorbing material of a given wavelength.
IE
The mathematical expression at a given wavelength is -------- C-Kct
Io
WhereIE =
Intensity of emergent light.
Io =
Intensity of incident light.
K =
A constant.
C =
Concentration of coloured substance.
t
Thickness of the layer of solution.
=
e =
Base of natural logrithim (2.718)
IE/IO is knows as transmittance.
By assuming that the cell which is used to measure absorbance, is of
constant thickness, it is possible to simplify the mathematical expression for
this law in logarithmic form.
The mathematical expression at a given
wavelength is absorbance / Opticaldensity / Extinetion [E]=Lo (I/T) = Log
100%T so that E=2-Log%. T.
Beer Lambert's law is applied for
18
19. a)
Only monochromatic Light
b)
There should be no changes in ionization, dissociation
association or solvation of the solution with concentration.
When A (absorbance) is plotted against C (concentration) straight line
passing through the origin should be obtained because absorbance is directly
proportional to concentration.
With the aid of a standard curve the
concentration of an unknown solution can then be readily determined.
Parts of photo colorimeter
A) Light Sources :- This usually on tungsten lamp (420-760m) for U.V.
range Hydrogen lamp is used.
B) Monochromator/Filters :- Complimentry filters should be used in
order to increase the sensitivity of photometeric instrument.
Table :
Colour of solution
Filter used
Peak transmission range (nm)
Bluesh Green
Red
580
-
680
Blue
Yellow
520
-
580
Purple
Green
490
-
520
Red
Blue-green
470
-
490
Yellow
Blue
430
-
470
Yellowish-green
Violet
400
-
430
In the spectrophotometers grits are used.
These provide narrow
spectrum of light. Grits have practically replaced by prism as they are
inexpensive.
C) Cuvettes :- Cuvette holds the solution whose absorbance is to be
measured. The cuvette must be optically-transparent, scrupulously
clean deoid of any scratch and free form contamination. the optical
19
20. path in the cuvette is always one cm. Glass cuvettes are used in
visible range colorimetery while quartz/silca cuvwettes are used in
U.V. range.
Glvanometer :- This is used for measuring the output of the photosensitive
element. In most of the instruments a sensitive galvanometer is used.
Prepration of solutions for measurement:
1.
Blank :- This used to set the pnotometer to zero absorbance (A) or
100% transmittance (%T).
2.
Standard :- These are solutions of known concentration which range
within limits found in the specimen (normal and test).
3.
An unknown solution.
Determination of absorpition maxima :
For conc/O.D. relation to be linear the wavelength chosen to measure
the coloured solution should be that, at which, light is maximally absorbed.
This is determined by using fixed concentration of coloured solution and
measuring it at different wave lengths. Plot the graph taking O.D. on Y axis
and wavelength on X axis & show results Graphically.
Verification of Beer-Lambert's Law :
To study Lambert Beer's law different concentration of dye,
Bromophenol blue are taken. The optical density (O.D.) of these samples
are measured in colorimeter. The corrected O.D. (after substracting the
blank) readings are plotted on Y axis against the concentration of the dye on
the X axis. It gives a liner graph. (i.e. straight line passing through origin)
up to certain concentration.
20
21. Reagents: Bromophenol.
Blue standard solution – 1.5mg%-
Procedure :Take 7 test tubes and number them B,S1,S2,S3,S4,S5, and TestTube No.
Vol of dye
( in ml )
0
Distilled water
( in ml )
5
2. S1
1
4
3. S2
2
3
4. S3
3
2
5. S4
4
1
6. S5
5
0
5ml (unknown)
0
1. Blank
7. Test
Now mix tubes & take O.D. using a suitable filter or wavelength as
determined by absorption maxima experiment. Plot a graph of O.D. against
concentration of dye. From the graph determine the amount of dye present
in unknown solution & express as mg% of the dye in solution.
Calculations :
If a suitable standard is prepared the extinctions of this and test are read,
then.
Concentration of unknown
Extinction of unknown
=
Concentration of standard
Extinction of standard
and therefore,
concentration of unknown =
Extinction of unknown
X conc. of standard
Concentration of standard
This can be expressed as :Reading of unknown
concentration of unknown =
X conc. of standard
Reading of standard
21
22. --------------SOURCE OF LIGHT
FILTER
CUVETTE
PHOTOCELL
GALVANOMETER
Fig.4 (diagrammatic) photoelectric colorimeter
Technical contents :- Photoelectric colorimeter
Methodology of its teaching :- lecture with few C.D. demonstration.
Evaluation of the session :- Asking queries regarding the lecture.
22
23. Chapter - 5
Automation
Objective :- Advances in diagnostic methodologies and instrumentation
have been impressive but most of these are deleted in the teaching
programme this chapter tries to cover the automation required for the
analysis of samples.
Introduction
During the past few year, in clinical biochemistry there has been a
considerable increase in clinical demand for laboratory investigations. When
the volume of work increased, there arose a need for work simplification.
Monostep methods are introduced to replace multistep cumbersome and
inaccurate methods like Folin-Wu's blood sugar determination. The
efficiency of monostep methods was further increased by the introduction of
automatic dispensers and diluters. For the common test like blood glucose,
blood urea etc., however, most large laboratories found this approach still
inadequate to deal with work load and instruments designed to handle the
whole analytical process in mechanized fashion have become common place
in last decade. This procedure is called automation. It is a self regulating
process, where the specimen is accurately pipetted by a mechanical probe
and mixed with a particular volume of the reagent and results are displayed
in digital forms and also printed by a printer. There is an element of feed
back which detects any tendency to malfunction. The function of
autoanalyser is to replace with automated devices the steps of pipetting,
preparation of protein free filtrated, heating the colour forming reagents in a
waterbath and increase the accuracy and precision of the methods.
23
24. The automated instruments not only save the labour and time but allow
reliable quality control, reduce subjective crrors and work economically by
using smaller quantities of samples and reagents. Following are the different
types of autoanalysers used in clinical chemistry laboratories.
Continuous flow analysers
The early form of automation was introduced by Technicon Instrument
Corporation. It was based on continuous flow analysis. In these systems, the
samples and reagents are passed sequentially through the same analytical
pathway and separated by means of air bubbles. The relative proportions of
sample and reagents were determinated by their individual flow rates.
Missing occurred when tubes joined to form a common pathway.
The disadvantage of these automated systems is that the physician may not
be interested in all the test reported by the instrument, and the may be
interested in some other tests which the instrument does not report.
discrete analysers
The various types of discrete autoanalysers used in the clinical chemistry
laboratories are
(A)
Batch analysers and (B) 'Stat' (means immediate reporting or
emergency determination analysers.
(A)
Batch analysers
These are convenient to analyse specimen in batches such as of sugar,
urea creatinine etc. state testing may not be conveniently carried out
on these analysers. The batch analysers can be further differentiated as
(1) semiautomated and (2) fully automated.
24
25. (1) Semi automated (batch) discrete analysers
In the case of these analysers the initial part of the procedure
i.e. pipetting of reagent and specimen, mixing and incubation is
carried out by the technician. Rest of the procedure i.e. setting of
incubation temperature (for kinetic determinations), zero setting,
photometric readings, result display, automatic printing and data
management and processing is carried out by the analyser.
Advantage of semiautoanalysers
1)
The semiautoanalysers are cheap and compact, compared to other
fully automated analyses.
2)
Specimen analysis is cheap, since volume of reagent used is 0.5 to
1.0ml.
3)
Enzyme determinations by kinetic methods are performed accurately
in 1 to 3 minutes.
4)
The enzymatic reagents are not corrosive and involve monostep
testing.
Fully automated batch analysers
These analysers carry out all the function of a semiautomated
analyzer, in addition to the pipetting of specimen and reagents and also the
mixing of the reaction mixtures. The basic working stages of these analysers,
after selecting general system parameters are as follows
1)
the specimen cups are placed on the sampler.
2)
The required quantity of reagent is dispensed by a reagent probe, in
the reaction cups.
25
26. 3)
The respective specimens from the sampler are pipetted into the
appropriate reaction cups by another sample probe.
4)
The reaction cups are shaken mechanically to mix the contents.
5)
After observing the required incubation time (for delay time in the
case of kinetic determinations) the reaction mixture is aspirated by a
probe for photometric readings.
6)
The resulted values are printed and displayed in appropriate units by
digital display.
(B)
Stat Analysers (Random access analysers)
In the case of these analysers many reagents (8 to 20 or more) can be
pipetted one after another, so that various biochemical determinations can be
performed on one specimen, according to the number of tests ordered for the
patient. Hence, these are patient (or specimen) orientated autoanalysers. For
examples, if serum specimen No. 1 requires following tests to be performed;
1) Urea nitrogen 2) Serum creatinine 3) Total proteins 4) Albumin 5) SGPT
and 6) SGOT
•
The analyzer is programmed for these tests with respective system
parameters.
•
The reagents for urea nitrogen, creatinine, total proteins, albumin,
SGPT and SGOT are pipetted automatically by a reagent probe in the
respective reaction cups.
•
The required specific serum quantities are added to the respective
reaction cups by a specimen probe.
•
The analyzer identifies various reagents and specimen.
•
The photometric determinations are carried out by the autoanalyser.
26
27. •
The values of the respective tests are displayed on the computer
screen as well as printed on a paper, after the specific test incubation
periods.
The advantages of a fully automatic 'stat' (or random access) analyzer are
as follows
1)
The advantages the various chemistry tests from the file.
2)
It performs a single test, a profile, an organ panel or a 'stat'
determination.
3)
It reduces the cost per test by utilization of micro-volumes of a
reagent.
4)
It performs automatic monitoring of specimen and reagent volumes.
5)
It can perform various methodologies such as End point, kinetic,
initial rate and bichromatic (readings at two different wavelengths) to
eliminate errors which may arise due to haemolytic, icteric or lipemic
sera.
6)
The analyser can perform repeatation of tests with or without
automatic dilution.
Technical contents :- semi autoanalyser and fullyautomatic analyser.
Methodology of its teaching :- lecture with few C.D. demonstration. Live
demonstration of the semi and fully automatic analyser.
Evaluation of the session :- Asking to demonstrate the basic functioning of
the above instruments.
27
28. Chapter o. 6
Estimation of Blood Glucose
Diabetes Mellitus: It is a chronic disease due to disorder of carbohydrate
metabolism, cause of which is either deficiency or diminished level of
insulin resulting in hyperglyeemia (increased blood glucose level) & glucose
(presence of glucose in urine). Secondary metabolic defect is also seen. Such
as metabolism of proteins & fats.
1. Primary or Idiopathic or Essential Diabetes
(a) Juvenile Diabetes or. Type I Diabetes or Insuline dependent
Diabetes Mewlitus (IDDM)
Less Frequent
Occures before the age of 15 years.
Due to less production of insulin from b cells of langerhans
(Pancrea)
(b) Maturity onset diabetes or. Type II diabetes or Non-insulin
dependent Diabetes melitus (NIDDM)
More frequent in population.
Occures at middle age.
Ketoacidosis is rare.
B cell is degenerated to some extent but response to glucose load is
seen.
2. Secondary
It is secondary to some other main disease
(a) Pancreatic Diabetes.
Pancreatitis
Hemochromatosis
Malignancy of Pancrease.
28
29. (b) Inereased level of antagonistic hormone
Hyperthyrodism
Hypercorticism – Cushings disease
Hyperpitnatarism
Clinical Biochemical fnding in diabetes
1) Presence of large amount of glucose in urine.
2) Large volume of urine & increased frequency of micturition (Polyuria)
3) Polyphagia i.e. eats more frequently.
4) Increased catabolisim of fat so there is increase in free fatty acid level in
blood & liver.
5) Increased acetyl coA is seen which further lead to increase formation of
cholesterol & hence at formation of atherosclerosis.
6) Increased ketone bodies in blood & its apperance in urine leads to
acidosis.
7) Increased catabolism of tissue protein for energy requirement lead to loss
of weight & increased level of amino acid in blood & more formation of
urea by deamination of amino acid.
Objective :- To estimate blood glucose.
Introduction :Estimation of glucose in blood was one of the first biochemical tests
to be applied clinically and now it has become a routine in clinical
biochemistry lab.
In blood quantitative estimation of glucose is done with either whole
blood, plasma or serum and several methods have been in use. Whole blood
29
30. values are 10-15% lower than plasma. Arterial blood values are higher than
venous values.
The term Blood Sugar is used synonymously with blood glucose but
certain other substance like glutation, glucuronic acid, threonine, uric acid,
ascorbic acid, fructose etc. give erroneously high values (5-20%) when any
reduction method is adopted.
a)
Fasting blood Sugar (FBS) : The blood sample is collected after the
patient fasts for 12 hours or overnight.
b)
Post-Prandial Blood Sugar (P P B S) : After the patient fasts for 12
hours, a meal is given which contains starch and sugar (approx. 100
gms). Blood is collected 2 hours after the ingestion of the meal.
c)
Random Sample : Blood is collected any time without prior
prepration of the patient.
Collection of Blood Sample : Blood is usually collected from a vein and
kept in a bottle containing sodium fluoride (Na F) and potassium oxalate
mixed at proportion of 1 : 3 Usually 4 mg. of the mixture is required. Both
the substances act as anticoagulant and Na F prevents glycolysis in RBC's by
inhibiting the enzyme 'enolase'.
Methods of Estimation :
1. Enzymatic : Measure only glucose in blood.
a)
Glucose Oxidase Method :
Glucose oxidase catalyses the oxidation of glucose to gluconic acid and
hydrogen peroxide. This H2 O2 is broken down to water and oxygen by a
peroxidase in the presence of an oxygen acceptor which itself is converted to
a coloured compound, the amount of which can be measured
colorimetrically. This method is used in various autoanalyzers.
30
31. Glucose
H2O2
Reaction : Glucose
Gluconolactone
Gluconic Acid+H2O2
Oxidase
O2
Perxidase
H2O2 + Chromogenic
Chromogen + H2O
O2 acceptor
(Measured)
Hexokinase
b) Hexokinase Method: In this glucose + ATP
G–6–P
G – 6 – P + NAD
glu-6-P+ADP
6 phosphogluconate + NADH + H +
The rate of formation of NADH is followed spectrophotometrically at
340 mn.
II. Reduction Methods
1) Alkaline Copper Reduction Methods.
• Asatoor & King's method
• Folin & Wu method
2) Ortho toludine method : O-Toludine reacts quantitatively with the
aldehyde group of glucose to from a ghcosylamine and schiff base.
The colour development is rapid and stable.
Estimation of Blood Glucose by method of asatoor and King (modified)
Principle : Reducing sugars in hot alkaline medium produce cnediols
which are strong reducing agents that convert Cu
++
ions Cu+ ions combine
with OH ion to form yellow CuOH which on heating gives red Cu2O, Cu2O
produced is proportional to the amount of reducing sugar Phosphemolybdic:
acid is added so that oxidation of Cu+ to Cu++ is coupled with reduction of
acid to molybdenum blue which can be estimated colorimetrically.
31
32. Modified method gives values close of true glucose. This is achieved by
diluting blood with isotonic CuSO4 Na2SO solution to prevent hemolysis of
RBC. The glucose diffuses out of cells and is estimated while various non
glucose reducing substance remain in the intact cells and are precipitated
during deproteinisation and removed by centrifugation.
So method used is modification by Asatoor and King in 1954 and
involves:
-
Precipitation of blood proteins.
-
Reduction of alkaline CuSo4 solution to cuprous oxide by glucose.
-
Estimation of extent of reduction of blue coloured complex by
colorimetric measurement at 6.10 nm.
Reagents :
i)
Isotonic copper sulphate solution :
Na2SO4 IOH2O – 30 gm and CuSO4 5H2 0-6 gm per 1 litre of
solution.
ii)
Sodium tungstate 10%.
iii)
Alkaline Tratrate solution.
Dissolve 25g NaHCO3, 20gm anhydrous Na3CO3 and 18 gm Pot.
Oxalate in about 500 ml of water. Add 12 gm of sodium potassium
tartrate and make up the volume to 1 L.
iv)
Phosphomolybdic acid solution : To 35 gm of molybdic acid add 5
gm. Of sodium tungsta'e, and 200 ml of 10% NaOH. Boil for 3040 mins to remove ammonia. Cool. dilute to about 350ml ad add
125 ml of conc. (85%) phosphoric acid. Make volume upto to 500
ml.
v)
Stock glucose Standard solution : 1 gm% in saturated benzoic acid.
32
33. vi)
Working glucose standard solution : Dilute stock 1 ml to 100 ml so
conc. Is 10 mg% with isotonic CuSo4 solution.
Procedure
Place 0.1 ml of blood in a centrifuge tube. Add 3.8 ml of isotonic sodium
sulphate copper sulphate solution and mix. Add 1 ml of sodium tungstate
solution and mix. Centrifuge at 2000 pm for 10' Use clear supernatant for
test.
Solutions
ml.
Supernatant
T
S1
S2
S3
B
1.0
-
-
-
-
Std. Glucose
-
0.2
0.4
0.6
-
Isotonic CuSO4
-
0.8
0.6
0.4
1.0
Alkaline Tartrate
1.0
1.0
1.0
1.0
1.0
Mix well. Plug the tubes with cotton wool and put in boiling water bath for
10 mins. Cool and 3 add mol of phosphomolbdic acid and 8 ml of distilled
water to each tube. Mix, take O.D. at 610 nm.
Plot a graph of standard against O.D.
Calculation :
OD of Test Amt. of Std.
Blood glucose (mg/dl) =
x
X 100
OD of Std Vol. of Blood
Interpretation : The normal fasting blood glucose varies from 60-100
mg/dl and post prandial from 100-140 mg/dl. The appear limit increase with
age and during pregnancy.
33
34. Hyperglycagmia : Causes are :
1.
Diabetes mellitus – Fasting blood sugar raised. Values of 140 mg/dl
on more than one occasion or post prandial level of 200 mg/dl
confirms the diagnosis. If the value is below 100 mg/dl it excludes
diabetes mellitus Values in uncertain range between these figures calls
for oral GTT to diagnose the condition.
2.
Hyperactivity of thyroid, pituitary, or adrenal gland.
3.
Surgical removal of pancrease, pancreatitis, carcinoma of pancrease,
fibrocystic disease or baemachromatosis of pancrease.
4.
Intracranial diseases like meningitis, encephalitis, tumors and
haemorrhage show a moderate hyperglycaemia.
5.
Drug induced eg : thiazide diuretics, steroids, ACTH, thyroid extracts.
Diabetes mellitus is the commonest cause of hyperglycaemia and its
early detection is of vital importance.
Hypoglycaemia : When blood glucose falls below 60 mg/dl.
1.
Most commonly seen due to overdosage of insulin in treatment of
diabetes mellitus.
2.
Hypothroidism – cretinism, myxoedema.
3.
Insulin secreting tumours of pancrease – rare.
4.
Hypoadrenahsm (Addison's disease)
5.
Hypopitruitism.
6.
Severe exercise.
7.
Starvation.
8.
Chronic alcoholism
9.
Congenital disease like – glycogen storage disorders
34
35. normally the blood sugar levels are well maintained due to action of
various hormones.
Along with estimation of blood glucose levels urine must be tested for:
1.
Reducing Sugar – Commonly in diabetes mellitus.
2.
Albumin – Diabetic nephropathy.
3.
ketone bodies – Diabetes ketoacidosis.
Recently quick measurement of blood glucose can be done by using
only drop of blood from a finger prick using glucometer or dextrostix.
Technical contents :- kit of sugar, colorimeter or semi autoanalyser.
Methodology of its teaching :- Demonstration and estimation of sugar.
Evaluation of the session :- Asking to perform the test and taking readings.
35
36. Chapter o. 7
Glucose Tolerance Test
Object :- To estimate the glucose tolerance.
Introduction :
Glucose Tolerance is defined as the capacity of the body to tolerate an
extra load of glucose. Normally the blood glucose level remains relatively
constant the fasting being 63-100mg% which returns to normal within 2
hours. The definitive diagnostic test for DM is the G.T.T.
Oral G T T : Procedure : After an overnight fast of 12-16 hrs. fasting blood
sample is taken. Then 75gm of glucose dissolved in 250-300ml of water is
given orally. Blood samples are collected at 30 mins interval for 2-3 hours
but 2 hours sample is most important for interpretation of result according to
WHO criteria.
Corresponding urine samples can also be collected and
presence of reducing sugar tested by Benedicts qualitative test. Blood sugar
in each sample is estimated by King and Asatoor method. A curve between
time and blood glucose concentration, is plotted.
Precautions :
1)
The patient should be on a diet of 300 gm of carbohydrate per day for
at least last 3 days.
2)
Fasting should not be less than 10 hrs. and not more than 16 hours.
Only water is permitted after dinner.
3)
The patient should not be taking drags that affect carbohydrate
metabolism.
36
37. 4)
Durings the test patient activity should be normal (mild to moderate)
and he should abstain from smoking. The patient should be at rest
mentally.
Factors affecting GTT :
1)
Starvation/Ingestion of high fat diet.
2)
Exercise.
3)
Pregnancy-tolerance is decreased.
4)
Illness-stress causes decreased tolerance, so patient recovered from
surgery, burns or child birth should be allowed 2 weeks time before
the test is carried out.
5)
Physiologically decreased tolerance with age.
6)
Endocrine disorders.
7)
Drugs-certain drugs must be withdrawn before the test eg-Oral
contraceptives, thiazide diuretics, insulin, oral hypoglyan mic
agents, salicylates etc.
8)
Liver diseases.
Interpretation:
The following important type of response are seen commonly :
a)
Normal Response : Fasting blood sugar is normal. After 1 hour level
rises, but remain below the renal threshold of 180%. It returns to
normal fasting level within 2 hours.
b)
Diabetic curve : Fasting level are 7.8 mmol/L (140mg dL) and 2 hour
venous blood glucose of 200mg/dl (11 lmmol/L) or more are
diagnostic of diabetes. Glycosuria is usually seen.
37
38. c)
Impaired GTT: 2 hours values of blood glucose between 140mg/dl
and 200mg/dl are not abnormal and must be followed up for DM.
d)
Renal Glycosuria : Curve is normal Due to lowered renal threshold
one or more samples of urine contain glucose.
e)
Lag storage/Alimentary Type: Fasting blood glucose is normal. Due
to rapid absorption, maximum level is found at 30 mins which crosses
180mg/dl (80 glycosuria seen) and hypoglycaemic levels may be
reached at end of 2 hours.
f)
Flat curve of enchanced glucose tolerance : the fasting blood glucose
level is normal.
Throughout the test the level does not vary + 20mg%.
Extended GTT :
In this blood samples are taken for 4-5 hrs after giving glucose to see
how the curve behaves below the normal fasting glucose limits. Done in
some conditions causing hypoglycaemia.
Cortisone Stressed GTT :
Can be used for detecting latent Diabetes mellitus.
Intrevenous GTT :
In is done if oral glucose is not tolerated or oral GTT curve is flat. In
these cases 20% glucose as 0.5g glucose/Kg body weight is infused. Blood
samples are collected hourly. Usually peak occurs within 30 mins after
infusion and returns to normal after 90 mins.
Methodology of its teaching :- Plotting the glucose tolerance graph.
Evaluation of the session :- Asking queries regarding the above test.
38
39. Chapter o. 8
Glycated hemoglobin
Object : To estimate Glycated hemoglobin.
Introduction : Human Hemoglobin inside erythrocytes undergoes a non
enzymatic chemical reaction with glucose. The rate and extant of this
reaction are thought to be depended on the average blood glucose
concentration during the life time of the erythrocytes there are several
reaction procedure, “Glycated hemoglobin”, which collectively Hb A1. The
most abundant of these is Hb A1c the ratio of Hb A1c or HbA1 to the total
HbA concentration has been suggested as a reliable measure of the degree of
metabolic control in diabetic patients.
Technical Contents :Using kit of Glycated hemoglobin and its measurement by semi autoanalyser
or by using Ghb analyser.
Principle and procedure:
1. Using kit of Glycated Hemoglobin an its measurement by semi
autoanalyser. A hemolysed preparation of whole blood is mixed
continuously for 5 minutes with a weak binding cation-exchange resin
during this time the non glycated hemoglobin, which consists of the bulk
of the hemoglobin (HbA0) binds to the resin. After the mixing period a
filter is used to seprate the supernatant containing the glycohemoglobin
from the resin. The percent glycohemoglobin is determined by measuring
the
absorbance
at
415
nm
(405-420nm
acceptable)
of
the
glycohemoglobin fraction and the total hemoglobin fraction. The ratio of
39
40. the two absorbances gives the percent glycohemoglobin. Normal range is
6.0% to 8.3%
2. Using Ghb analyser.
It uses low pressur cation exchange chromatography in conguction with
gradient elution to separate human hemoglobin sub types and variants
from hemolysed whole blood. The separated hemoglobin fraction are
monitored by means of absorption of light at 415nm the chromatogram
obtained is recorded and stored by the onboard computer. The analyser
performs the analysis of the chromatogram and generates a printed
report.
Expected range of Hb A1c
Sugar – 90-150
5-0% to 7.0%
Sugar – 150-180
7.0% to 8.0%
Sugar – 180-360
9.0% to 14.0%.
Method of teaching : Using kit of Ghb flowing its procedure and giving
demonstration.
Evaluation of session: To calculate the percent of glycated hemoglobin
after doing the experiment.
40
41. Chapter o. 9
Estimation Of Blood Urea
Kidney function tests : Since the kidneys perform a multitude of functions,
a single test cannot give information about the entire range of renal
functions. A group of tests is required to evaluate the different renal
functions. Abnormal results may sometimes be obtained due to a temporary
renal dysfunction. Hence the test should be performed repeatedly and
interpreted on the basis of a series of results. Moreover, the results of renal
function tests may some-times be affected by extra-renal factors. Therefore,
the results must always be interpreted in conjunction with the clinical
picture.
A large number of tests have been introduced during the past decades to
assess the renal functions. Only a few of them have stood the test of time.
The more important and commonly employed tests will be discussed below.
1) Blood urea
2) Serum creatinine
Object : To estimate blood urea.
Introduction :
Urea is main end product of protein catabolism. It is formed in the
liver and is excreted through urine. Urea represents about 45-50% of the
non-protein nitrogen of blood and 80-90% of the total urinary nitrogen
exeretion. The urea concentration in the glomerular filtrate is same as that in
plasma. Tublar reabsorption of urea varies inversely with the rate of urine
flow ad hence is not a useful measure of GFR. Blood urea nitrogen varies
directly with protein intake and inversely with the rate of excertion of urea.
41
42. Estimation : Various methods are use :
(i)
Enzymatic using urease :
a)
eseler's Method : Urea is converted to ammonia by the
enzyme urease. Ammonia is made to react with Neseler's reagent
(Potassium mercurie iodide) giving rise to a brown coloured
compound which is read at 450nm the enzyme acts optimally at 55oC
pH 7.0 to 8.0 and is inhibited by ammonia and fluoride.
Disadvantages are turbidity, colour instability and non linear,
calibration beside susceptibility to contamination with NH3 from the
laboratory and endogenous ammonia in the specimen.
b)
Berthelot Reaction :
In this NH3 reacts with phenol in presence of hypochlorite to
form an indophenol which gives a blue coloured compound in alkali.
Nitroprusside acts as a catalyst increasing the rate of reaction,
intensity of colour obtained and its reproducibility.
c)
In the urease/glutamate dehydrogenose method, glutamate
production from ammonia and 2.0 x 0- glutarate is measured by the
absorbance change at 340nm. Owing to concomitant conversion of
NADH+ to NAD+. Each molecule of urea hydrolysed causes the
production of two molecules of NAD+.
(ii)
Kinetic Method: GLDH method
Urea is hydrolysed in presence of urease to produce ammonia and
CO2 the ammonia produced combines with alfa oxoglutarate and
NADH in presence of GLDH to yield glutamate and NAD+
42
43. The decrease in extintion due to NADH in unit time is proportional to
the urea concentration.
Normal range of serum urea = 15 to 45 mg/dl
(iii)
Colorimetric Method : Diacetyl Monoxime Method
Principal : Urea reacts with diacetyl monoxime in acidic conditions at
nearly 100oC to give a red coloured product which is measured
colorimetrically at 520nm. Thiosemicarbazide and ferric ions are added to
catalyse the reaction and increase the intensity of colour. This method is
linear only upto 300mg% urea. For higher values if expected, the blood
sample should be diluted.
Reagents
1)
Reagent A : Dissolve 5g of ferric chloride in 20ml of water. Transfer
this to a graduated cylinder and add 100ml of orthophosphoric acid
(85%) slowly with strring. Make up the volume to 250ml with water.
Keep in brown bottle at 4oC.
2)
Reagent B : Add 200 ml conc, H2SO4 to 800 ml water in 2L flask
slowly with stirring and cooling.
3)
Acid Reagent : Add 0.5 ml of reagent A to 1 L of reagent B. keep in
brown bottle at 4oC.
4)
Reagent C : Diacetyl monoxime 20g/L of water. Filter and keep in
brown bottle at 4oC.
5)
Reagent D : Thiosemicarbazide 5g/L of water.
6)
Colour Reagent : Mix 67 ml of C with 67 ml of D and make up the
volume to 1000 ml with D.H2O keep in brown bottle at 4oC.
7)
Stock urea standard : 100mg/100 nl water.
8)
Working urea standard : Dilute 1 ml stock to 100ml with DH2O so
conc. is 1 mg/100ml.
43
44. Procedure : 0.1 ml if serum/plasma is diluted to 10 ml. set up the test tubes
as follows :
B
T
-
1.0 -
Std (ml)
-
-
D. Water (ml)
2
1.0 1.8 1.6 1.4 1.2 1.0
Colour Reagent (ml)
2.0 2.0 2.0 2.0 2.0 2.0 2.0
Acid reagent (ml)
2.0 2.0 2.0 2.0 2.0 2.0 2.0
Serum (ml)
S1
S2
S3
S4
S5
-
-
-
-
-
(dil 1:100)
0.2 0.4 0.6 0.8 1.0
Mix all the tube thoroughly. Keep in boiling water bath for exactly 30
mins. Then cool and read absorbance at 520nm.
Calculation :
O.D. Test
Blood urea (mg%) =
Amount of Std.
x
O.D. Std.
x 100
Vol. of bld.
A standard curve can be plotted end value of unknown sample calculated
from it.
Interpretation :
Normal blood urea in adults is 15-50 mg% when expressed as blood
urea nitrogen (BON) it is 7-25 mg%. It is somewhat higher in men than
women and there is gradual rise with age. The urea concentration varies with
the amount of protein in the diet.
44
45. Serum urea is lower in pregnancy probably due to hoemodilution,
usually between 15-20mg/100ml.
Increase in urea is significant as a measure of renal function. The
causes may be
Pre Renal : When there is reduced plasma volume it leads to
decreased renal blood flow and hence GFR leading to urea retention. Seen in
Reduced plasma volume :-
Acute intestinal obstruction – prolonged vomiting.
-
Severe diarrhoea.
-
Pyloric stenosis.
-
Ulcerative colitis.
-
Diabetic Keloacidosis.
-
Shocks, severe burns and haemorrhage.
Increased protein catabolism :-
Fevers
-
Thyrotoxicosis
Cardiac failure
Renal Disease : Blood urea is increased in all forms of renal diseases like;
-
Acute glomerulonephritis.
-
Renal failure
-
Malignant hypertension
-
Chronic pyclonephritis
-
Congenital cystic kidneys
Post renal : Due to obstruction to flow of urine there is retention and so
reduction in effective filteration pressure at the glomeruli
-
Enlargement of prostrate.
-
Stones in urinary tract.
45
46. -
Urethral strictures.
Methodology of its teaching :- demonstration of its estimation using kits.
Evaluation of the session :- Asking to demonstrate the test.
46
47. Chapter o. 10
Estimation Of Serum Creatinine
Object :- To estimate serum creatinine.
Introduction:
Creatinine is a waste product formed in muscle by creatine metabolism.
Creatine is synthesized in the liver which then passes into circulation where
it is taken up by skeletal muscle for conversion to creatine phosphate which
serves as storage form of energy in skeletal muscles. Creatine and creatine
phosphate are spontaneously converted to creatinine at a rate of about 2%
the total per day. This is related to muscle mass and body weight.
Creatinine formed is excreted in the urine. On a normal diet almost all
creatinine in urine is endogenous. Its excretion is fairly constant from day to
day and has been used to check the accuracy of 24 hours urine collection. It
is independent of urine flow rate and its level in plasma is quite constant.
Estimation of serum creatinine by Jaffe's Alkaline Picrate Method
Principle : Creatinine in alkaline medium reacts with picric acid to form a
red tautomer of creatinine picrate the intensity of which is measured at
520nm. The two chief disadvantages with Jaffe's reaction are:
-
Lack of specificity :- Only 80% of the colour developed is due to
creatinine in serum. other non specific chromogens that react with
picric acid are proteins, ketone bodies, pyruvate, glucose, ascorbate
etc.
-
Sensitivity to certain variables like PH temperature etc.
47
48. Reagents:
1)
Picric acid – 0.04M (9.16g/L)
2)
Sodium hydroxide – 0.75N
3)
Sodium tungstate – 10%
4)
2/3 N H2 SO4
5)
Creatinine standard stock – 100mg%
6)
Working standard – 3mg%
Procedure :- In a centrigure tube, take 2ml of serum with 2 ml of distilled
water. Precipitate proteins by adding 2ml sodium tungstate and 2ml of 2/3 N
sulphuric acid drop with constant shaking. Stand for 10 minutes and filter.
Use protein free filterate for test.
Make the test tubes as follows and add :
B
S1
S2
S3
S4
T
Filtrate
-
-
-
-
-
3 ml
Standard 3mg%
-
0.5
1.0
2.0
3.0
-
D. Water
3 ml
2.5
2.0
1.0
-
-
NaOH
1 ml
1.0
1.0
1.0
1.0
1.0
Picric acid
1.0
1.0
1.0
1.0
1.0
1.0
Mix well Allow to stand for 15 min. and read absorbance at 520nm.
Calculation :
O.D. Test
Serum creatinine (mg%) =
Amount of Std.
x
O.D. Std.
x 100
Vol. of Serum
48
49. Interpretation :
Normal serum creatinine levels are males : 0.7-1 4mg/100m l
Females: 0.4-1.2mg/100m l
In is higher in males since it is related to body size.
Increased serum levels are seen in renal failure and other renal diseases in a
manner similar to urea. Creatinine, however, does not increase with age,
dehydration and catabolic states (eg fever, sepsis, haemorrhage) to the same
extent as urea. It is also not affected by diet.
But the Jaffe's reaction for measuring serum creatinine is not as
sensitive andreliable as method for urea. It is interfered with by Ketone
bodies and glucose and hence false high values may be obtained in diabetes
ketoacidosis.
How serum creatinine is not significant. It is associated with muscle
wasting diseases.
Technical Contents: Kit of creatinine.
Methodology of its teaching :- demonstration of its estimation using kits.
Evaluation of the session :- Asking to demonstrate the test.
49
50. Chapter o. 11
Estimation Total Protein
Object : To estimate total protein.
Introduction:
Serum contains a large variety of proteins. More than hundred
different proteins have been identified so far, and perhaps many more are yet
to be identified. Albumin and the various globulins constitute the bulk of the
total amount of proteins present in serum.
The most widely used method is still the biuret method. (the name
derives from the reaction between biuret and cupric ions in an alkaline
medium.
Biuret Method
Principle : Cupric ions form chelates with the peptide bonds of proteins in
an alkaline medium. sodium potassium tartrate keeps the cupric ions in
solution. The intensity of the violet colour that is formed is proportional to
the number of peptide bonds which, in turn, depends upon the amount f
proteins in the specimen.
Reagents
(i)
Biuret Reagent – 3 mg of copper sulphate is dissolved in 500 ml of
water. 9 gm of sodium potassium tartrate and 5 gm of potassium
iodide are added and dissolved. 24 gm of sodium hydroxide, dissolved
separately in 100 ml of water is added. The volume is made up to 1
litre with water. The reagent is stored in a well-stoppered polythene
bottle.
50
51. (ii)
Biuret blank – this is prepared in the same way as the buiret reagent
with the difference that copper sulphate is not added.
(iii)
Standard protein solution – the best way is to determine the total
protein concentration in pooled human serum by Kjeldahl method,
dilute it to bring the protein concentration to the desired level, say 6
gm/100 ml and use it as standard. Alternatively, a 6 gm/100 ml
solution of bovine albumin in water may be prepared and used as
standard.
Procedure : label 3 test tubes 'Unknown', 'Standard' and 'Blank', Measure 5
ml of biuret reagent into each. Wash 0.1 ml of serum into 'Unknown', 0.1`
ml of standard protein solution into ';Standard' and 0.1 ml of water into
'Blank'. Mix and allow to stand for 30 minutes.
Read 'Unknown' and 'Standard' against 'Blank' at 540 nm or using a
green filter.
Calculations
Au
Serum total proteins (gm/100 ml)
ote.
=
x 6
As
The above procedure gives reliable results with clear and
unhaemolysed specimens. If the serum specimen is lipaemic, icteric or
haemolysed, an additional tube (Serum Blank) should be prepared. 0.1 ml of
serum should be mixed with 5 ml of biuret blank in this tube and read after
30 minutes against 'Blank'. Absorbance of 'Serum Blank; should be
subtracted from that of 'Unknown before calculations.
51
52. Interpretation
The normal range of serum total proteins is 6-8 gm/100 ml in adults. The
values. Are lower in neonates, rise gradually in infancy and reach the adult
levels in early childhood. The level decreases in pregnancy. A slight change
occurs with posture also. The level is a little higher in upright posture than in
recumbent posture due to shift of water from the vascular compartment into
the interstices.
An increase in serum total proteins occurs in dehydration due to
haemoconcentration. An increase may also occure in multiple myeloma,
macroglobulinaemia, chronic infections, chronic liver disease and autoimmune diseases.
A decrease in serum total proteins may results from heavy losses of
proteins in urine as in nephritic syndrome. Protein undernutrition, intestinal
malabsorption and protein losing enteropathy may also lower the serum total
proteins. A decrease may also occur in shock, burns, crush injuries,
haemorrage etc. due to haemodilution. Increased breakdown of proteins, as
in hyperthyroidism, un-treated diabetes mellitus, wasting diseases etc. may
also lower the level of proteins in serum.
Technical contents : Using kit of total protein.
Method of teaching : Demonstration and its measurement of serum total
protein by kit and taking readings. Using a colorimeter or semi auto
analyser.
Evaluation : Giving exercise of total protein estimation.
52
53. Chapter o. 12
Estimation of Serum Albumin and Globulin
Object: To estimate of serum albumin and globulin.
Bromocresol Green Method
Principle : The method is based on the protein error of indicators. Biding of
a protein to an indicator changes its colour. Among serum proteins, only
albumin binds to BCG this binding produces a change in the colour of BCG
which is measured colorimetrically. The pH is maintained during the
reaction by a buffer.
Reagents
(i)
Succinate buffer - 11.8 gm of soccinic acid is dissolved in about 800
ml of water. The pH is adjusted to 4.0 with 0.1 N sodium hydroxide.
The volume is made up to 1 litre with water. This solution should be
stord in refrigerator.
(ii)
BCG solution - 419 mg of bromocresol green is dissolved in 10 ml of
water. The solution is stored in refrigerator.
(iii)
Buffered BCG solution – 250 ml of BCG solutions is mixed with 750
ml of succinate buffer. The pH is adjusted to 4.2 with 0.1 N sodium
hydroxide solution. 4 ml of Brij – 35 solution (30%) is added.
(iv)
Standard albumin solution – an aqueous solution of human albumin
with a concentration of 4 gm/100 ml can be prepared and used as a
standard. Sodium azide should be included in this solution (50 mg in
every 100 ml) as a preservative. Pooled human serum (preserved with
sodium azide) or a control serum having an albumin concentration of
4 gm/100 ml can also be used as a standard.
53
54. Procedure : Level 3 test tubes 'Unknown', 'Standard' and 'Blank'. Measure 4
ml of buffered BCG solution into each. Wash 0.02 ml of serum into
'Unknown', 0.02 ml of standard albumin solution into 'Standard' and 0.02 ml
of water into 'Blank'. Mix and allow the tubes to stand for 5 minutes.
Read 'Unknown' and 'Standard' against 'Blank' at 630 nm or using a
red filter.
Calculations :
Au
Serum albumin (gm/100 ml)
=
x 4
As
Interpretation :
The normal range of serum albumin is 3.7-5.3 gm/100 ml. Serum
globulin ranges from 1.8 to 3.6 gm/100 ml. the A:G ratio is roughly 2:1
though it may range from 1.2:1 to 2.5:1.
Decrease in serum albumin may occur in protein undermutrition,
intestinal malabsorption, protein-losing enteropathy, liver disease, wasting
diseases, nephritic syndrome and haemodilution. A severe decrease or near –
absence may be seen in analbuminaemia which is a genetic disease with
autosomal recessive in-heritence. A rise in serum albumin may occur in
dehydration due to haemoconcentration.
Serum globulin may decrease due to haemodilution in shock, burns,
haemorrhage etc. serum globulin increases in multiple myeloma,
macroglobulinaemia, chronic liver disease, chronic infections and autoimmune diseases. A:G ratio may be decreased or reversed in these
conditions.
54
55. Since the colorimetric measurement of albumin is much simpler than
that of globulin, the concentrations of total proteins and albumin are
measured in serum, and globulin is obtained by difference.
Technical contents : Using kit of serum albumin.
Method of teaching : Demonstration and its measurement of serum albumin
by kit and taking readings. Using a colorimeter or semi auto analyser.
Evaluation : Giving exercise of serum albumin estimation.
55
56. Chapter o. 13
Estimation Of Aminotransferases (Transaminases)
Object :- To estimate aminotransferases.
Asparate Aminotransferase (AST) SGOT
Alanine Aminotransferase (ALT) SGPT
Introduction :
The aminotransferases are a group of enzymes that catalyse the inter
conversions of the aminoacids and α-Keto acids by transfer of amino
groups. Distinct isoenzymes of AST are present in the cytoplasm and
mitochondria of cells.
Method for the estimation of AST and ALT :
Colorimatric Methods :
Reitman & Frankel (1957), Tietz (1970), Bergmeyer & Brent (1974 b)
Modified Reitman & Frankel Method :
Principle :The amount of oxaloacetate or pyruvate produced by transamination
is reacted with 2,4 dinitrophenyl hydrazine (DNPH) to form a brown
coloured hydrazone, the colour of which in alkaline solution is read at
520nm.
56
57. Reagents :
1. Buffer substrate – For both enzymes, 100 mmol/L phosphate buffer
and 2 mmol/L 2-oxoglutarate jwith 100 mmol/L L-asparate for AST
and 200 mmol/L-DL alanine for ALT.
a. for AST-add 15.7g L-asparate monosodium salt or 13.2g Laspartic acid.
b. for ALT-add 17.8g of DL-alanine.
Adjust pH to 7.4 with NaOH and make up the volume to 1 Litre with
distilled water.
2. 2,4 Dinitrophenylhdrazine (DNPH)-1 mmol (200 mg)/L in lmol/L
HCL.
3. Sodium hydroxide solution 400 mmol (16g)/L.
4. Pyruvate solution – 2 mmol/L (22mg of sodium pyruvate in 100 ml of
distilled water).
Procedure : Mark test tubes and proceed as follows :
Blank
Test
S1
S2
S3
S4
0.5ml
0.5ml 0.9ml
0.8ml
0.7ml
0.6ml
D. Water
0.5ml
0.5ml 0.2ml
0.2ml
0.2ml
0.2ml
Serum
0.2ml
0.2ml -
-
-
-
Pyruvate Std.
-
-
0.2ml
0.3ml
0.4ml
BufferSubstrate
0.1ml
Incubate at 37oC for AST-60 mins and ALT – 30 mins.
Add 0.5ml DHPH to each tube. Mix and stand at room temperature.
20 mins and add NaOH 0.5ml each tube.
57
58. Read at 520nm after 5 minutes.
(Karmen Units)
Conc of pyruvate
AST
ALT
S1
24
25
S2
61
57
S3
114
97
S4
190
150
AST (IU)
ALT (IU)
S1
11.5
13.4
S2
29.3
27.4
S3
54.7
46.6
S4
91.2
72.0
1 Karmen unit=0.483 I.U.
Interpretation :
The normal range of AST = 7-21 IU
ALT = 6-20 IU.
Transaminases are widely distributed in human tissues. Both AST and ALT
are normally present in human plasma, bile cerebrospinal fluid and saliva.
Elevation in the serum levels of AST & ALT :
1.
Liver disease : associated with hepatic necrosis, viral hepatitiselevated levels of AST and ALT are found even before the clinical
signs and symptoms appear. 20-25 fold elevation are encountered.
Peak values are seen between the 7th and 12th day and values return to
normal levels by 3rd to 5th week. AST characteristically is us high or
58
59. higher than AST and the ALT/AST (De Rites) ration which normally
is <1 approaches or becomes >1.
2.
Extrahepatic cholestasis-moderate increase in the levels of AST and
ALT activities is seen.
3.
Cirrhosis-Levels vary with the status of the cirrhosis. AST activity is
higher than ALT activity.
4.
Primary metastatic carcinoma of the liver.
ALT is the more liver specific enzyme although both AST and ALT are
raised in liver diseases.
II
Myocardial infarction-Elevated AST level begins 3-8 hrs after the
onset of the attack and returns to normal within 3-6 days peak is seen 24 hrs
after the onset. ALT levels are within normal limits or only marginally
increased. ALT increases in liver damage secondary to heart disease.
AST raised levels are seen in
-
Dermatomyositis
-
Pulmonary emboli
- Acute pancreatitis
- Crushed muscle injuries.
- Gangrene
- Haemolytic diseases
Others-Both AST and ALT levels may be elevated following
-
intake of alcohoal
Delirium tremens and after administration of drugs such as opiates,
salicylates or ampicillin.
Technical contents : Using kit of serum SGOT and SGPT.
59
60. Method of teaching : Demonstration and its measurement of serum SGOT
and SGPT by kit and taking readings. Using a colorimeter or semi auto
analyser.
Evaluation : Giving exercise of serum SGOT and SGPT.
60
61. Chapter O. 14
Estimation of Serum Alkaline Phosphatase
(King & King Method)
Object : To estimate serum alkaline phosphatase.
Introduction:
Alkaline phosphatase is present in practically all tissues of the body. It
occurs at high levels in the intestinal epithelium, kidney tubules, bone
(osteoblasts), liver and placenta. The relative contributions of bone and liver
isoenzymes to the total activity are makedly age-dependent. There is also a
significant difference in levels of serum alkaline phosphatase between
different sexes of same ages.
Principle : The serum is incubated with the buffer substrate under optimum,
conditions of temperature and pH to release phenol. This reacts with 4animoantipyrine in alkaline medium to give a red coloured compound which
is estimated at 520nm against a reagent blank. Colour development is rapid
and is stable for at least an hour sodium hydroxide is added immediately
after incubation to raise the pH and stop the reaction. Potassium ferricyanide
is the oxidising agent. Sodium Bicarbonate provides the alkaline medium.
Reagents :
1.
Substrate –(Disodium phenyl phosphate – 100 mmol/L): Dissolve
2.18g (or 2.541g of the dehydrate) in water and make the volume to a
liter. Bring quickly to boil; cool; add 4ml of chloroform and keep in
the refrigerator.
2.
Buffer (Sodium carbonate-sodium bicarbonate, 100 mmol/L):
Dissolve 6.36g anhydrous sodium carbonate and 3.36 g of sodium
bicarbonate in water and make the volume to a liter.
61
62. 3.
Buffer substrate for use-Mix equal volumes of Reagent 1 and Reagent
2. this has a pH of 10.
4.
Stock standard phenol solution (1 g/L) – Dissolve 1 g of pure
crystalline phenol in 100 mmol/L of HCL (8.4ml in 1 litre of d. water)
and make to a liter with the acid. Keep in a brown bottle at 4oC.
5.
Working standard phenol solution (1mg/100ml) Dilute the stock
standard – 1 to 100.
6.
Sodium hydroxide solution – 500 mmol/L (20 g/L)
7.
Sodium Bicarbonate solution – 500 mmol/L (42 g/L)
8.
4-Aminoantipyrine – 6 g/L. in water. Store in a brown bottle.
9.
Potassium Ferricyanide – 24 g/L in d. water. Store in a brown bottle.
Procedure : Mark test tubes and proceed as follows :
Reagent
(ml)
1. Buffer-Substrate
Blank
(ml)
2.0
Test
(ml)
2.0
S1
(ml)
1.6
S2
(ml)
1.1
S3
(ml)
0.6
S4
(ml)
0.1
2. Working Standard
-
-
0.5
1.0
1.5
2.0
3. D. Water
0.1
-
-
-
-
-
4. Serum
-
0.1
-
-
-
-
Incubate at 37oC for 15 min.
5. NaOH
0.8
0.8
0.8
0.8
0.8
0.8
6. NaHCO2
1.2
1.2
1.2
1.2
1.2
1.2
7. 4-Aminoantipyrin
1.0
1.0
1.0
1.0
1.0
1.0
8. Potassium
Ferricyanide
1.0
1.0
1.0
1.0
1.0
1.0
Mix thoroughly and read at 520 nm.
62
63. Calculation :
Alkaline phosphatase is expressed in king and Armstrong units (KA Units);
King and Armstrong unit corresponds to the liberation of 1 mg of phenol by
100 ml of serum under optimum conditions.
O.D. Test
S. Alk. Phosphatase
=
100
x
Amount of Std. x
O.D. Std.
0.1
(KA Units/dL).
Interpretations :
The normal range of serum alkaline phosphatase activity is 3-13 KA
units in adults and is up to about two and a half times greater in children
particularly during periods of active growth.
1.
Increase in levels of serum alkaline phosphatase :Physiological :i.
Children – during periods of bone growth.
ii.
Puberty
iii.
Pregnancy – third trimester-due to the isoenzyme of placental
origin.
Pathological :
(A)
Bone Diseases :- Activity is increased when osteoblasts are more
actively laying down osteoid.
i.
Rickets – marked increase upto 100 KA units is seen. Levels
fall upon treatment with Vitamin D.
ii.
Osteomalacia – there is an increase but not as marked as in case
of rickets.
63
64. iii.
Paget's disease (Osteitis deformans)- The highest levels of
serum alkaline phosphatase activity are encountered. Values
range from 10-25 times the upper limit of normal.
iv.
Osteogenic Sarcoma
v.
Secondary deposits in bone- particularly in the case of
carcinoma of the prostate. Small increases may sometimes be
seen in breast cancer and secondaries from thyroid, pancress
and stomach.
vi.
(B)
Healing of bone fractures = Transient elevation seen.
Liver Disease :- The response of the liver to any form of biliary
obstruction is t) synthese more alkaline phosphatase. The main sites of
new enzyme synthesis are the hepatocytes.
Technical contents : Using kit of serum Alkaline Phosphatase .
Method of teaching : Demonstration and its measurement of serum
Alkaline Phosphatase by kit and taking readings. Using a colorimeter or
semi auto analyser.
Evaluation : Giving exercise of serum Alkaline Phosphatase.
64
65. Chapter o. 15
Estimation of Serum Bilirubin
(Estimation by method of Malloy and Evelyn, 1937, Modified.)
Jaundice
Jaundice is yellow discoloration of the skin or sclera (fig. 1) this is due to the
presence of bilirubin in the plasma and is not usually detectable until the
concentration is greater than about 1.1 mg/dl. Normally the bilirubin
concentration in serum ranges from 0.2-1.1 mg/dl.
Biliburin is derived from the terapyrrole prosthetic group found in
haemoglobin and the cytochromes. It is normally conjugated with glucuronic
acid to make it more soluble, and excreted in the bile (fig. 2) there are three
main reasons why bilirubin levels in the blood may rise (fig. 3)
•
Haemolysis. The increased haemoglobin breakdown produces
bilirubin which overloads the conjugating mechanism.
•
Failure of the conjugating mechanism within the hepatocyte.
•
Obstruction in the biliary system.
Both conjugated bilirubin and unconjugated bilirubin may be present in
plasma. Conjugated bilirubin is water soluble. Unconjugated bilirubin is not
water soluble and binds to albumin from which it may be transferred to other
proteins such as those in cells membranes. It is neurotoxic, and if levels rise
too high in neonates, permanent brain damage can occur.
Biochemical tests
Bilirubin metabolities are responsible for the brown coloration of faeces. If
bilirubin does not reach the gut, stools become pale in colour. Bilirubin in
65
66. the gut is metabolized by bacteria to produce stercobilinogen. And may be
detected by simple biochemical tests. When high levels of conjugated
bilirubin are being excreted, urine may be a deep orange colour, particularly
if allowed to stand.
Biochemical test (LFTs) include measurement of serum AST and ALT as
markers of hepatocellular damage, as well as bilirubin and alkaline
phosphatase which are indicators of cholestasis.
Object :- To estimate serum bilirubin.
Introduction:
Most of bilirubin is formed in reticule-endothelial system from
breakdown of red blood cell precursors. This bilirubin is unconjugated and is
almost insoluble in water. Bilirubin is transported to serum albumin mainly
and is not filtered through glomerulus. Bilirubin is actively taken up by
carrier mediated process and binds to intracellular proteins eg. Ligandin and
Z protein. At the endoplasmic reticulum, UDP-glucuronyl transferase
conjugates
bilirubin
forming
mainly
bilirubin
onide
with
some
monoglucuronide. This conjugated bilirubin is water soluble and when
present can be filtered through glomerulur appearing in urine. Secretion of
conjugated bilirubin in biliary canalicular membrance is rate limiting process
and is sensitive to liver damage. Bile is stored in gall bladder from where it
passes into-duodenum via cystic and common bile duct.
Principle: When reacted with diazotized sulfanilic acid (Ehrlich's Reagent),
bilirubin is converted to azobilirubin molecules which give a red purple
colour in acid the intensity of which is read colorimetrically .
Both conjugated and unconjugated bilirubins give purple azobilirubins
with diazotized acid. Conjugated bilirubin can react in aquous solution
66
67. (Direct Reaction), whereas
unconjugated requires an accelerator or
solubiliser , such as methanol (Indirect Reaction-which gives total bilirubin
i.e. conjugated + unconjugated bilirubin).
Reagents :
1.
Diazo reagent : Make freshly before use the mixing 10ml of solution
A and 0.3ml of solution B.
Solution A : 1g of sulphanilic acid and 15ml of concentrated HCL per
litre in water.
Solution B : 0.5g of sodium nitrite/100ml in water. This solution
should be kept in refrigerator renewed monthly.
2.
Diazo Blank : 15ml of conc. HCL/litre in water.
3.
Methanol
4.
Bilirubin standard : Dissolve 10mg bilirubin in a minimum (about
5ml) of 0.1N sodium solution, as quickly as possible (since it is
unstable in alkaline solution) and make volume with human citrated
plasma (obtained from blood bank from outdated bottles. Plasma is
left in sunlight for some hours before use to destroy bilirubin present).
To be kept frozen in small fractions (for practicals methanol may
replace plasma for making volume)
67
68. Procedure : Label test-tubes and proceed as follows :
Reagent
Standard
Total Bilirubin
Conj. Bilirubin
S
Serum
SC
T (tot)
T (tot)C
T (Conj)
T (conj)C
-
-
0.2ml
0.2ml
0.2ml
0.2ml
-
-
-
1.8ml
4.3ml
4.3ml
-
0.5ml
-
0.5ml
-
0.5ml
2.5ml
-
-
Standard Soln. 0.2ml 0.2ml (10mg/dl)
D. Water
1.8ml 1.8ml 1.8ml
Diaze Reagent
0.5ml -
0.5ml
Diazo Blank
-
Methanol
2.5ml 2.5ml 2.5ml
0.5ml -
Mix and allow to stand in dark for 30 min.
Read absorbance in next 10 min at 540nm using D. water as blank.
Calculation :
T(tot)-T (tot)c
Total S. Bilirubin =
(mg/dL)
100
x Amount of std, x
S
-
Sc
Vol. of Serum
T(tot)-T (tot)c
Conj. S. Bilirubin =
(mg/dL)
100
x Amount of std, x
S
-
Sc
Vol. of Serum
Serum value of unconjugated bilirubin may be derived by subtracting the
value of conjugated bilirubin from total bilirubin.
68
69. Interpretations :
Normal serum bilirubin is less than 1 mg/dL. Hyperbilirubinaemia of more
than 3 mg/dL results into clinical jaundice.
Hyperbilirubinaemia may be due to :I.
Unconjugated Hyperbilirubinaemia (Retention Jaundice): Due to
retention in circulation of increased amount of unconjugated bilirubin.
(A)
Haemolytic (Pre-hepatic Jaundice) due to:
i) Increased haemolysis : increased breakdown of haemoglobin
to bilirubin at a rate exceeding the ability of normal liver cells
remove it from circulation.
- abnormal R.B.C. e.g. in spherocytocis, haemoglobinopathies,
G-6-p dehydrogenase deficiency etc.
- Antibodies eg. Incompatible blood transfusion.
- Organisms e.g. Plasmodium in malaria etc.
ii) Inteffective eryghropoiesis eg. in pernicious anaemia.
(B)
Non haemolytic Hepatie : due to
i) impaired hepatic uptake eg. in Gilbert's syndrome.
ii) impaired glucuronyl transferase activity in conditions such
as :
-
Crigler_Najjar Syndrome
-
Gilbert's syndrome (in addition to impaired uptake)
-
Physiological jaundice of new born. Particularly in
premature infants not having fully developed microsomal
conjugating enzyme syste.
II
Conjugated Hyperbilirubinaemia (Regurgitation Jaundice) :
Due to regurgitation into circulation of conjugated Bilirubin which
would normally pass along the bilirubin system.
69
70. Technical contents : Using kit of serum Bilirubin.
Method of teaching : Demonstration and its measurement of serum Serum
bilirubin by kit and taking readings. Using a colorimeter or semi auto
analyser.
Evaluation : Giving exercise of serum bilirubin.
70
71. Chapter o 16
Estimation of serum triglycerides
Lipid profile: For lipid profile estimation following tests are performed
1) Total lipids : Principle lipids react with sulphuric acid, phosphoric acid
and vanillin to form pink colour complex. Normal values 400-1000 mg/dl
2) Phospholipids : It is a fully enzymatic method which uses three different
enzuymes- phospholipase D, Choline oxidase and per oxidase to developed
colour which is measured at 500 nn. Normal range 160-270 mg/dl
3) Triglycerides :
4) Cholesterol :
5) HDL :
6) LDL : Cholesterol – HDL + VLDL
7) VLDL : TG/5
Object: To estimate serum triglycerides.
Introduction :
Elevated levels of triglycerides in plasma have been considered as risk
factors related to atherosclerotic diseases. The hyperlipidemias can be
inherited trait or they can be secondary to a variety of disorders of diseases
including nephrosis, diabetes mellitus, biliary obstruction and metabolic
disorders associated with endocrine disorders.
Method:
Acetyl-acetone.
ormal range
10-190 mg/dl
71
72. Principle:
The serum lipids are extracted by isopropanol, which also precipitates serum
proteins. The interfering phospholipids, containing glycerol as integral part,
are removed by adsorption on alumina. Filtrate is used for saponification and
glycerol is separated from triglycerides. Action of metaperiodate converts
glycerol into glyceraldehydes, which forms a yellow coloured complex with
acetyl acetone. The intensity of the coloured complex is measured at 410
nm. (violet filter).
Reagents:
1) Alumina : (active grade : 1, for chromatography): It is washed with
distilled water & dried in an overn overnight at 100oC.
2) Isopropanol : AR, grade.
3) Alcoholic KOH : It is prepared by dissolving 50 g of potassium
hydroxide in 600 ml of distilled water and 400 ml of isopropanol.
4) Metaperiodate : It is prepared by dissolving 77 g of ammonium
acetate & 650 mg of sodium metaperiodate in 940 ml of distilled
water and 60 ml of glacial acetic acid.
5) Acetyl-acetone : It is prepared by mixing 7.5 ml of acetyle acetone
and 200 ml of isopropanol in 800 ml of distilled water.
6) Triglyceride standard : 100 mg/dl (It is prepared by dissolving
tripalmitine (or triolein) in chloroform.
Stability of the reagents
Reagents 1, 2, 3, 4 & 5 are stable at room temperature. Reagent 6 i.e.
standard is stable at 2-8oC.
72
73. Procedure :
1. Take two test-tubes labeled as test and standard.
2. Pur alumina approximately 0.5 gms in both the tubes.
3. Add 4.0 ml of isopropanol to both the tubes.
4. Add 0.1 ml serum in the tube labeled as test.
5. Add 0.1 ml of triglyceride standard 100 mg/dl in the tube labeled as
standard.
6. Mix the contents of test thoroughly and also mix the contents of
standard.
7. Keep exactly for 15 minutes at room temperature (25oC+5oC) with
intermittent mixing.
8. Transfer the content of test and standard to respective centrifuge tubes
and centrifuge at 3000 RPM for 10 minutes. Now pipette in the tubes
labeled as follows :
Test
Std.
Blank
Filtrate (Test), ml
2.0
-
-
Filtrate (Std), ml
-
2.0
-
Isopropanol, ml
-
-
2.0
Alcoholic KOH, ml
0.6
0.6
0.6
1.5
1.5
Mix thoroughly and keep at 60-75oC for 15 minutes.
Metaperiodate, ml
1.5
Mix thoroughly and keep at room temperature for 5 minutes.
Acetyl acetone, ml
1.5
1.5
1.5
Mix, thoroughly and keep at 70oC for 15 minutes. Cool the tubes and
read intensities of test and standard against blank at 420 nm (violet
filter)
73
74. Calculations :
O.D. Test
Serum triglycerides, mg/dl =
x 100
O.D. Std.
Note:
1. Store triglyceride Std. (reagent no. 6) tightly closed at 2-8oC.
2. All glassware after washing should be rinsed finally in distilled
water and dried at 100oC.
Procedure limitations:
The method is linear up to 300 mg/dl. For values higher than 300 mg/dl,
dilute the specimen in saline and repeat the test. Consider appropriate
dilution factor for the calculation of final result.
Enzymatic determination of serum triglycerides:
Early clinical methods for determining triglycerides involved chemical
hydrolysis of a solvent extract of the serum lipids. These methods were
difficult, slow, and provided numerous opportunities for error. They were
not readily automatable.
Chemical principle of test
Lipoprotein
Triglycerides + H2O
Glycerol + fatty acids.
Lipase
Glycerol kinase
Glycerol + ATP
Glycerol – 3 – phosphate + ADP
Glycerol phosphate oxidase
Glycerol–3- phosphate + O2
Dihydroxy acetone phosphate + H2O2
Peoxidase
H2O2 + 4-amino-phenazone + p-chlorophenol
Coloured complex, it is measured at 520 nm (green filter).
74
75. Technical contents : Using kit of serum triglycerides.
Method of teaching : Demonstration and its measurement of serum
triglycerides by kit and taking readings. Using a colorimeter or semi auto
analyser.
Evaluation : Giving exercise of serum triglycerides.
75
76. Chapter o 17
Estimation of Serum Cholesterol (Total)
Object: To estimate serum cholesterol.
Introduction:
Cholesterol is a fat-like substance that is found in all body cells. The liver
makes all of the cholesterol the body needs to form cell membranes and to
make certain hormones.
The determination of serum cholesterol is one of the important tools in the
diagnosis an classification of lipemia. High blood cholesterol is one of the
major risk factors for heart disease.
Sackett's Method:
Principle : Proteins are precipitated by and cholesterol extracted in an
alcoholether mixture. The extract is evaporated and the residue dissolved in
chloroform. By Liebermann-Burchard reaction, a green colour is developed
and measured colorimetrically.
Reagents
(i)
Alcohol-ether mixture – Ethyl alcohol (95%) and ether are mixed in a
ratio of 3:1.
(ii)
Chloroform-This should be of a high purity and absolutely anhydrous.
(iii)
Acetic anhydride-sulphuric acid mixture-Acetic anhydride and conc.
sulphuric acid are mixed in a ration of 20:1 just before use.
(iv)
Stock standard cholesterol solution 200 mg of chemically pure
cholesterol is dissolved in and diluted to 100 ml with chloroform.
76
77. (v)
Working standard cholesterol solution – 1 ml of stock standard
cholesterol solution is diluted to 25 ml with chloroform. 5 ml of this
solution contains 0.4 mg of cholesterol.
Procedure : Pipette 12 ml of alcohol-ether mixture in a dry centrifuge tube.
Add 0.2 ml of serum slowly. Cork the tube and shake vigorously for one
minute. Keep the tube in a horizontal position for half an hour. Centrifuge it
at 1,500 r.p.m. for 5 minutes. Pour off the supernatant fluid completely in a
small breaker, and evaporate it on a steam-bath or a hot plate. Make up to 5
ml with chloroform. Label the tube 'Unknown'.
Label two other test tubes 'Standard' and 'Break', and pipette
respectively 5 ml of working standard cholesterol solution and 5 ml of
chloroform the three tubes. Mix and keep in dark for 15 min.
Adjust the wavelength of the photometer to 680 nm or put in a red
filter. Set the photometer to 100% transmittance (or zero obsorbance) with
'Blank' and read 'Unknown' and 'Standard'.
Calculations
Serum Cholesterol (mg/100ml)
Au
=
As
0.4
x
0.2
x 100
Au
=
x 200
As
Interpretation
Serum cholesterol varies from 150-240 mg/100 ml in healthy young adults.
The level rises with age and may go upto 300 mg/100 ml in the elderly.
An increase in serum cholesterol (hypercholesterolaemia) is found in
diabetes mellitus, nephritic syndrome, obstructive jaundice, hypothyroidism,
xanthomatosis
and
during
ether
anaesthesia.
An
idiopathic
77
78. hypercholesterolaemia of unknown actiology occurs in some families.
Hypercholesterolaemia, from any cause, predisposes to atherosclerosis.
A decrease in serum cholesterol (hypocholesterolaemia) is found in
hyperthyroidism, hepatocellular damage, anaemia (except haemorrhagic),
acute infections, wasting disease, intestinal obstruction and terminal states of
a variety of disease.
Recently, an enzymatic method based on the action of cholesterol
oxidase on cholesterol has also been developed. Some commercial kits based
on the enzymatic method are available in the market, and should be used
according to the instructions of the manufacturers.
Determination of cholesterol by enzymatic method (Application on
autonalysers)
Principle :
Cholesterol esters are hydrolysed by cholesterol ester hydrolase to free
cholesterol & fatty acids. the free cholesterol produced and pre-existingh one
are oxidised by cholesterol oxidase to Cholestenone-4-en-3-one and
hydrogen peroxide. Peroxidase acts on hydrogen peroxide and liberated
oxygen reacts with the chromogen (4-amino phenazone/phenol) to form a
red coloured compound which is read at 510 nm (505-530 nm).
Technical contents : Using kit of serum cholesterol.
Method of teaching : Demonstration and its measurement of serum
cholesterol by kit and taking readings. Using a colorimeter or semi auto
analyser.
Evaluation : Giving exercise of serum cholesterol.
78
79. Chapter o 18
Estimation of Serum HDL cholesterol
Object : To estimation serum HDL cholesterol
Introduction :
In the presence of phosphotungstic acid and magnesium chloride, LDL,
VLDL & chylomicrons are precipitated. Centrifugation leaves only the HDL
in the supernatent. Cholesterol in the HDL fraction can be tested by the
usual methods.
Normal range
Men
:
30-60 mg/dl.
Women
:
40-70 mg/dl.
Method:
Colorimetric (Watson)
Precipitating reagents:
1) Phosphotungstie acid reagent (P.T.A.): It is prepared by dissolving
2.25 g. of phosphotungstie acid in 8.0 ml of IN sodium hydroxide and
42.0 ml of distilled water.
2) Magnesium chloride reagent : 20.34 g of magnesium chloride in
distilled water. It is diluted to 50 ml.
79
80. Procedure :
Pipette in the centrifuge tubes labeled as follows:
Test
1) Serum, ml
0.5
2) P.T.A. reagent, ml
0.05
3) MgCl2 reagent, ml
0.02
Mix well, centrifuge at 3000 R.P.M. for 20 minutes Separate the
supernatent by using a pipette. The clear supernatent is treated in the
similar way as for method for cholesterol and the absorbance is
measured at 500 nm.
Calculations :
O.D. Test
Serum HDL Cholesterol, mg/dl =
x 114
O.D. Std.
Additional Information:
Heparin and manganese chloride are also used as precipitating reagents for
HDL-Cholesterol determination.
Technical contents : Using kit of serum HDL cholesterol.
Method of teaching : Demonstration and its measurement of serum HDL
cholesterol by kit and taking readings. Using a colorimeter or semi auto
analyser.
Evaluation : Giving exercise of serum HDL cholesterol.
80
81. Chapter o. 19
Estimation of Enzymes in diagnosis of Myocardial infraction
Object : To make aware of LDH, CK, CKMB and their clinical significance.
Introduction:
Three enzymes are commonly used in the diagnosis and follow-up of
the MI. these are :
• Creatinine kinase (CK)
• Aspartate aminotransferase (AST)
• Lactate dehydrogenase (LDH).
Creatinine kinase levels rise rapidly in serum peaking at 24h., with slower
rises being shown by AST and LDH.
Creatine kinase
CK is also released from damaged skeletal muscle. Although the
predominant isoenzyme in cardiac muscle cells is the same as that in skeletal
muscle (CK-MM), heart cells contain another CK isoenzyme, CK-MB. This
isoenzyme is a more specific indicator of cardiac muscle damage, and is
increasingly used (rather than total CK) in the investigation of MI.
Aspartate and alanine aminotransterases
AST release is not specific to MI. but is also found in many acute
pathologies affecting the liver and skeletal muscle. The enzyme alanine
aminotransferase (ALT) is sometimes measured as part of the 'cardiac
81
82. enzyme' profile of test (fig. 1) ALT is found in high concentration in liver
rather than muscle, and normal ALT in the face of a raised AST confirms
that liver pathology is not contributing to the raised enzyme levels.
Approximately 25% of patients with pulmonary embolus, which features in
the differential diagnosis of MI and which may or may not cause chest pain,
show a raised AST concentration, and most also show an elevated LDH.
Lacate dehydrogenase
Like the other enzymes used in the diagnosis of MI. LDH. Is not specific to
cardiac muscle, being found in liver and red cells. Although there is a
measurable difference between the LDH1. Iosenzyme in heart and the LDH5,
isoenzyme in liver, the red cells can also release LDH1. blood for LDH
measurement must therefore not be allowed to remain unseparated before
analysis, or in vitro haemolysis will invalidate the LDH measurements.
Commercially available kits are now available for the detection of
these enzymes which can be assessed by semi and fully automatic analysers.
Technical contents : Using kit of serum LDH, CK and CKMB.
Method of teaching : Demonstration.
Evaluation :discussion on the above exercise.
82
83. Chapter no. 20
Estimation of Serum Calcium
Object : To estimation of serum calcium.
Introduction :
Calcium is present in serum in three forms – calcium bound to proteins,
calcium bount to other organic substances, e.g. citrate, and ionized calcium.
Most of the physiological functions of calcium depend upon the ionized
fraction, but for routine work only total calcium in serum is estimated. A
convenient and commonly used method is that of Clark and Collip*.
Principle:
Serum is treated with ammonium oxalate to precipitate calcium as calcium
oxalate. The precipitate is washed with ammonia to remove excess oxalate
and then treated with sulphuric acid to convert calcium oxalate into oxalic
acid. The latter is titrated with standard potassium permanganate.
Reagents:
1) Ammonium oxalate, 4% - 4 gm of ammonium oxalate is dissolved in
water and diluted to 100 ml.
2) Ammonia, 2% - 2 ml of conc. ammonia (S.G. 0.880) is diluted to 100
ml with water.
3) Sulphuric acid, 1 N-28 ml of conc. sulphuric acid is diluted to 1,000
ml with water.
83
84. 4) Stock potassium permanganate, 0.1 N-3.158 gm of potassium
permanaganate is dissolved in water and diluted to 1,000 ml. This is
allowed to stand for one week and then filtered through asbestos.
5) Potassium permanganate, 0.01 N-10 ml of 0.1 N potassium
permanganate is diluted to 100 ml with water and standardized against
0.01 N sodium oxalate. 1 ml of 0.01 N potassium permanaganate is
equivalent to 0.2 mg of calcium.
6) Sodium oxalate, 0.01 N-0.67 gm of sodium oxalate is dissolved in
water. 5 ml conc. sulphuric acid is added. The volume is made up to
1,000 ml with water (1 ml of 0.01 N sodium oxalate = 1 ml of 0.01 N
potassium permanganate.
Procedure:
Measure 2 ml of serum, 2 ml of water and 1 ml of 4% ammonium oxalate in
a centrifuge tube. Mix thoroughly and allow to stand for at least half an
hour. Mix again and centrifuge at 1,500 r.p.m. for 15 minutes. Pour off the
supernatant fluid and drain the tube by keeping it inverted on a filter paper
for a few minutes. Wipe the mouth of the tube dry with a filer paper. Add 3
ml of 2% ammonia, shake, centrifuge and drain as before. Add 2 ml of 1 N
sulphuric acid and shake vigorously. Keep the tube in a boiling water-bath
shaking intermittently, until the precipitate completely dissolves. While the
tube is still hot, titrate with 0.01 N potassium permanganate until a pink
colour develops and persists for at least one minute. Note the volume of 0.01
N potassium permanganate used. Suppose it is x ml. For blank, take 2 ml of
1 N sulphuric acid and titrate it with 0.01 N potassium permanganate exactly
as before, suppose the volume of potassium permanganate used in y ml.
84
85. 0.2
Serum calcium (mg/100 ml) = (x-y) x
x 100
2
= (x-y) x 10
Interpretation :
Serum calcium varies from 9 – 11 mg/100 ml in healthy persons. The
product of serum calcium and serum inorganic phosphorus is around 40 in
adults and 50 in children. A change in the concentration of one is usually
accompanied by an opposite change in the concentration of the other.
A rise in serum calcium is seen in hyperparathyroidism,
hypervitaminosis D, multiple myeloma, extensive metastatic involvement of
bones, sarcoidosis, idiopathic infantile hypercalcaemia, milk and alkali
syndrome, and polycythaemia.
Serum
calcium
decreases
in
hypoparathyroidism,
rickets,
osteomalacia, steatorrhoea, nephritic syndrome, renal failure, acute
pancreatitis and starvation. In rickets, the product of serum calcium and
phosphorus decreases, usually bellow 30.
Technical contents : Using kit of serum Calcium.
Method of teaching : Demonstration and its measurement of serum
Calcium by kit and taking readings. Using a colorimeter or semi auto
analyser.
Evaluation : Giving exercise of serum Calcium.
85
86. Chapter o. 21
Estimation of Serum Phosphorus (Inorganic)
Object : To estimation serum phosphorus.
Introduction :
Phosphorus is present in blood as inorganic phosphate and in combination
with several organic compounds including carbohydrates, lipids and
nucleotides. Inorganic phosphorus is present mainly in serum. Two methods
are described below for its estimation.
Method of Fiske and Subbarow*
Principle:
Serum is deproteinized with trichloracetic acid. Protein-free filtrate is treated
with
acid
molybdate
which
combines
with
phosphate
to
form
phosphomolybdic acid. This is reduced by 1, 2, 4-aminonaphtholsulphonic
acid to blue coloured phosphomolybdous acid (molybdenum blue). The
intensity of the colour is measured colorimetrically.
Reagents:
1) Trichloracetic acid, 10% - 10 gm of trichloracetic acid is dissolved in
water and dilute to 100 ml.
2) Molybdate reagent – 25 gm of ammonium molybdate is dissolved in
200 ml of water and added to 300 ml of 10 N sulphuric acid. The
volume is made up to 1,000 ml with water.
3) Aminonaphtholsulphonic acid – 59.5 gm of sodium bisulphate and 2
gm of anhydrous sodium sulphite are dissolved in water and dilute to
86
87. 250 ml. 1 gm of recrystallized 1, 2, 4-aminonaphtholsuphonic acid is
dissolved in the above solution and dilute to 400 ml with water.
4) Stock standard phosphorus solution – 0.351 gm of potassium
dihydrogen phosphate is dissolved in water. 10 ml of 10 N sulphuric
acid is added. The volume is made up to 1,000 ml with water. 5 ml of
this solution contains 0.4 mg of phosphorus.
5) Working standard phosphorus solution – 5 ml of the stock standard
phosphorus solution is dilute to 100 ml with 10% trichloracetic acid. 5
ml of this solution contains 0.02 mg of phosphorus.
Procedure :
Measure 9 ml of 10 % trichloracetic acid in a test tube. Add 1 ml of serum
drop by drop with constant shaking. Filter. Transfer 5 ml of the filtrate to a
tube labeled 'Unknown'. Pipette 5 ml of the working standard phosphorus
solution into a tube labeled 'Standard' and 5 ml of 10% trichloracetic acid
into a tube labeled 'Blank'. To each tube, and 3.6 ml of water. Mix after each
addition. Let the tubes stand for 5 minutes.
Read 'Unknown' and 'Standard' against 'Blank' at 680 nm or using a
red filter.
Calculation :
Serum inorganic phosphorus (mg/100 ml)
Au
=
0.02
x
As
x 100
0.5
Au
=
x 4
As
87
88. Interpretation :
The normal range of serum inorganic phosphorus is 2.5 – 4.5 mg/100 ml in
adults and 4 – 6 mg/100 ml in children.
Serum
inorganic
phosphorus
rises
in
hypervitaminosis
D,
hypoparathyroidism, renal failure and during healing of fractures.
Serum
inorganic
phosphorus
falls
in
rickets,
osteomalacia,
steatorrhoea, hyperparathyroidism, fanconi syndrome, renal tubular acidosis
and after injection of insulin.
Technical contents : Using kit of serum phosphorus.
Method of teaching : Demonstration and its measurement of serum
phosphorus by kit and taking readings. Using a colorimeter or semi auto
analyser.
Evaluation : Giving exercise of serum phosphorus.
88
89. Chapter o. 22
Estimation Of Serum Uric Acid
Object: To estimate serum uric acid.
Introduction:
Uric Acid is the end product of purine metabolism in man formed by
oxidation of Purine bases.
Caraway's Method of Estimation:
Principle:- Phosphotungstic acid in alkaline medium oxidizes uric acid to
allantion and itself gets reduced to tungsten blue which is estimated
colorimetrically at 700mm.
Reagents :
(1)
Sodium tungstate 10%.
(2)
2/3 N Sulphuric acid.
(3)
Tungstic acid: Add 50ml of 10% sodium tungstate 50ml 2/3 N H2SO4
and a drop of phosphoric acid with mixing to 800ml water. Discard
when cloudy. Store in brown bottle.
(4)
Phosphotungstic acid: Stock-Dissolve 50g sodium tungstate in about
400ml of water. Add 40ml 85% phosphoric acid and reflux gently for
2 hours, cool, make volume to 500m. store in brown bottle. Dilute 1
to 1 for use.
(5)
Na3CO3 10%.
(6)
Standard uric acid solution stock-100mg%.
(7)
Working uric acid solution-1mg%.
89