Download as PDF, PPTX

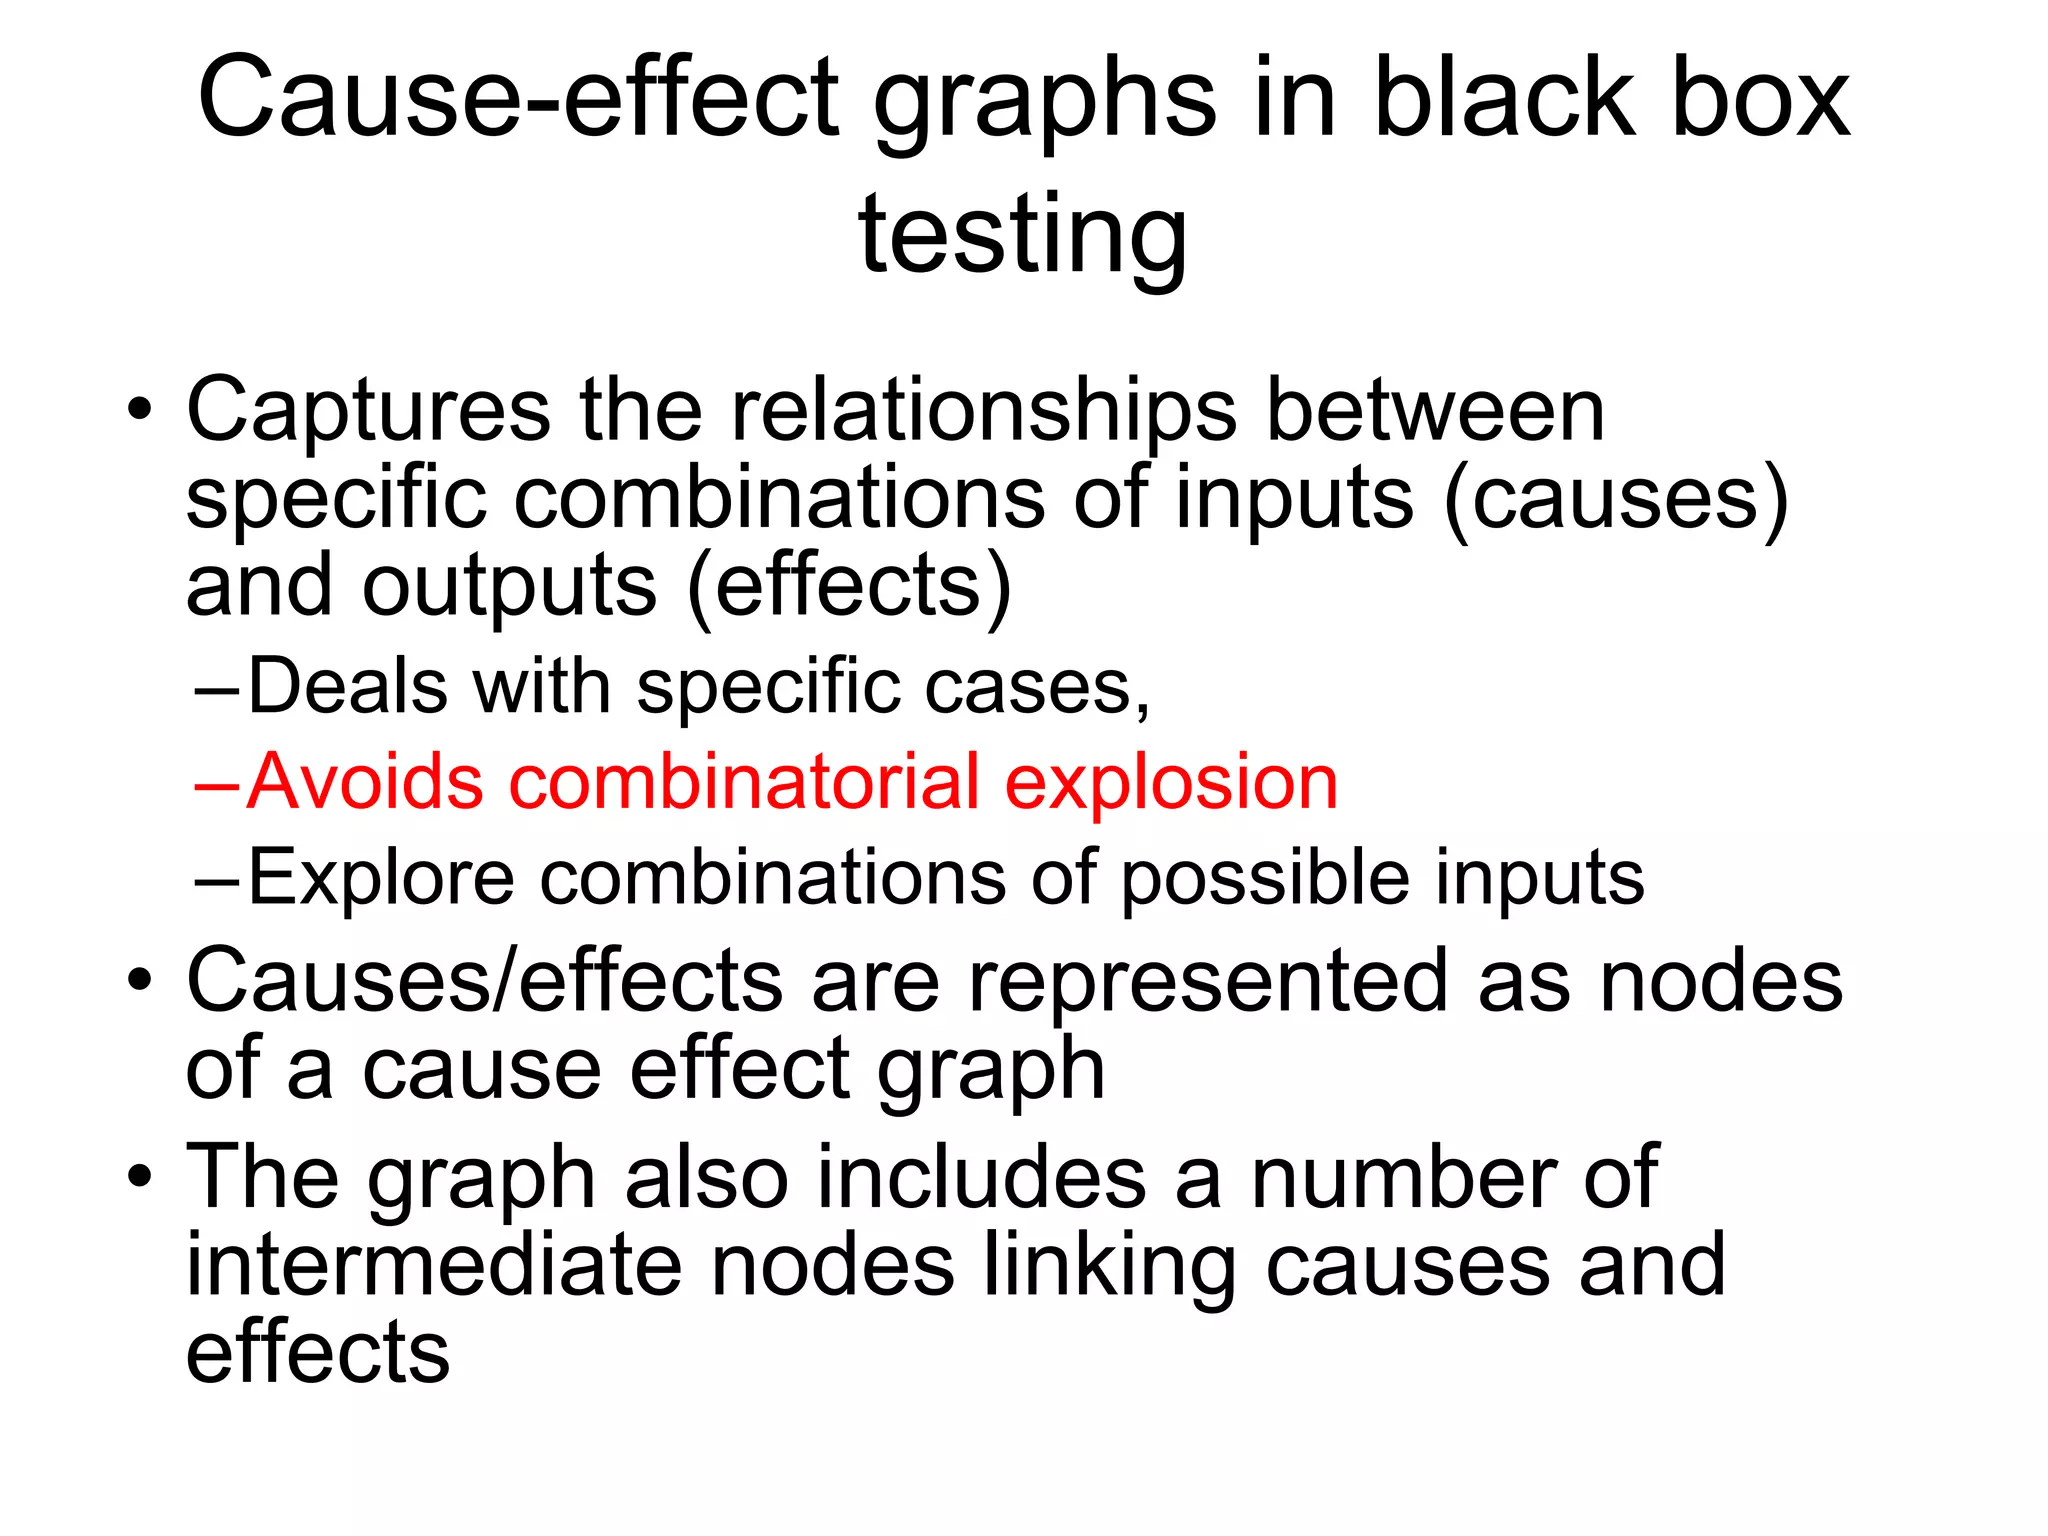
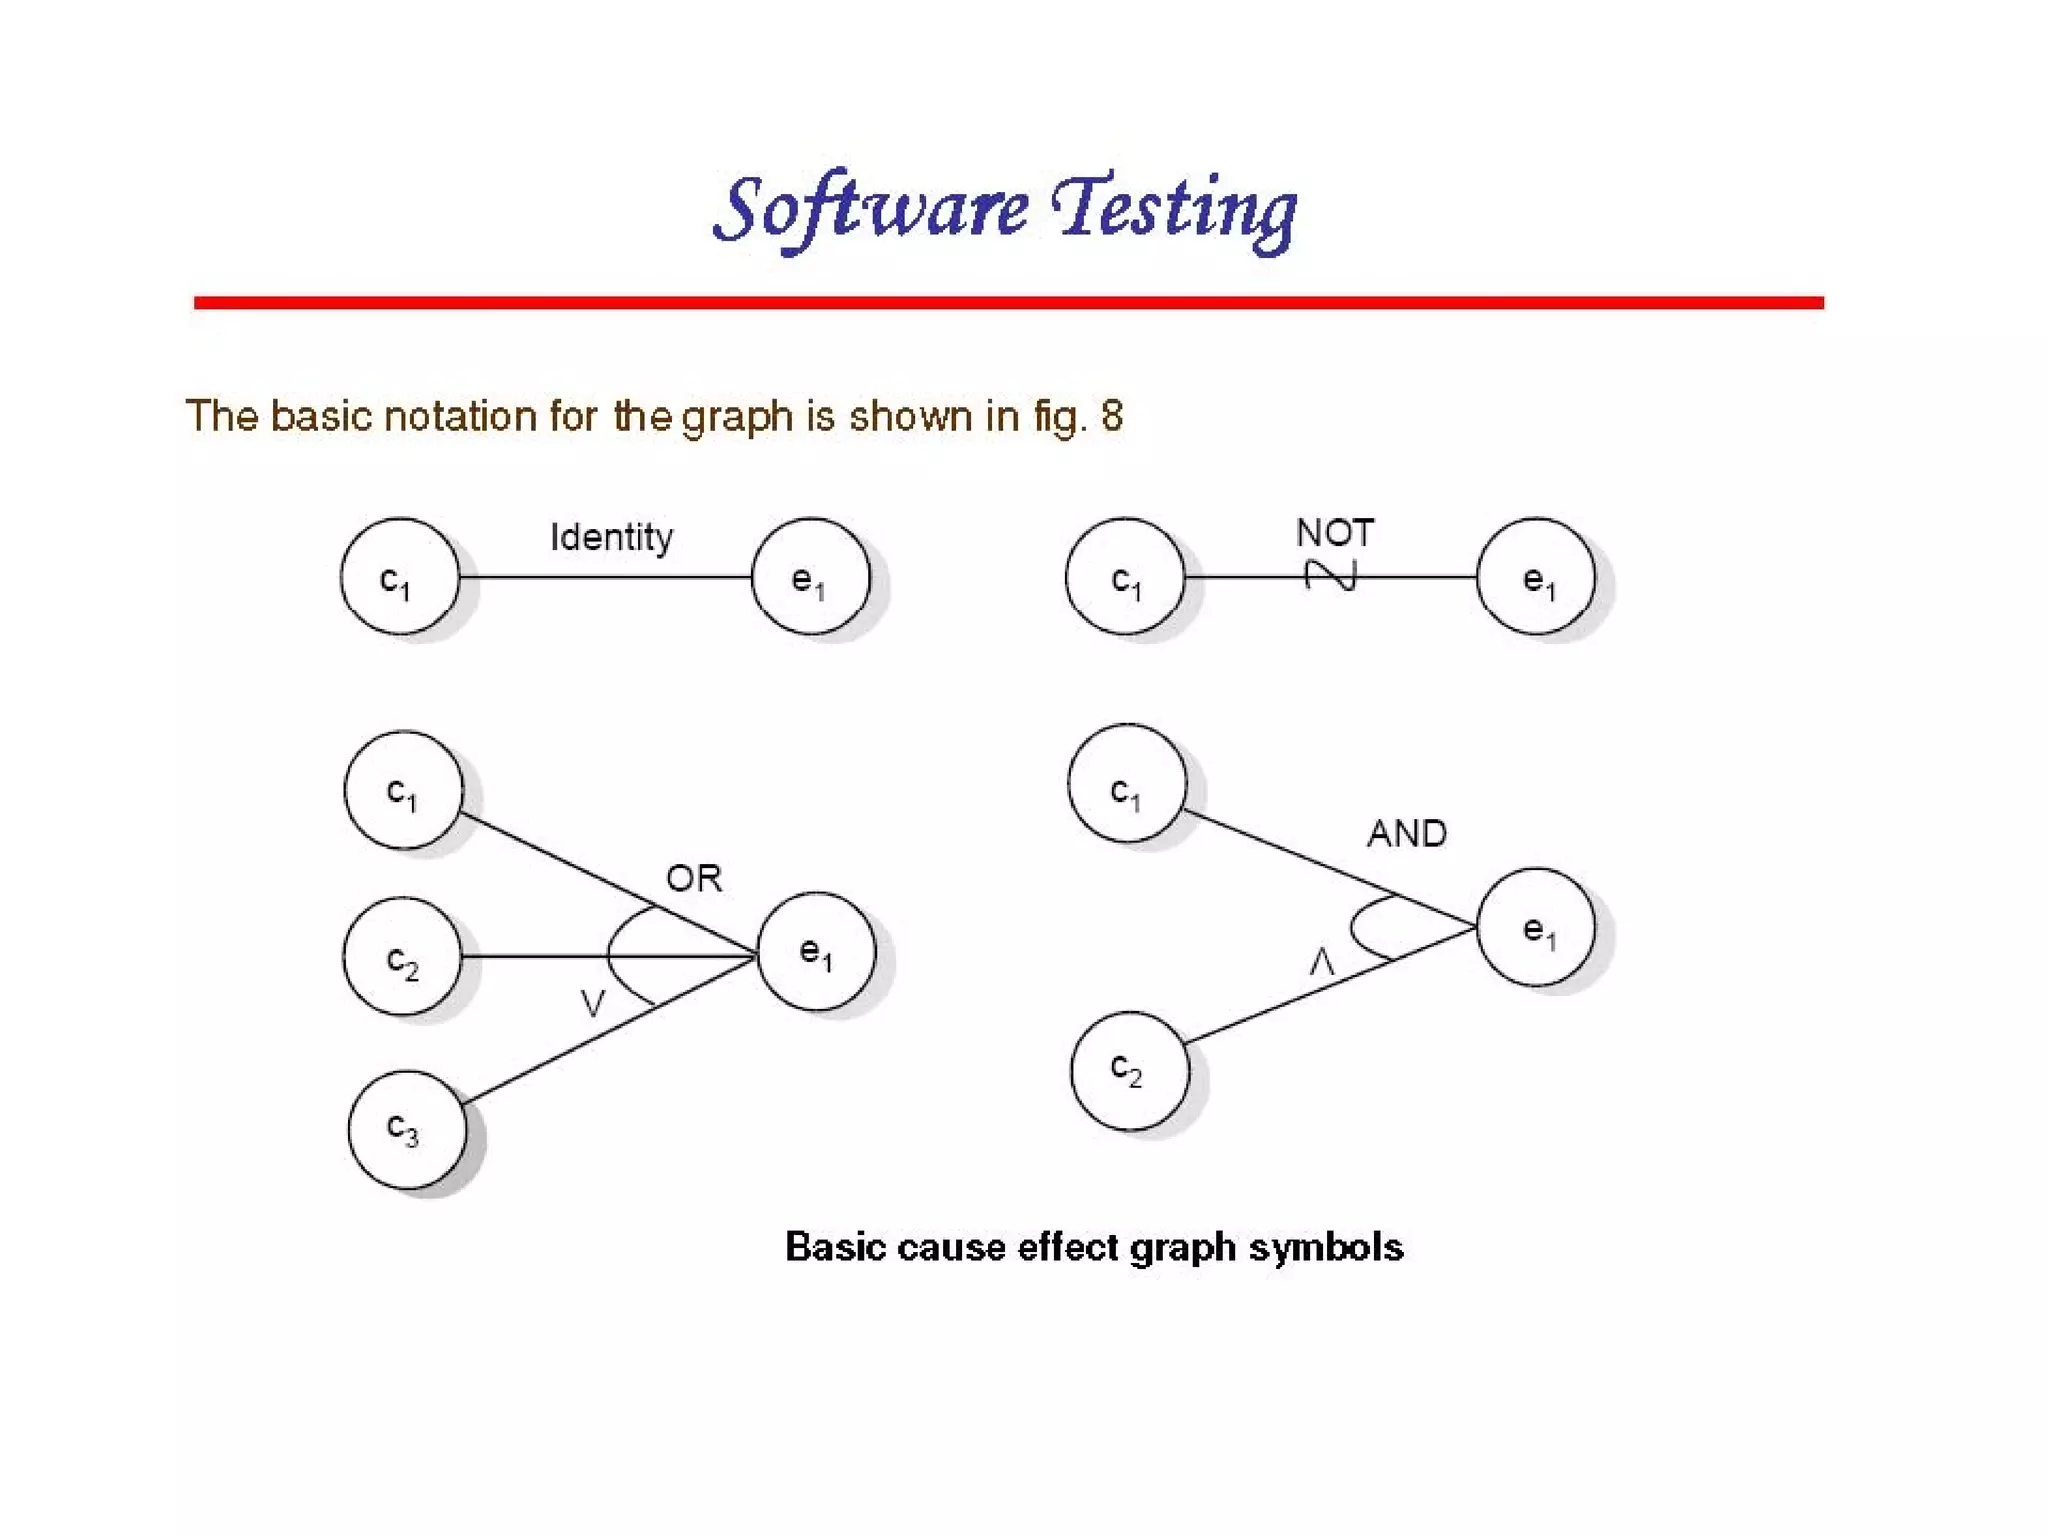
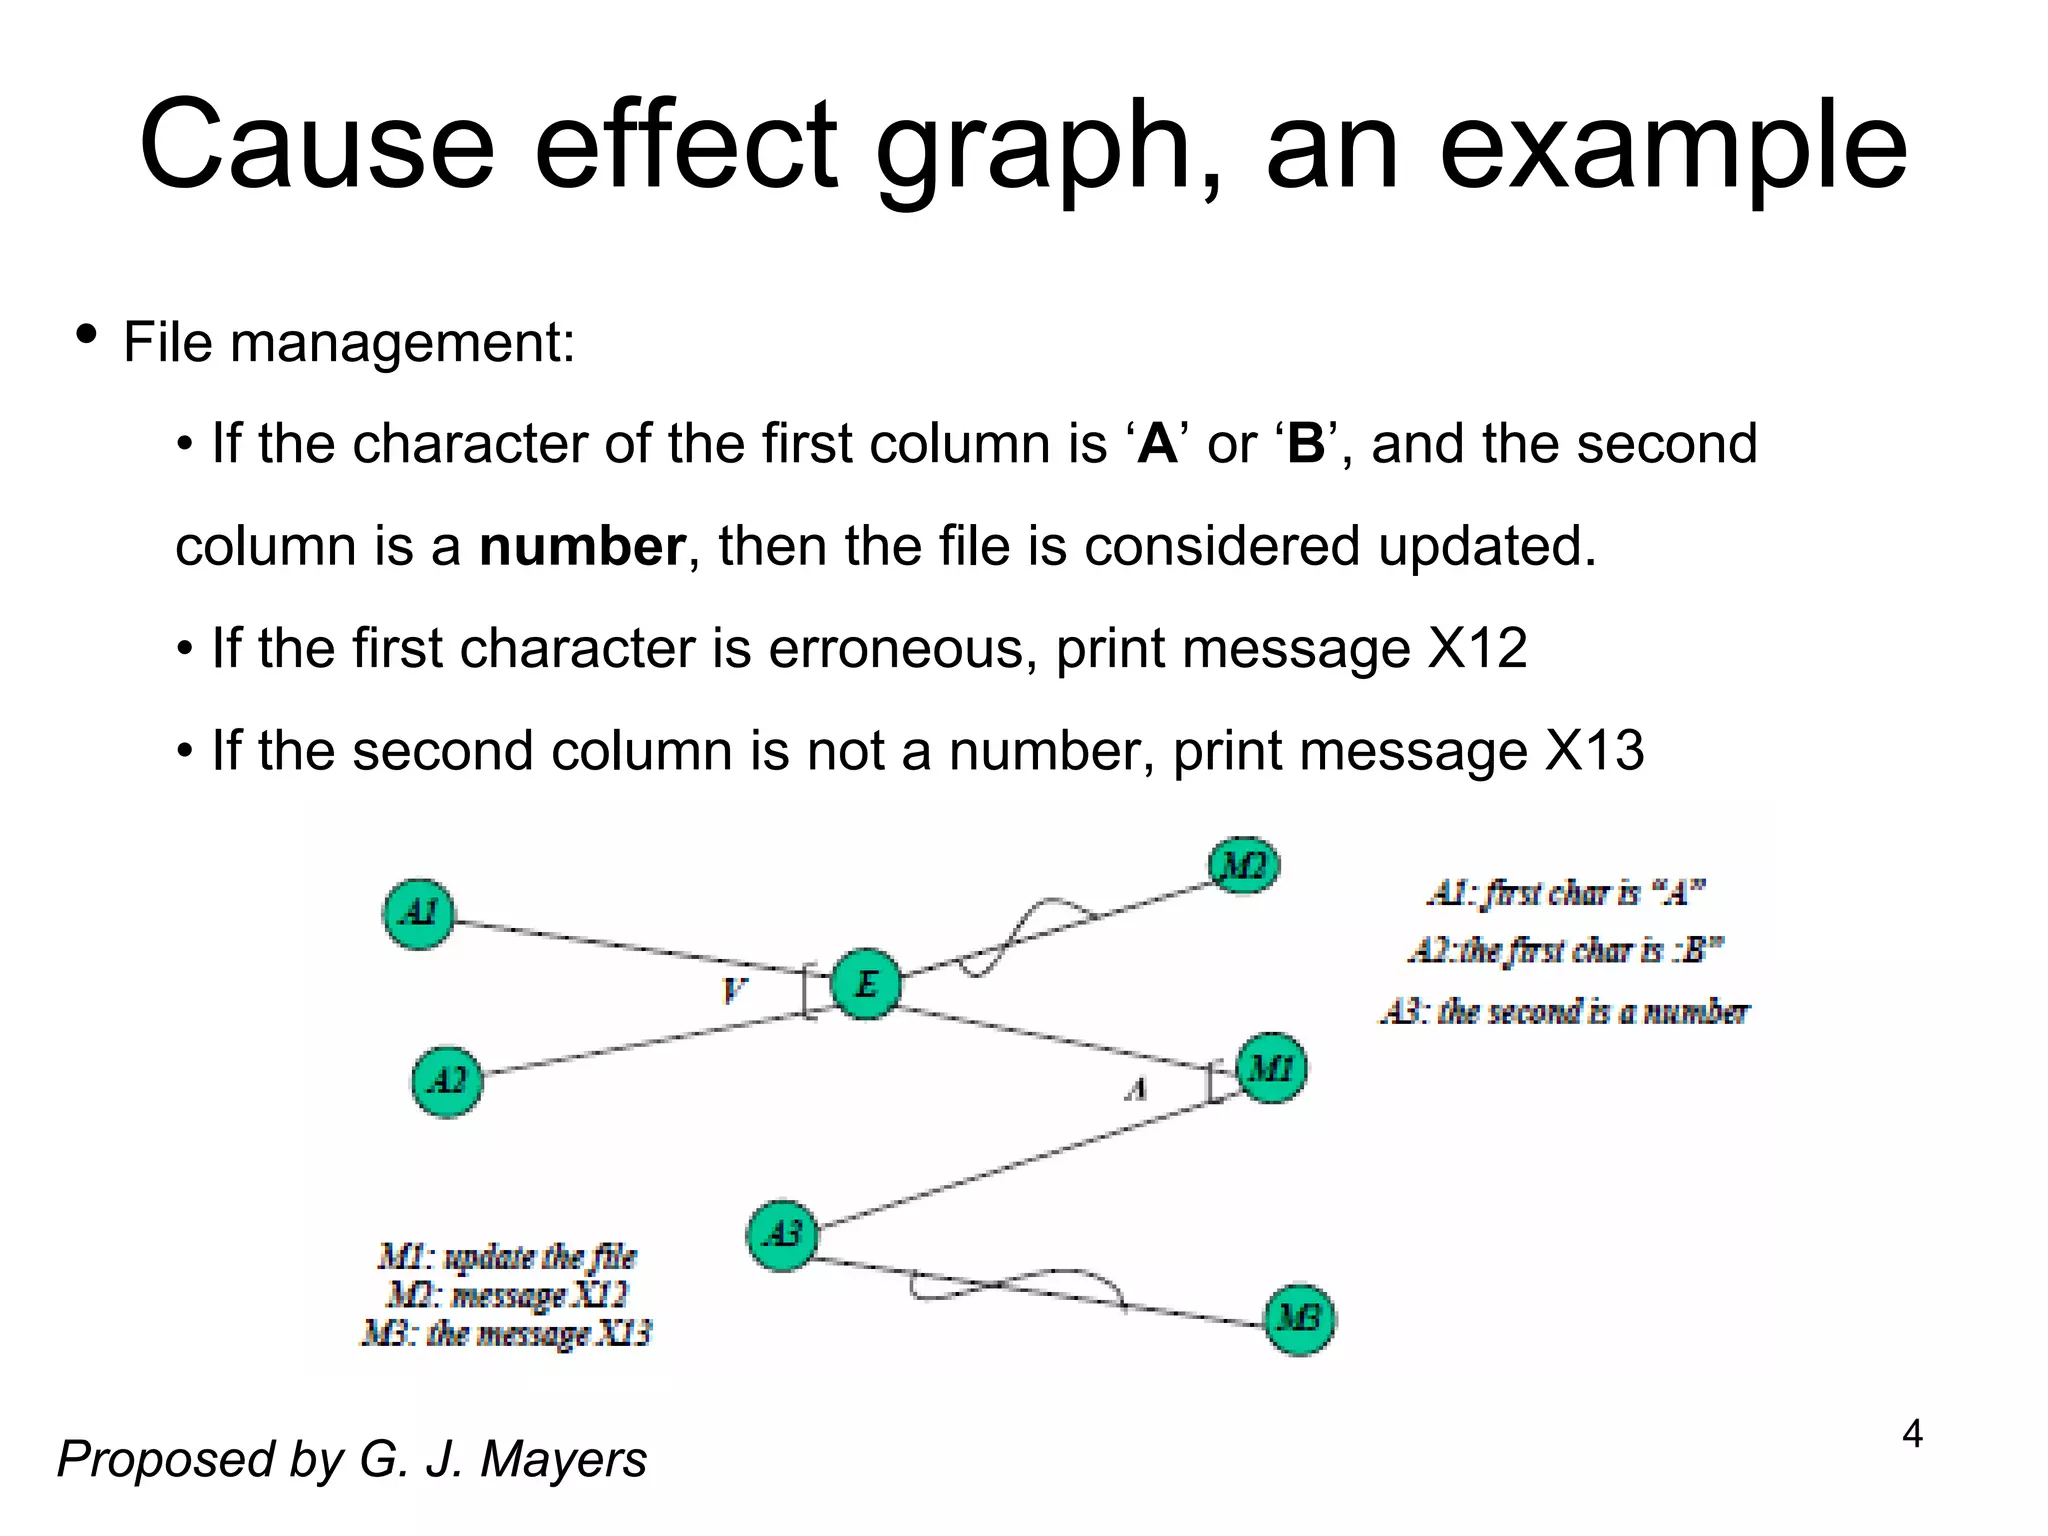
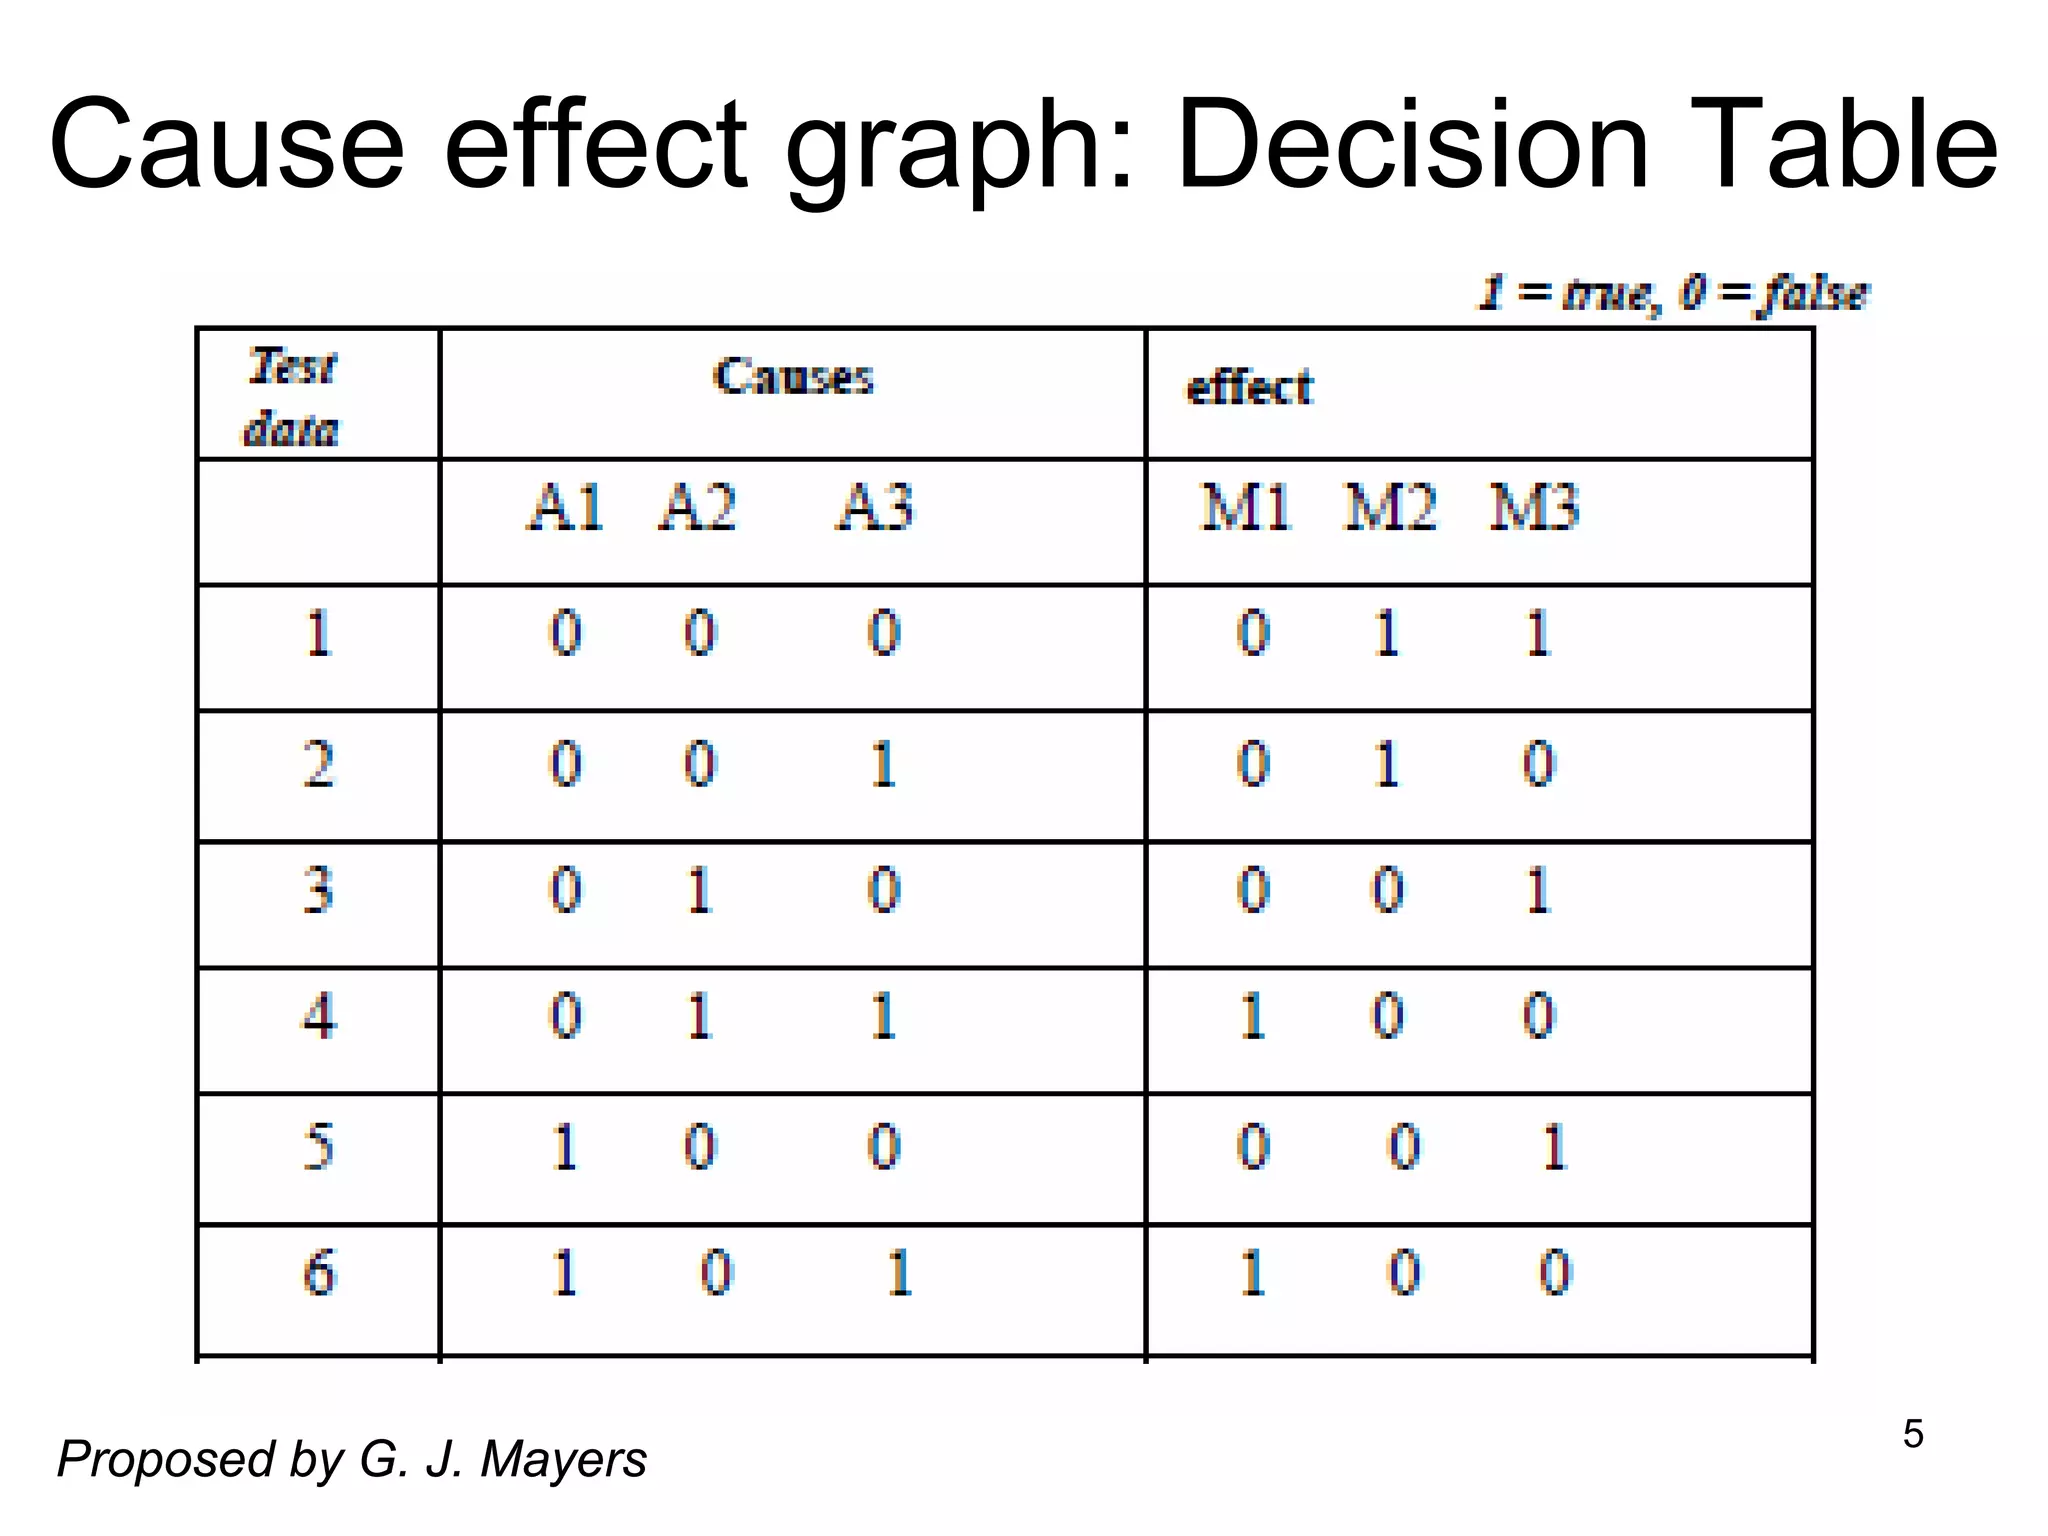
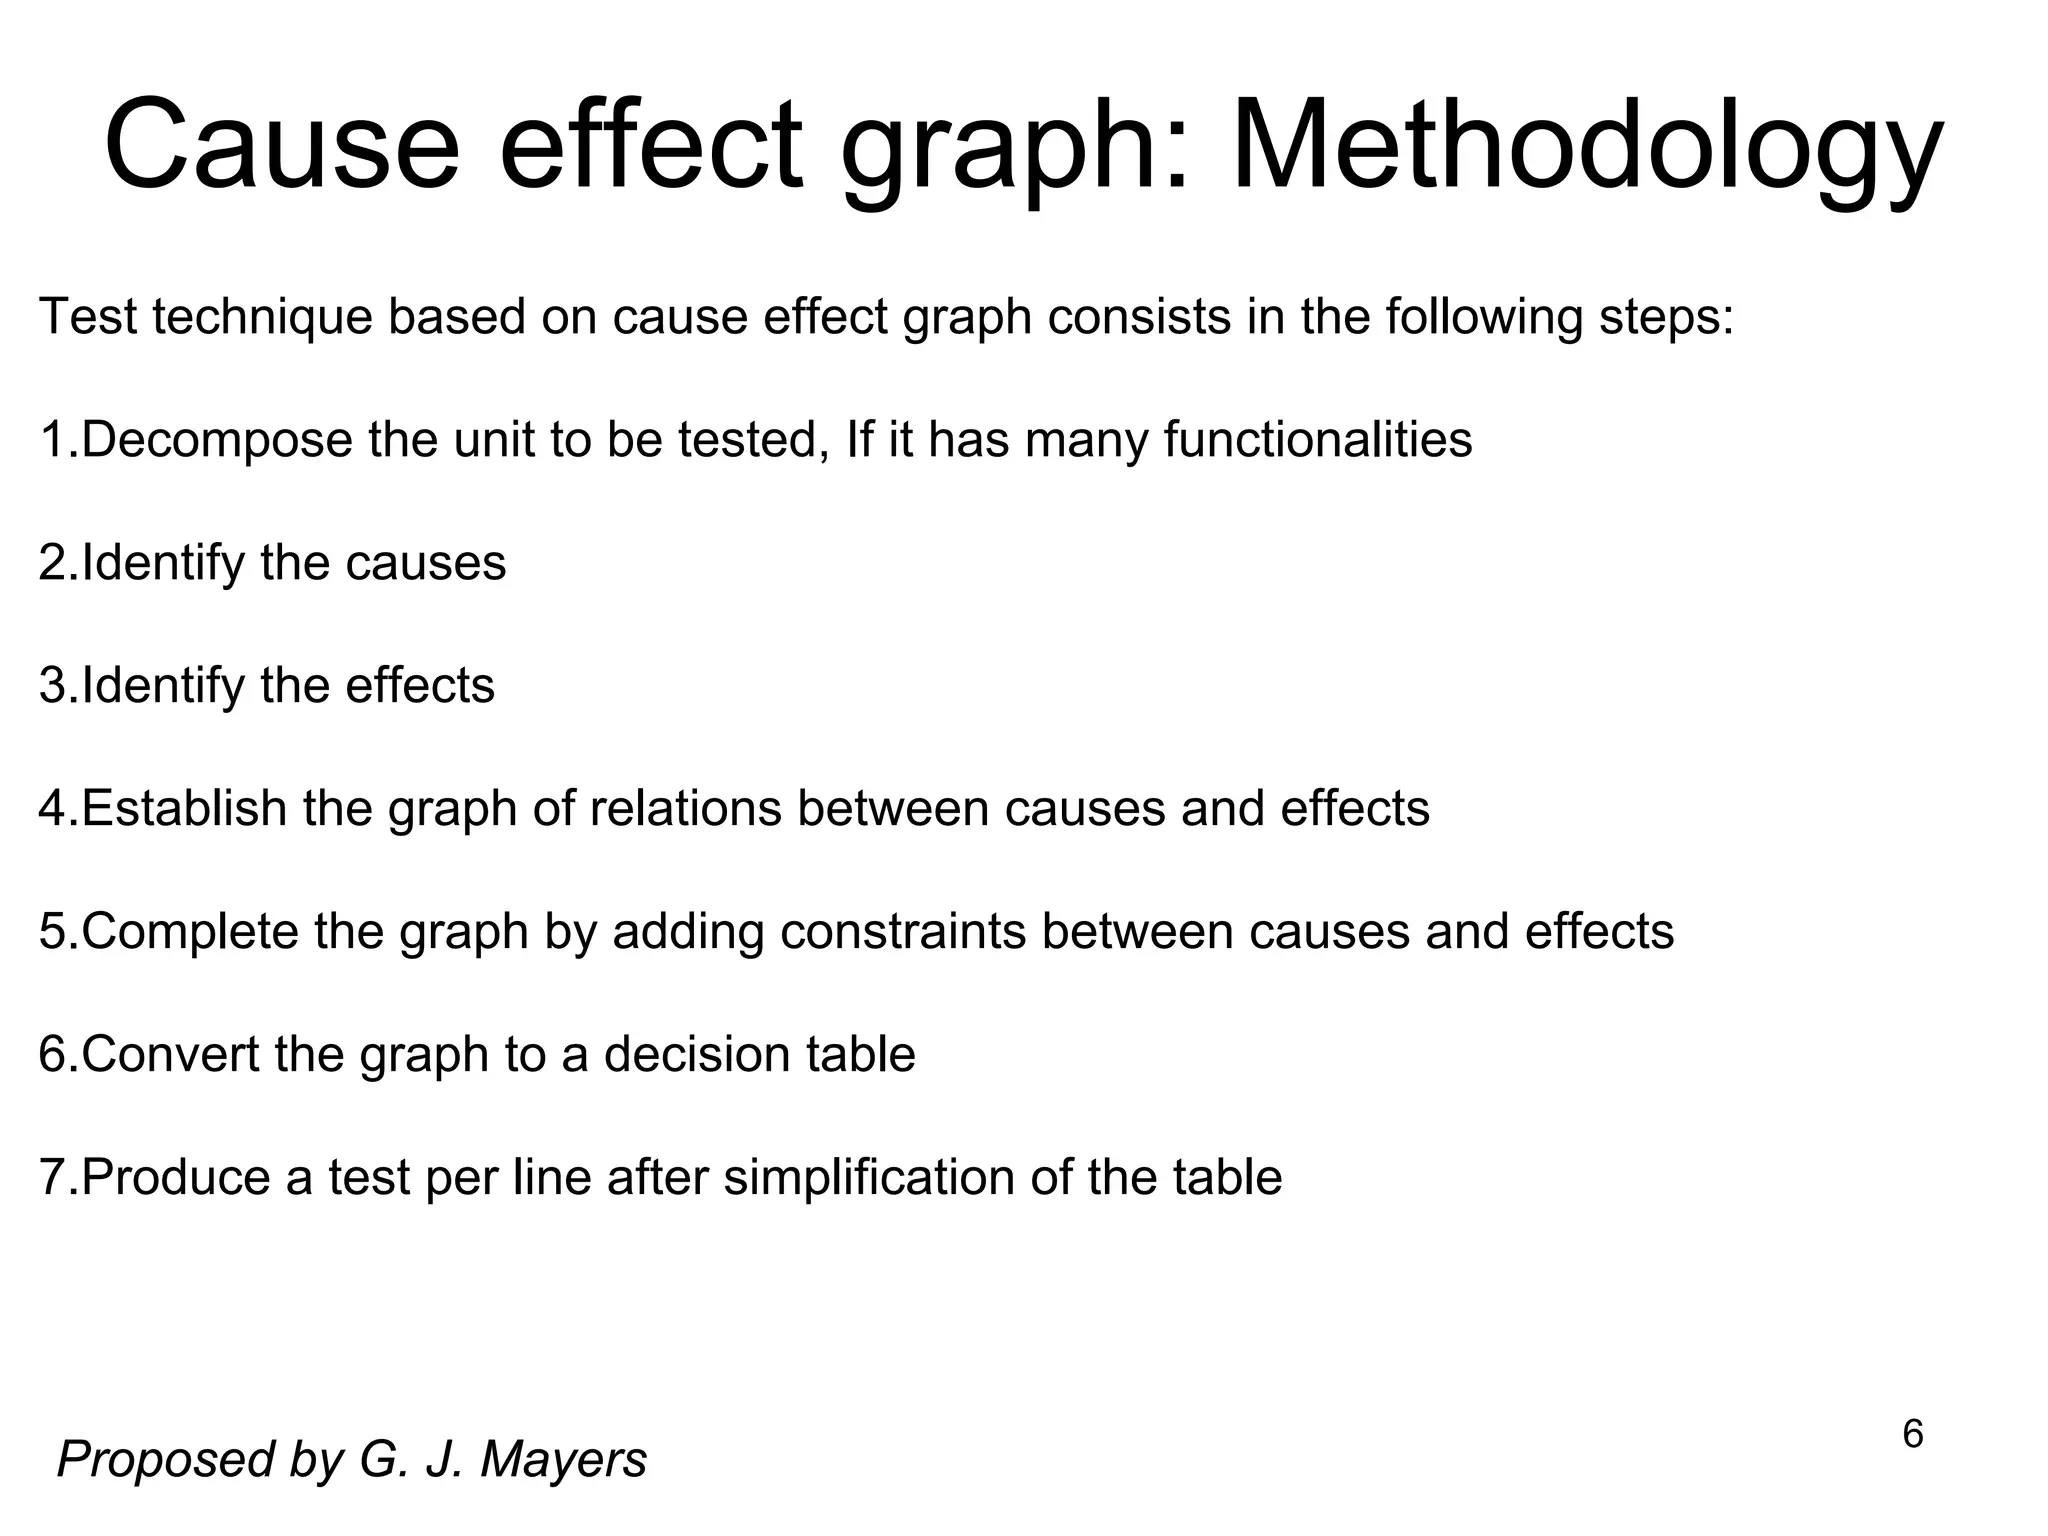
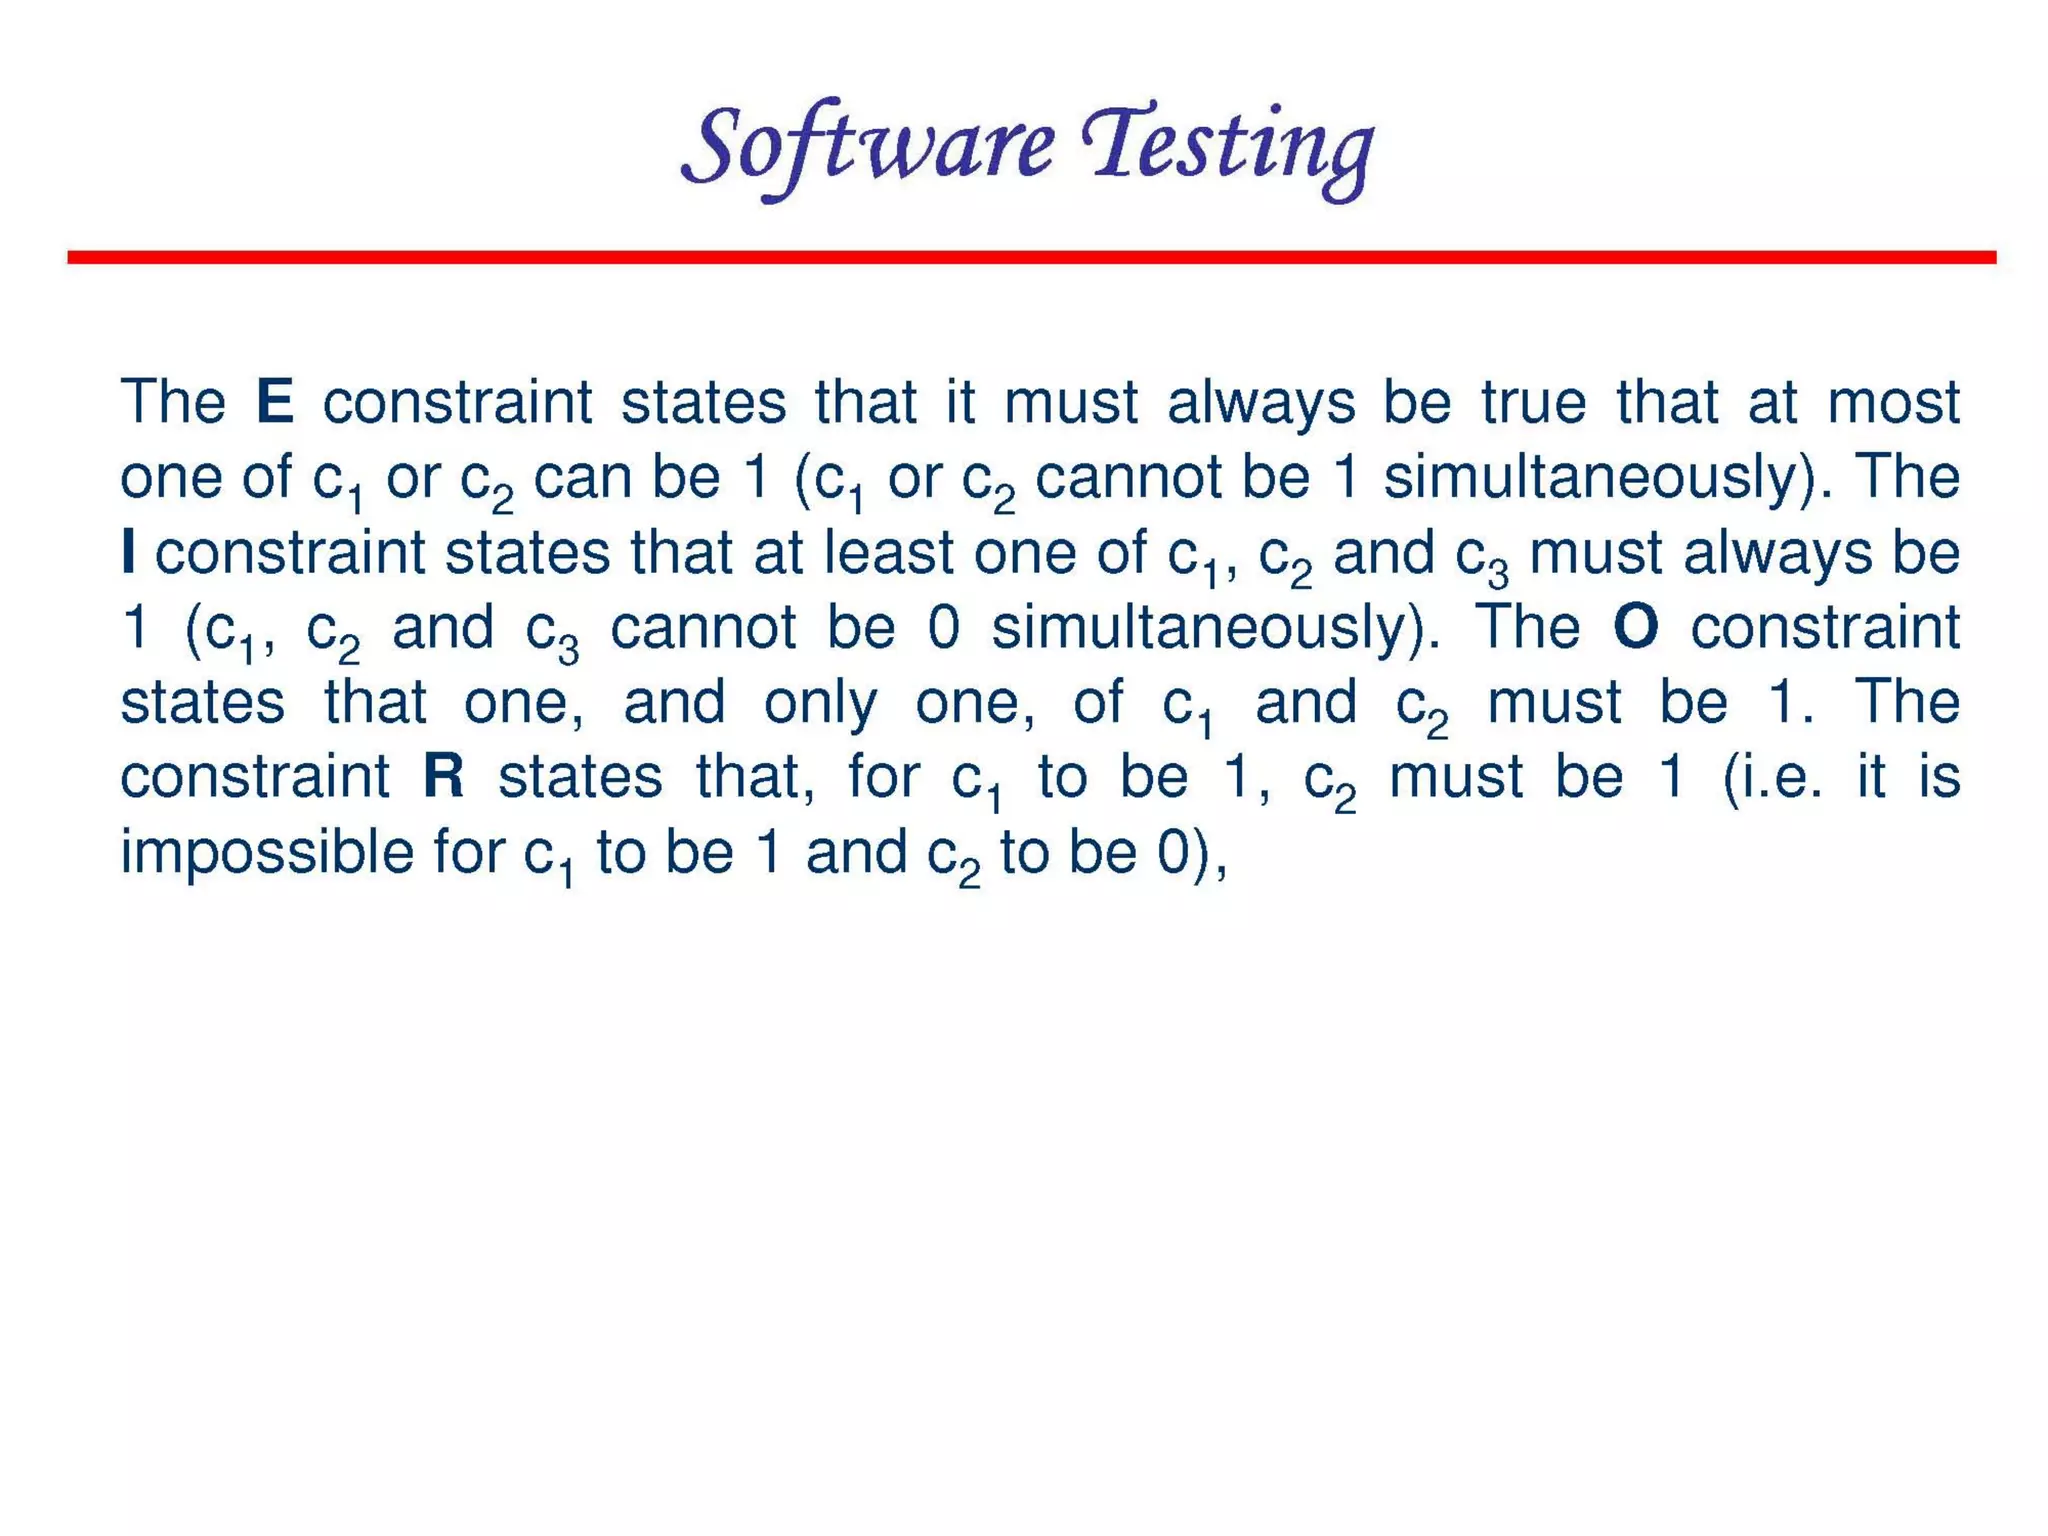
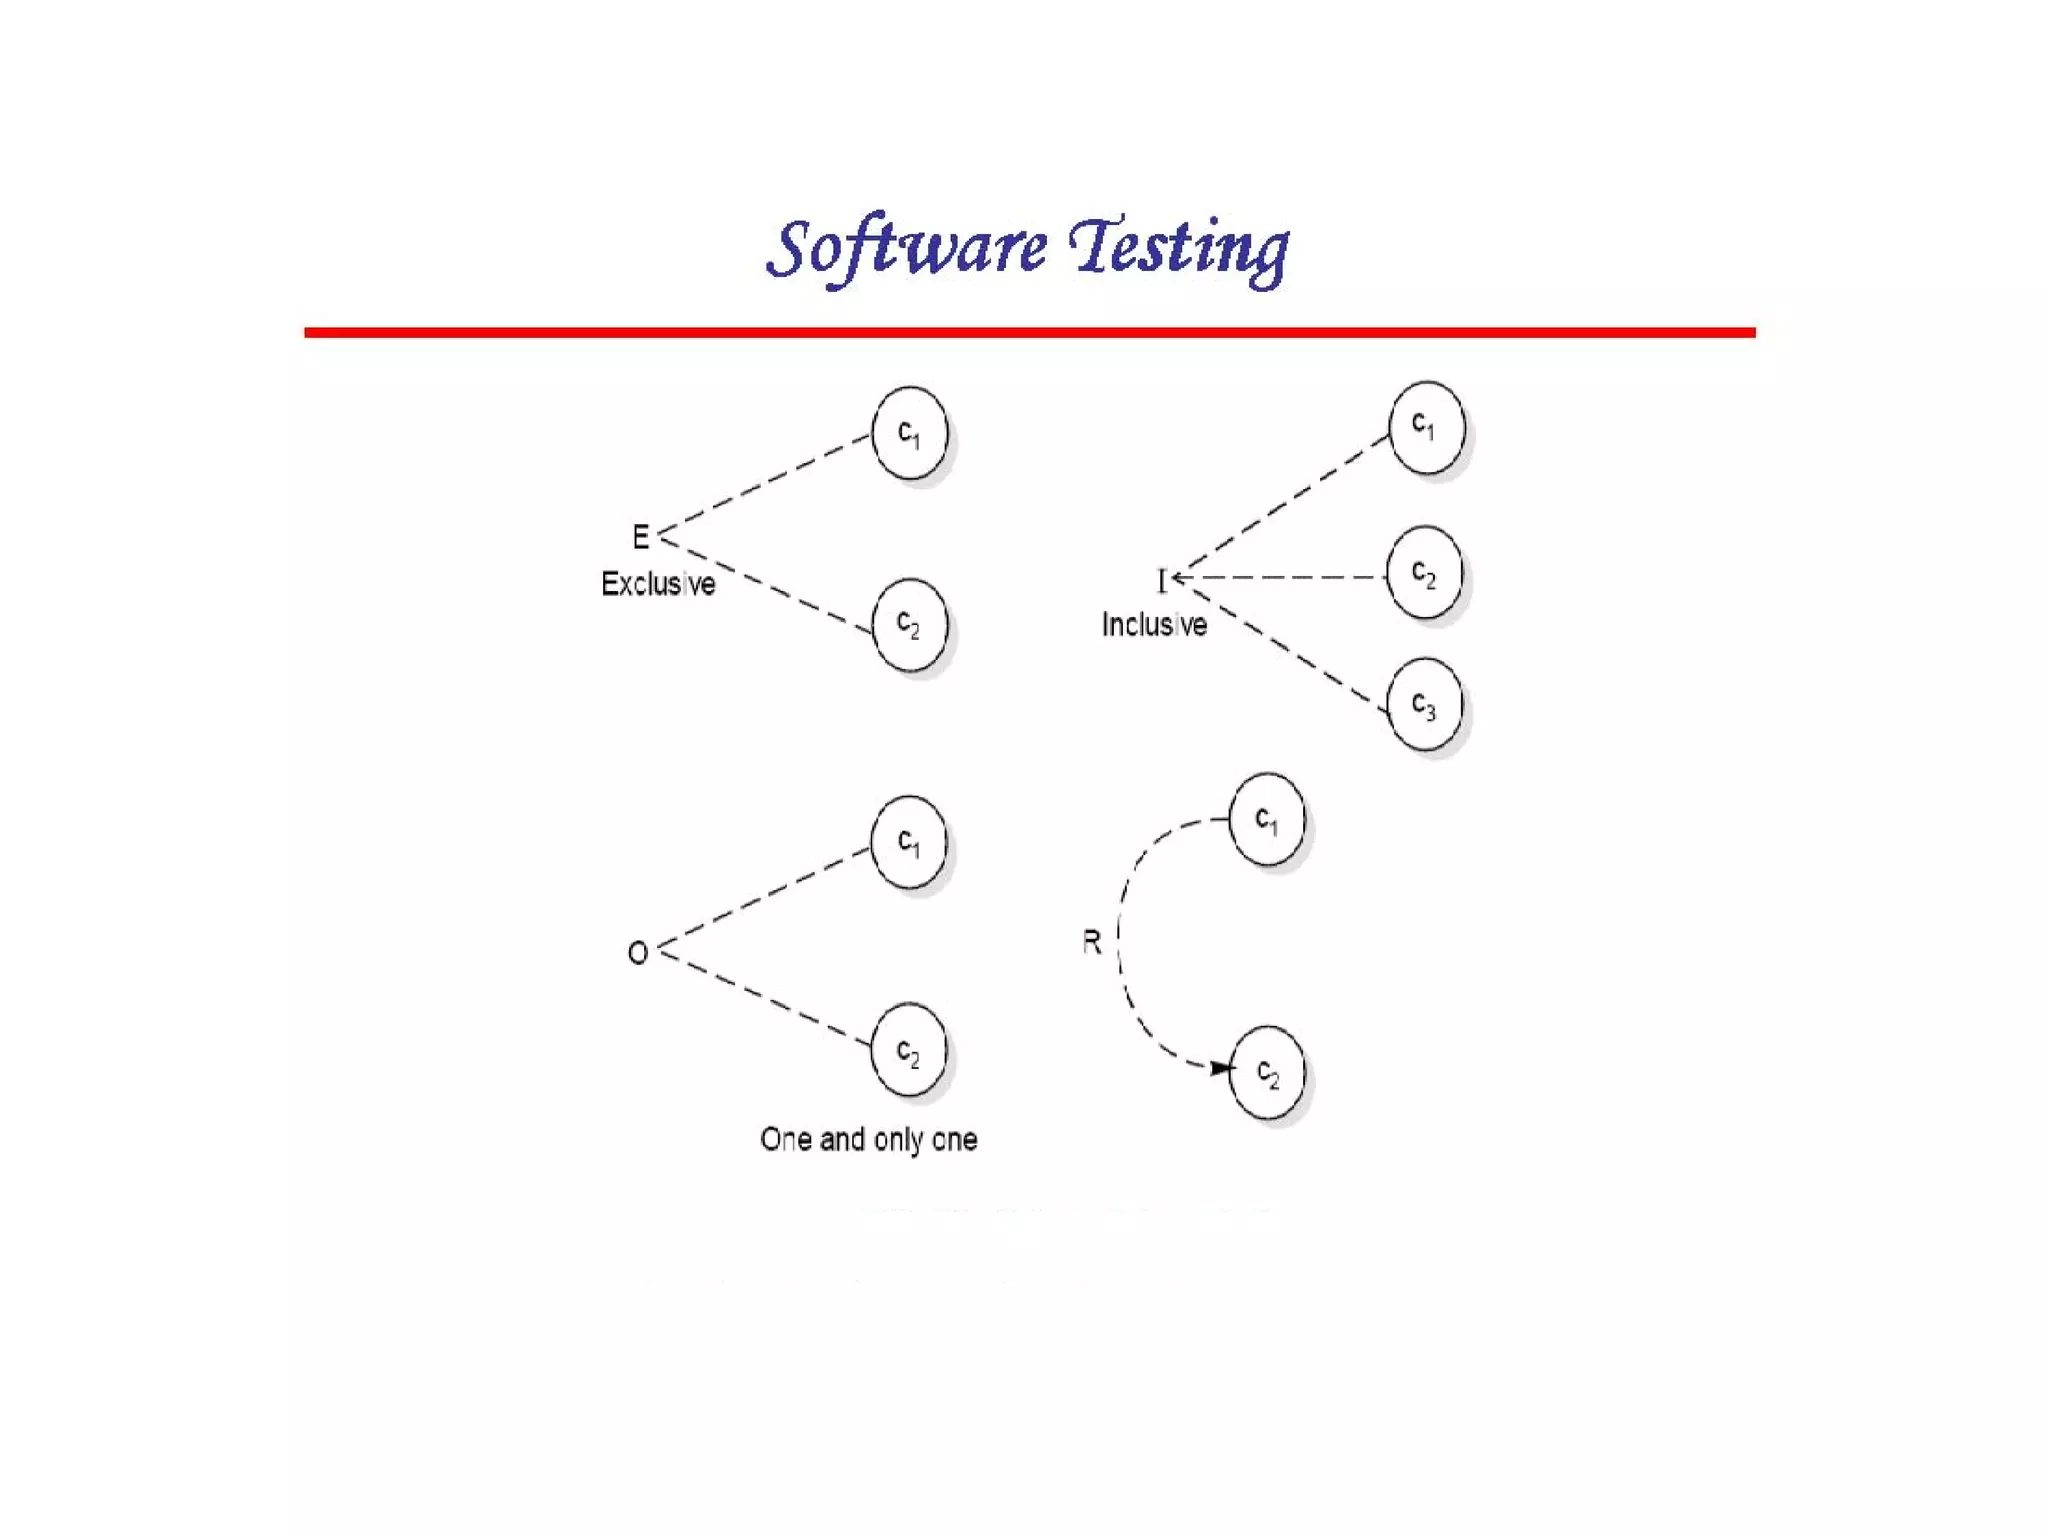
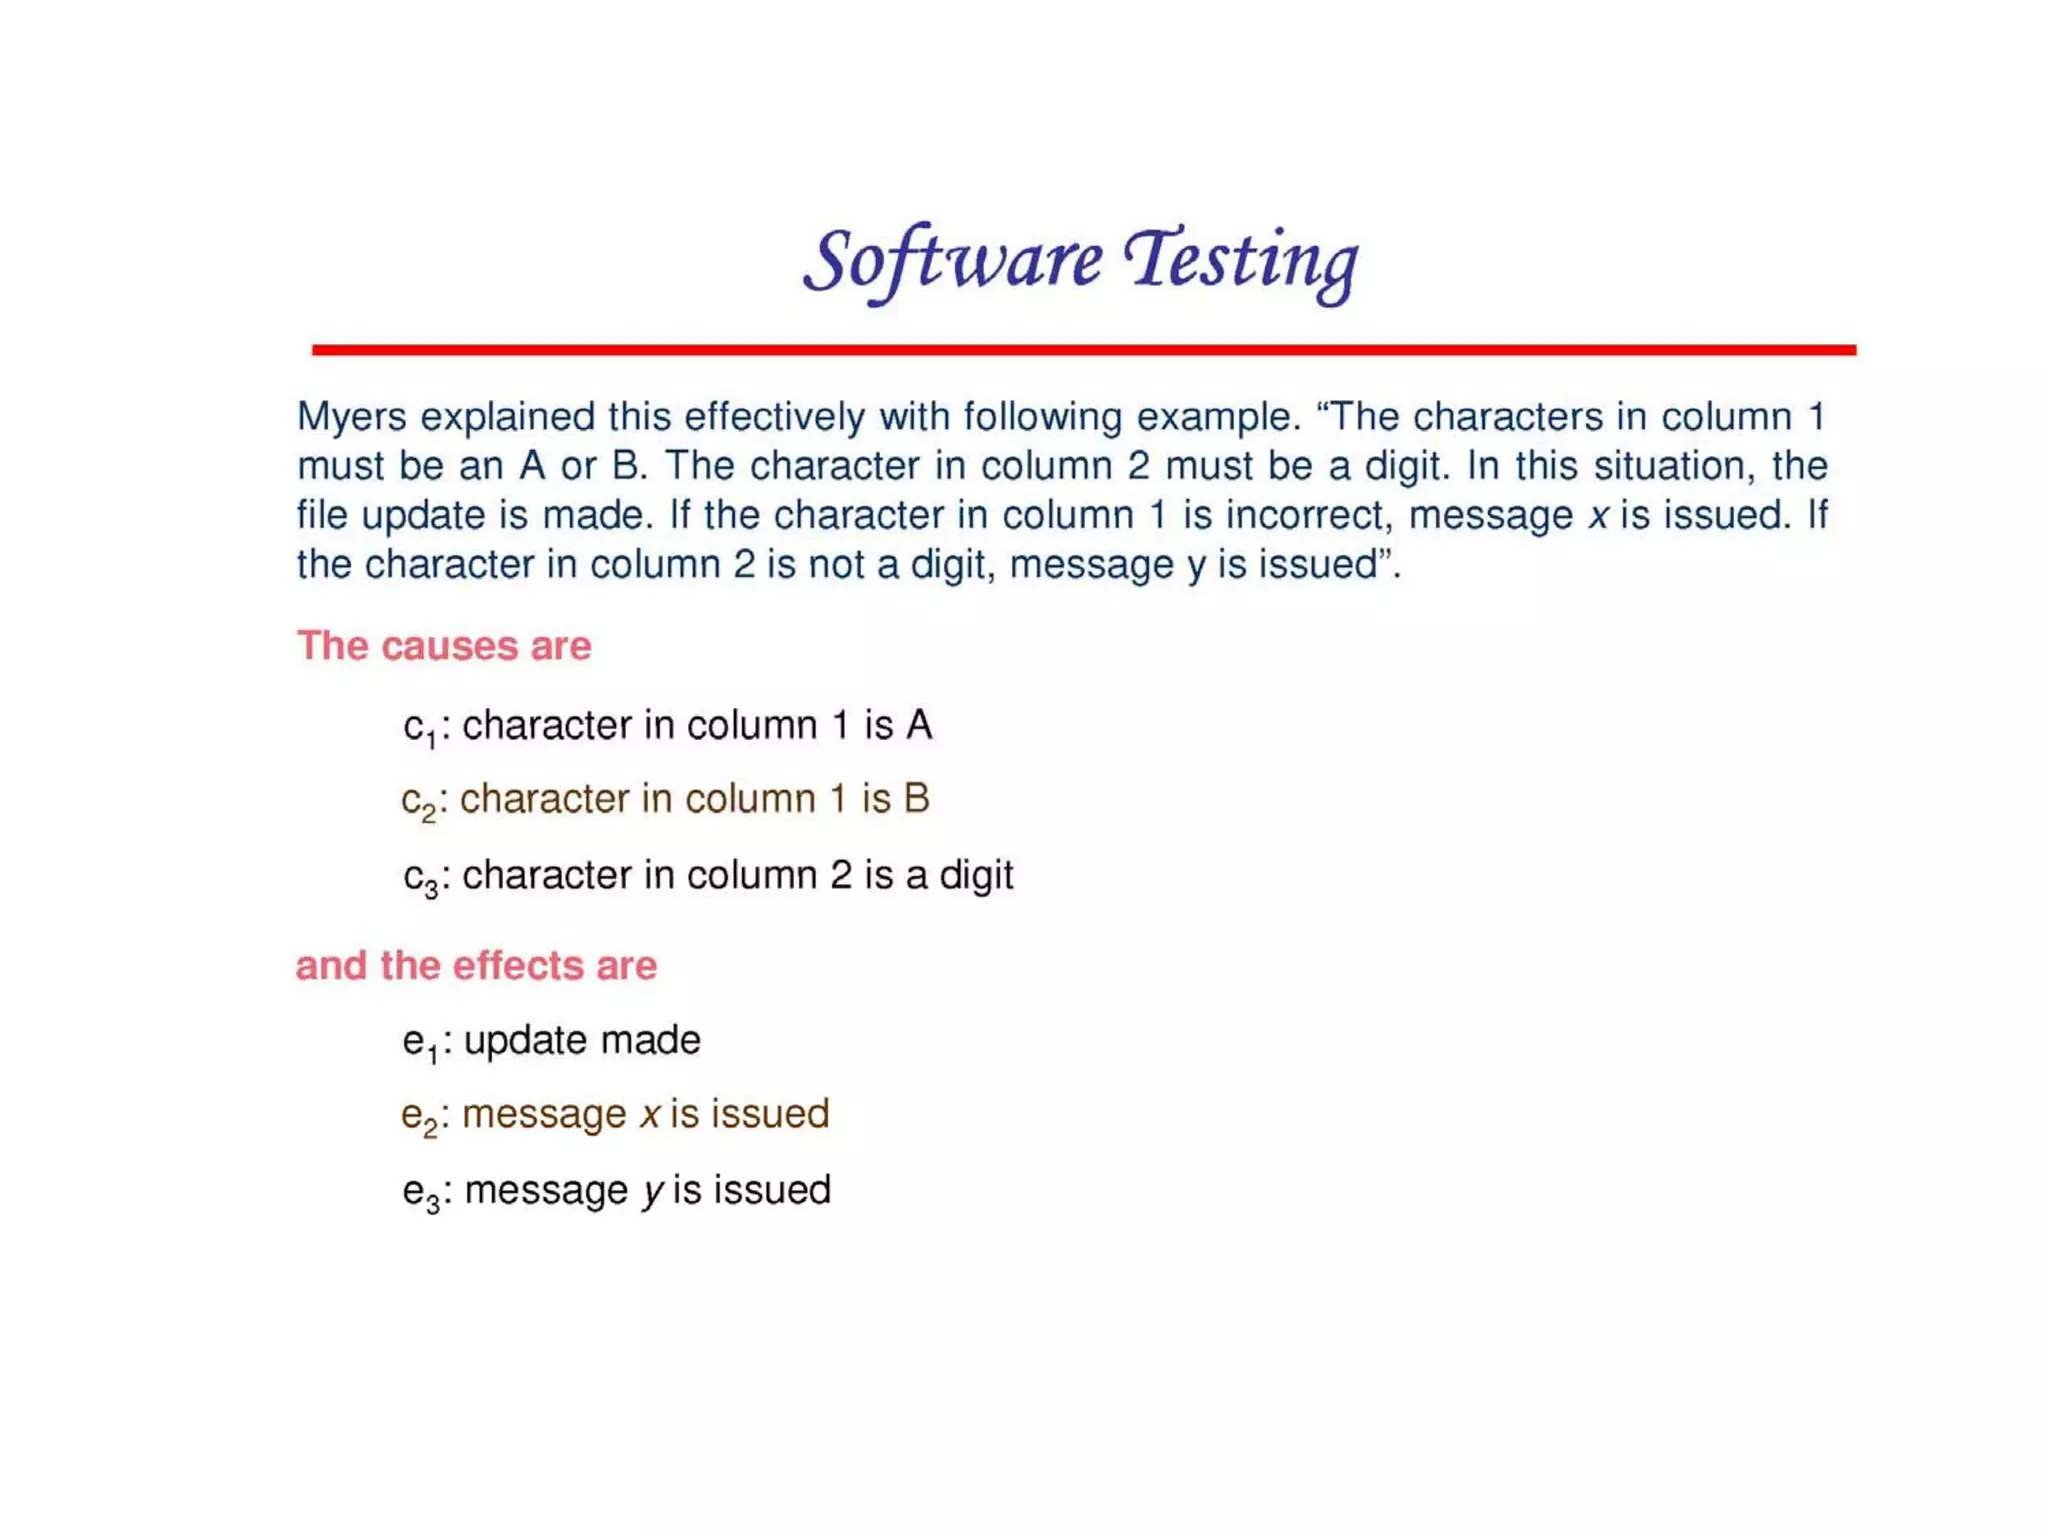
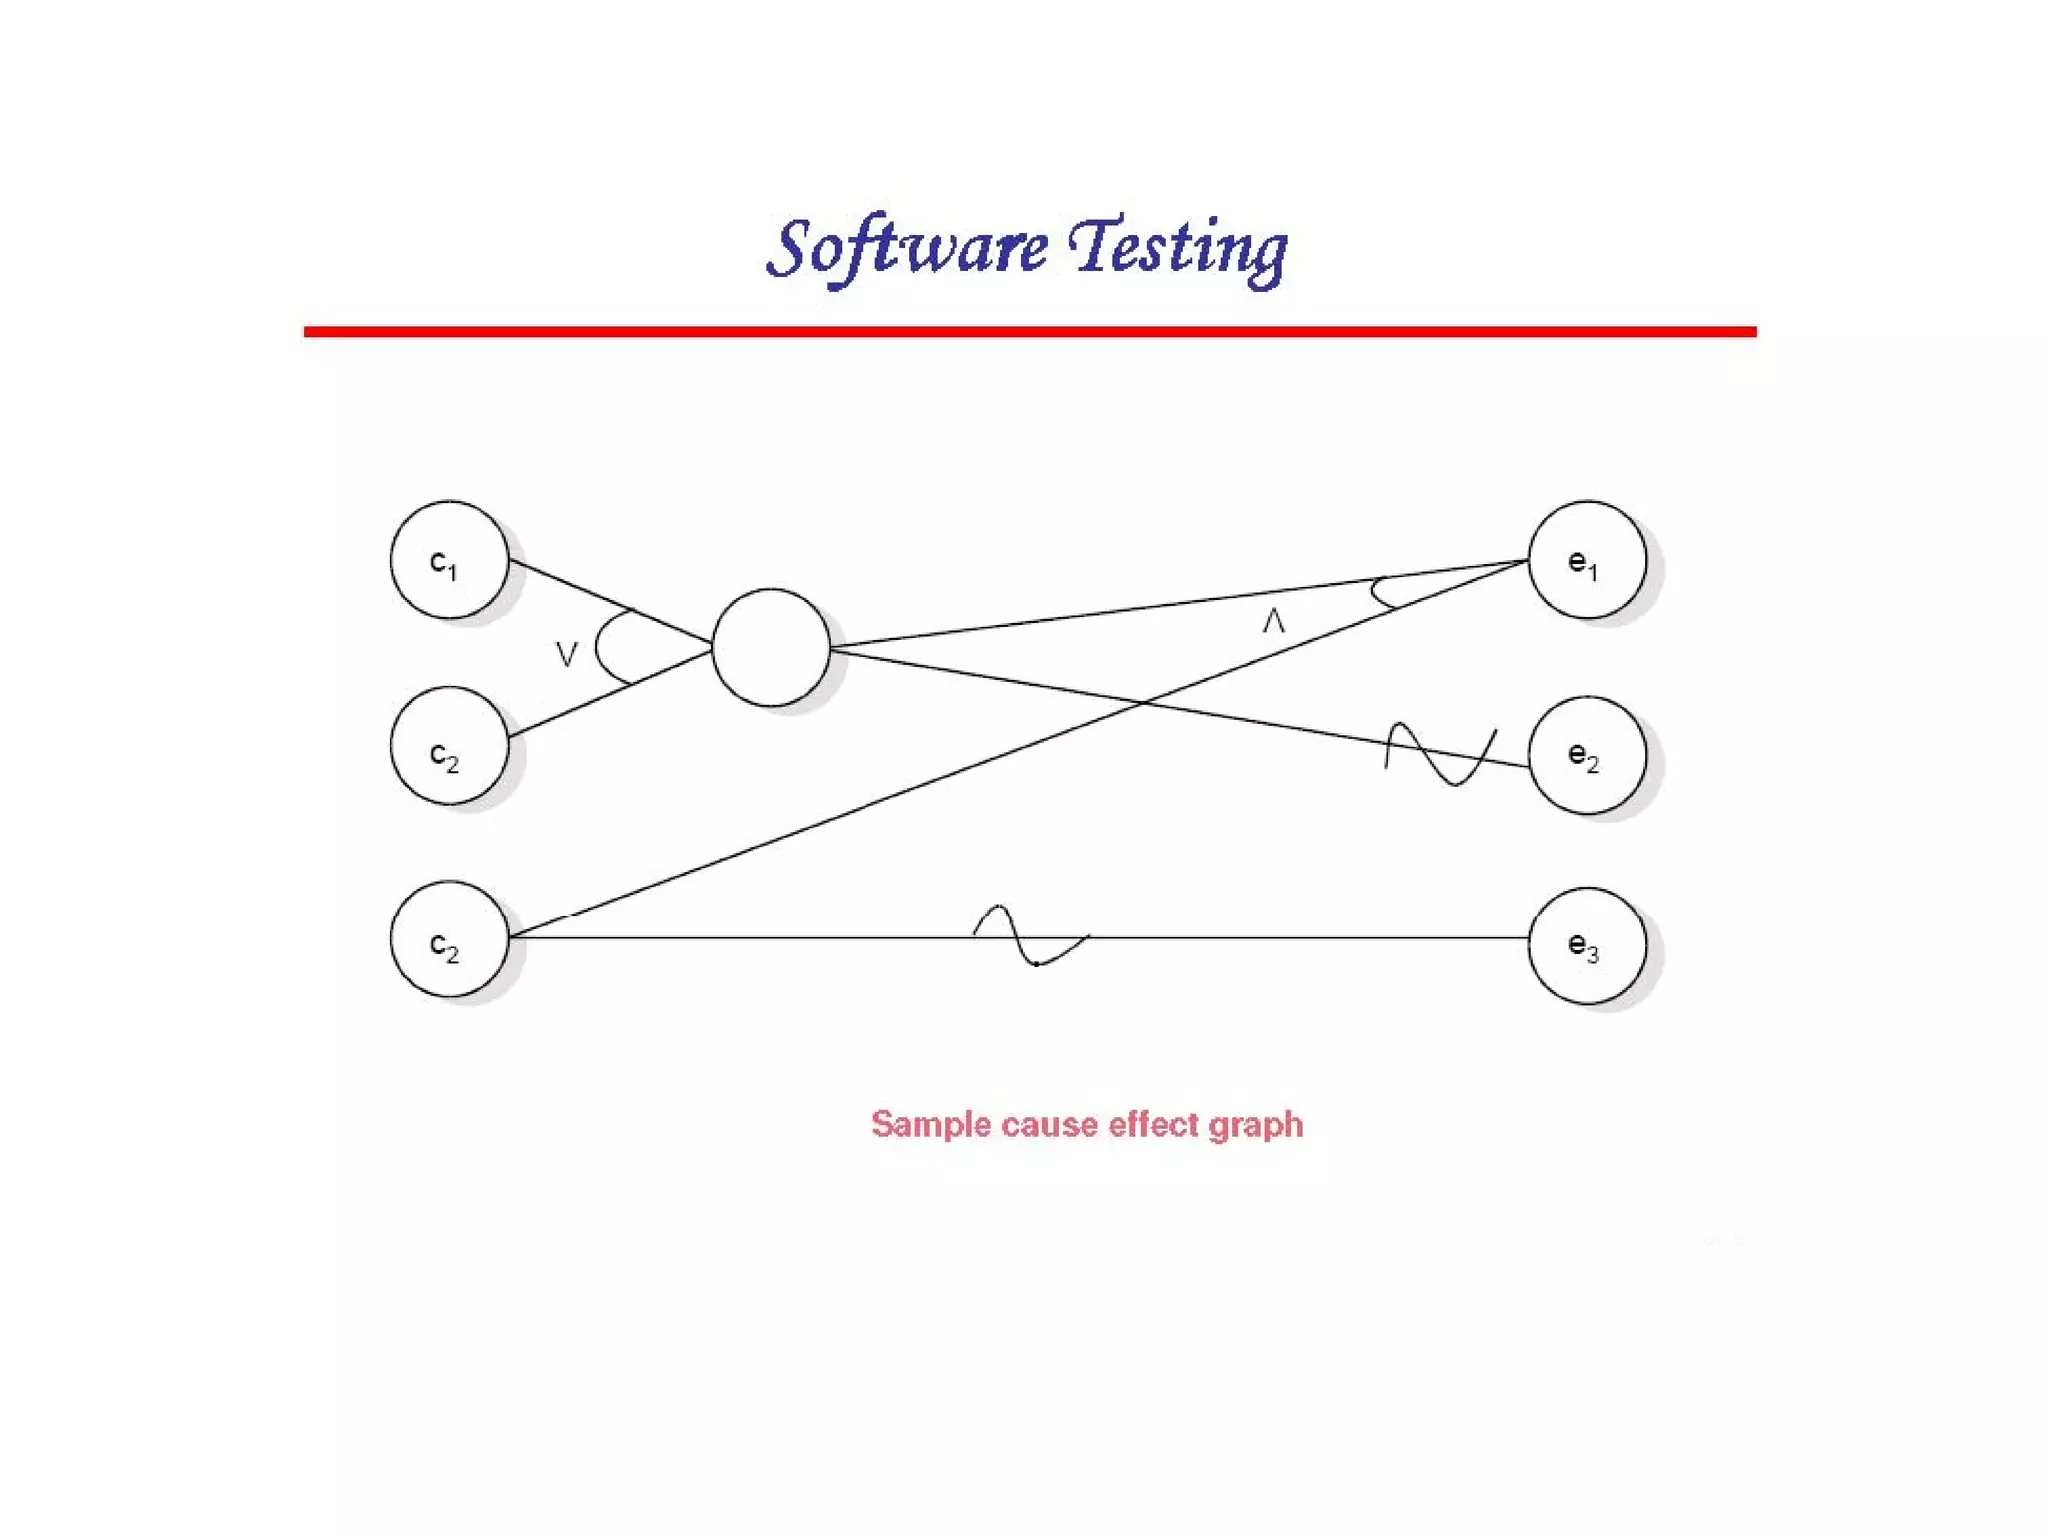
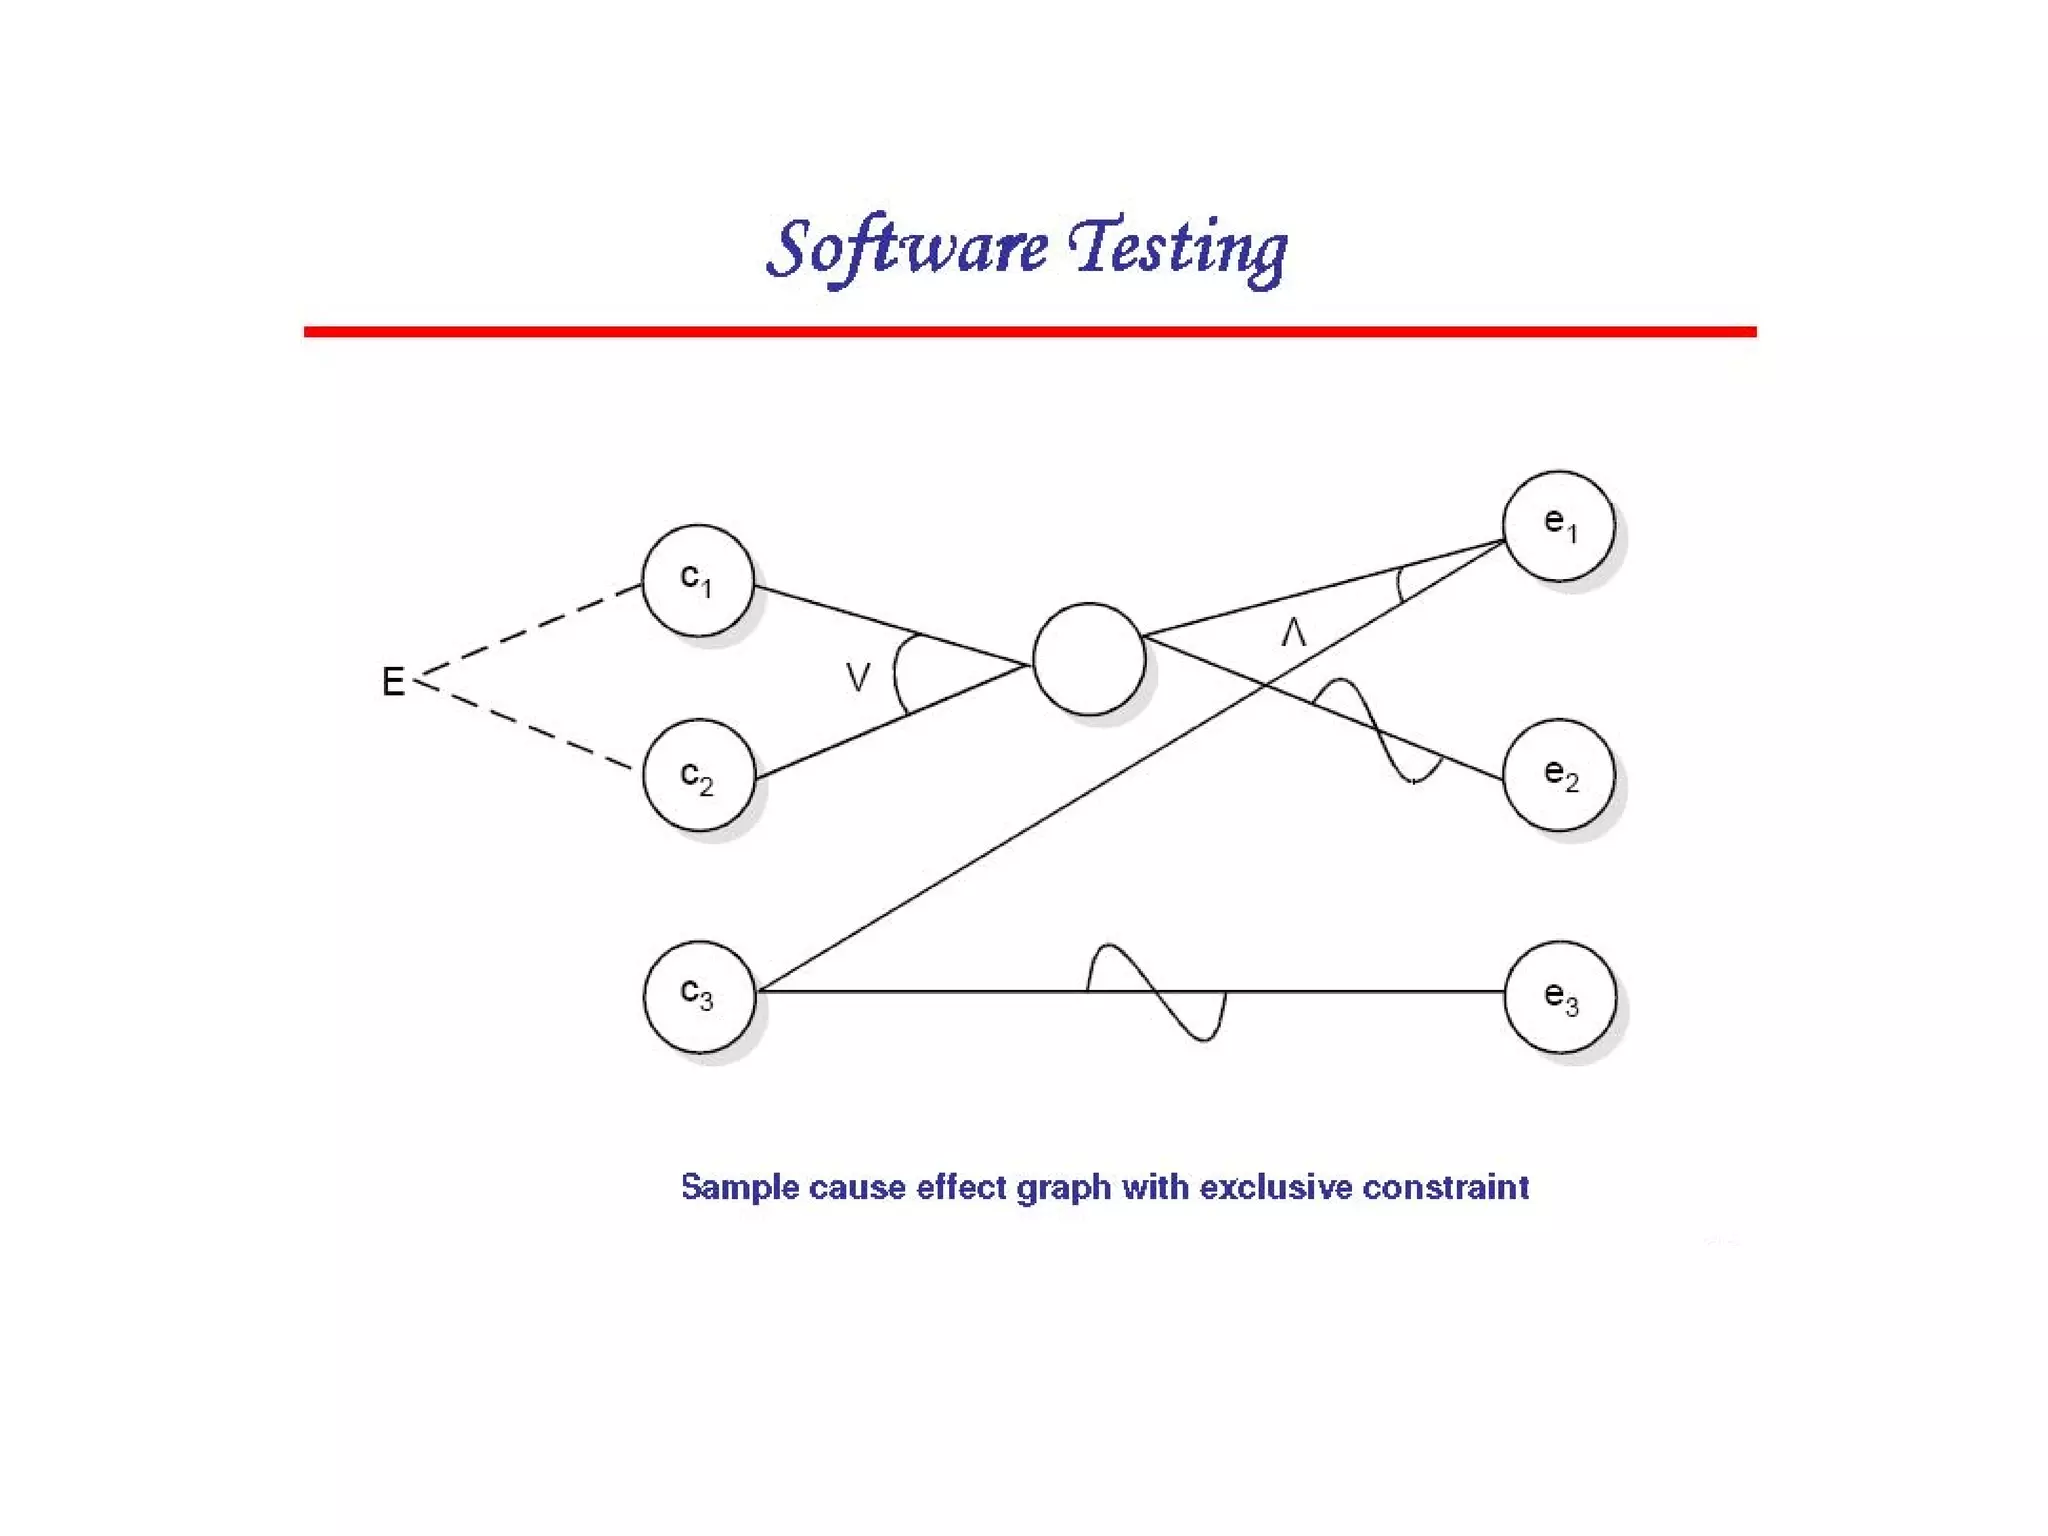

Cause-effect graphs capture relationships between inputs (causes) and outputs (effects) in black box testing. Causes and effects are represented as nodes in a graph connected by intermediate nodes. An example graphs the causes if the first character is 'A' or 'B' and the second column is a number leading to the effect that the file is updated, or other causes and effects like erroneous characters printing message X12. The methodology involves decomposing the system, identifying causes and effects, establishing the graph of relationships between them, adding constraints, converting the graph to a decision table, and producing a test per line of the simplified table.