Downloaded 41 times
![International Journal of Software Engineering & Applications (IJSEA), Vol.3, No.6, November 2012
DOI : 10.5121/ijsea.2012.3606 77
THE APPLICATION OF CAUSE EFFECT GRAPH FOR
THE COLLEGE PLACEMENT PROCESS
1
Mrs.Dhanamma Jagli, 2
Mrs.Mamatha T, 3
Ms.Swetha Mahalingam,
4
Ms.Namrata Ojha
1
Assistant Professor,
Department of MCA, V.E.S. Institute of Technology, Mumbai, India
dhana1210@yahoo.com
2
Assistant Professor,
Department of CSE, SNIST, Hyderabad, India
mamathat7@gmail.com
3,4
MCA Final year Students
V.E.S. Institute of Technology, Mumbai, India
3
swethamahalingam@yahoo.com,
4
namrataojha05@gmail.com
ABSTRACT
This paper presents a case study on the application of cause effect graph for representing the college
placement process. This paper begins with giving a brief overview of the college placement process which
will serve as the basis for developing the cause effect graph and the decision table for the same in a
systematic manner. Finally, it concludes with the design of test cases thus giving a complete and clear
representation about the application of cause-effect graph in the software testing domain.
KEYWORDS
Cause Effect Graph; Placement Cell; Placement Process; Dream Job; Non Dream Job.
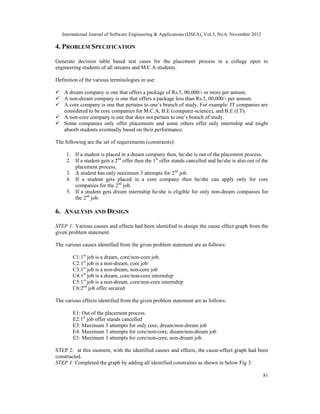
1. INTRODUCTION
The placement process in the college is a yearly affair brimming with activities. It is a process
involving the active participation of the placement cell and the final year students of all streams.
The process starts with the placement cell giving the students necessary information concerning
the placement process. This dissemination of information requires to be done in a very concise
and systematic manner and this is where comes in the application of cause effect graph.
The following are the main reasons for presenting this technical paper:
For representing the information concerning the placement process in a clear and
systematic manner to all the students and cater to different levels of understanding.
This paper will serve as a valuable addition to the existing repository of case studies
based on cause effect graph.
To highlight the application of cause effect graph as an effective testing technique.
2. LITERATURE REVIEW
The Software testing technique Cause-Effect Graph was made-up by Bill Elmendorf of IBM in
1973[1] [2]. Instead of the test case designer trying to manually determine the right set of test
cases, modeled the problem using a cause-effect graph, and the software that supports the
technique. Cause Effect Graph creates a relation between the outputs (conditions) and the inputs](https://image.slidesharecdn.com/3612ijsea06-131009025632-phpapp02/85/THE-APPLICATION-OF-CAUSE-EFFECT-GRAPH-FOR-THE-COLLEGE-PLACEMENT-PROCESS-1-320.jpg)
![International Journal of Software Engineering & Applications (IJSEA), Vol.3, No.6, November 2012
78
(actions).A cause effect graph in software testing is an intended for graph that maps a number of
conditions to a number of actions.
The techniques in the past introduced regarding the different input data as self-determining, and
the input value each one considered independently for producing test cases. The different inputs
and their effects on the outputs are not clearly measured for test case design [1] [2] [5].
In precedent only some case studies were at hand wherever Cause effect graph application had
taken consideration. Such are Withdrawal at ATM, Purchase order of Different equipment,
Employee payroll system, some are with designed test cases and some are with test cases [3]. But
in this paper a new case study had chosen with outcome as test cases for automated college
placement cell as shown in further stages in this paper.
3. OUTLINE OF CAUSE EFFECT GRAPH
A Boolean graph reflecting logical relationships between inputs (causes), and the outputs (effects)
or transformations (effects).Cause-effect graphing describes a technique that uses the
dependencies for identification of the test cases known as cause-effect graphing. The logical
associations between the conditions (Causes) and their actions (effects) in a constituent or a
system are represented is called as a cause-effect graph.
a) Notations for Cause-and-Effect Graph
From the requirement specification, the possible causes (conditions) and effects (actions) must be
identified. Each condition is described as a cause that consists of input conditions (or
combinations of those) [1] [3]. The causes are associated with logical operators (e.g., AND, OR
and NOT). A condition or cause can be correct or incorrect. The basic notations for causes-effects
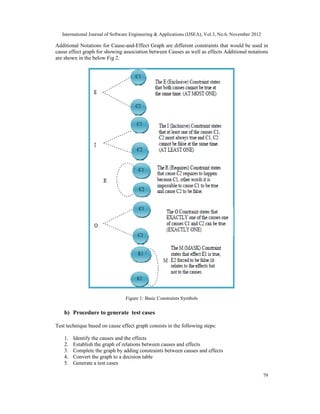
relations and its related constraint symbols were shown in the below Fig 1 and Fig 2.The Causes
and effects are treated in the same way and noted in the graph as shown in the below Fig 3.
Figure 1: Basic Notations](https://image.slidesharecdn.com/3612ijsea06-131009025632-phpapp02/85/THE-APPLICATION-OF-CAUSE-EFFECT-GRAPH-FOR-THE-COLLEGE-PLACEMENT-PROCESS-2-320.jpg)
![International Journal of Software Engineering & Applications (IJSEA), Vol.3, No.6, November 2012
80
In order to design proper set of test cases cause effect graph is not sufficient, so that it has to
convert in to decision table.
c) Cause Effect Graph to Decision Table
The Cause Effect Graph must be converted d into a decision table from that the test cases can be
Considered. The steps to transform a graph into a table are as follows:
1) Choose an effect
2) Looking in the graph, find combinations of causes that have this effect and combinations
that do not have this effect
3) Add one column into the table for every one of these cause-combinations and the caused
states of the remaining effects
4) Ensure if decision table values occurred many times and, if yes, remove them.
The test cases based on decision tables had the intention to design test cases for executing
attractive combinations of causes that possible failures can be found, in addition the causes and
effects, transitional results may be added in the decision table.
A decision table had two parts. The first half (upper half), describes about the inputs (causes). The
second half (lower half) describes about the outputs (effects).each column is a test case that the
combination of causes or inputs and the anticipated effects or outputs for this association. Test
cases intended for optimal situation, every combination of causes or inputs is considered as a test
case [3] still, causes may influence or exclude each other in such a way that not all combinations
construct valid test case. The implementation of every cause or condition and effect or action is
represented with a "YES or 1" or "NO or 0". Each cause or condition and effect or action must
occur at least once with either "YES” or "NO" in the table.
An optimized decision table does not include all possible combinations, but the impracticable
combinations are not added. Based on the dependency between the inputs (causes) and the results
(actions), the optimized decision table represents the result every column of decision table must
be compiled as a test case.
d) Definition of the Test Exit Criteria
Simple criteria for test completion, criteria for test completion can be defined relatively easily.
Executing every column in the decision table as a test case [3] is the minimum requirement of
decision table based test cases in the software testing, that all possible combinations of conditions
(causes) and corresponding effects (actions) can be verified.
The value of the technique is organized and very formal approach in constructing a decision table
with all possible combinations may expose association between set of causes and set of effects
that are not included when using other techniques for designing test cases.
e) Benefits of Using a Cause-and-Effect
Helps determine root causes.
Encourages group participation.
Uses an orderly, easy-to-read format.
Indicates possible causes of variation.
Increases process knowledge.
Identifies areas for collecting data.](https://image.slidesharecdn.com/3612ijsea06-131009025632-phpapp02/85/THE-APPLICATION-OF-CAUSE-EFFECT-GRAPH-FOR-THE-COLLEGE-PLACEMENT-PROCESS-4-320.jpg)

![International Journal of Software Engineering & Applications (IJSEA), Vol.3, No.6, November 2012
84
7. CONCLUSION
It ought to be important that the case study used in this paper to illustrate the basic steps of Cause
Effect Graph was kept very short and snappy. An experienced software tester could probably
jump right to this set of test cases from the requirements without using the CEG method for small
projects but for large, complex systems with multiple causes (inputs) and effects (outputs or
transformations) this method is an organized way to analyze the problem statement and create test
cases[7]. The case study described in this paper would be helpful to the college students to
understand the placement procedure easily. Apart from this, it would be useful to software testers,
students, faculties and others interested in the software testing domain.
ACKNOWLEDGEMENTS
As authors we would like to articulate thankfulness to Prof.A.Nagananda, Training and
placement officer in our college for providing complete information about placement
process takes place in the college.
REFERENCES
[1] www.westfallteam.com,Cause-Effect Graphing, By Theresa Hunt.
[2] http://www.saferpak.com/cause_effect_articles/howto_cause_effect.pdf
[3] “Software Testing Foundations: A Study Guide for the Certified Tester Exam” ,text book, By Andreas
Spillner, Tilo Linz, Hans Schaefer.
[4] “Requirements-Based Testing - Cause-Effect Graphing”, by Gary E. Mogyorodi.
[5] “Cause-Effect Graphs for Test Models Based on UML and OCL”,by Stephan Weißleder Dehla
Sokenou.
[6] www.wikiepedia.com.
[7] A Tool for Diagnosing the Quality of Java Program and a Method for its Effective Utilization n
Education”,by Hiroaki Hashiura, Saekomatusuura, Seiichikomiya.
[8] “An Automatic Test Case Generator Derived from State-Based Testing”,by Bor-Yuan Tsai∗,
Simon Stobart, Norman Parrington, and Ian Mitchel
[9] “Creation of a Test Bed Environment for Core Java Applications using White Box Testing
Approaches” by Priya R.L and Dhanamma Jagli ,Published in ITCSE.
Authors
Mrs.Dhanamma Jagli
Short Biography:
Mrs.Dhanamma Jagli is an Assistance professor in V.E.S Institute of Technology,
Mumbai, currently Pursuing Ph.D in Computer Science and Engineering and received
M.Tech in Information Technology from Jawaharlal Nehru Technological University,
Hyderabad and Andhra Pradesh. She has around 9 years teaching experience at the post
graduate and under graduate level. She had published and presented papers in referred
international journals and conferences. Her areas of research interest are Data Mining,
Cloud Computing, Software Engineering, Data base Systems and Embedded Real time
systems. She has been associated with Indian Society of Technical Education (ISTE) as
a life member.](https://image.slidesharecdn.com/3612ijsea06-131009025632-phpapp02/85/THE-APPLICATION-OF-CAUSE-EFFECT-GRAPH-FOR-THE-COLLEGE-PLACEMENT-PROCESS-8-320.jpg)


This document summarizes a research paper that applies cause-effect graphs to model the college placement process. It begins by introducing cause-effect graphs and their basic notations. Then, it outlines the college placement process and identifies various factors (causes) and outcomes (effects) to develop a cause-effect graph and decision table. Finally, it generates test cases from the decision table to test different combinations of causes and effects in an automated manner, concluding that cause-effect graphs provide an effective way to systematically represent and test the college placement process.