Downloaded 917 times
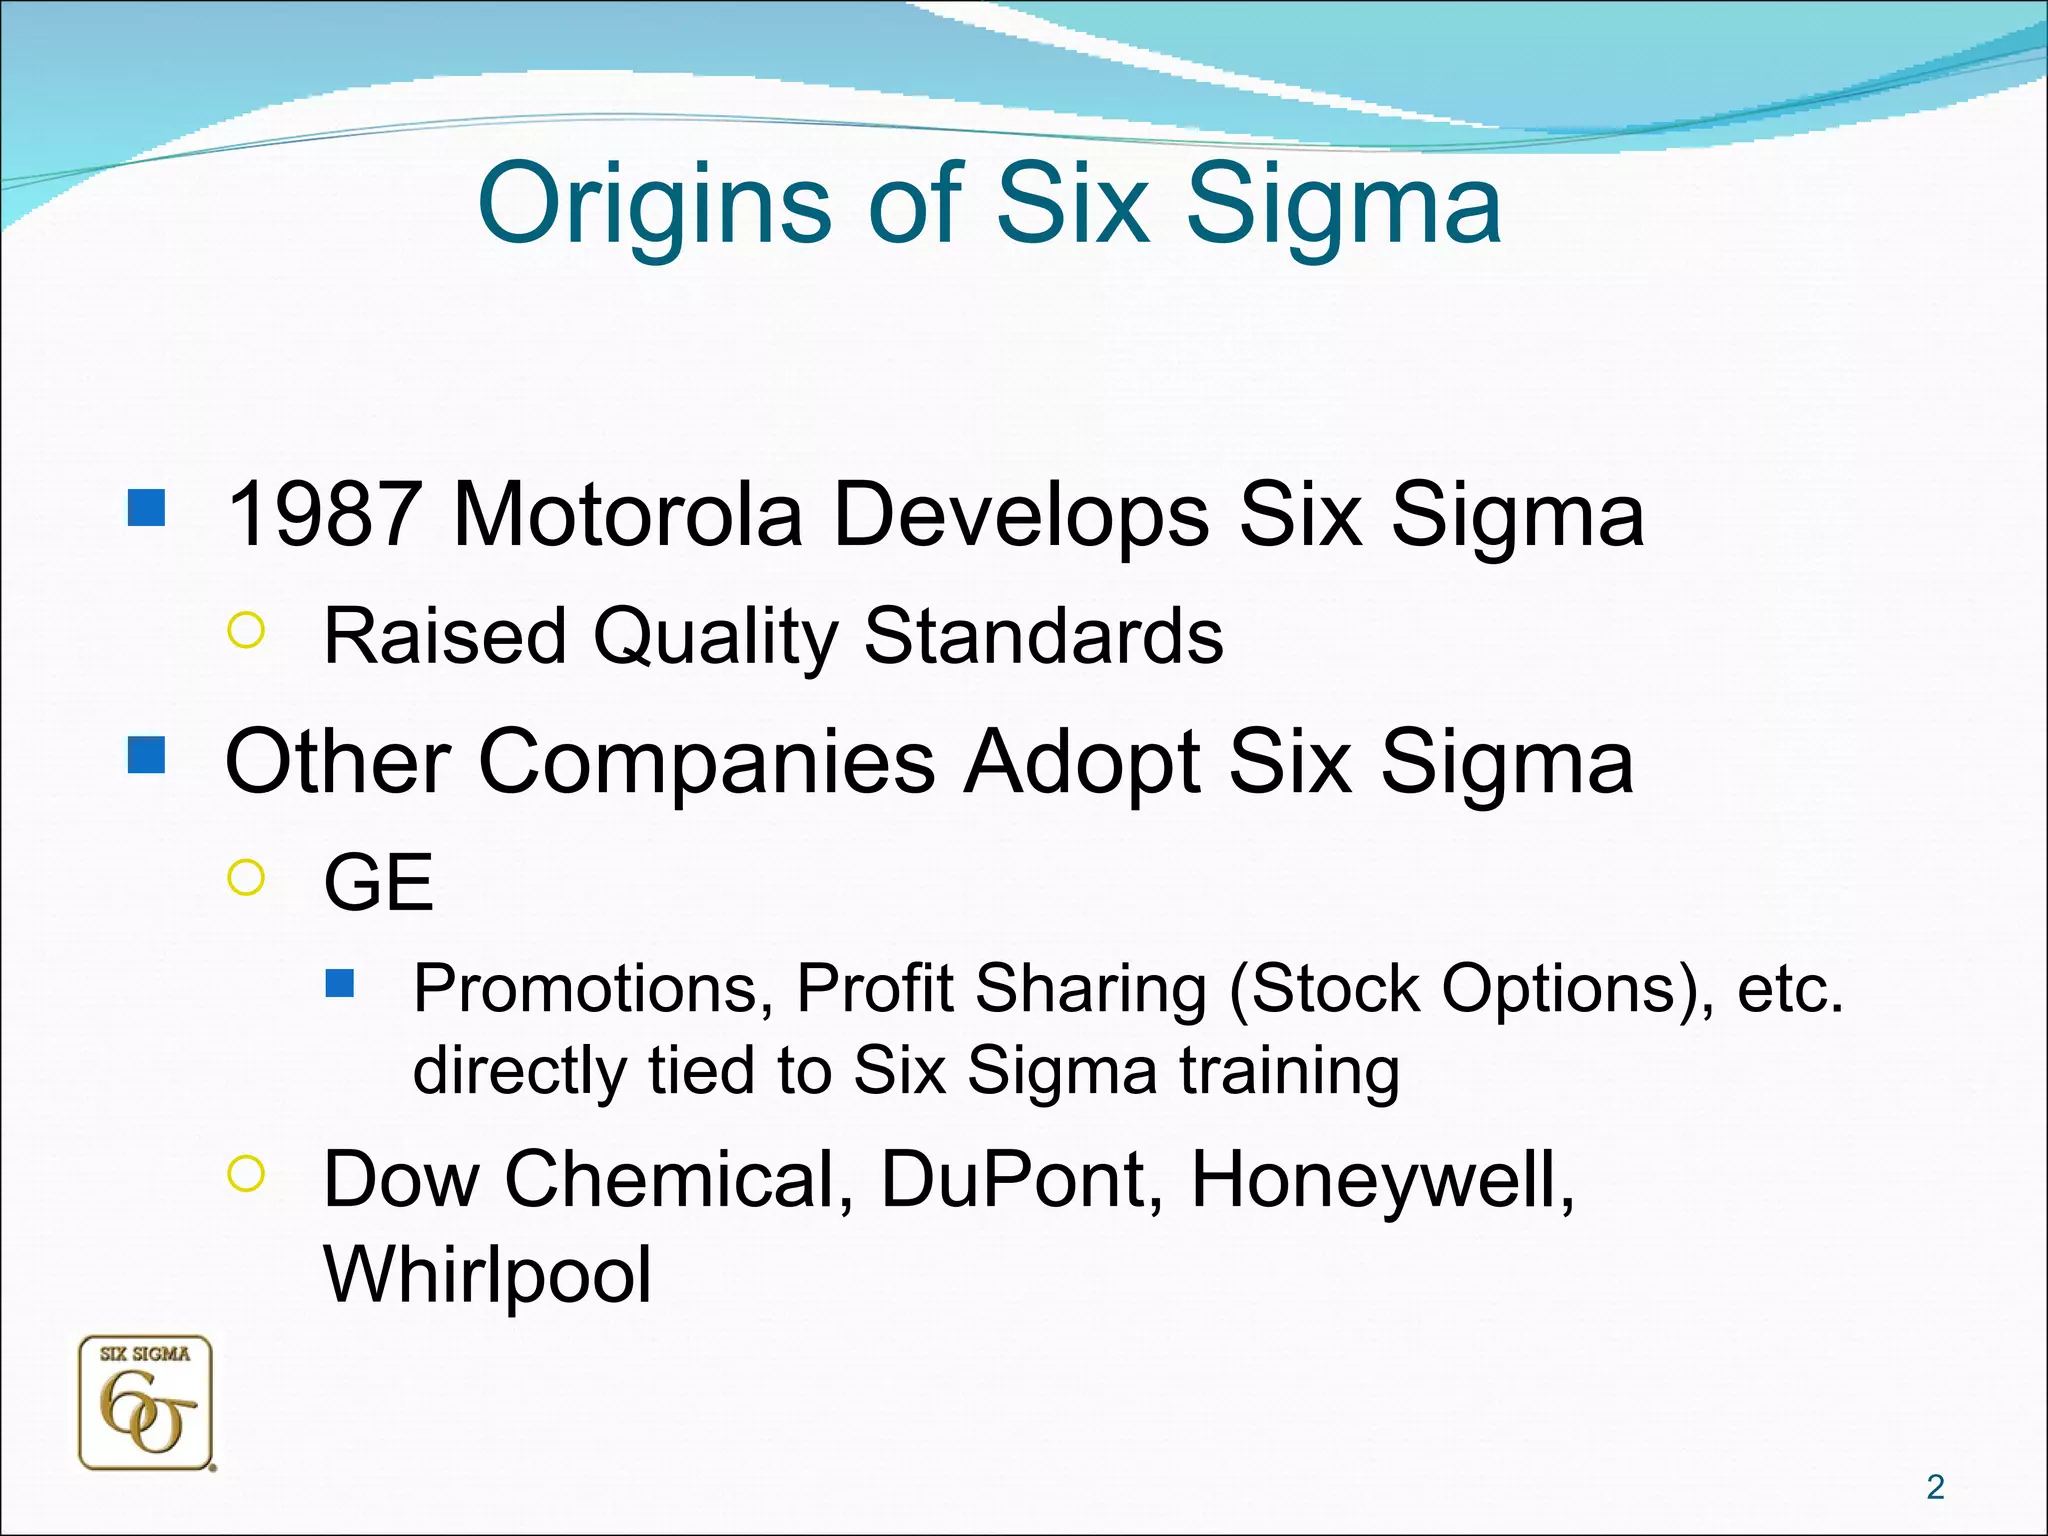
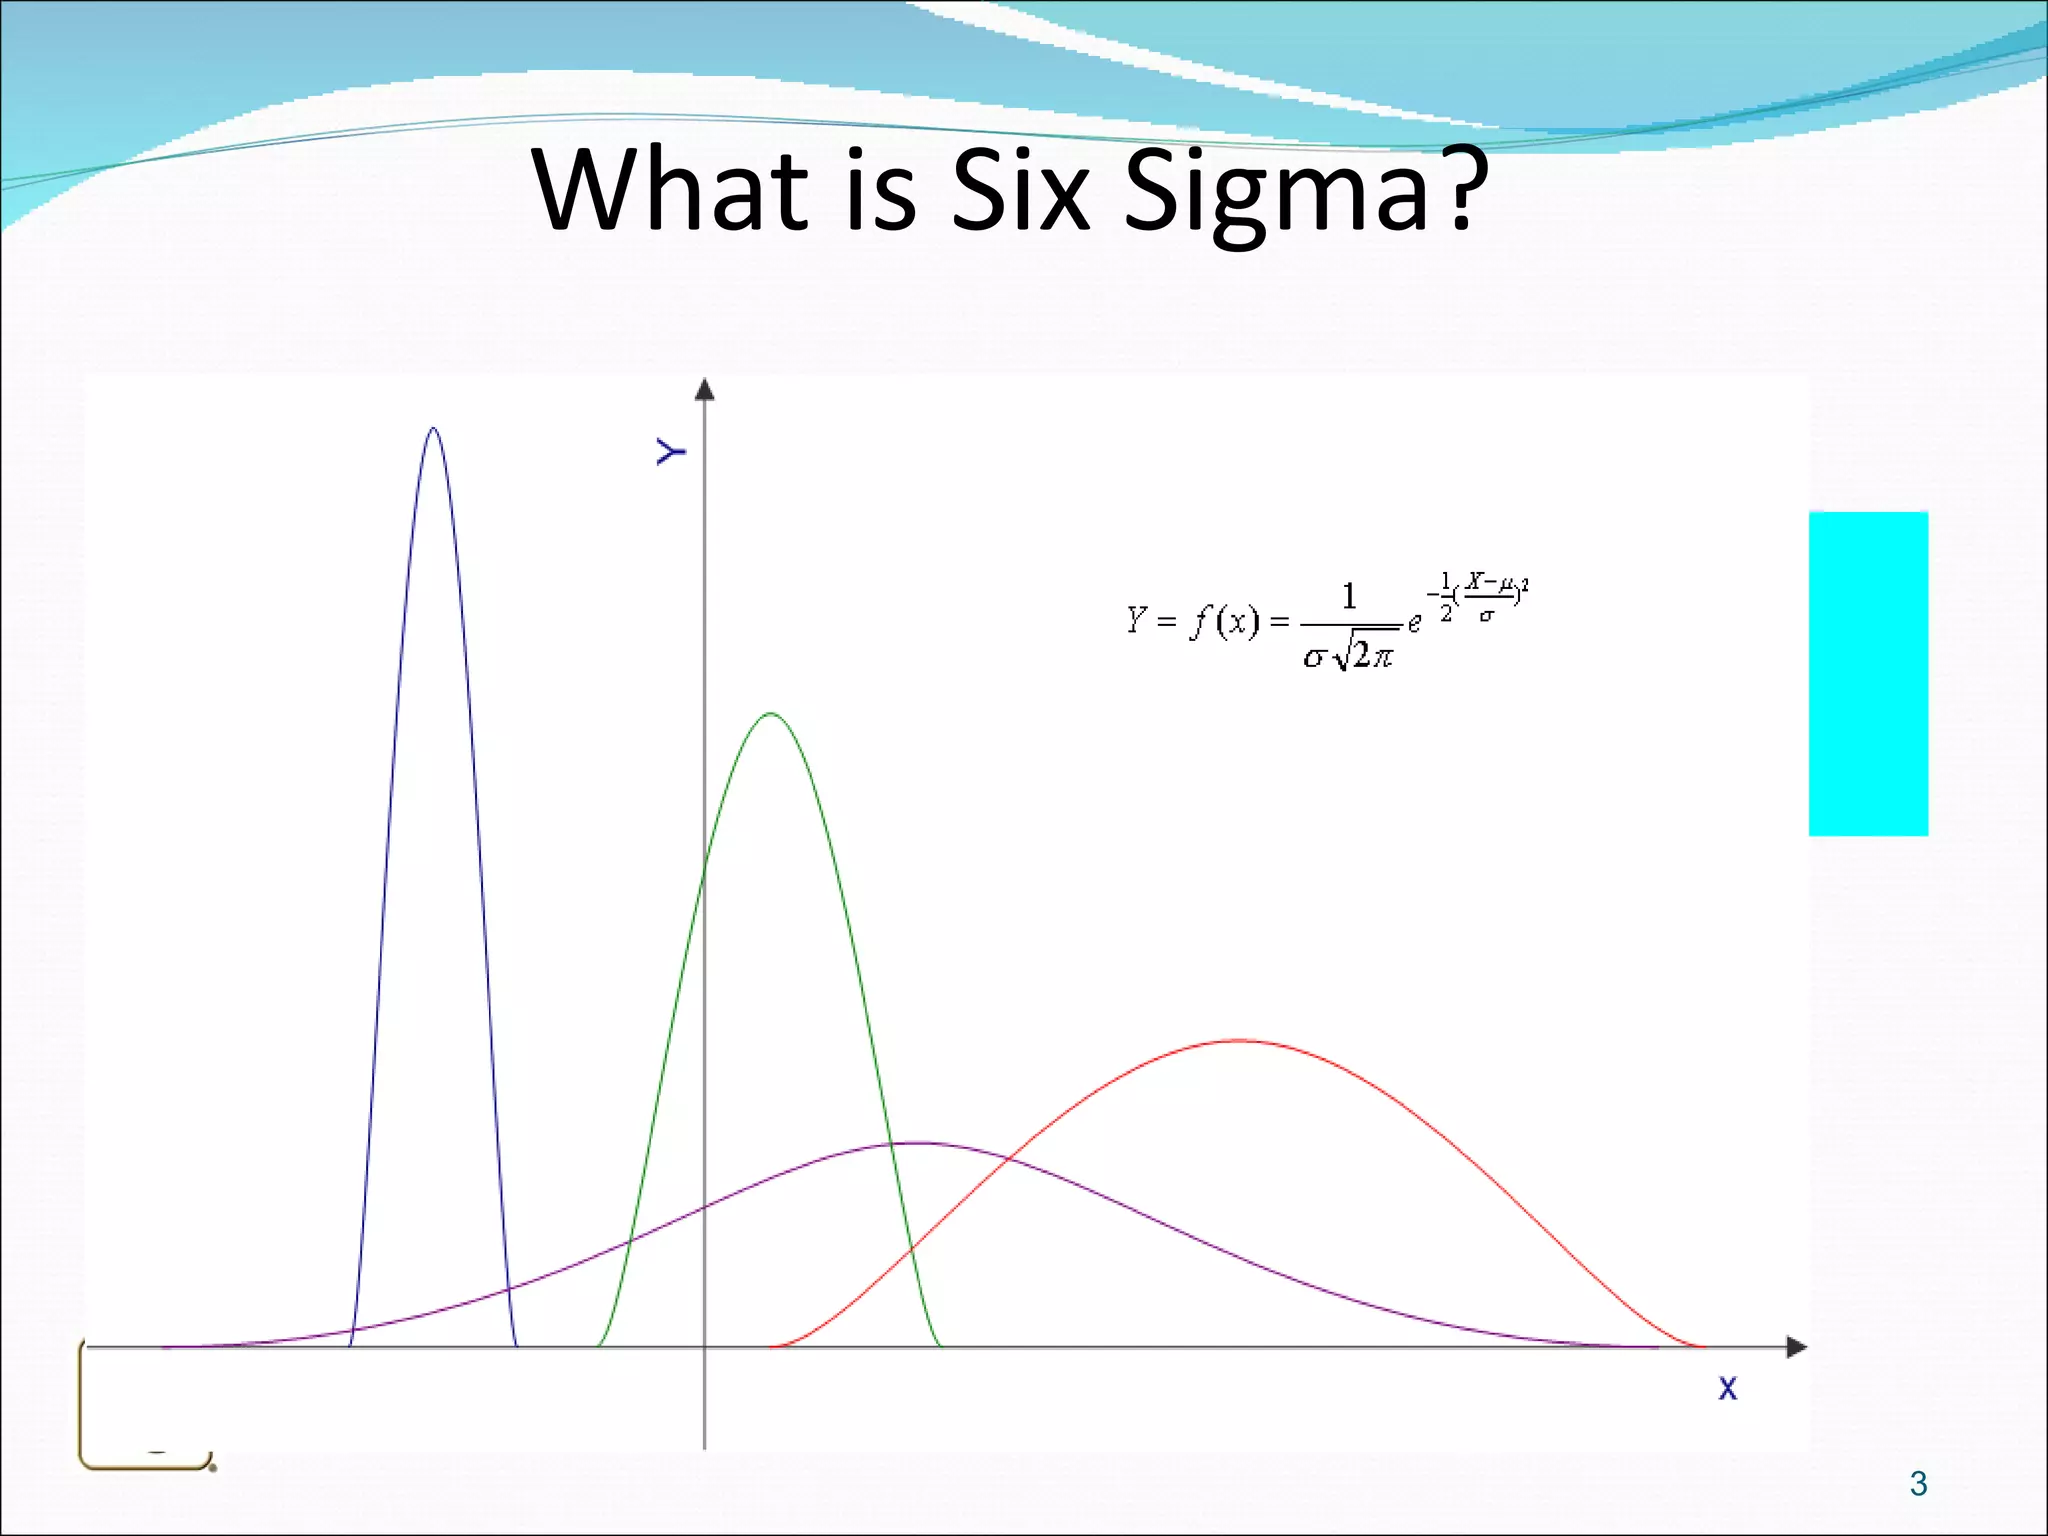
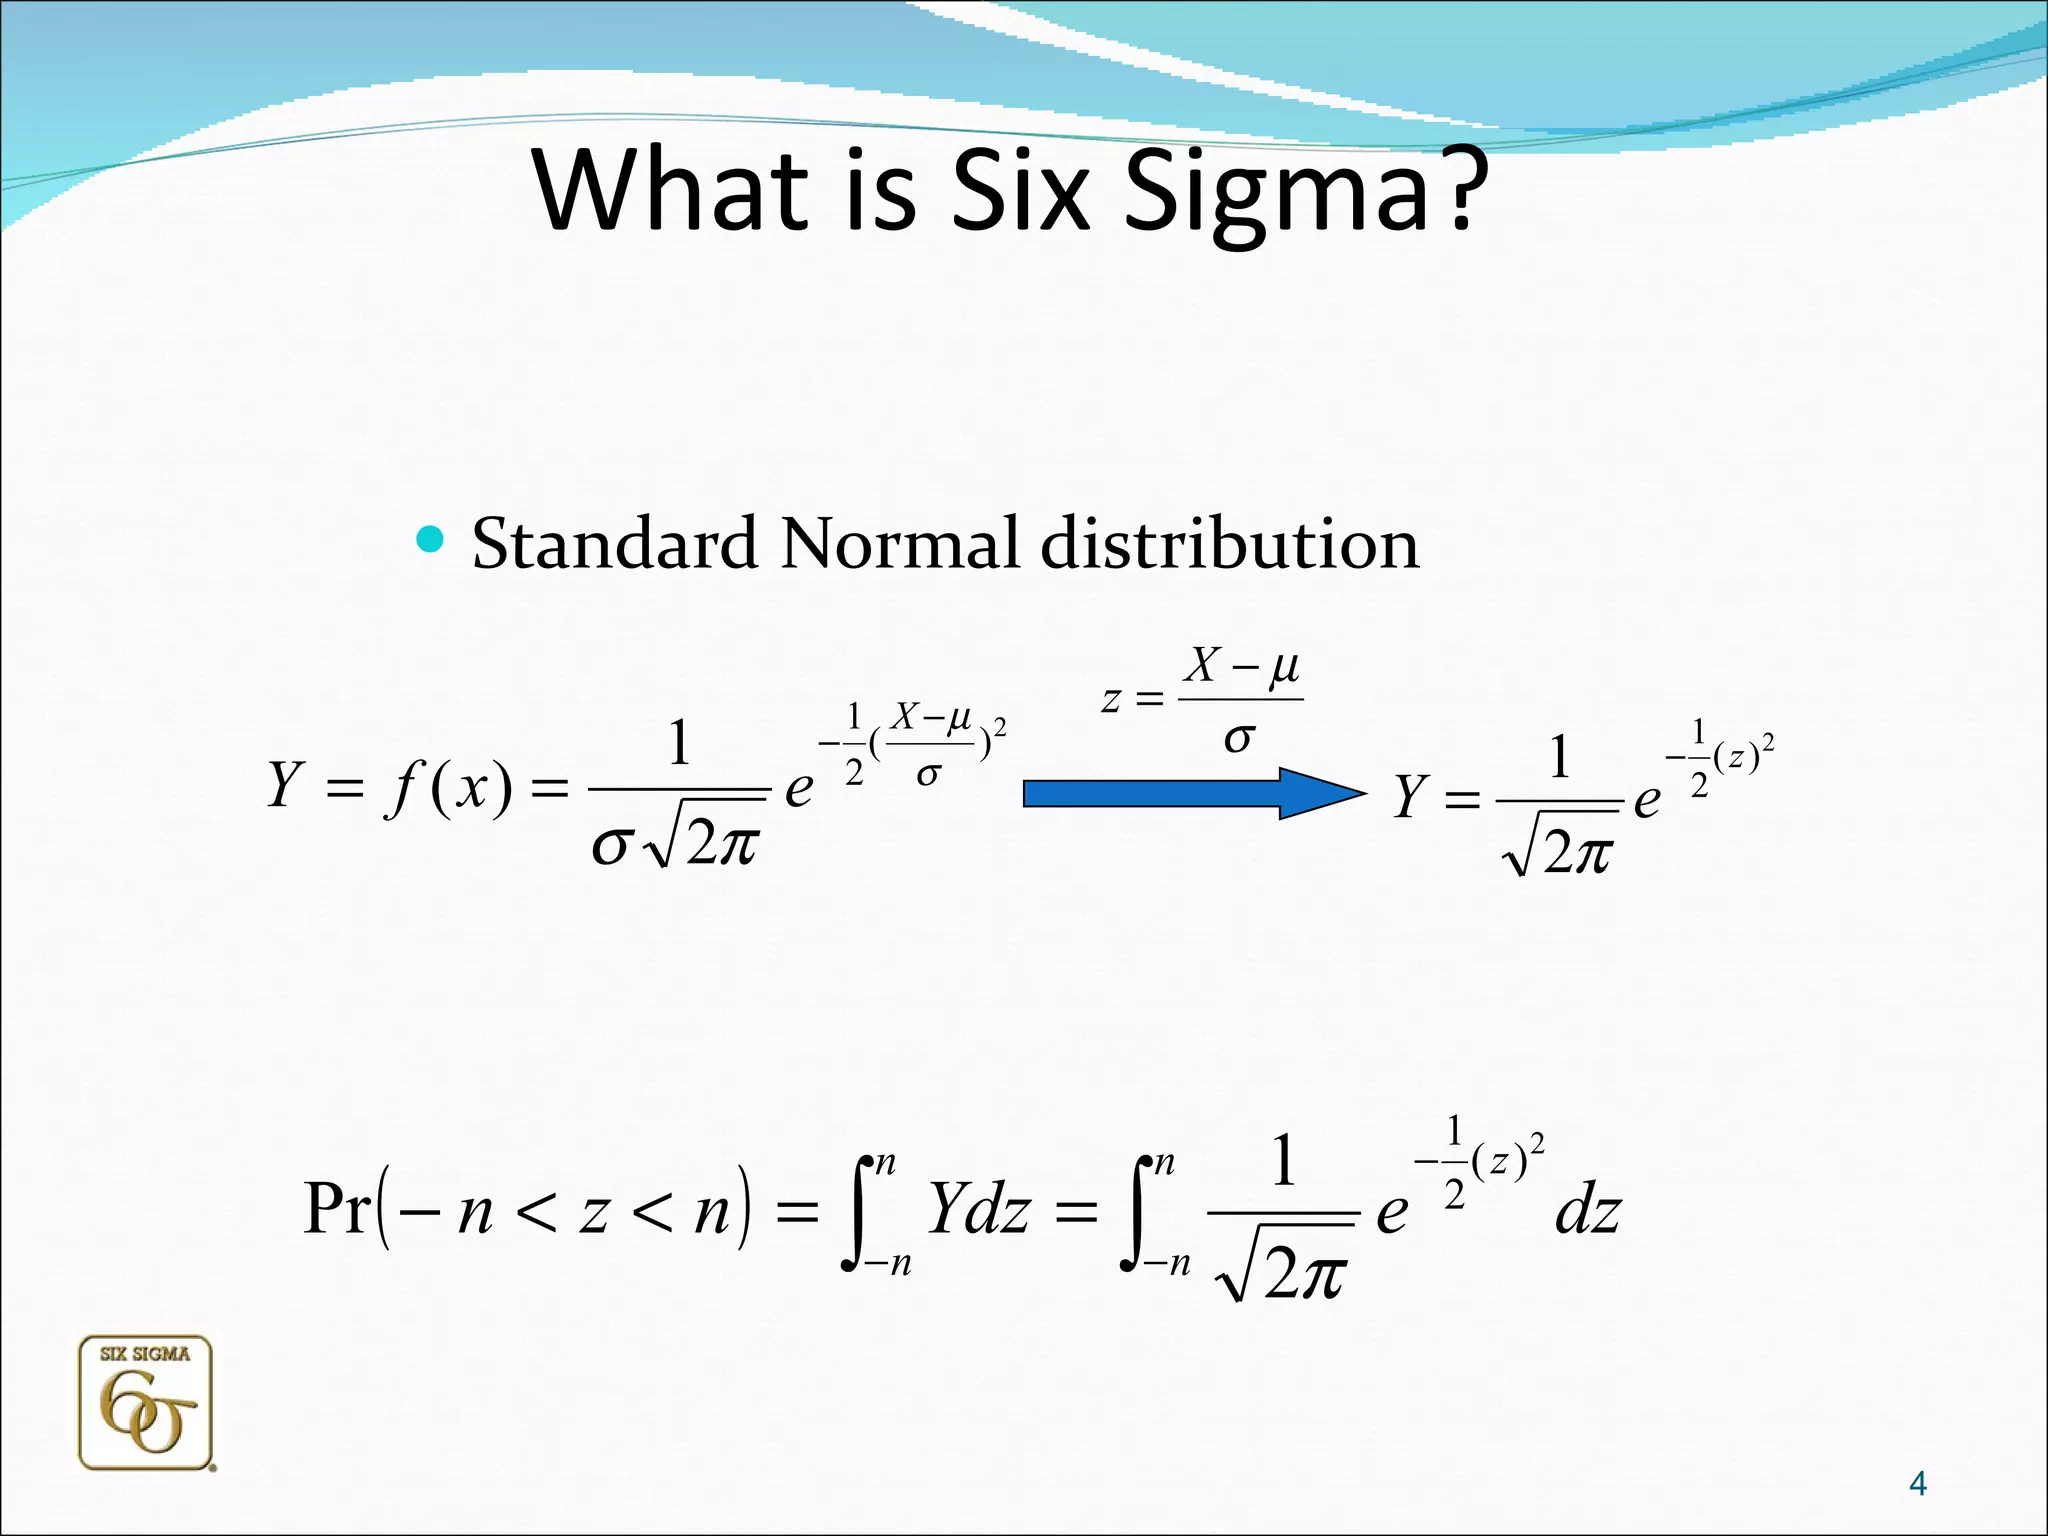
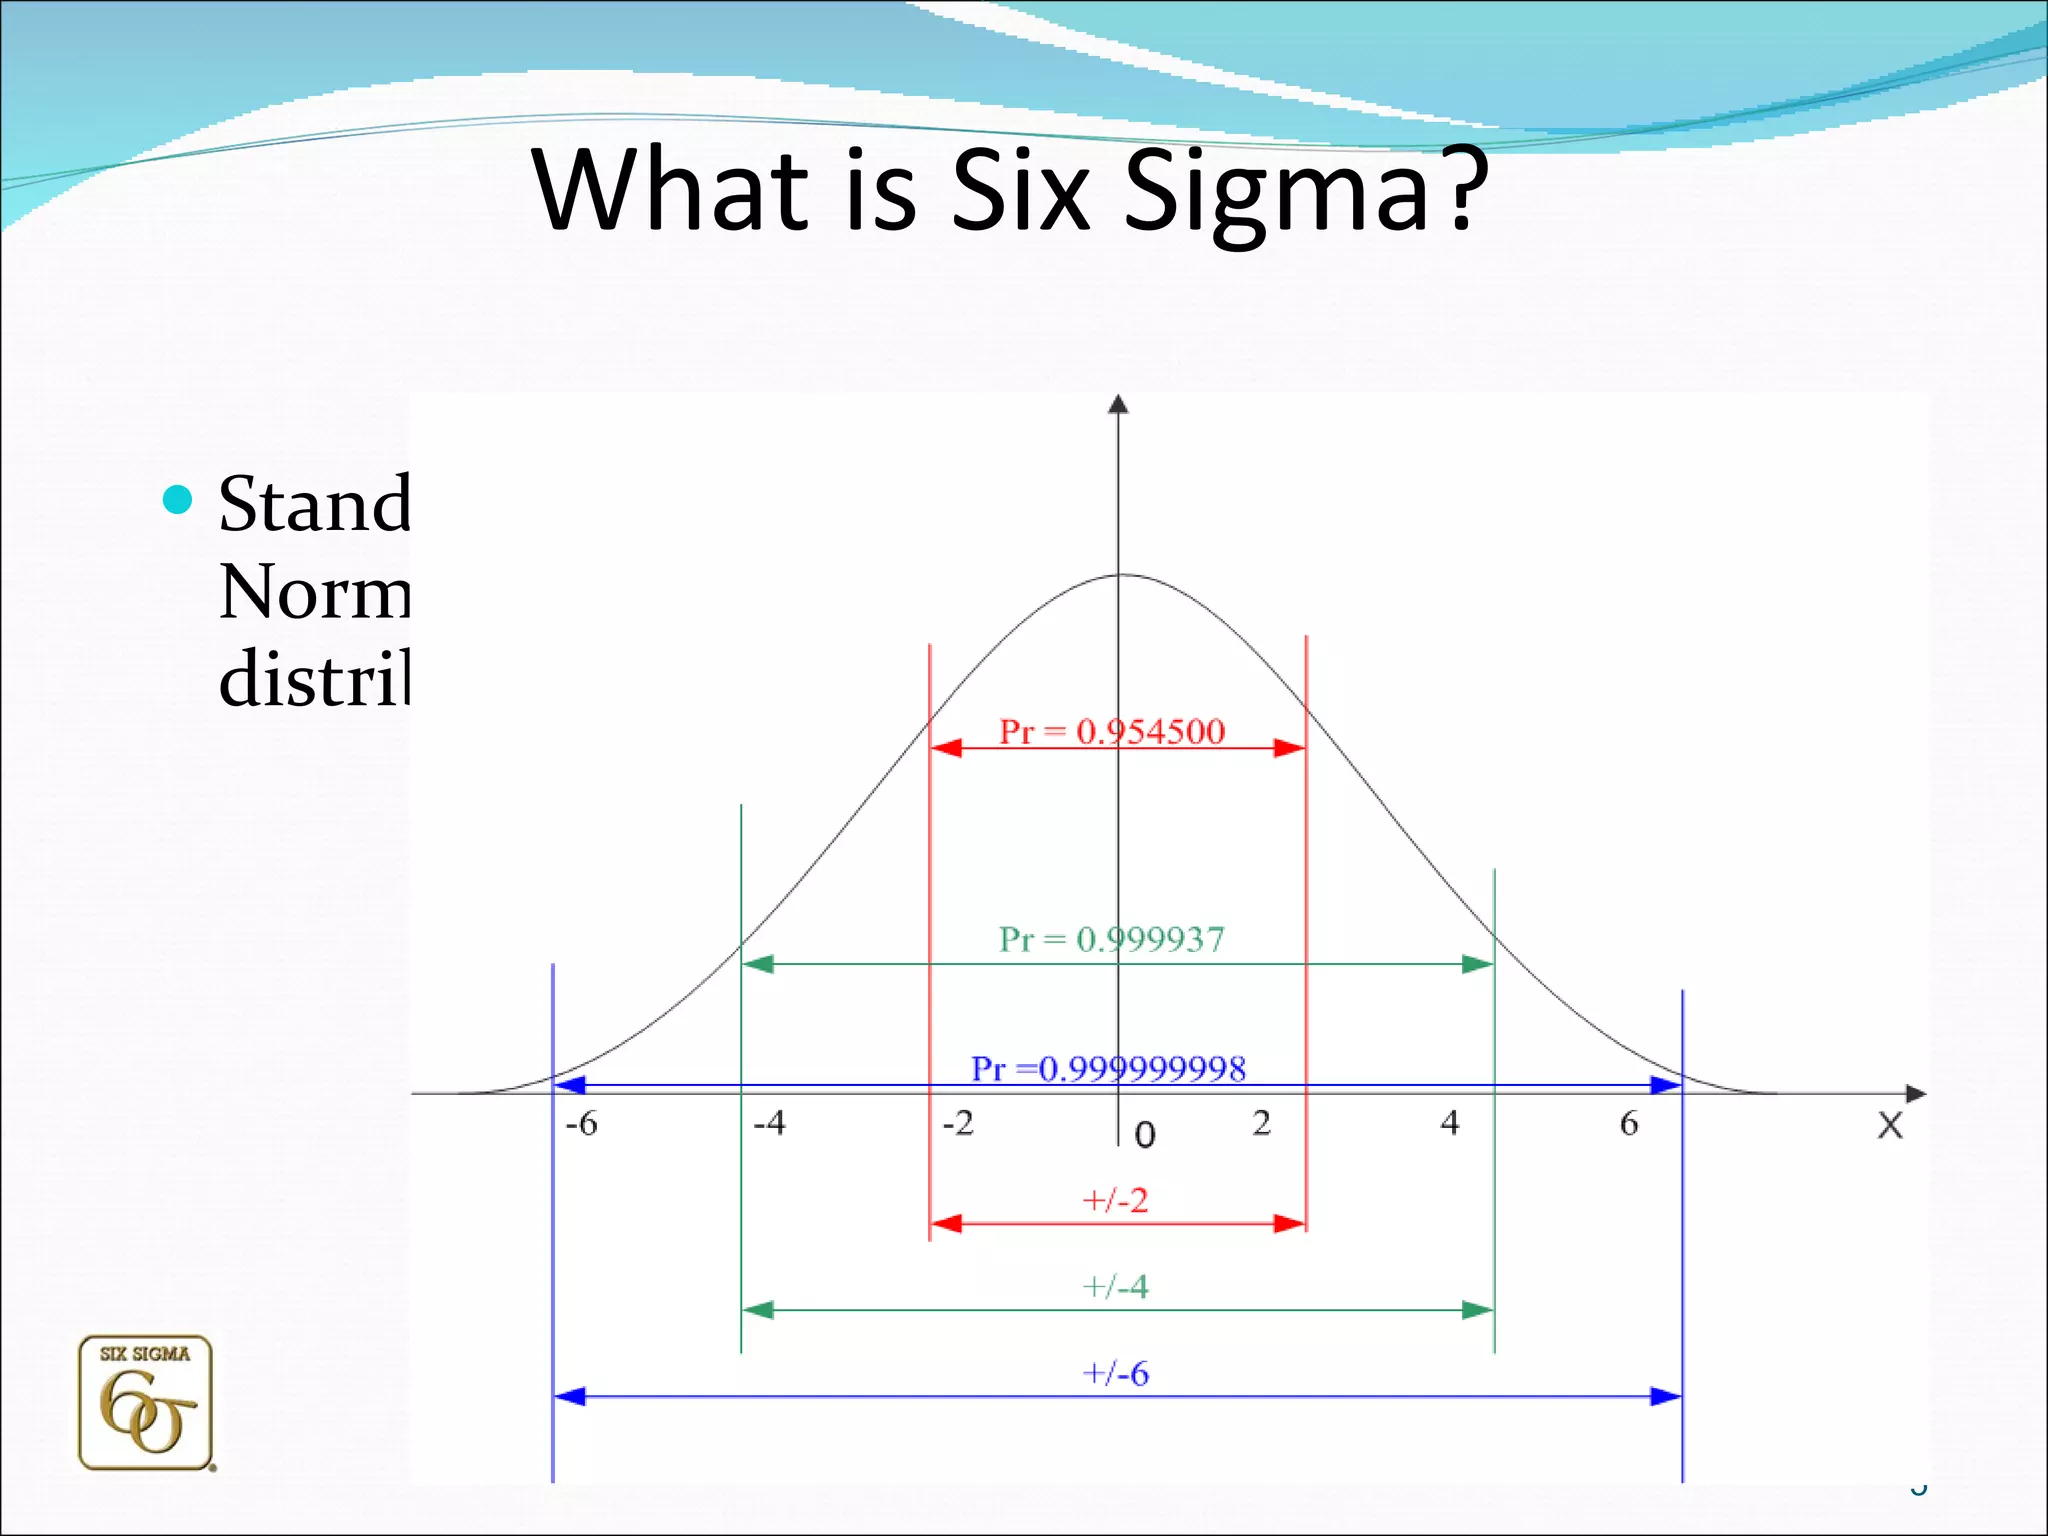
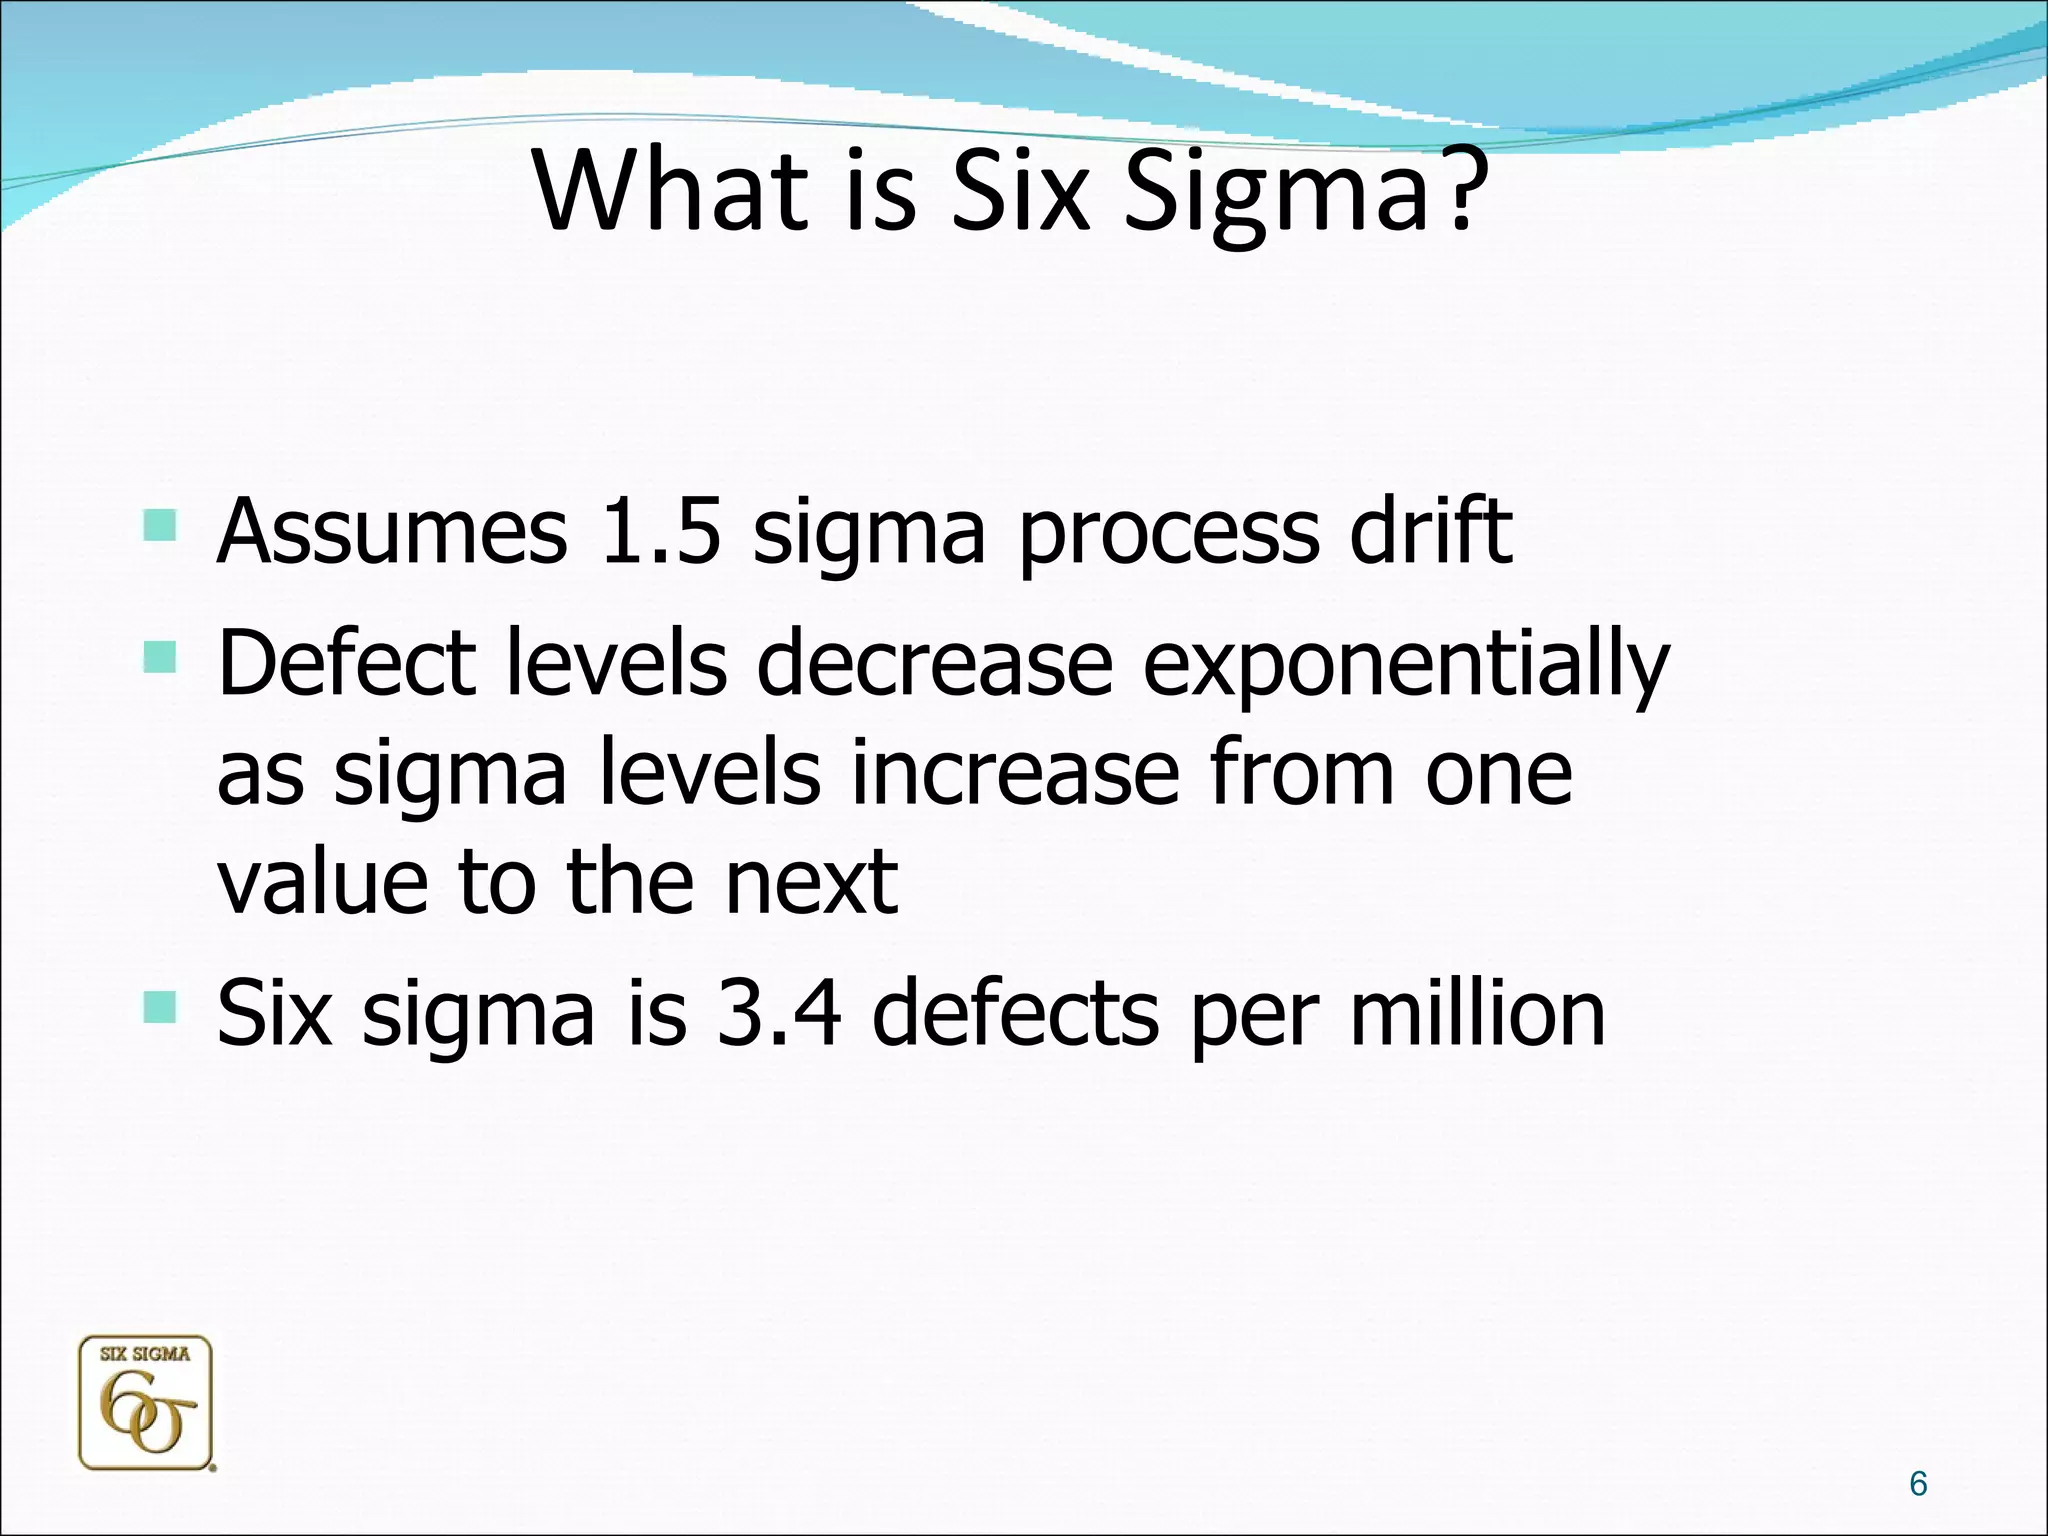
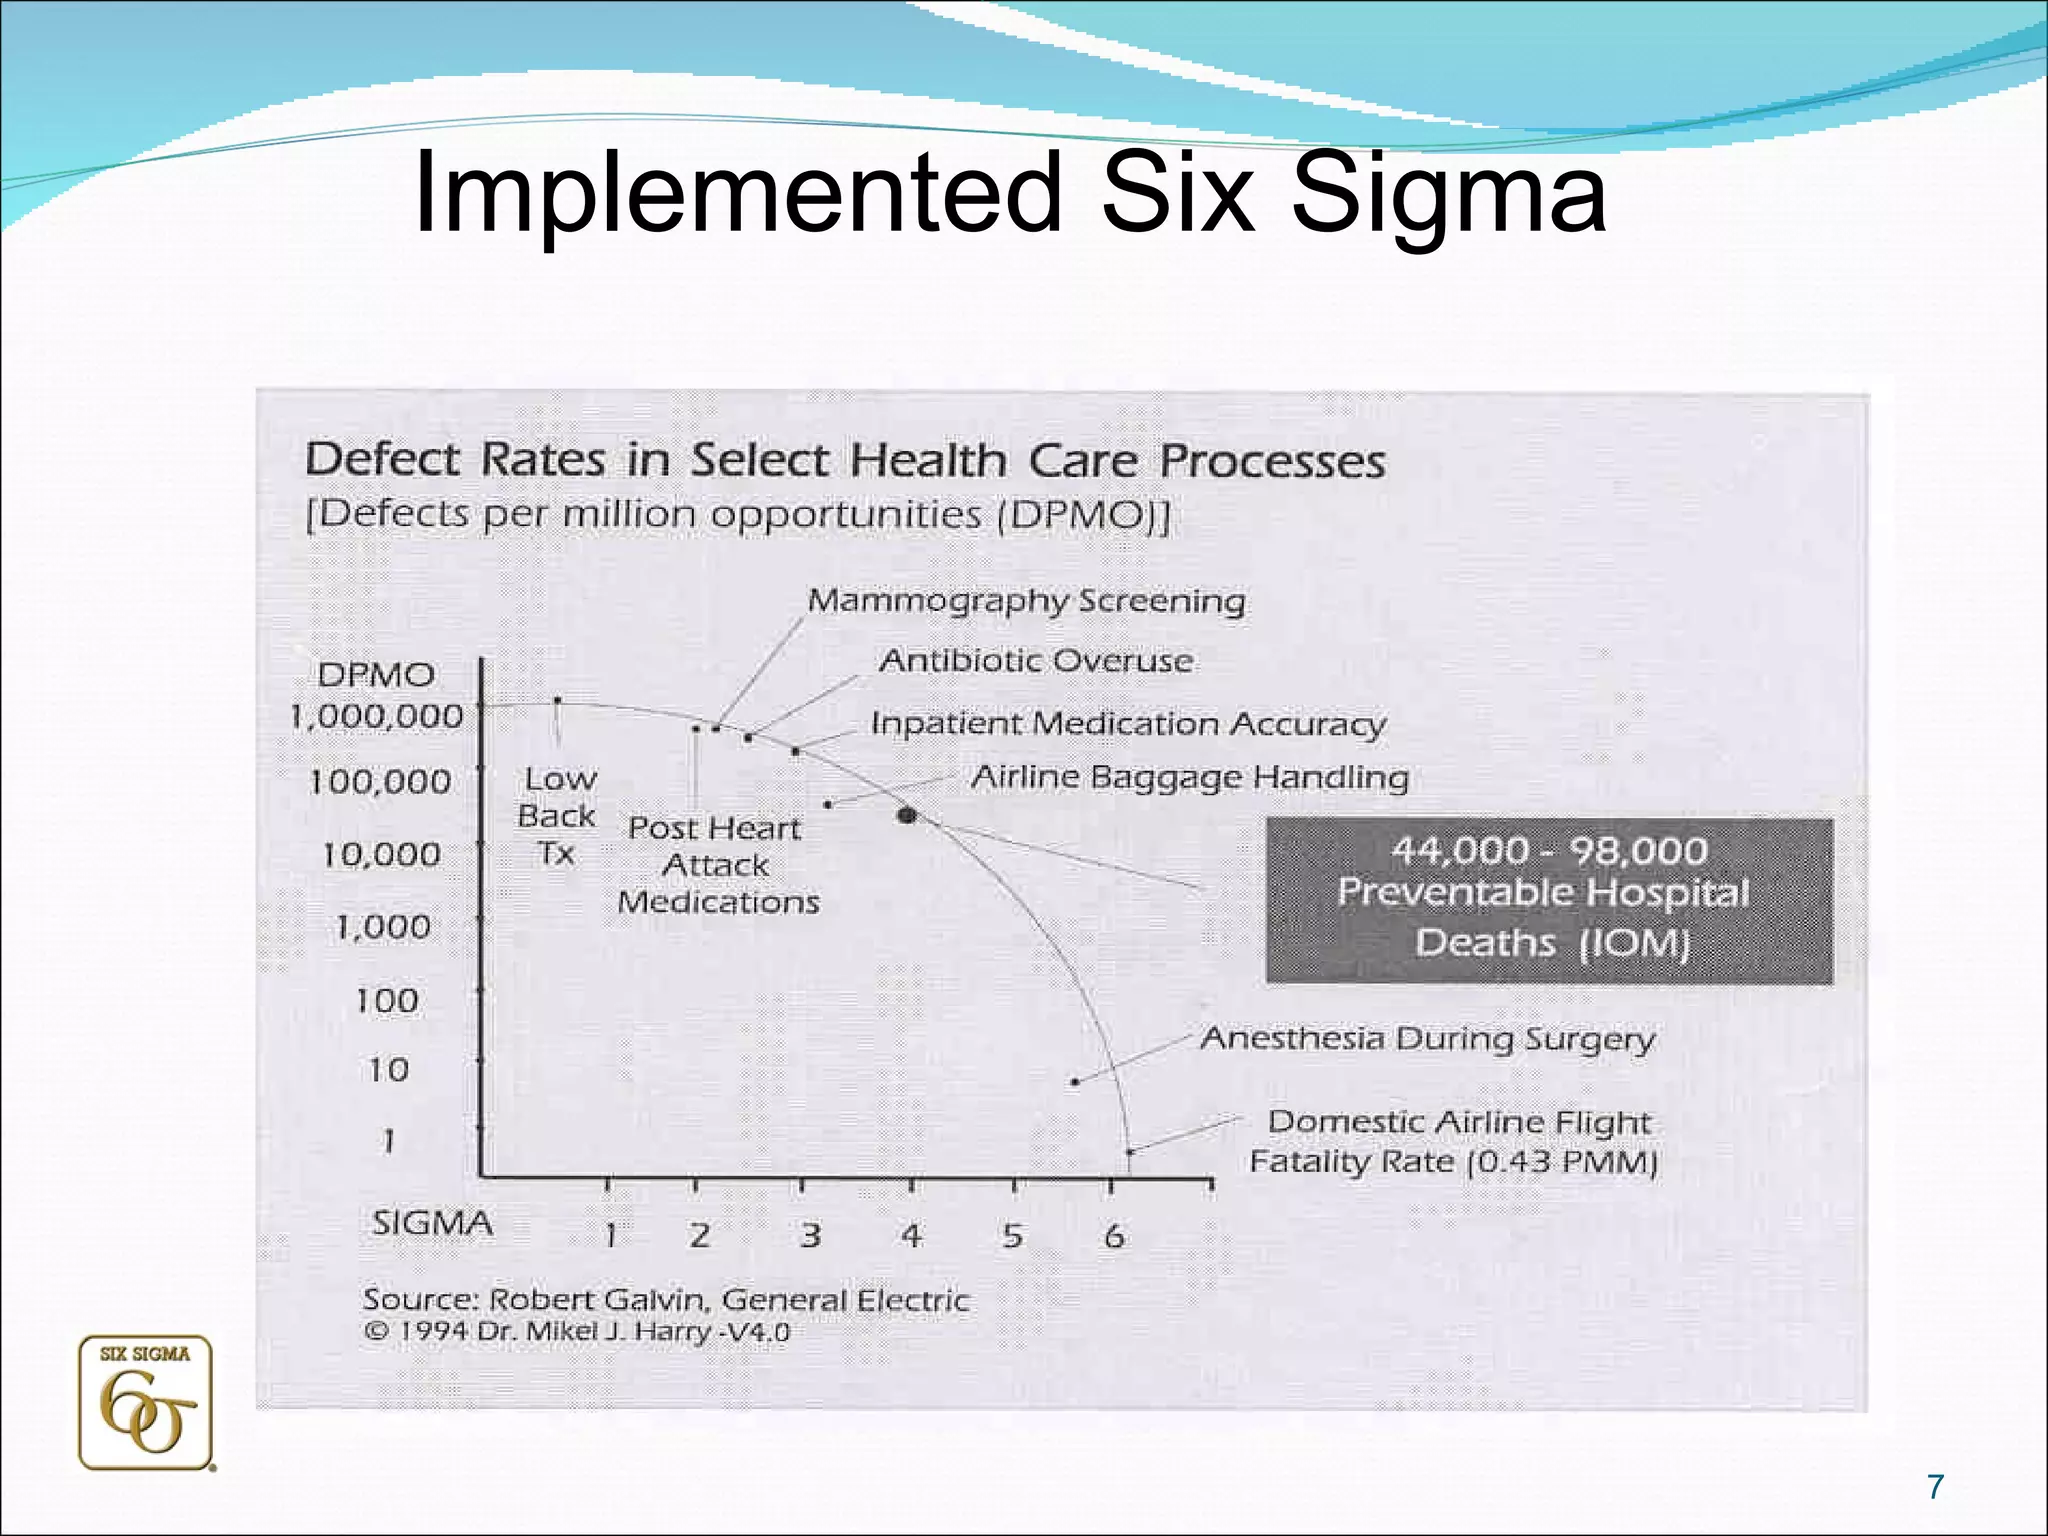
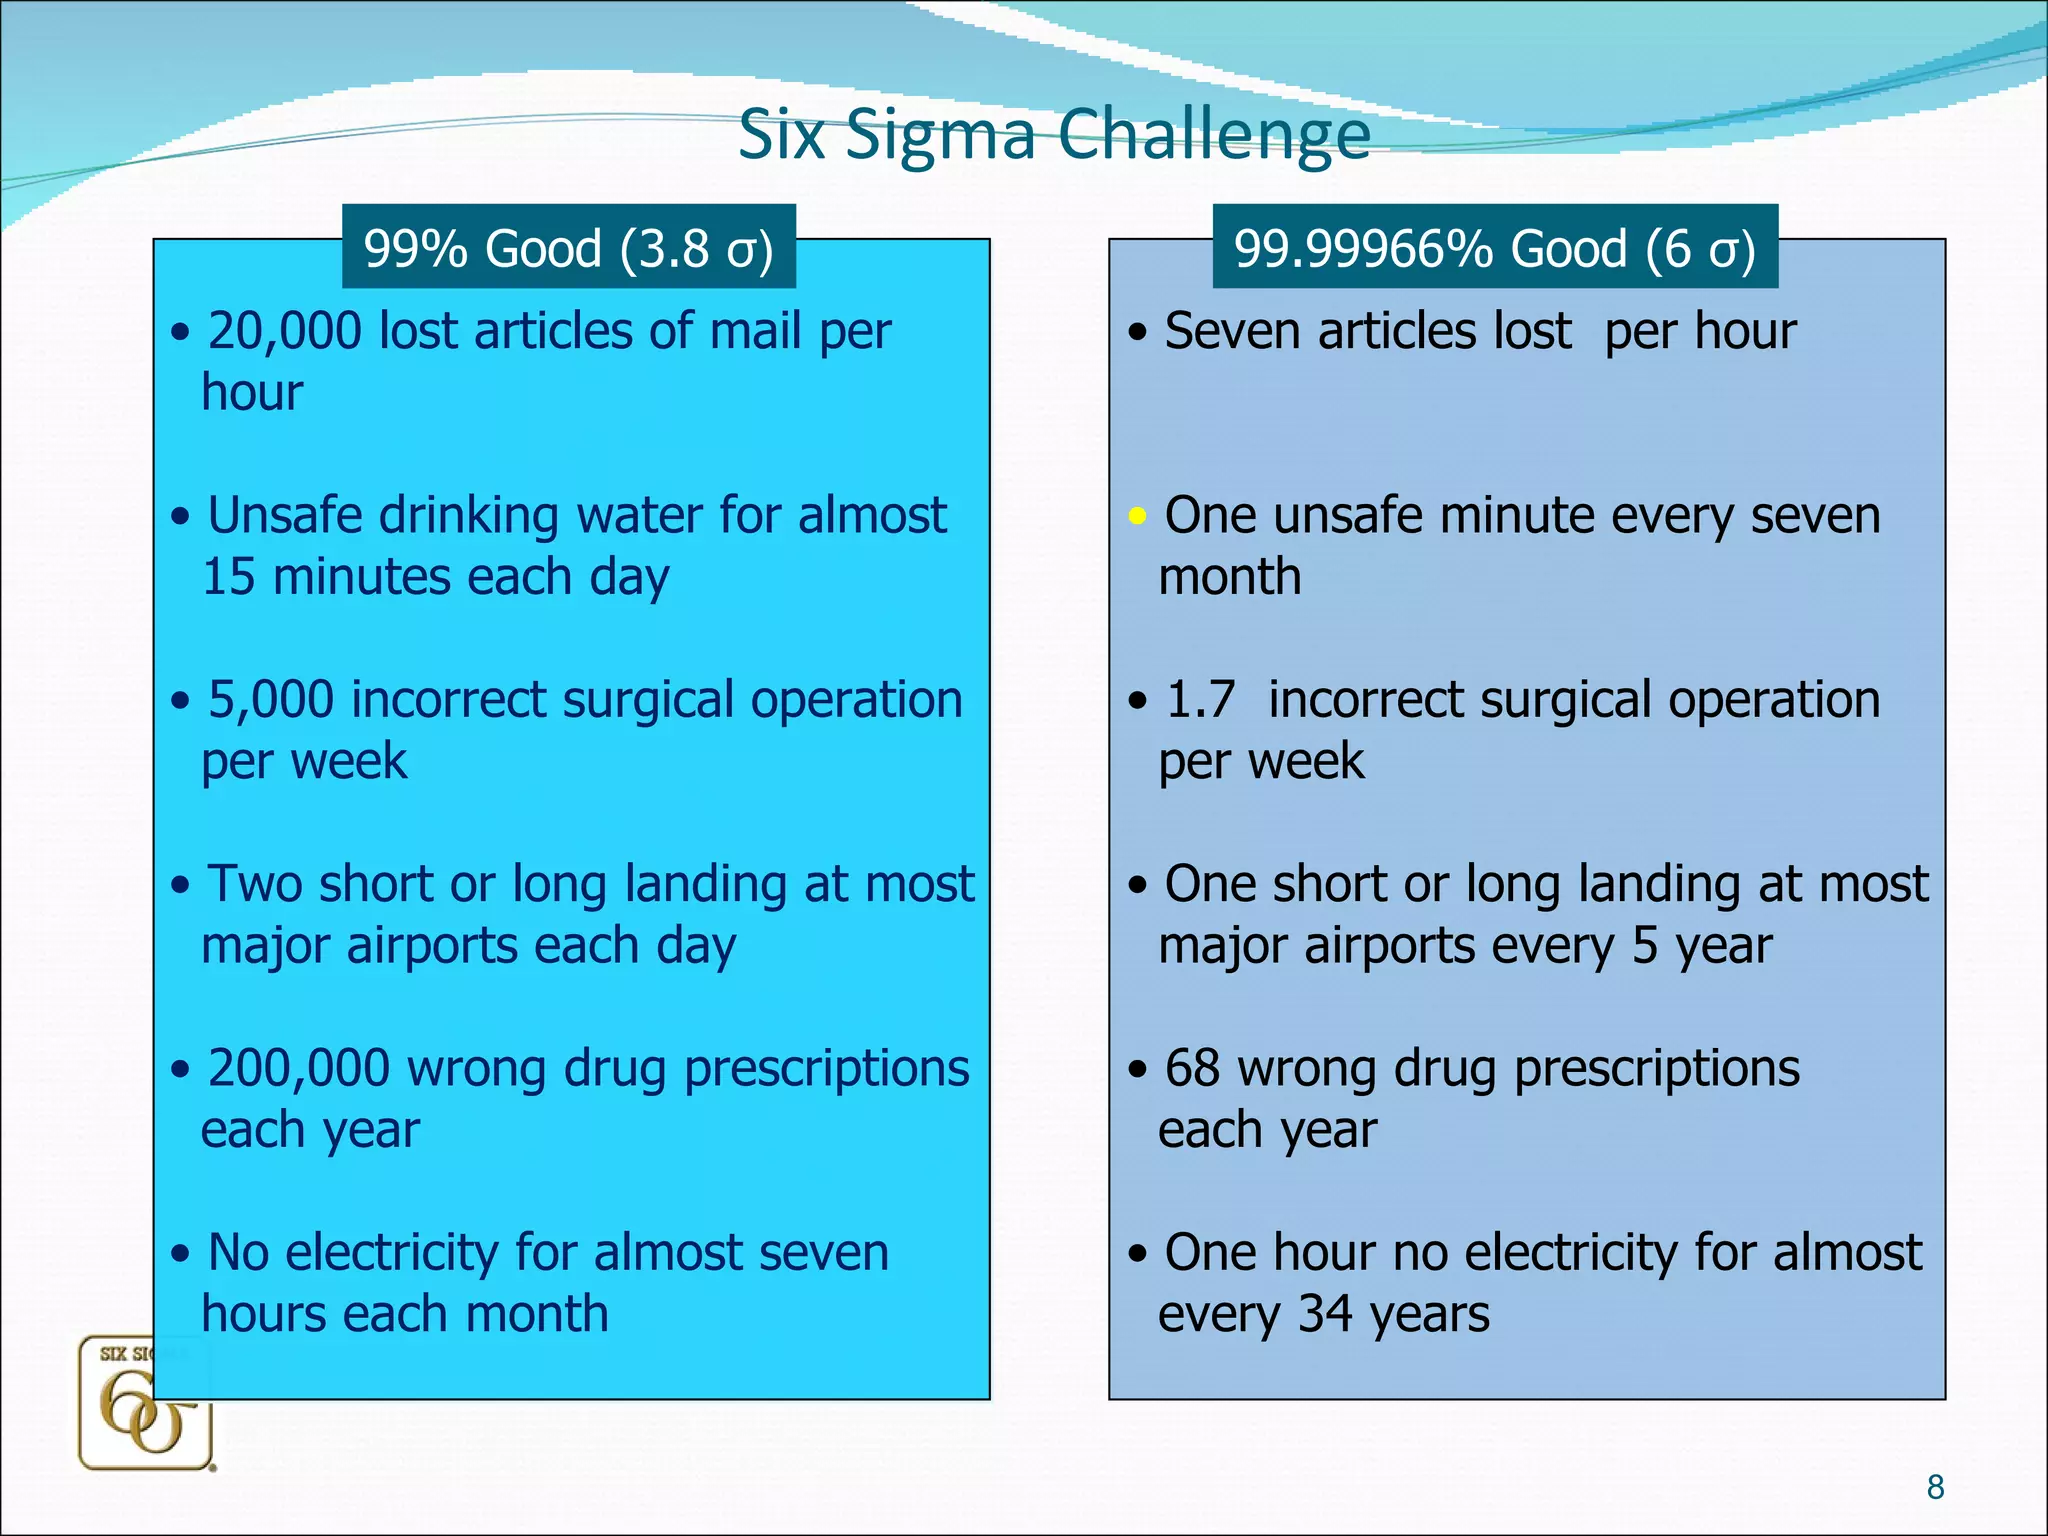
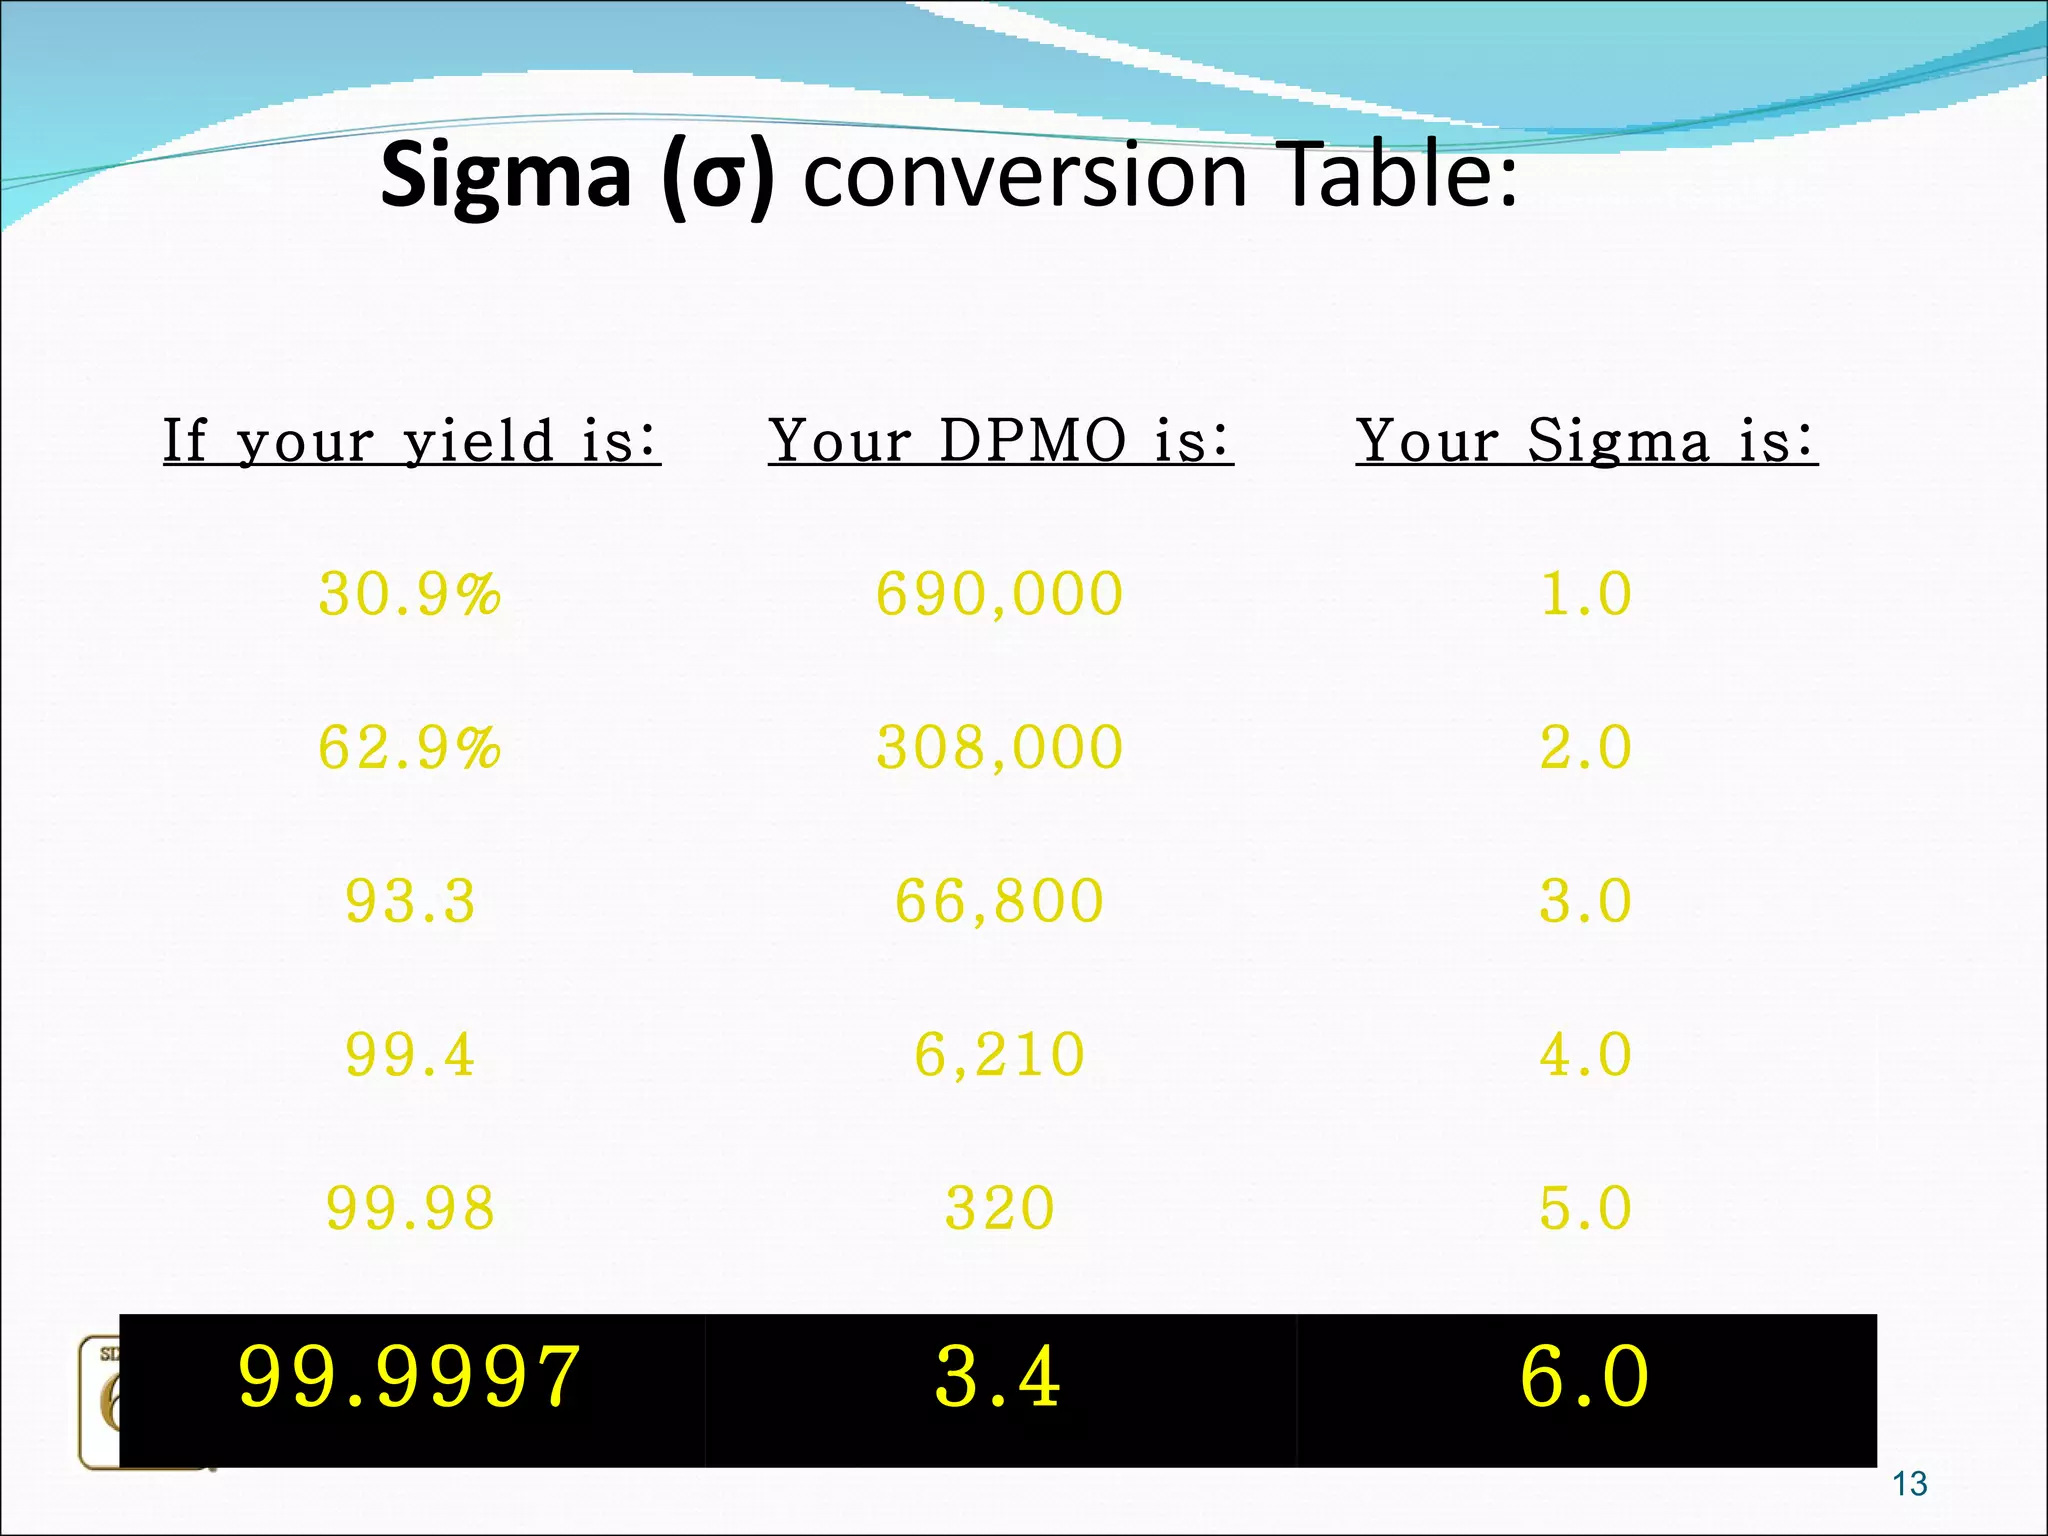
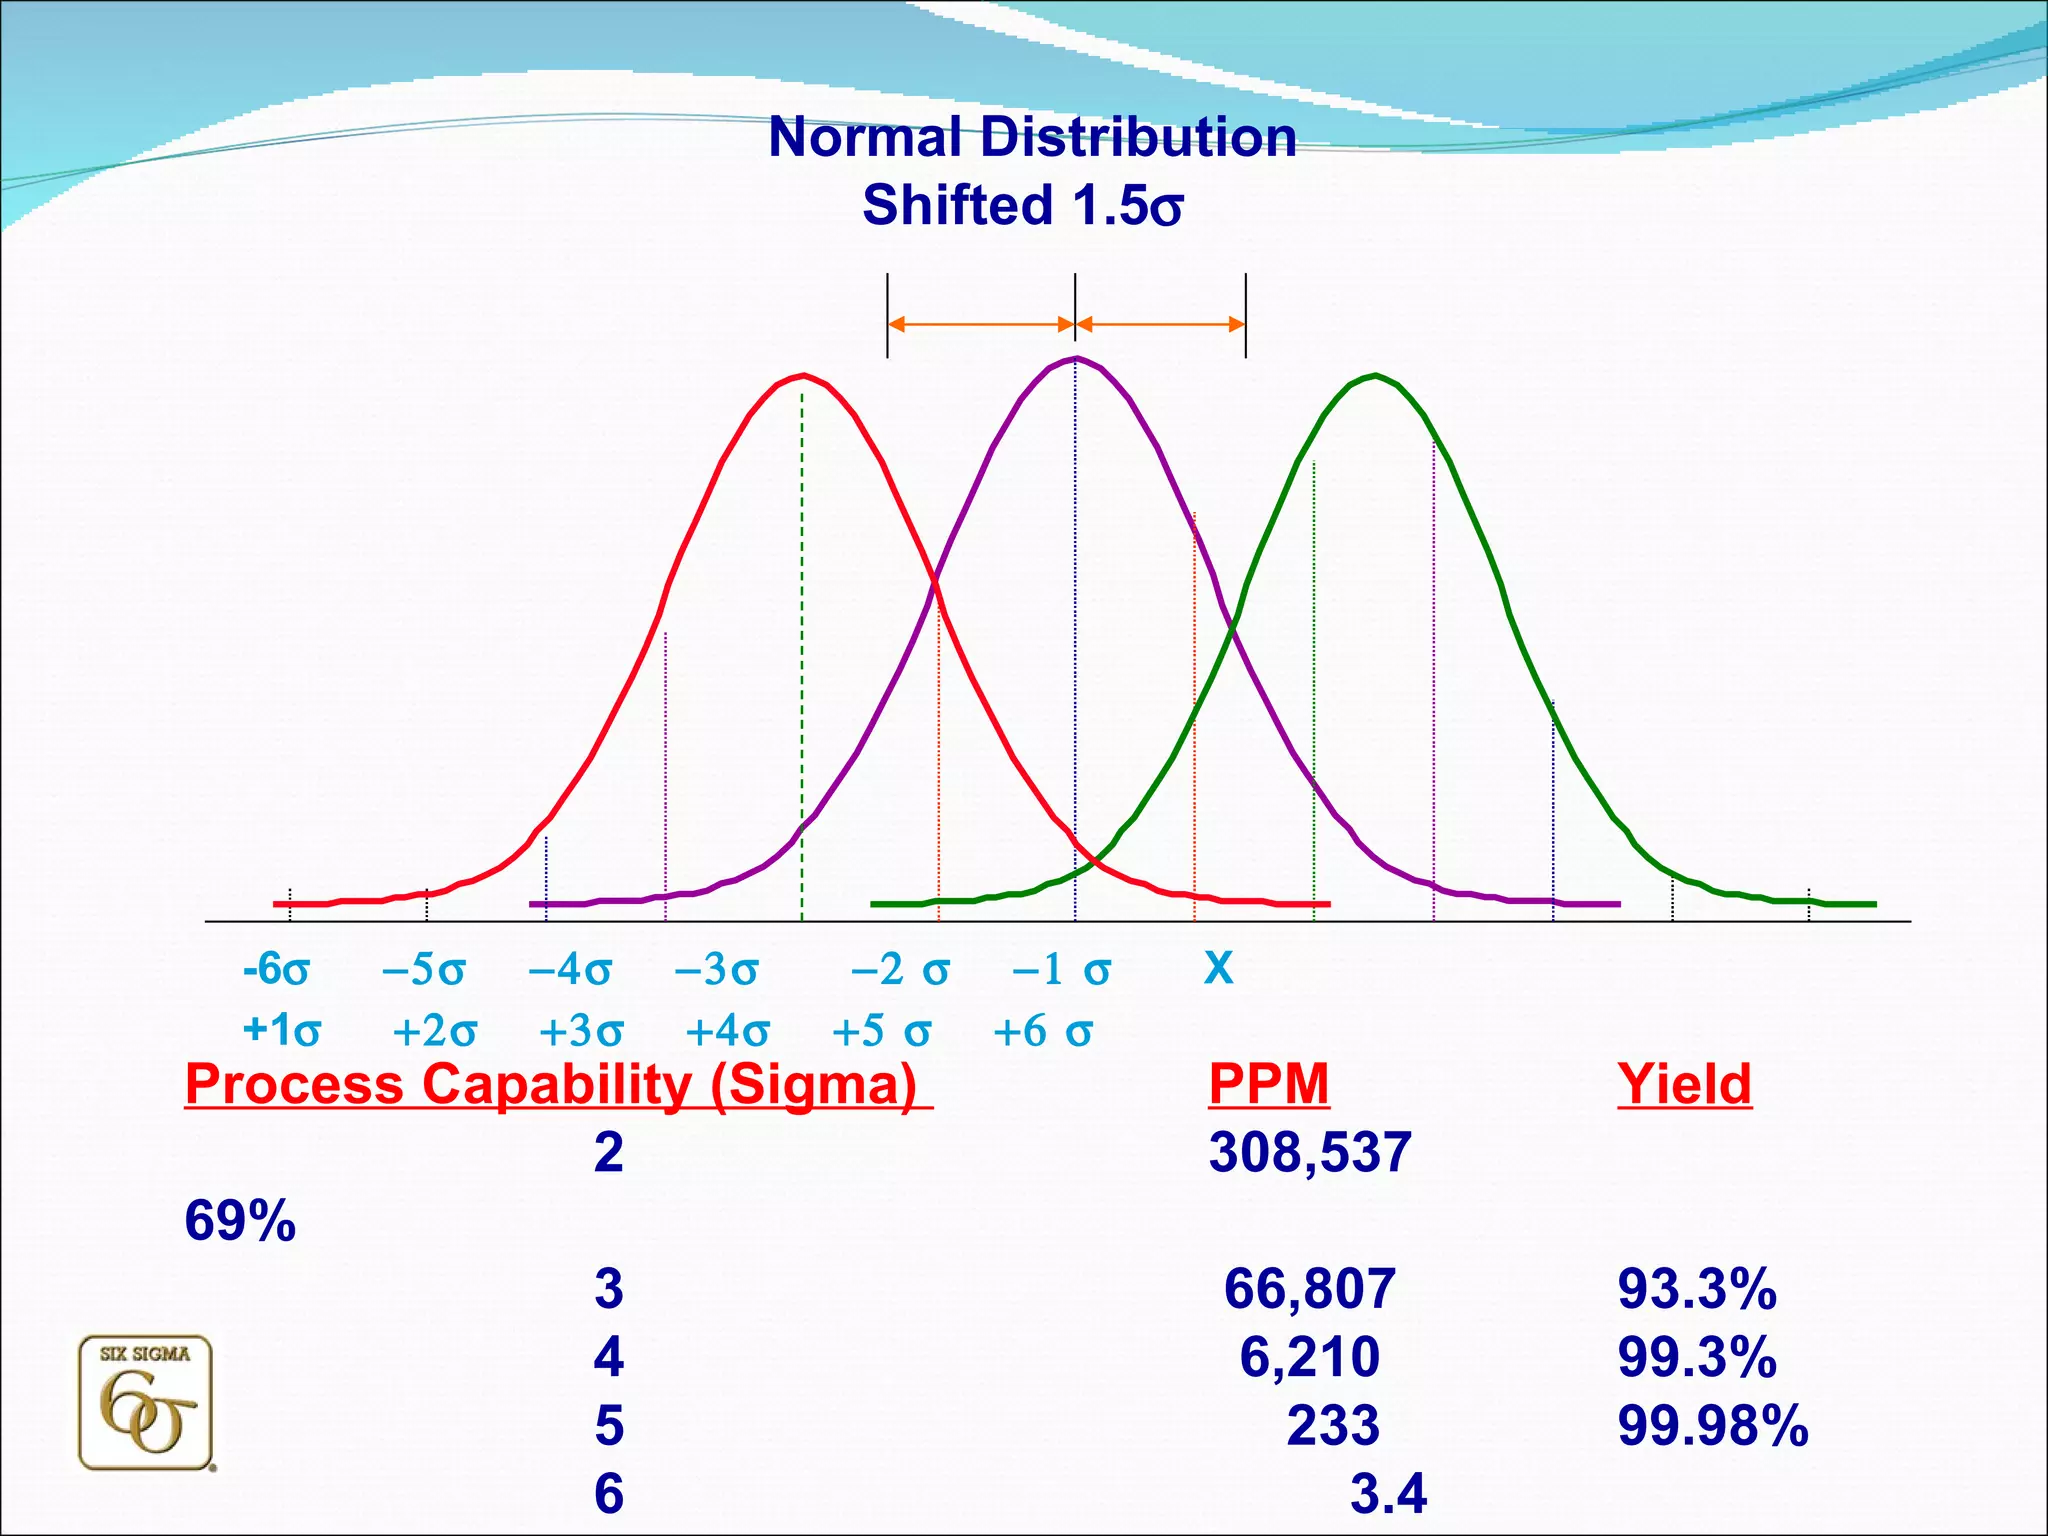
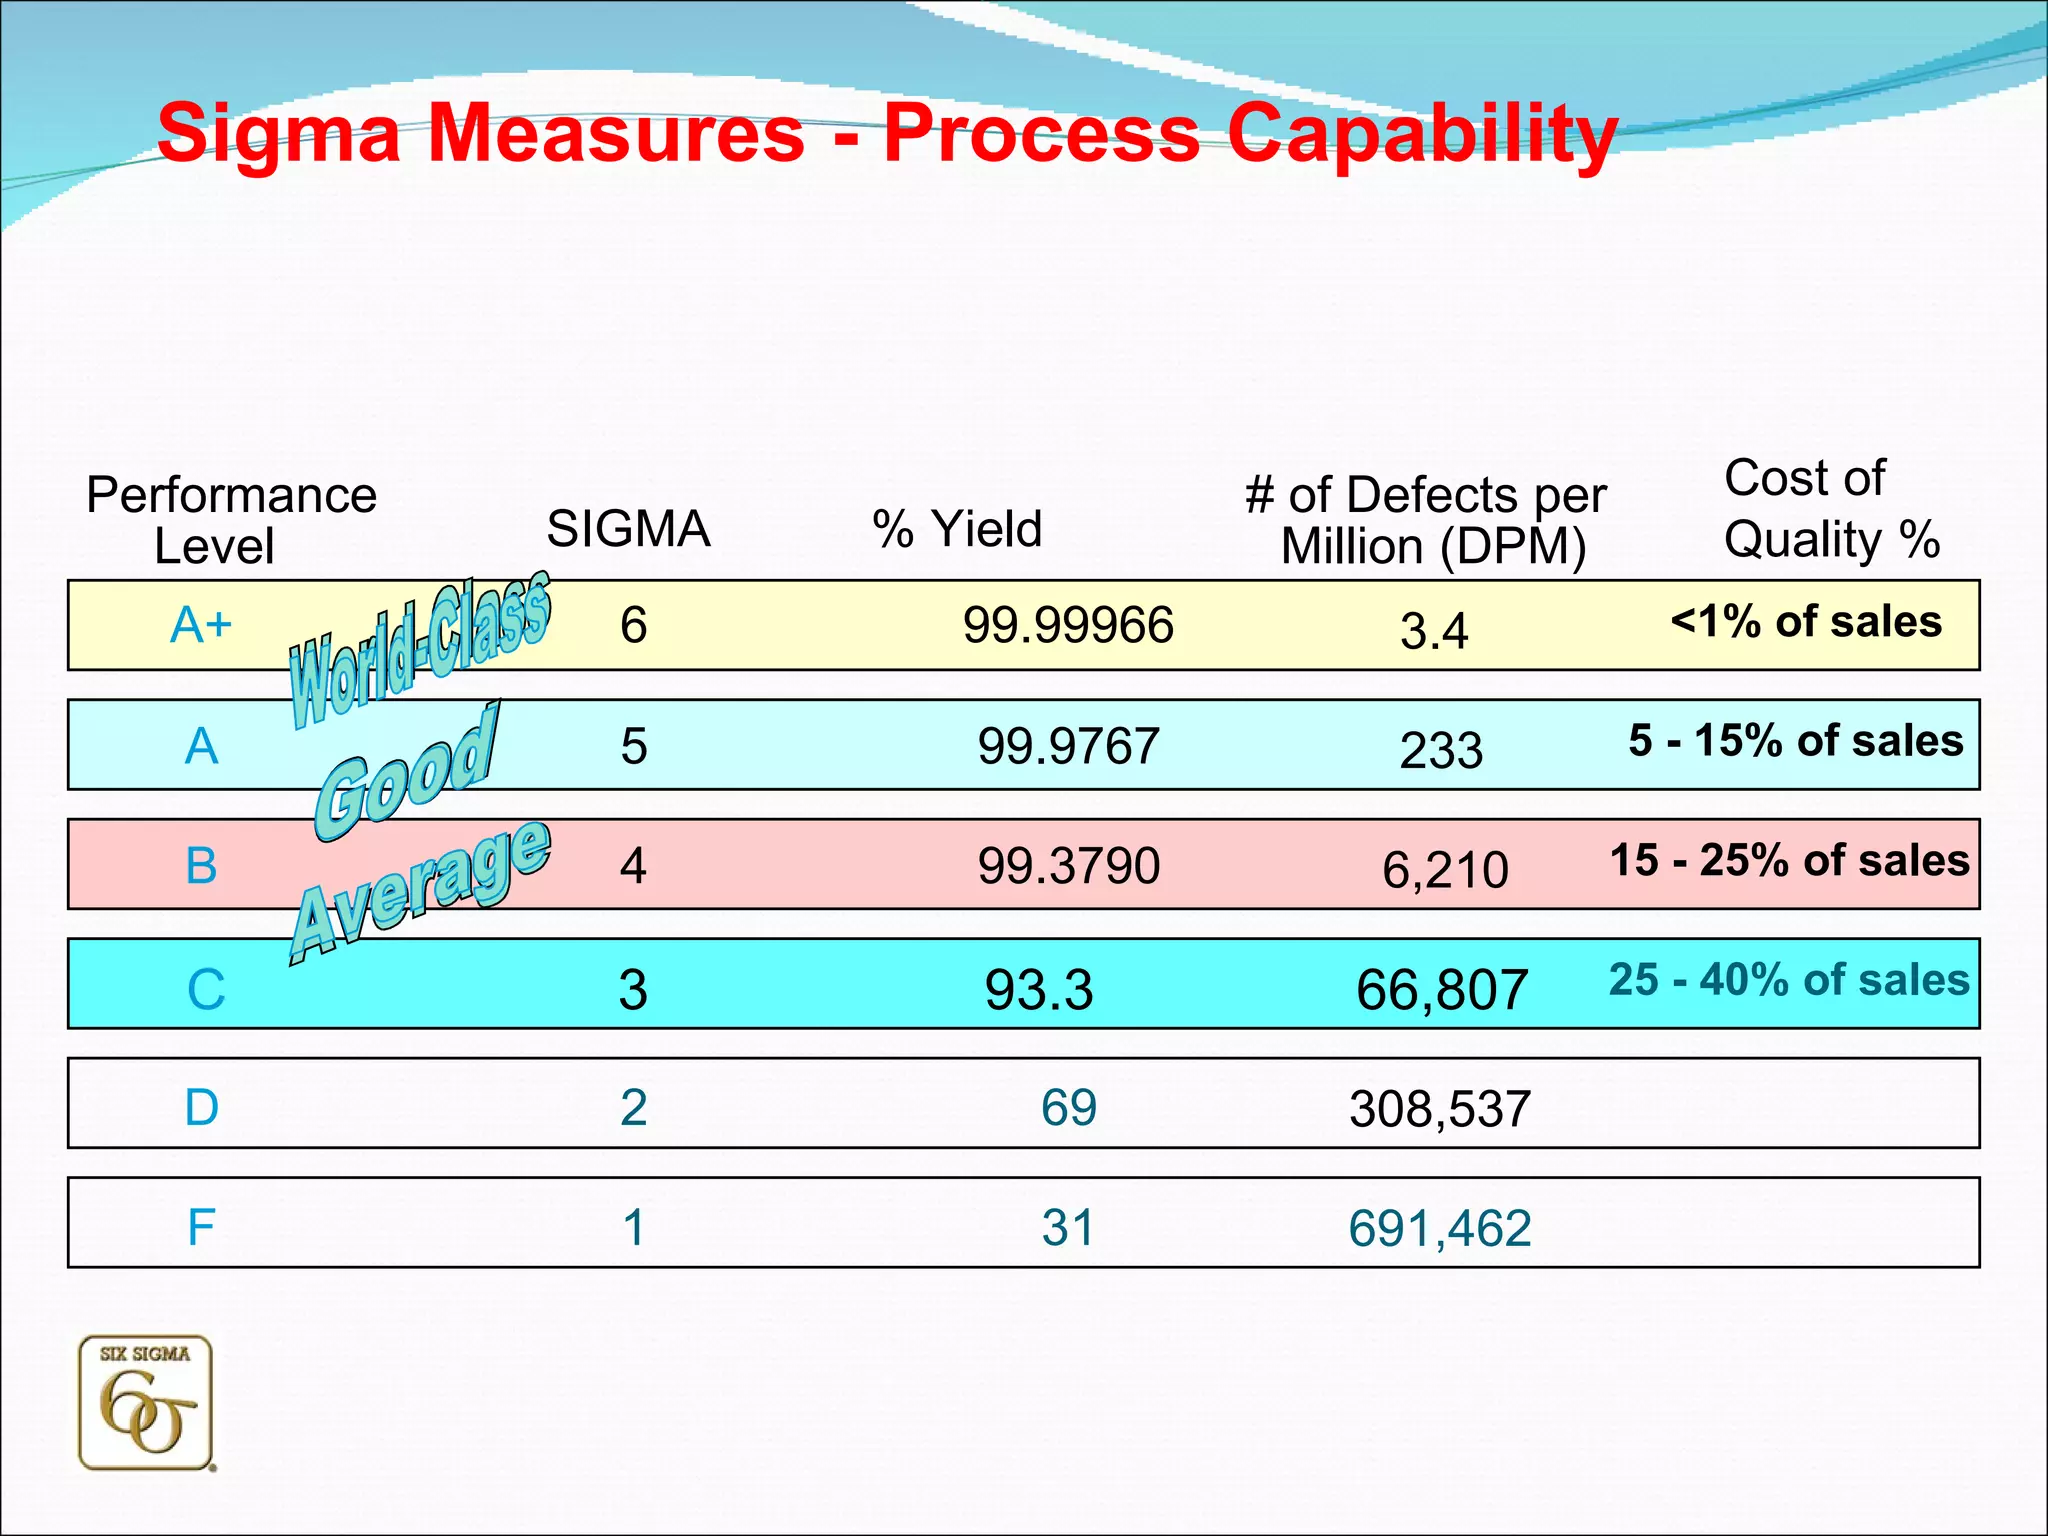
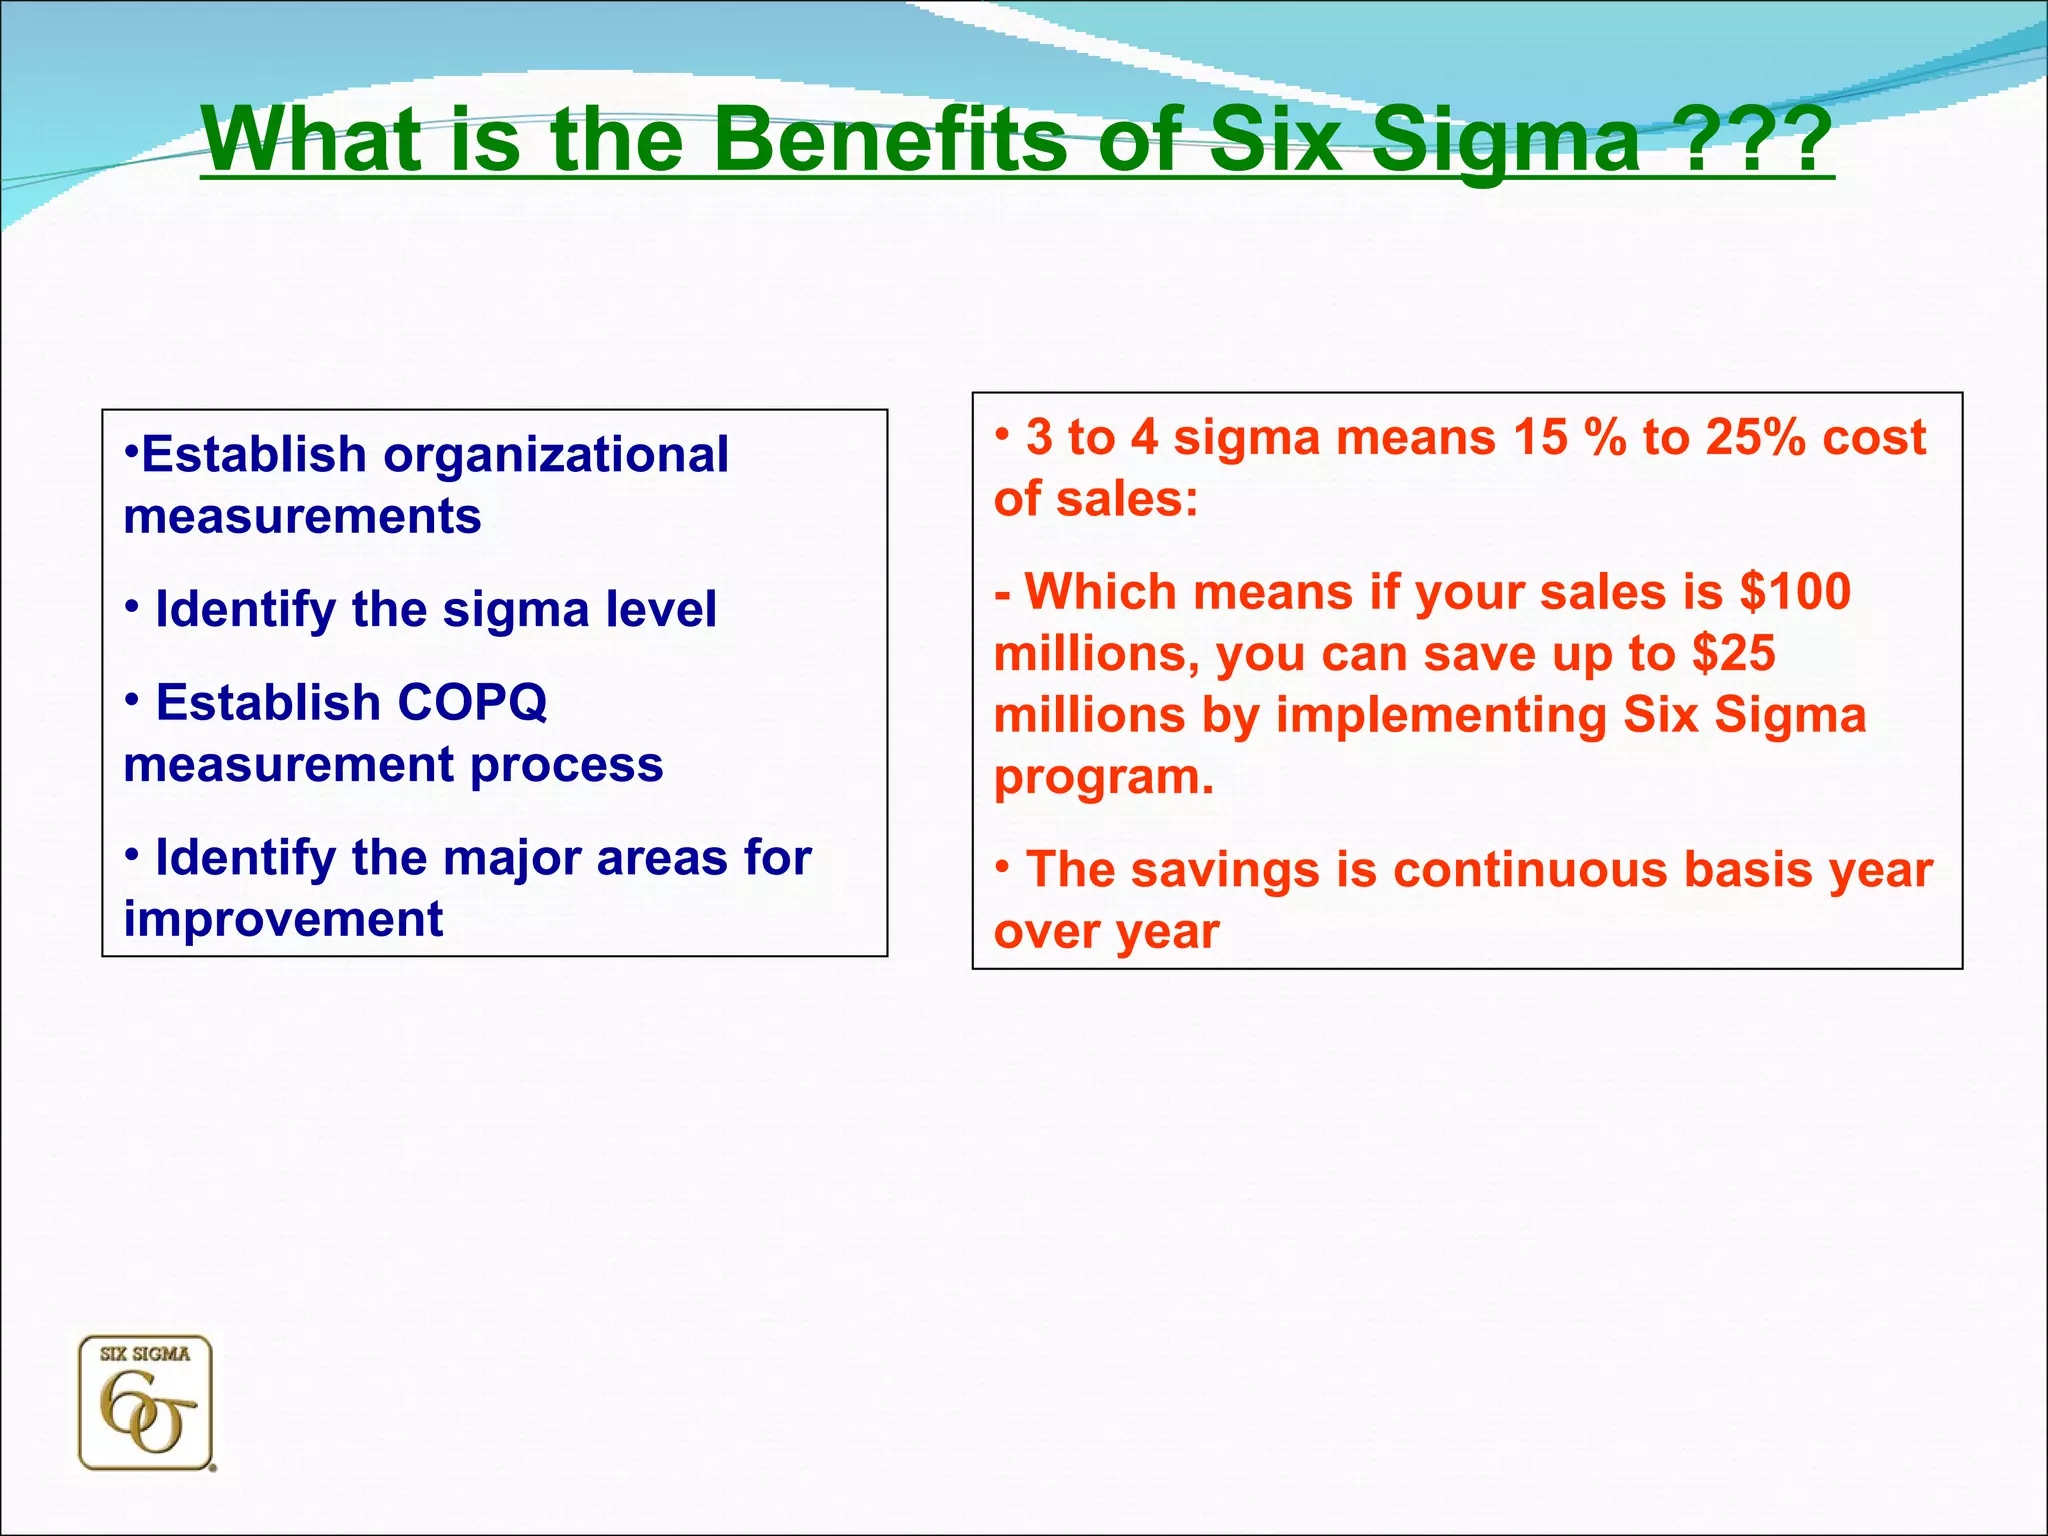


The document discusses the origins and concepts of Six Sigma. It began at Motorola in 1987 and was later adopted by other companies like GE. Six Sigma aims to reduce defects to 3.4 per million opportunities by driving processes to operate with as little variability as possible. It uses statistical methods and process improvement tools to help companies lower costs, increase customer satisfaction and profits.


