Download as PDF, PPTX
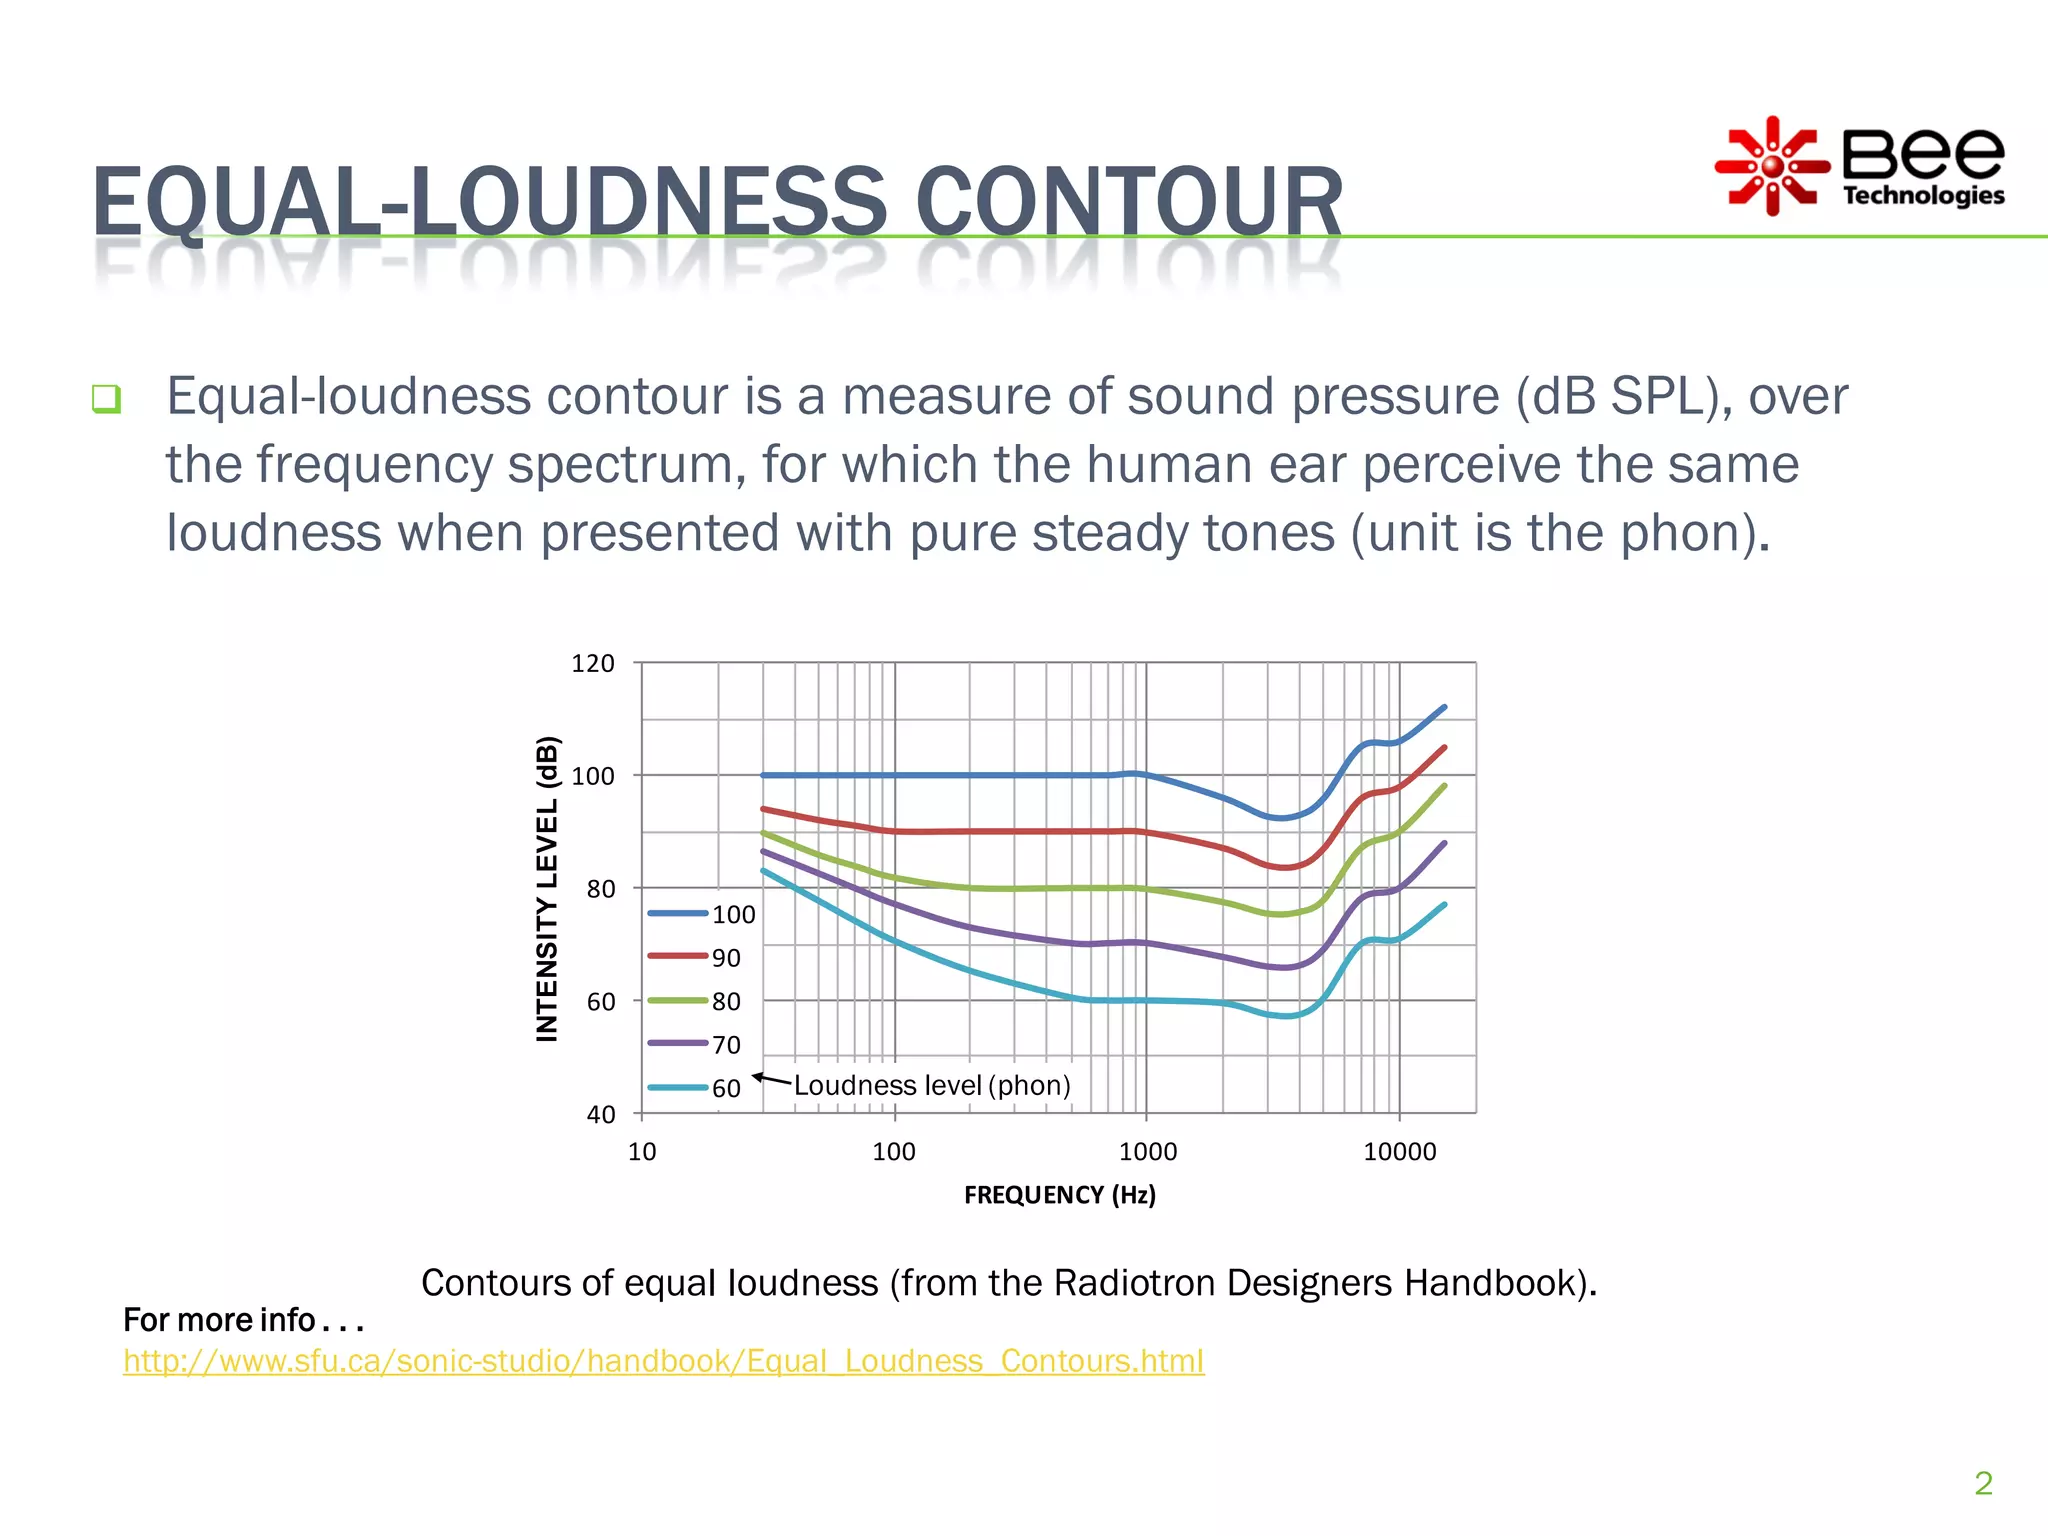
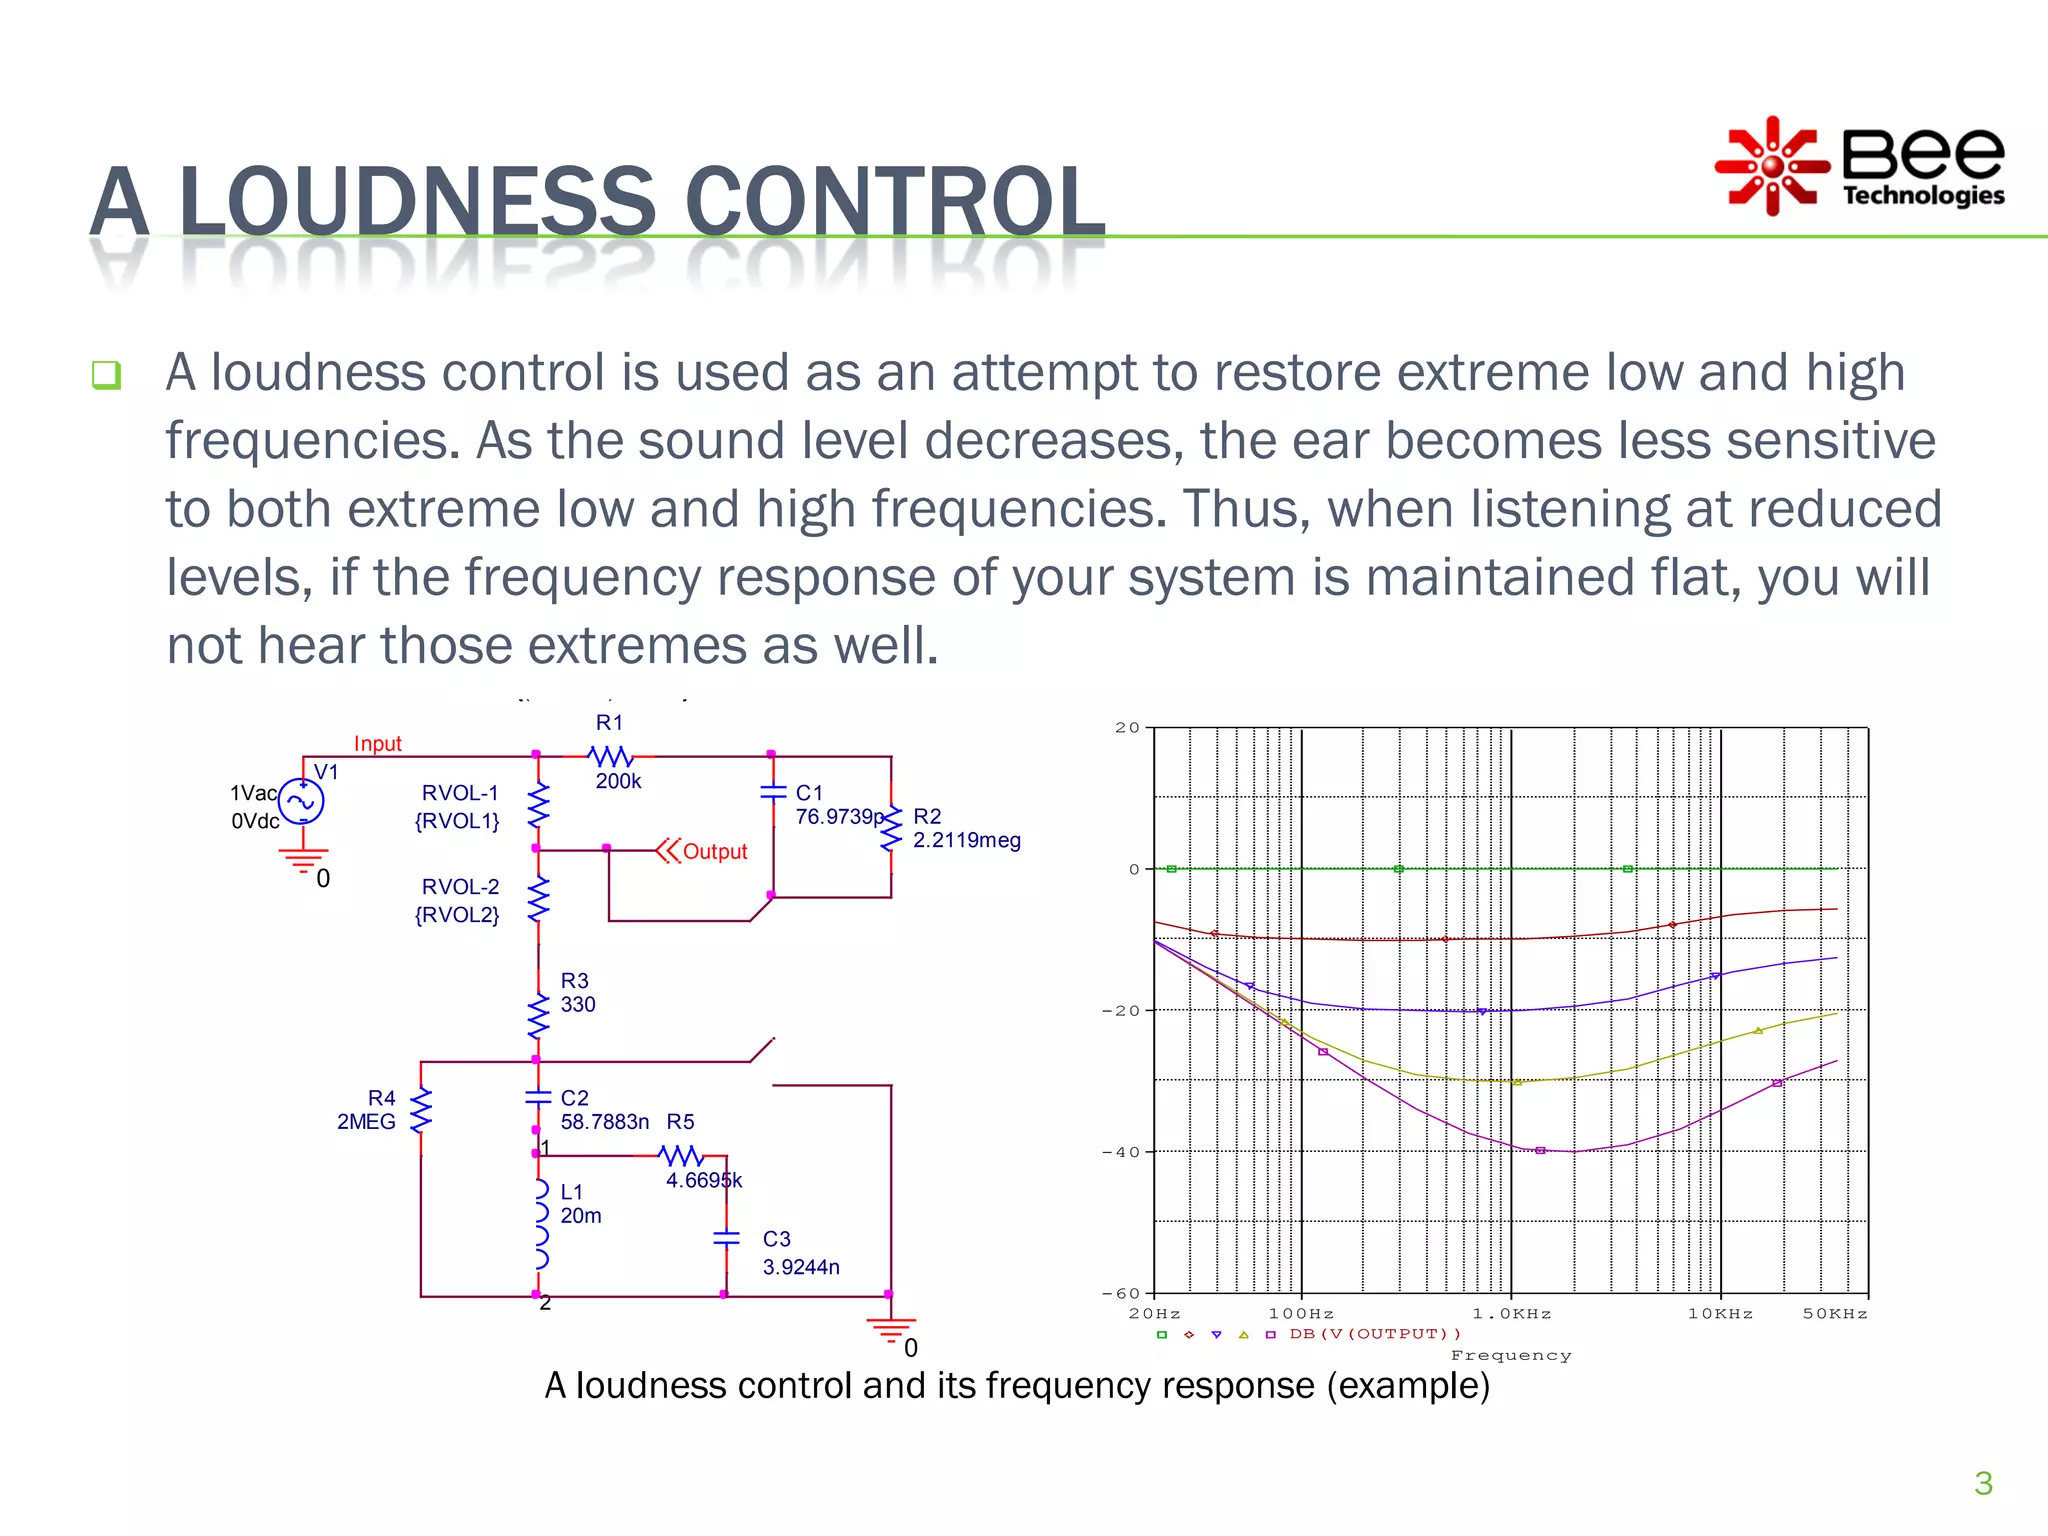
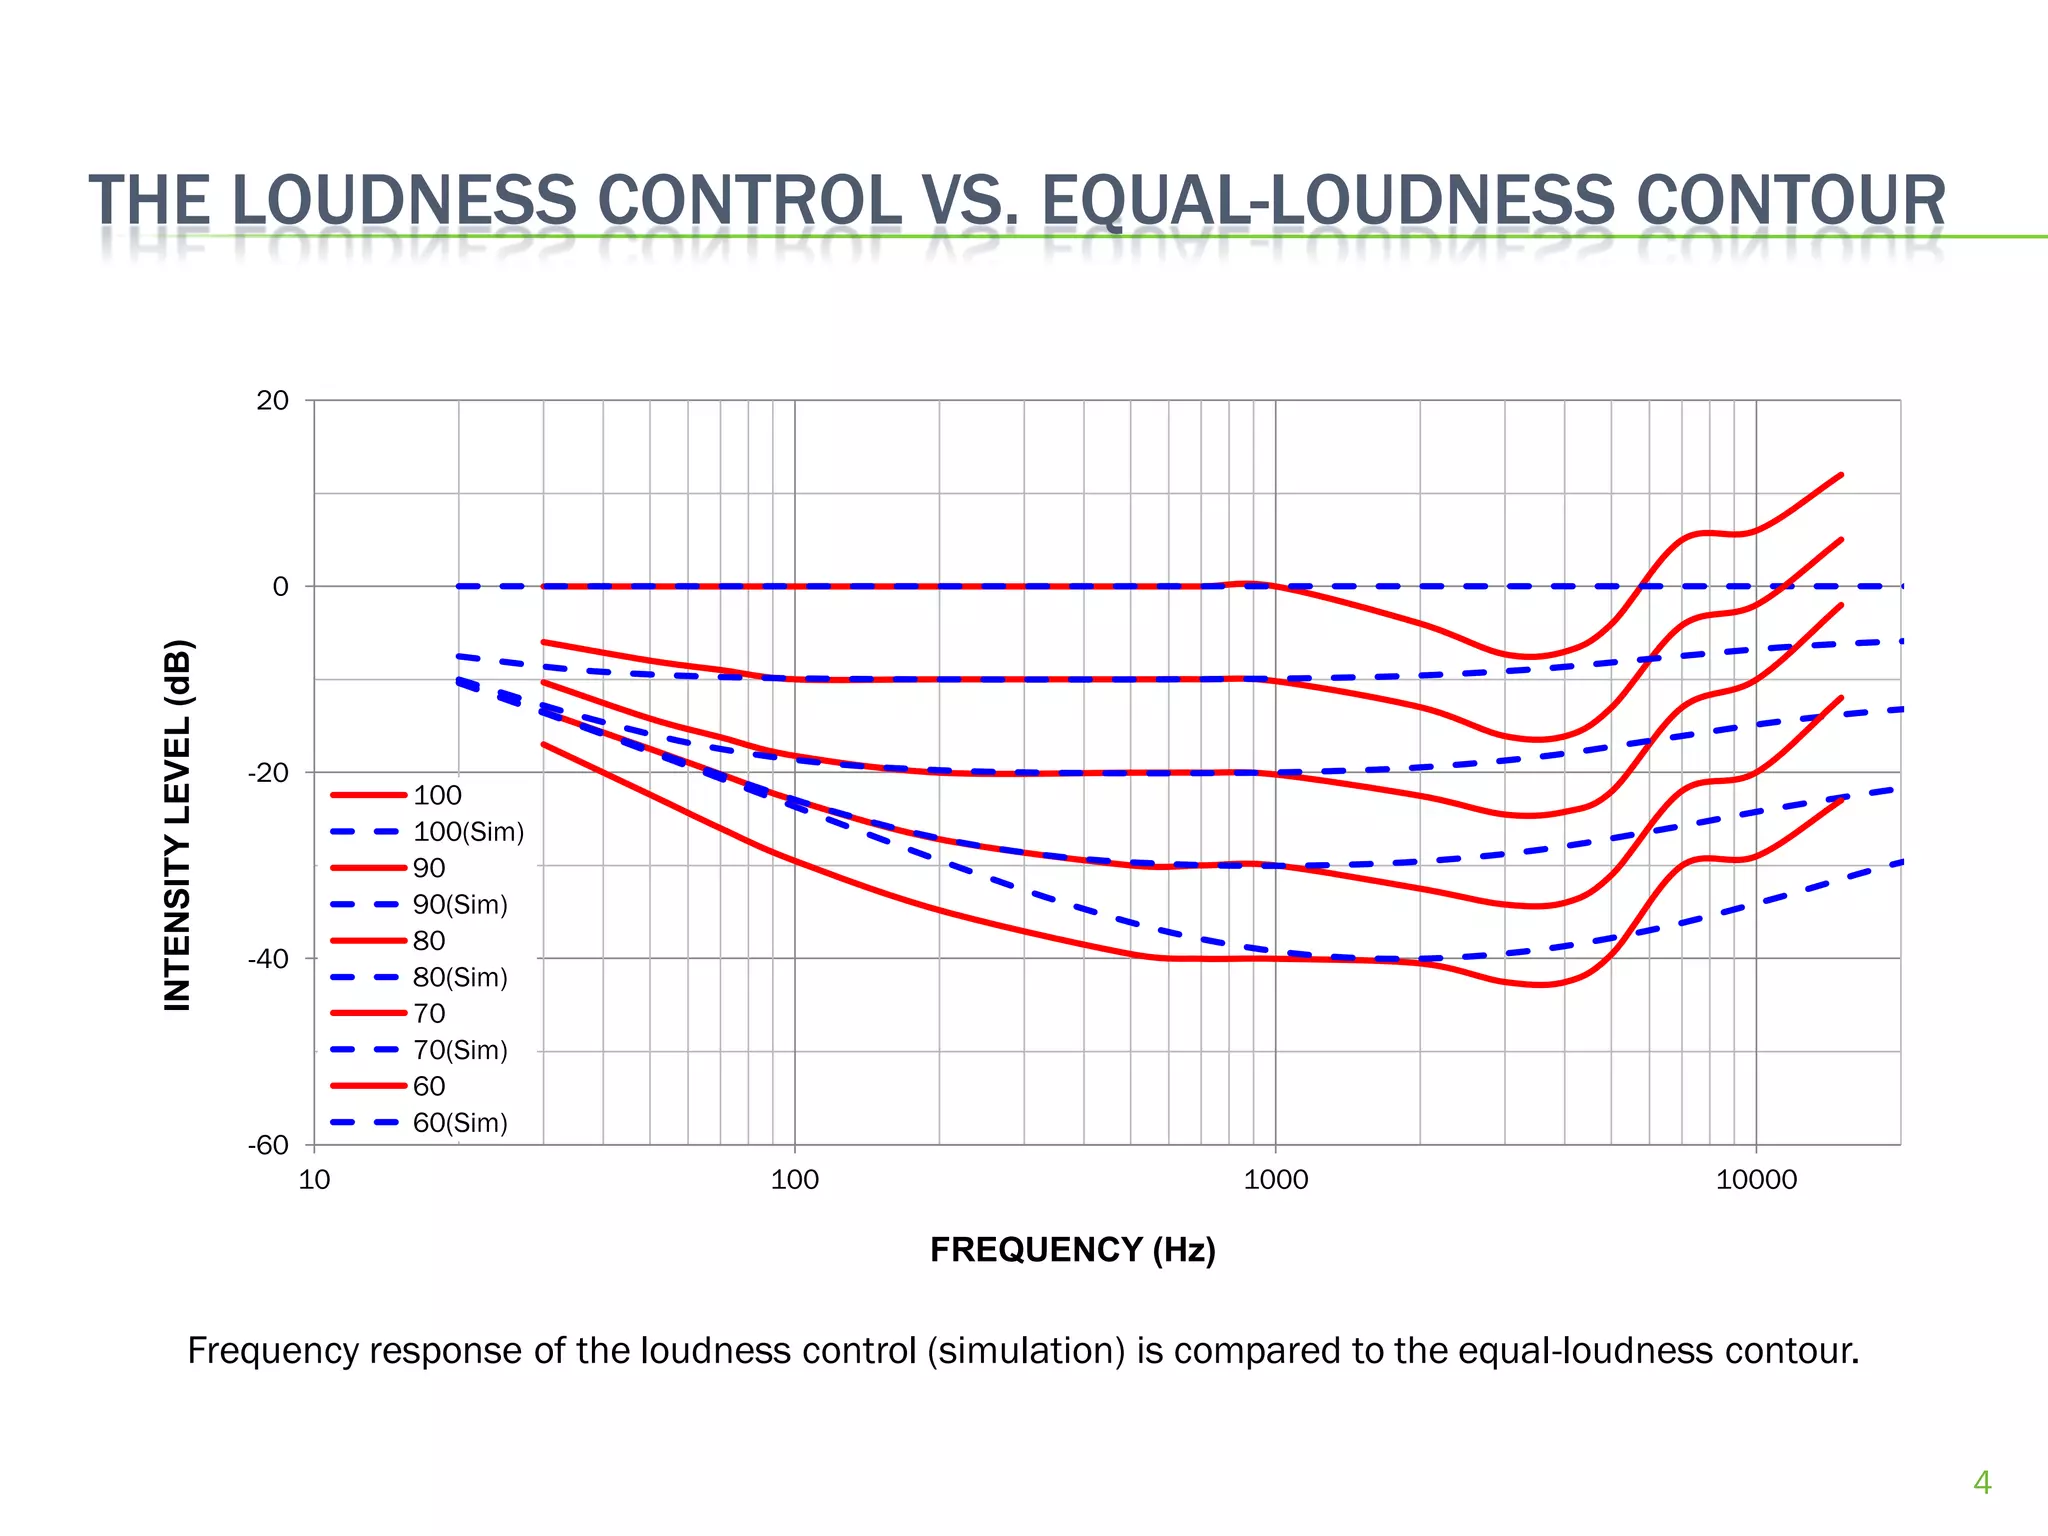
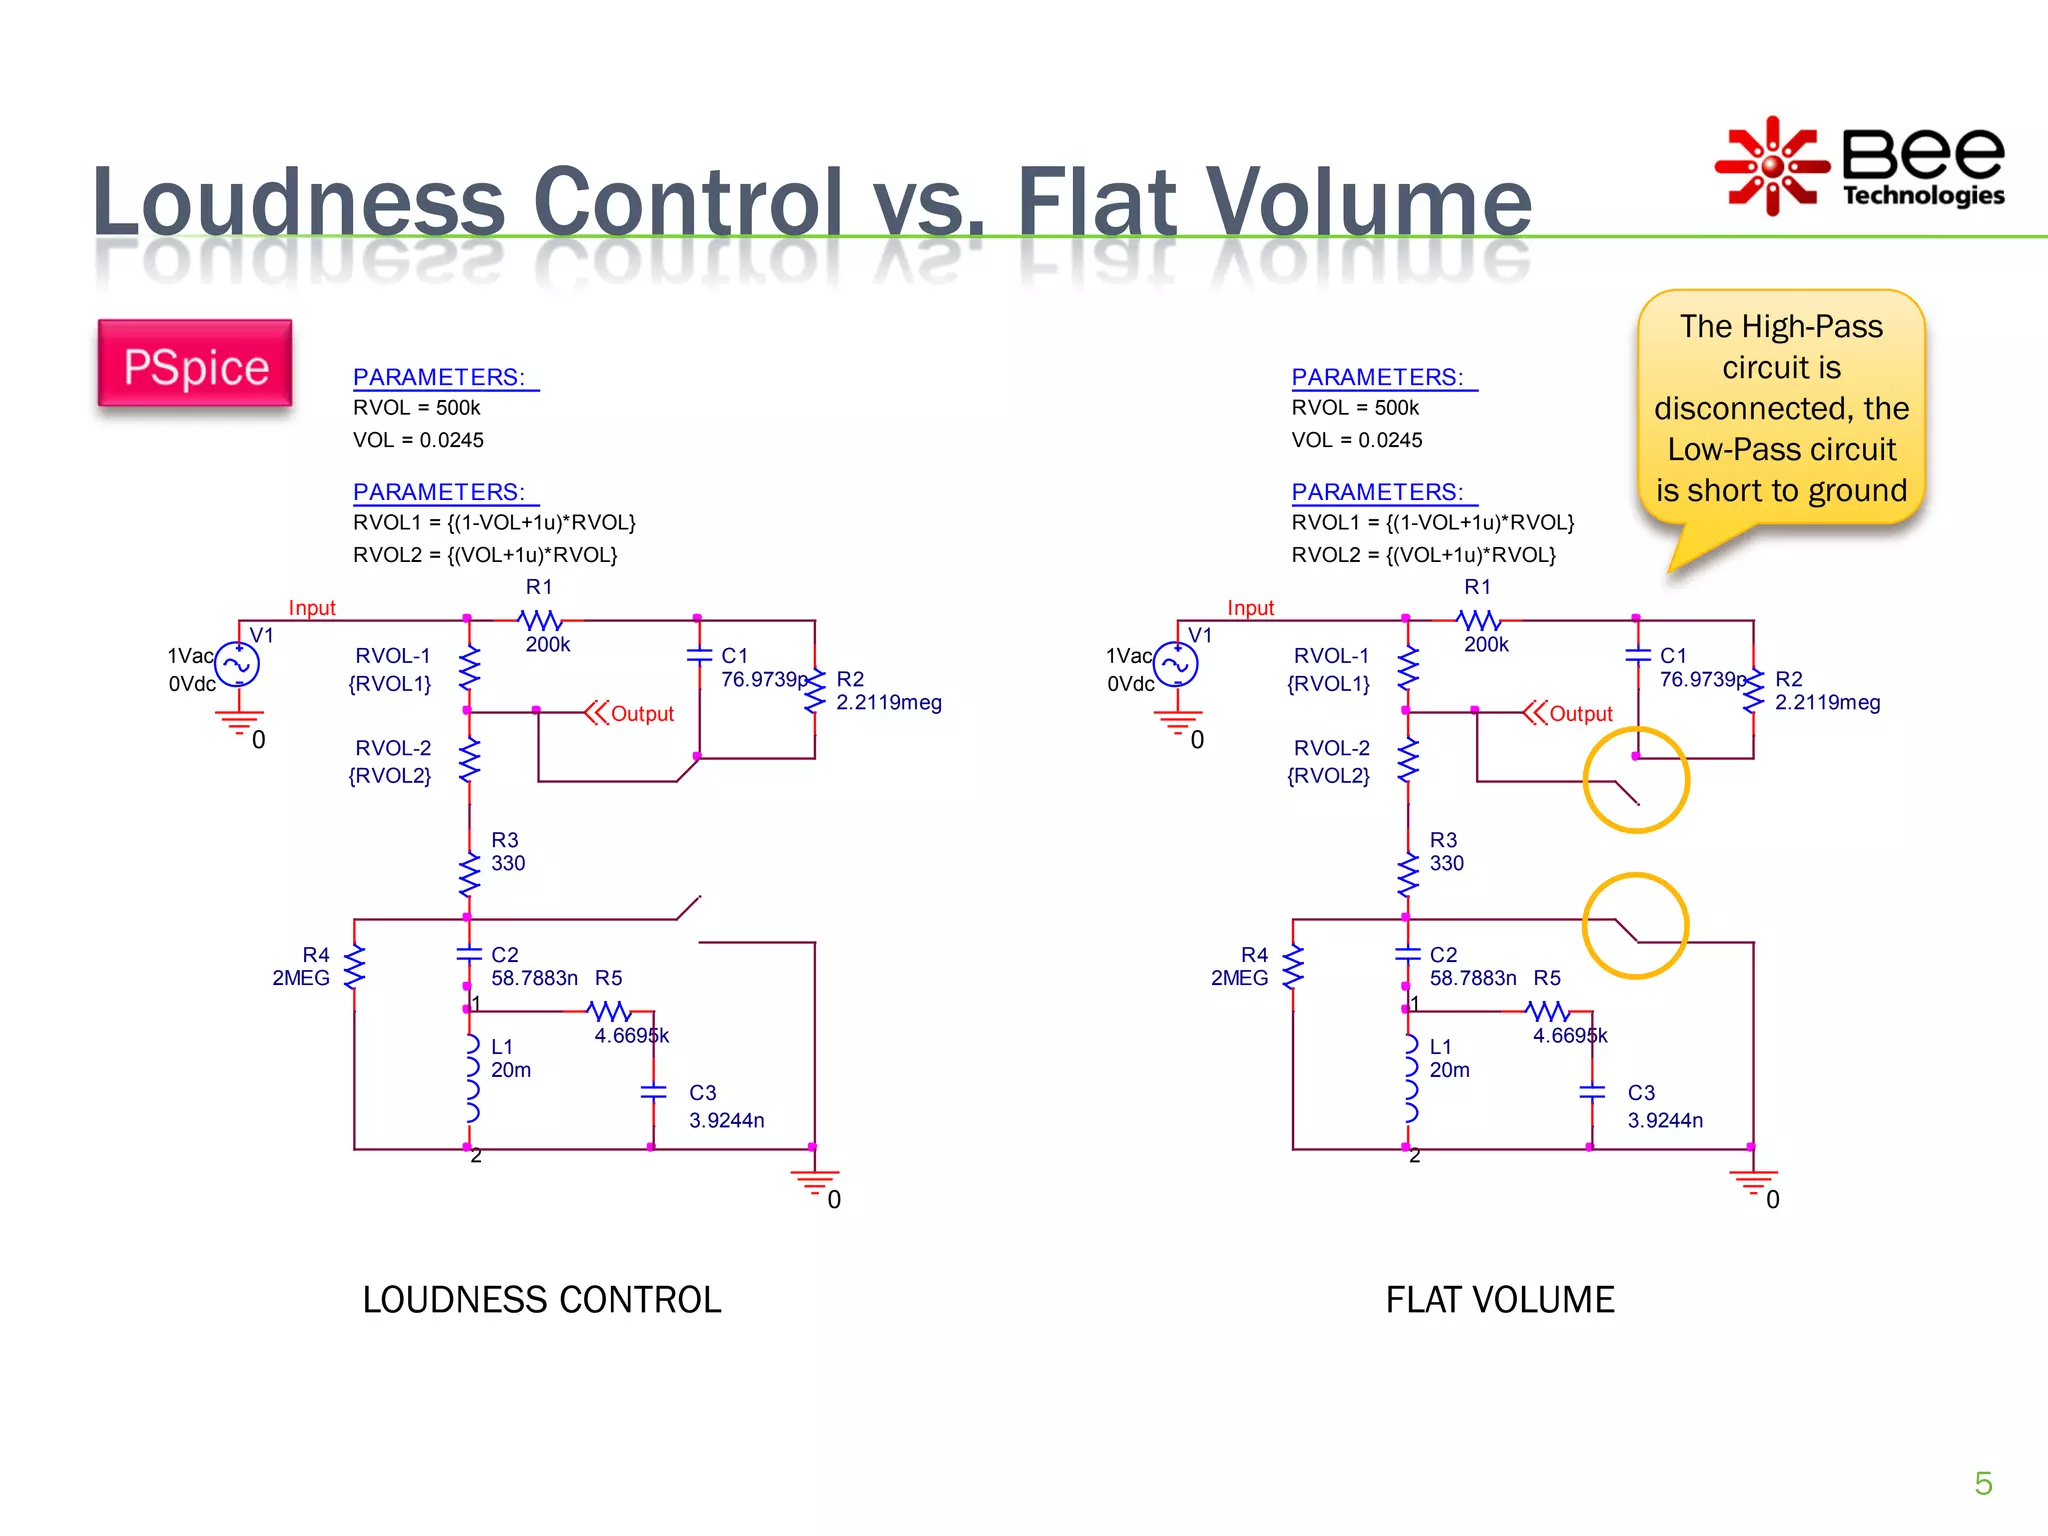
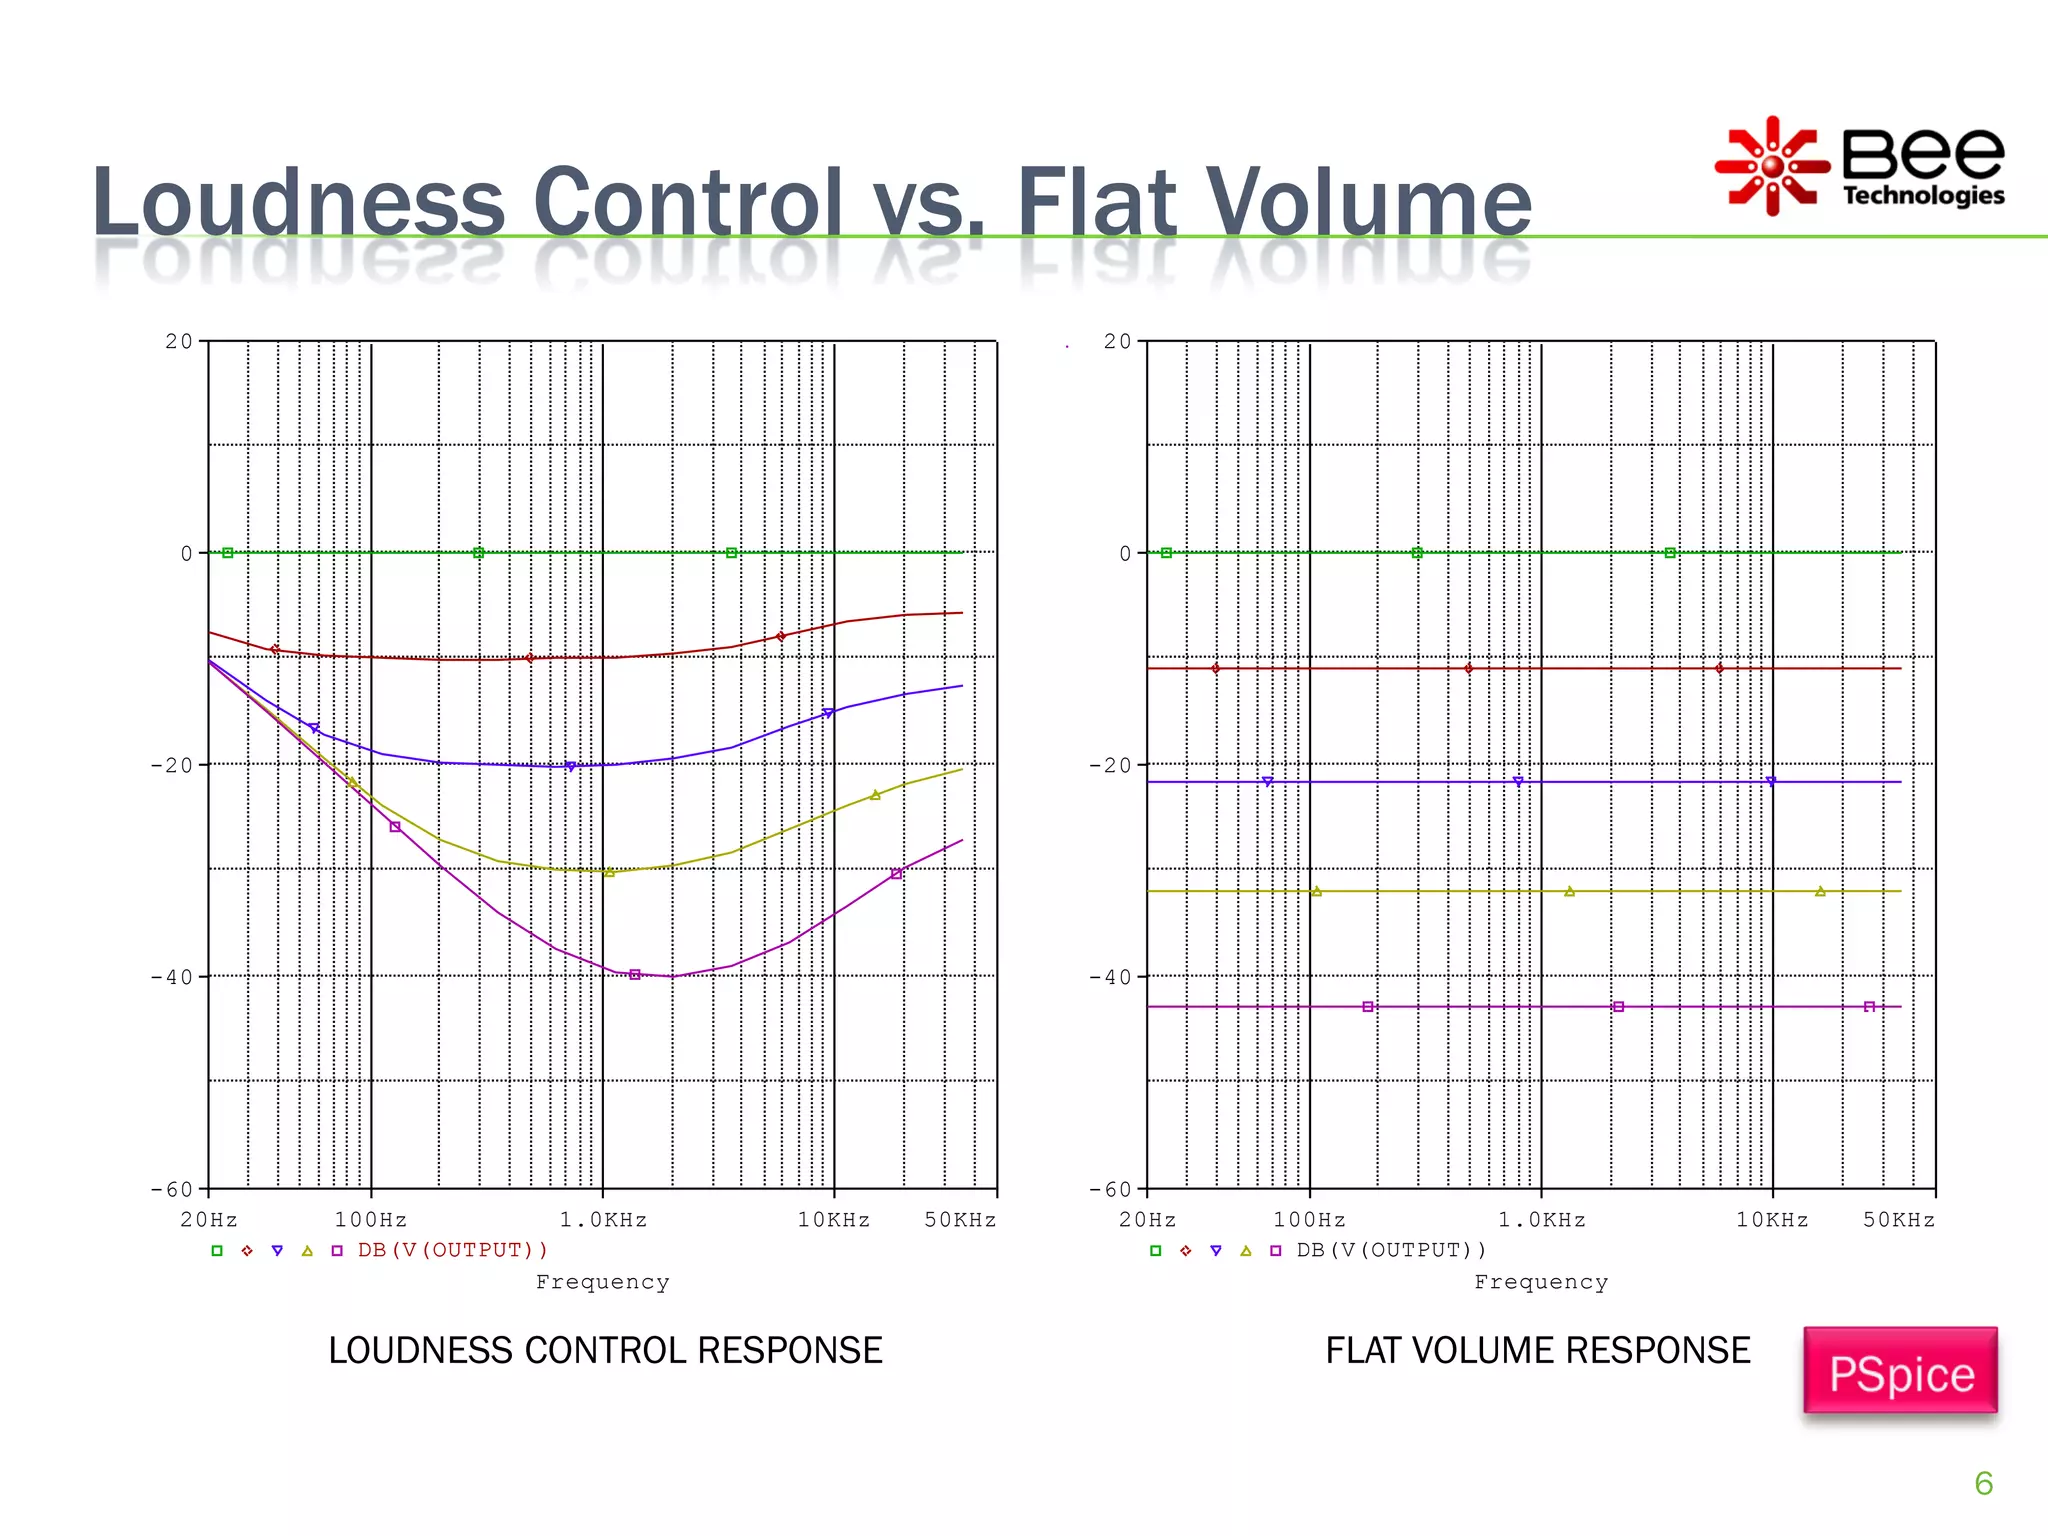
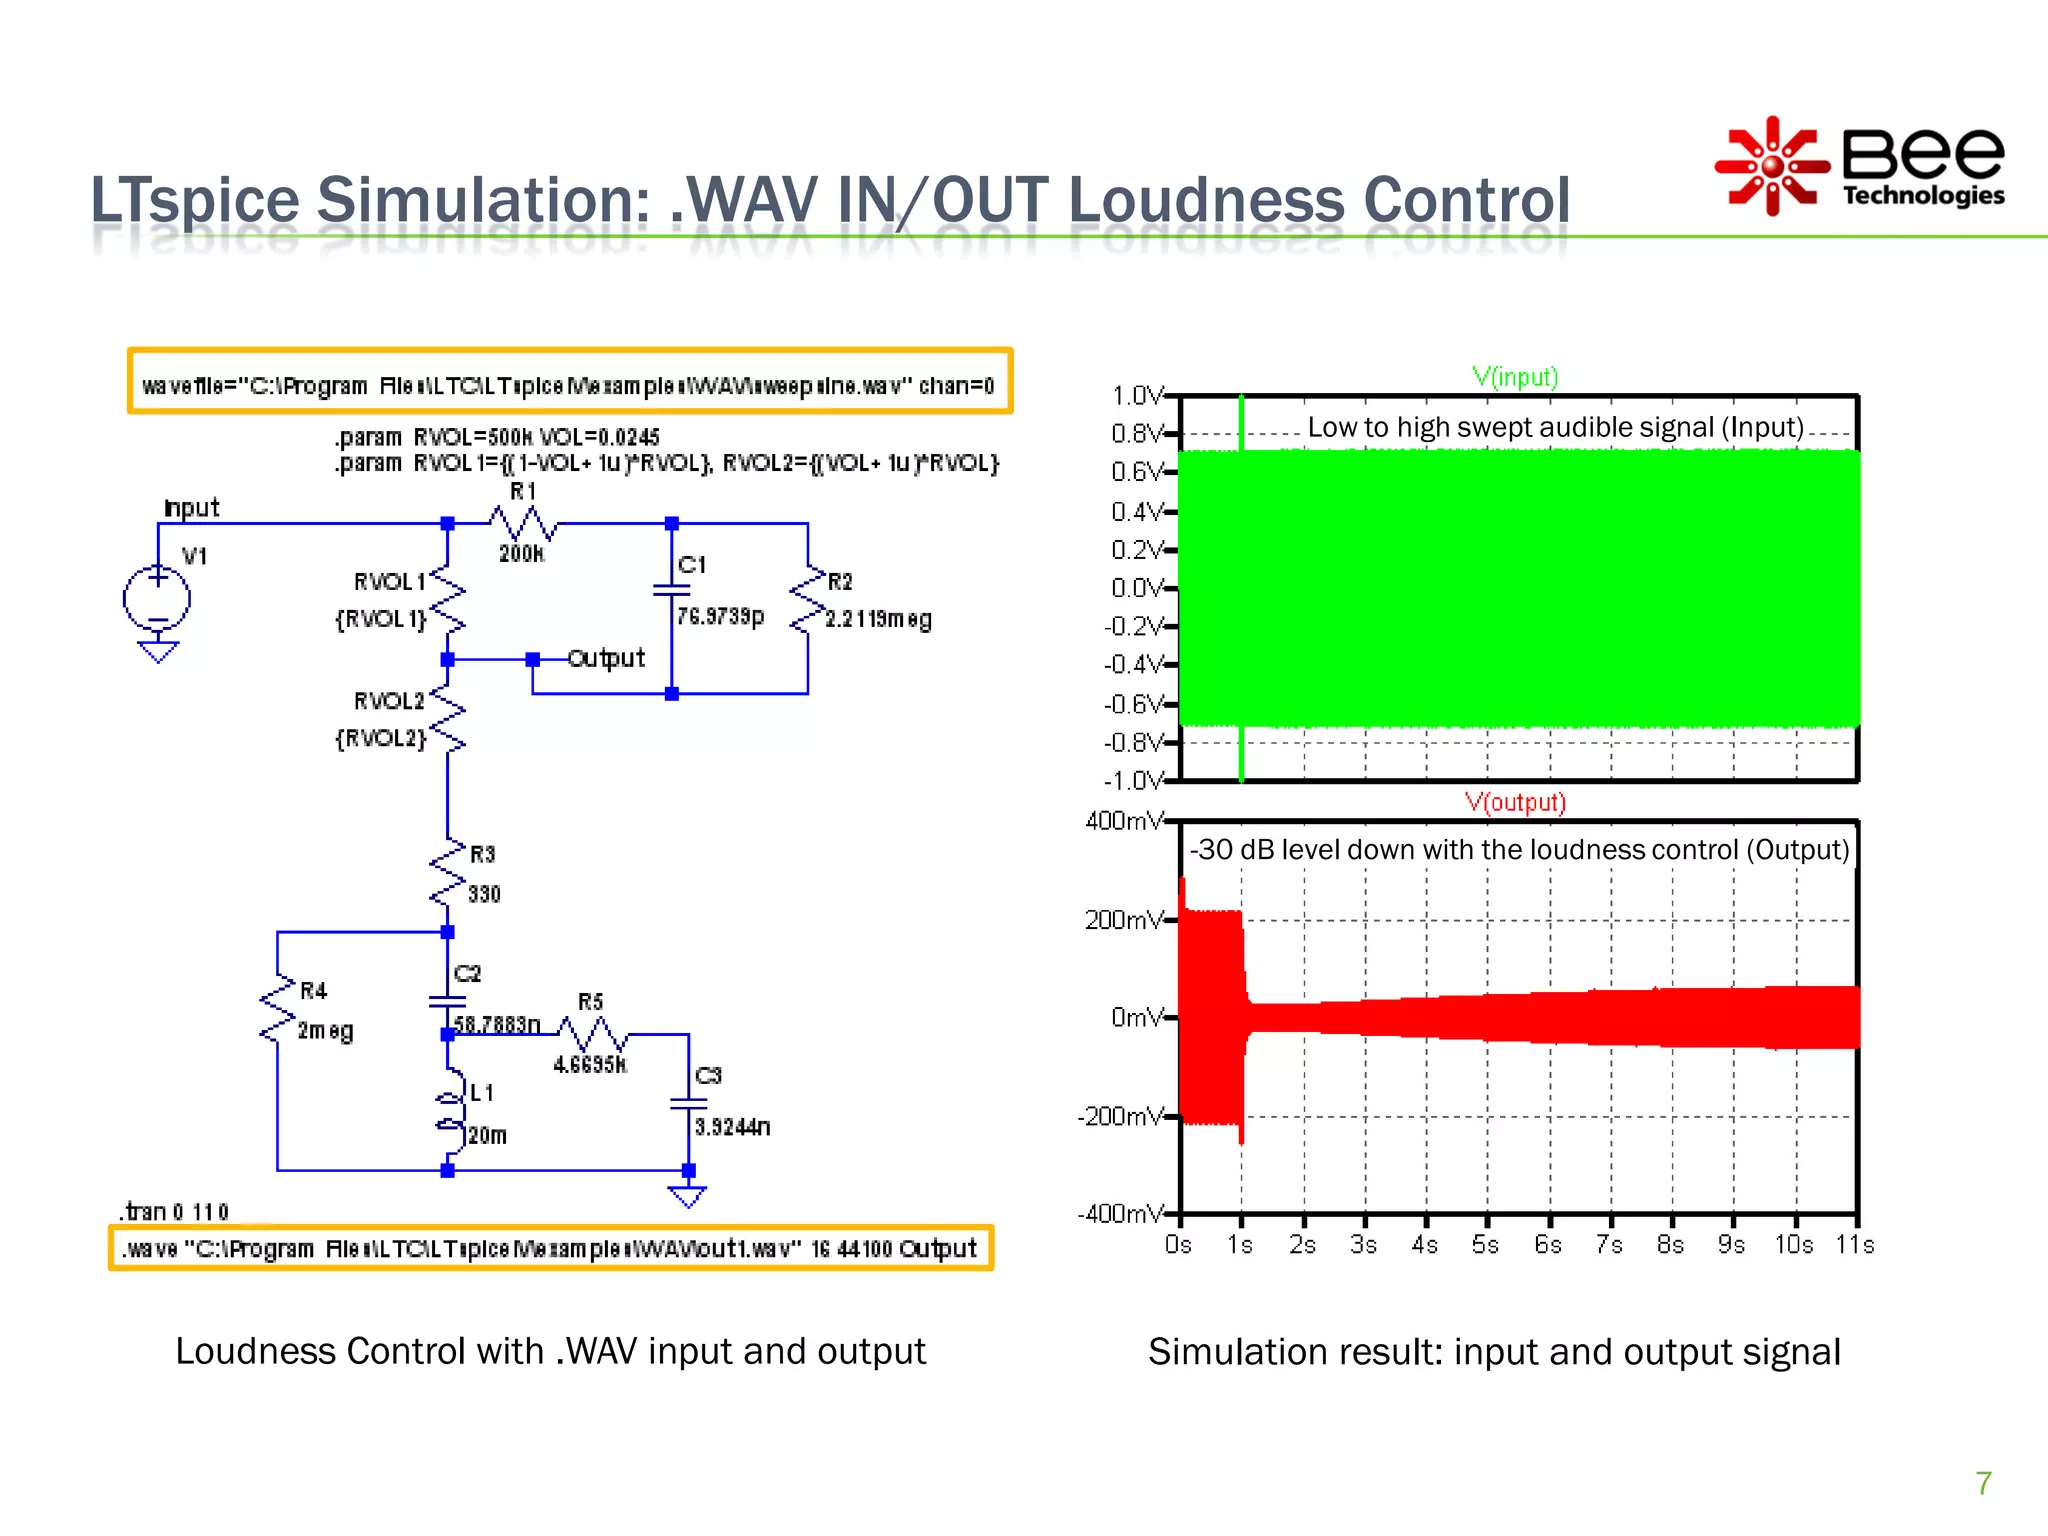
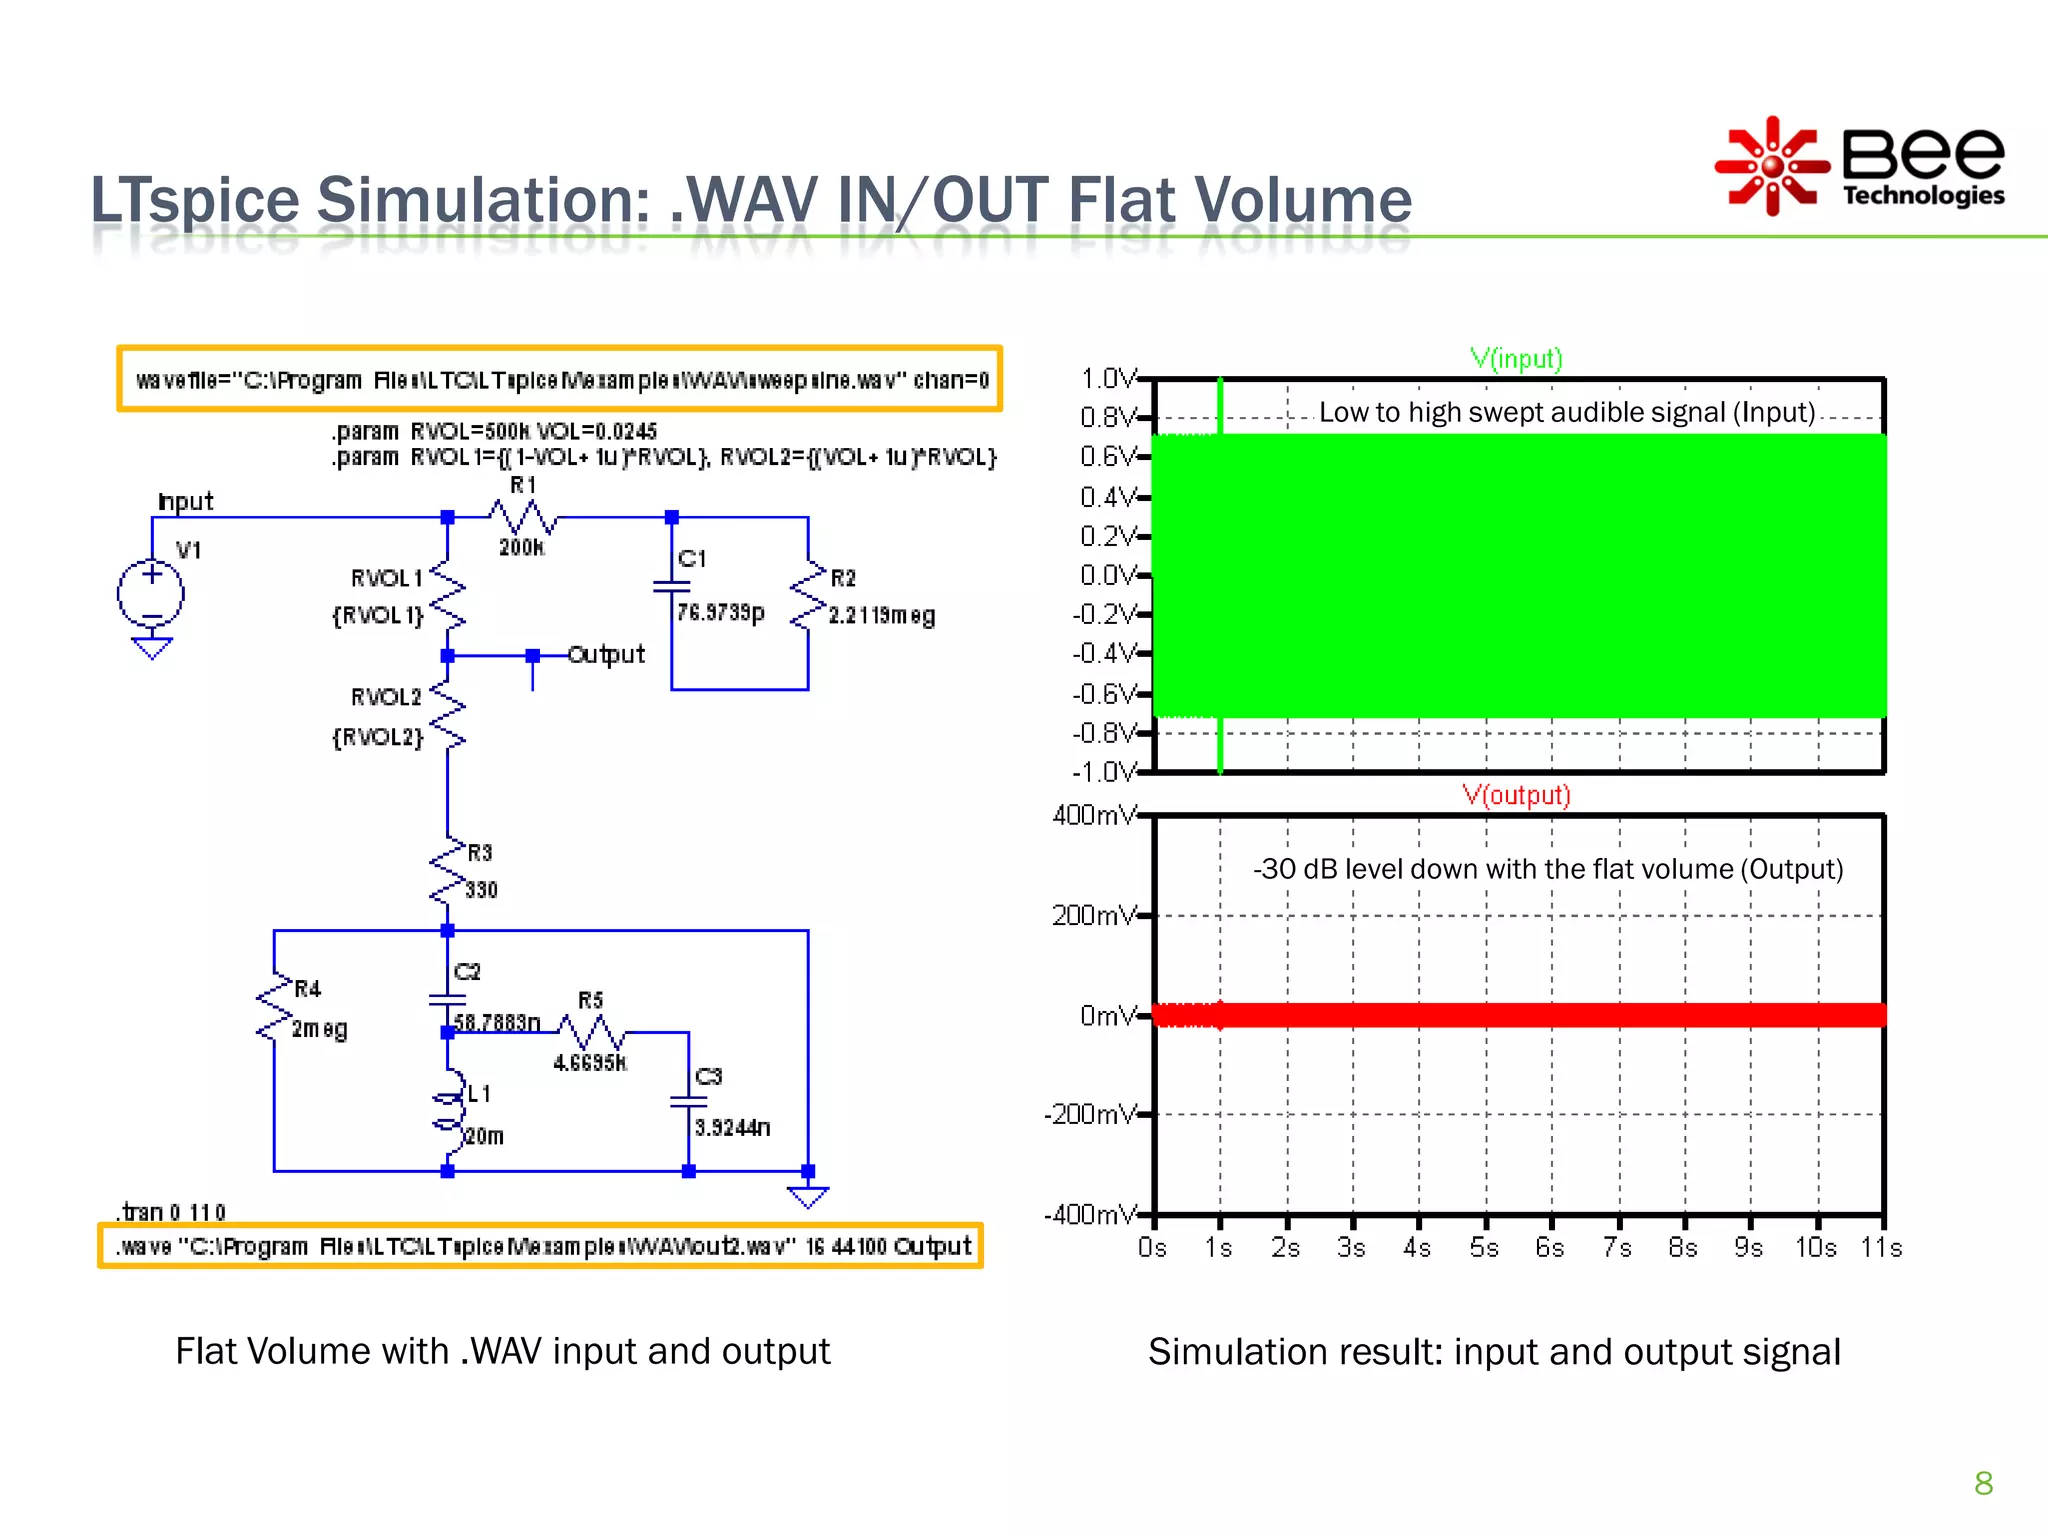
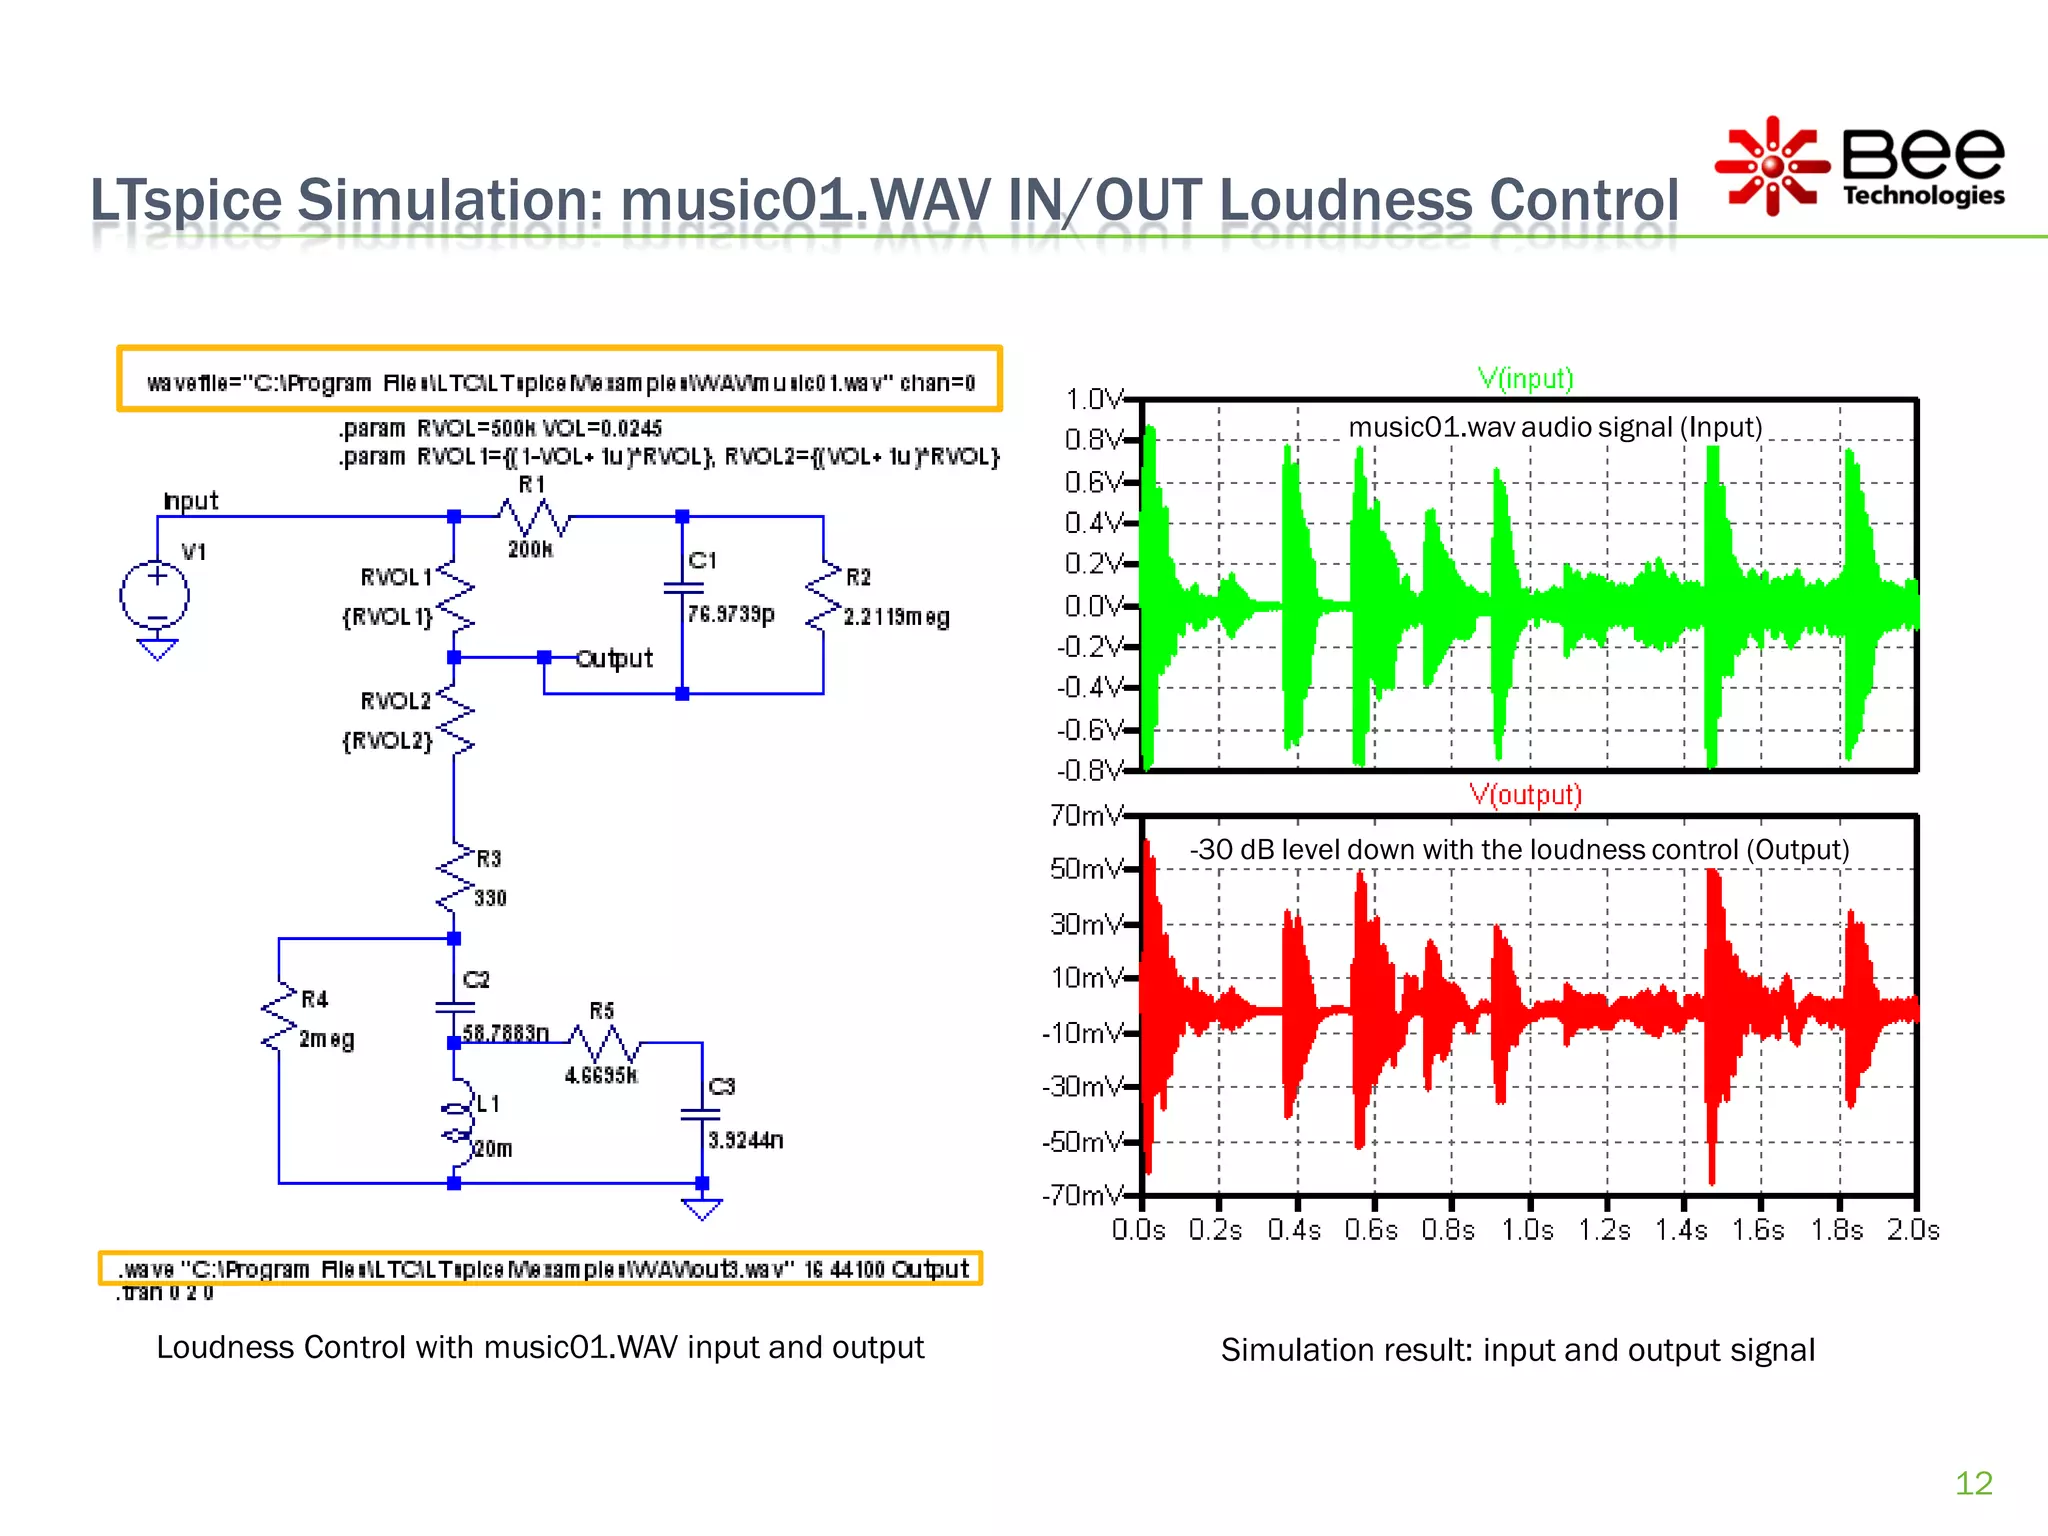
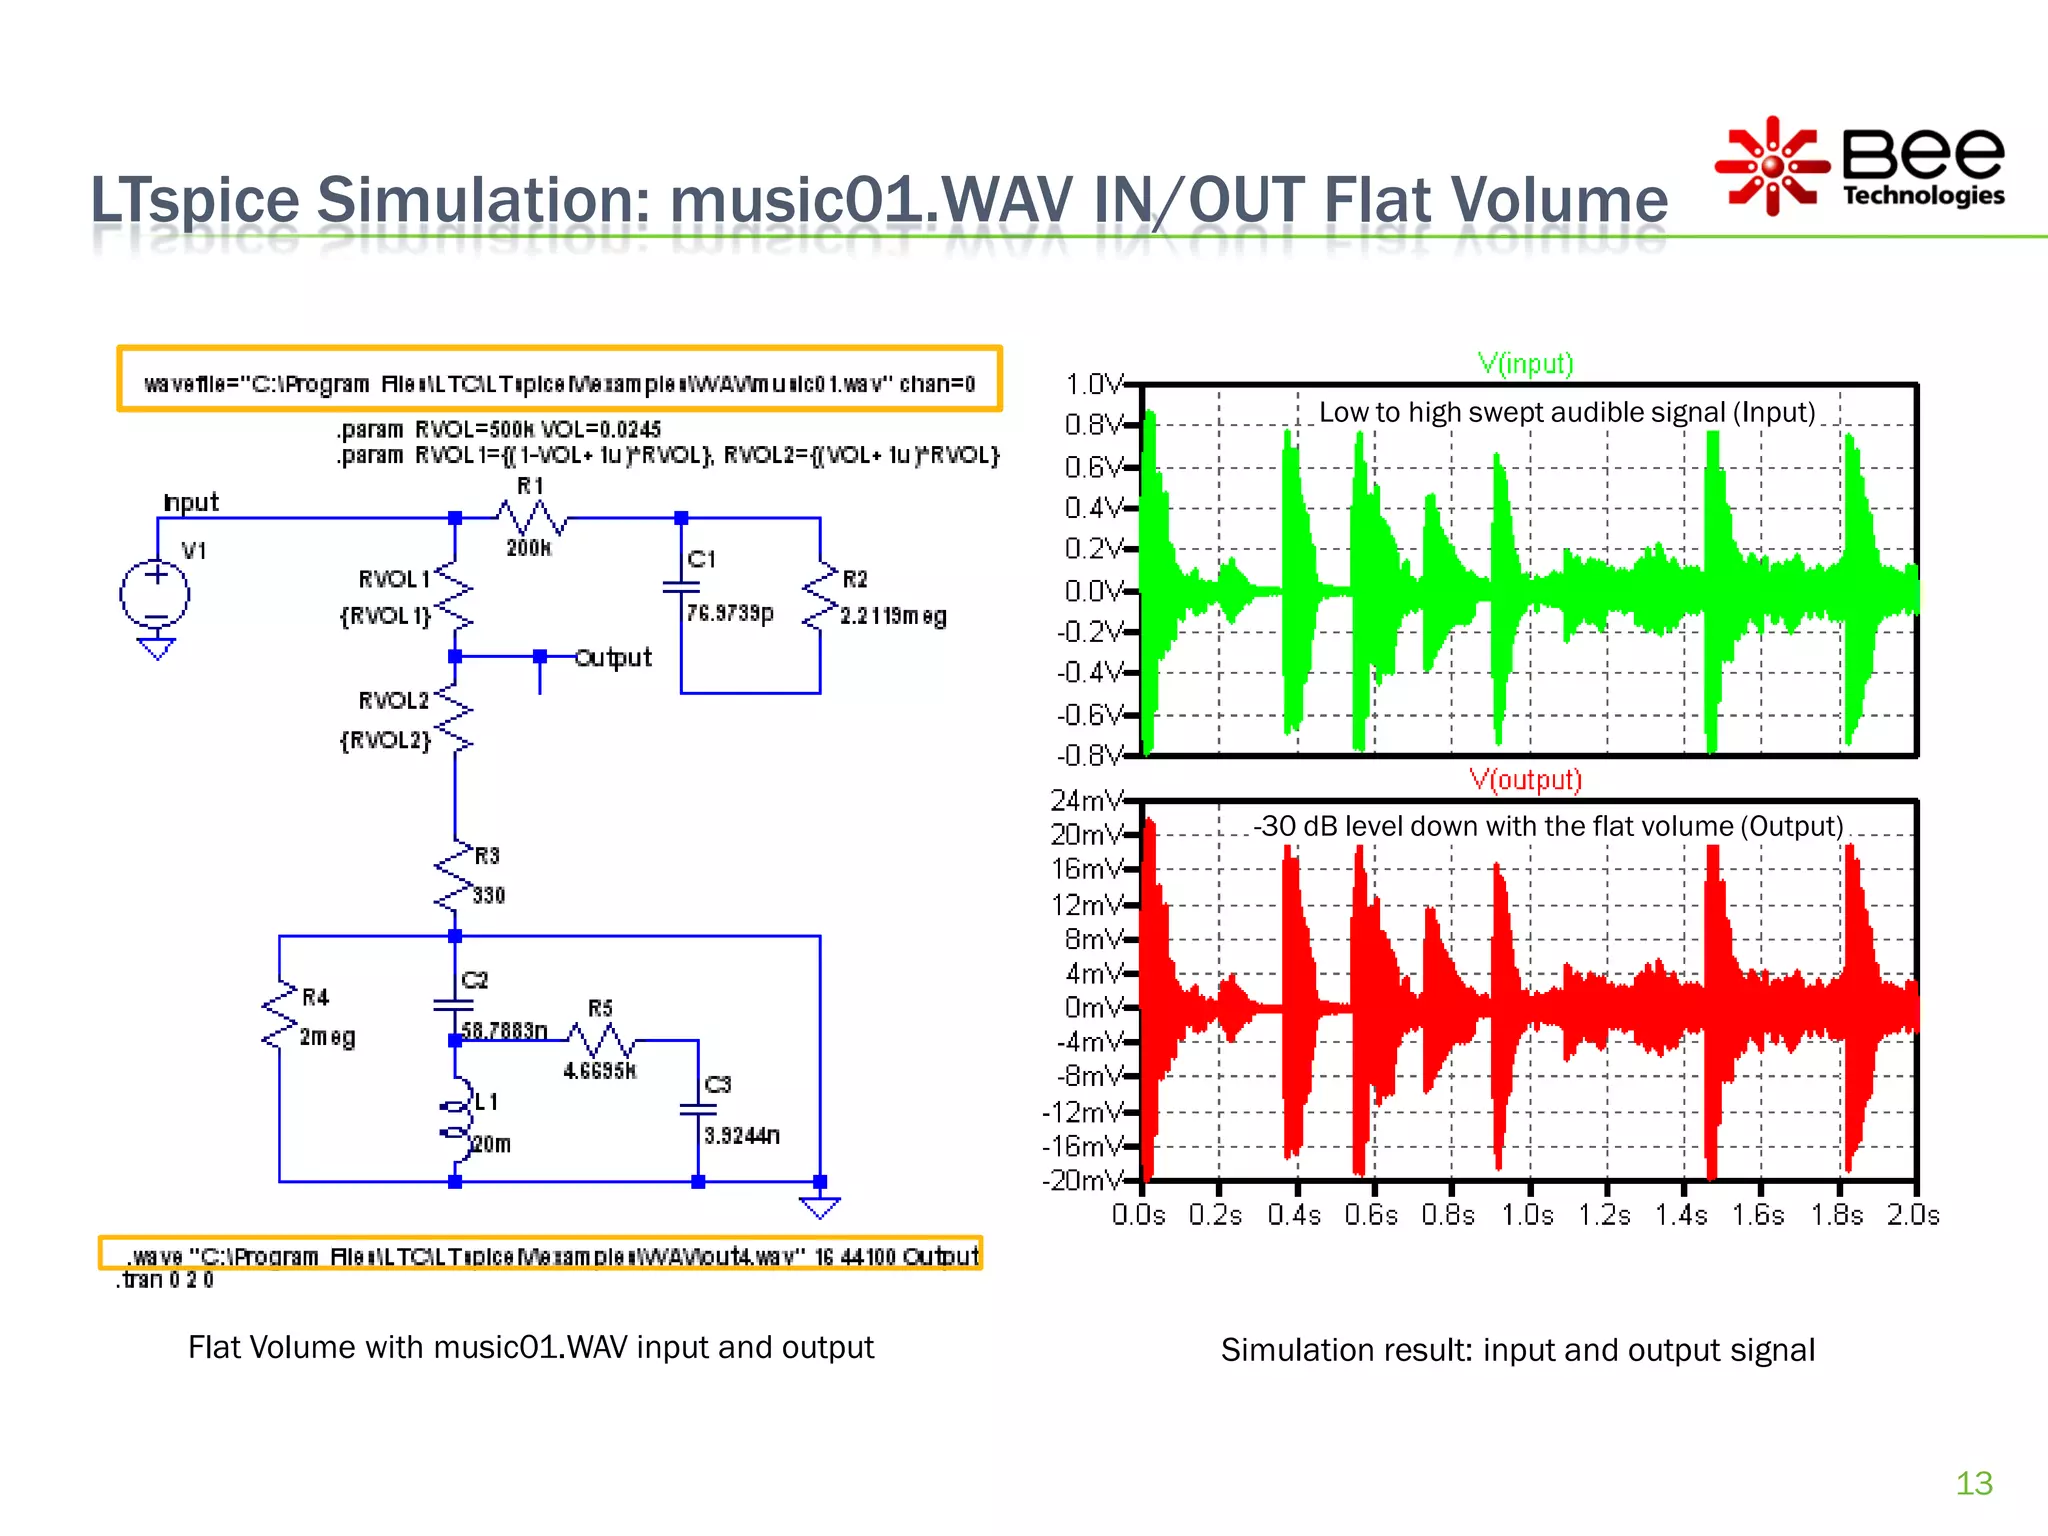
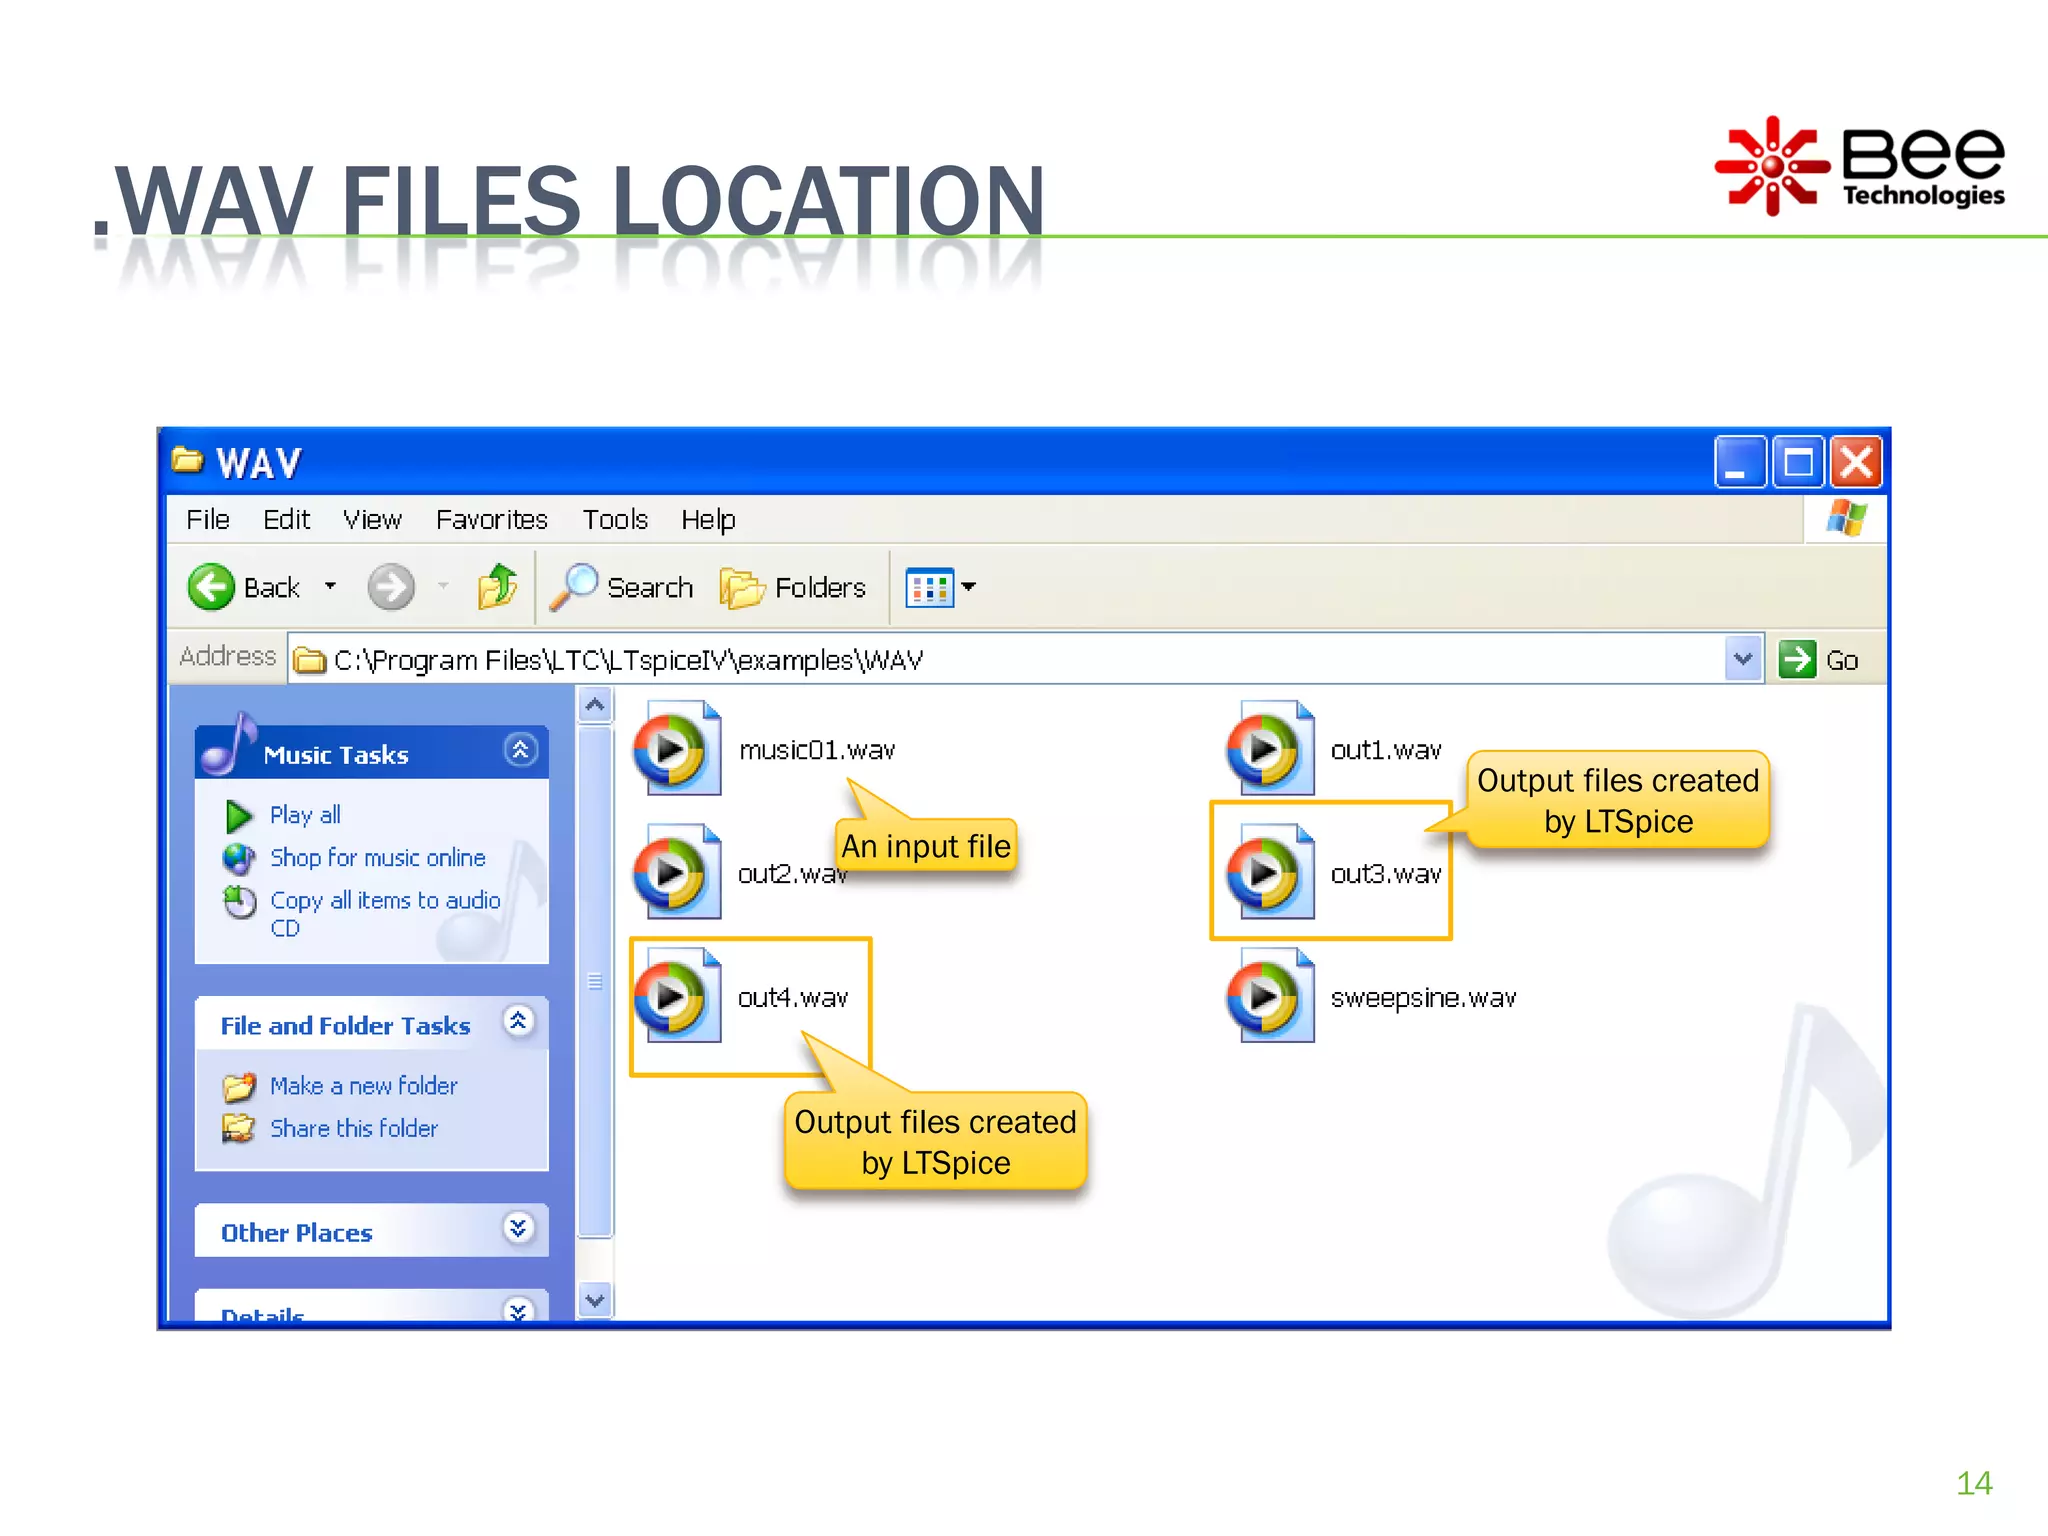

This document discusses simulating a loudness control in LTspice using .wav audio files. It begins with background on equal-loudness contours and how loudness controls can restore low and high frequencies at lower listening levels. The document shows how the frequency response of a simulated loudness control matches equal-loudness contours. It compares the response of a loudness control circuit to a flat volume control and demonstrates using .wav files as inputs and outputs of the LTspice simulation.


![RF Circuit Design - [Ch2-1] Resonator and Impedance Matching](https://cdn.slidesharecdn.com/ss_thumbnails/ch2-1-150613064353-lva1-app6892-thumbnail.jpg?width=640&height=640&fit=bounds)


![Coded Agents – with UiPath SDK + LangGraph [Virtual Hands-on Workshop]](https://cdn.slidesharecdn.com/ss_thumbnails/codedagentsdeck-251215155422-5497c599-thumbnail.jpg?width=640&height=640&fit=bounds)


