Download to read offline

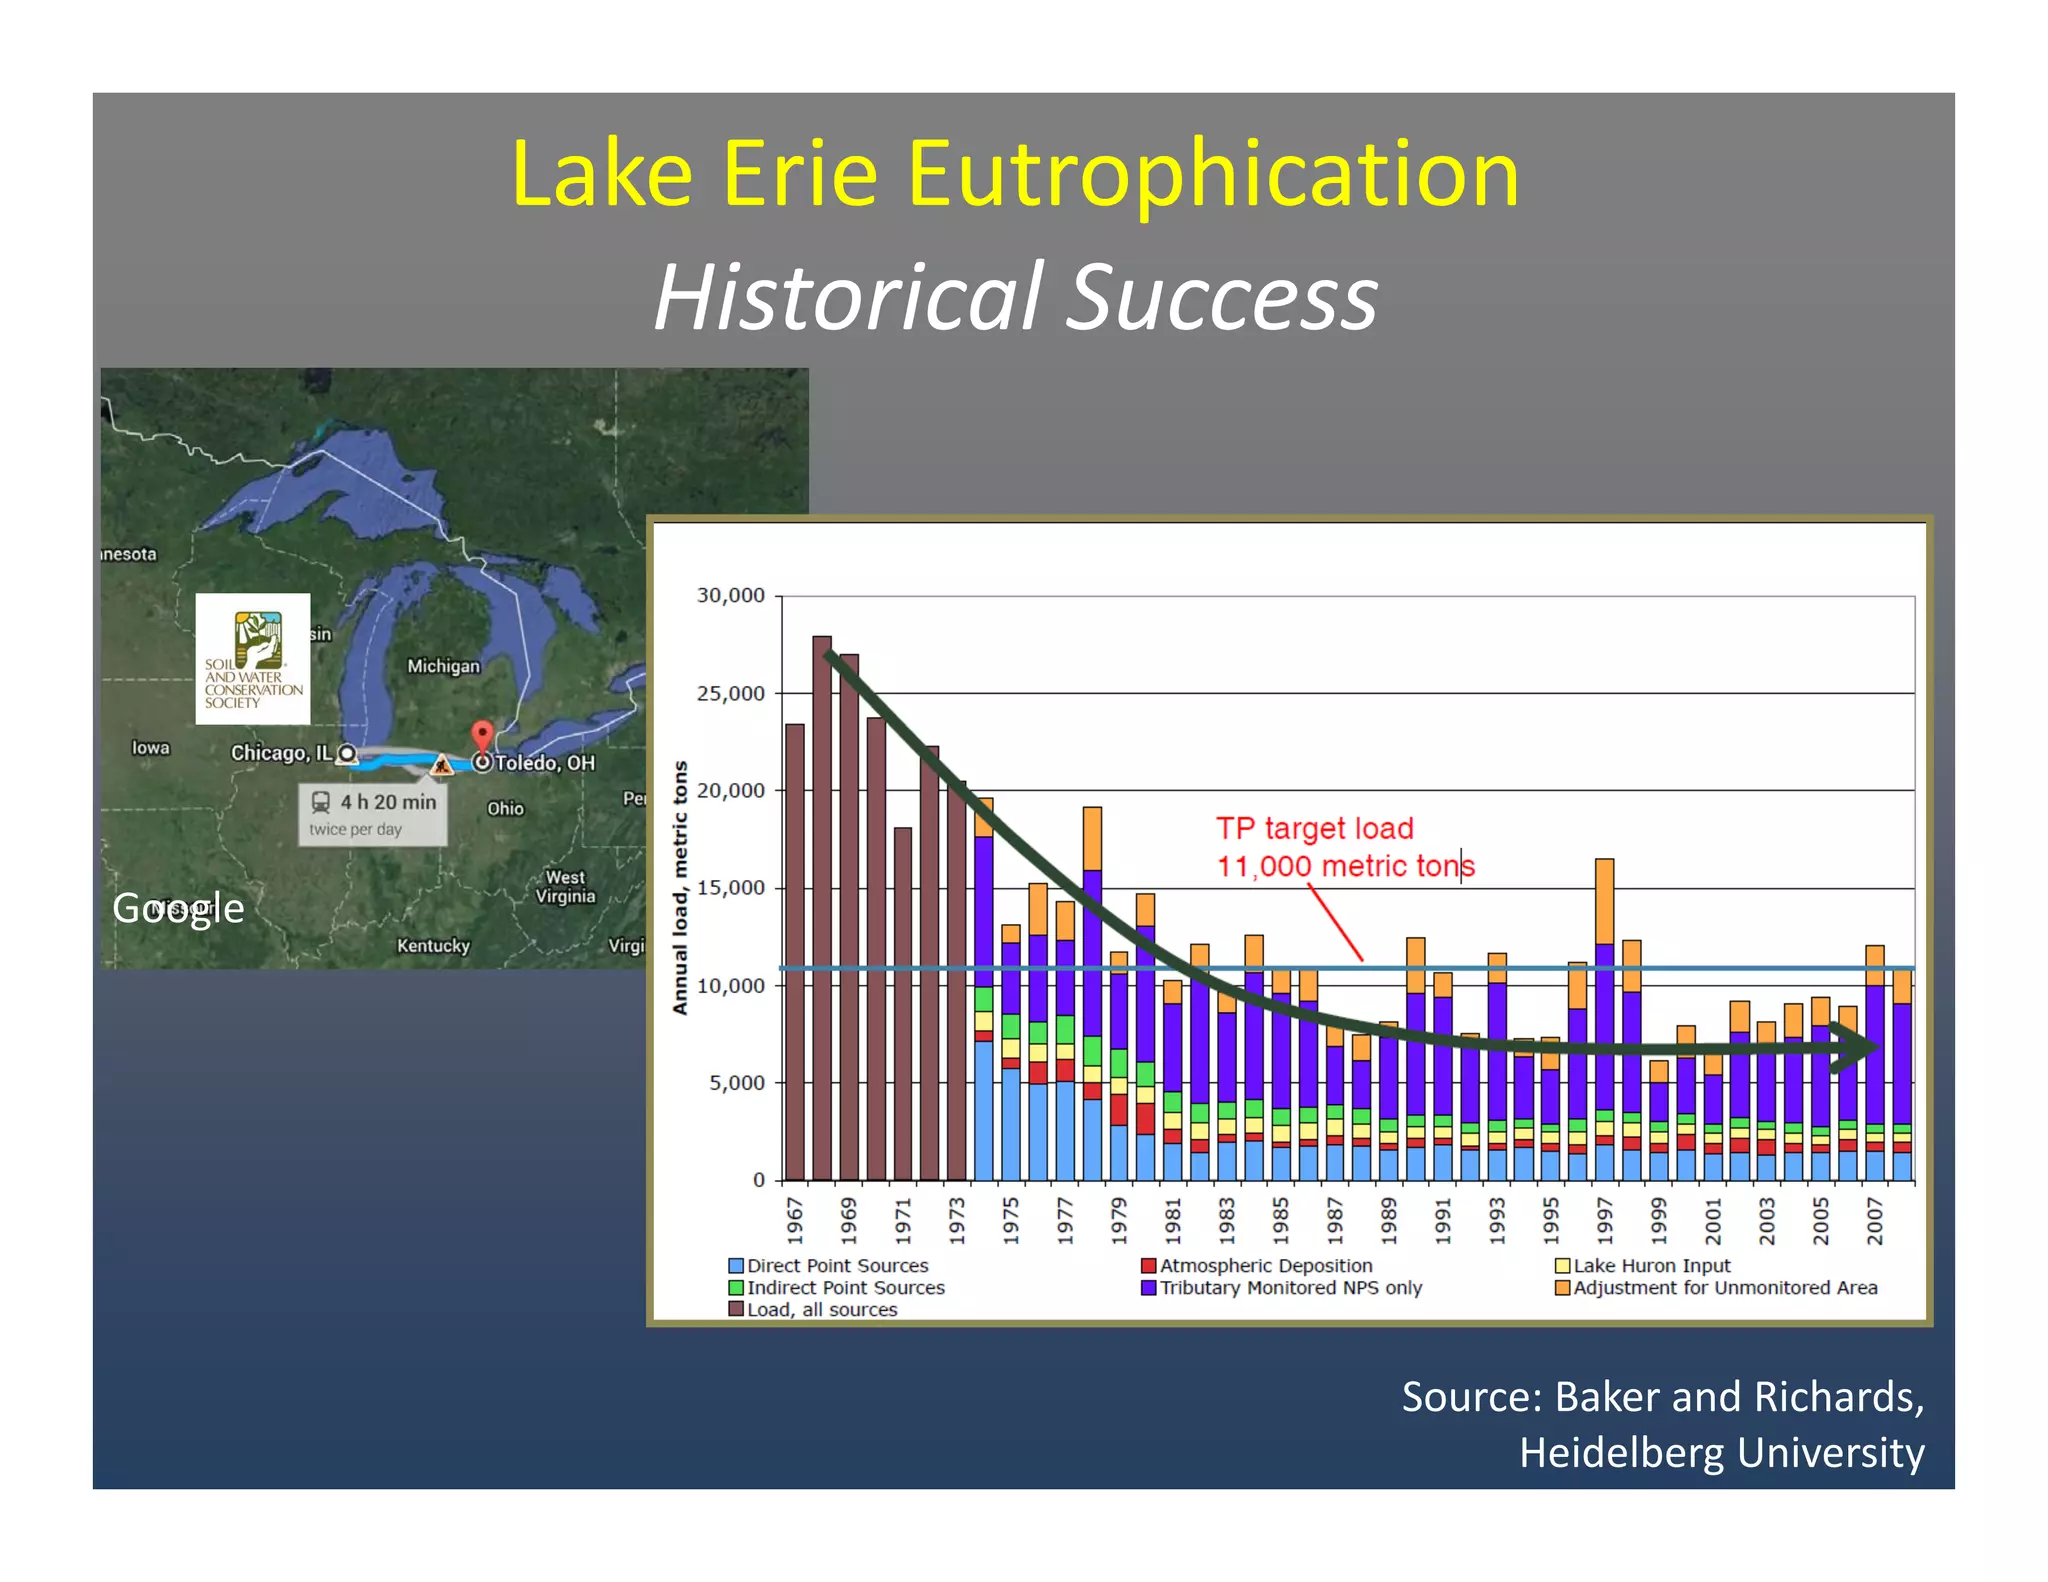
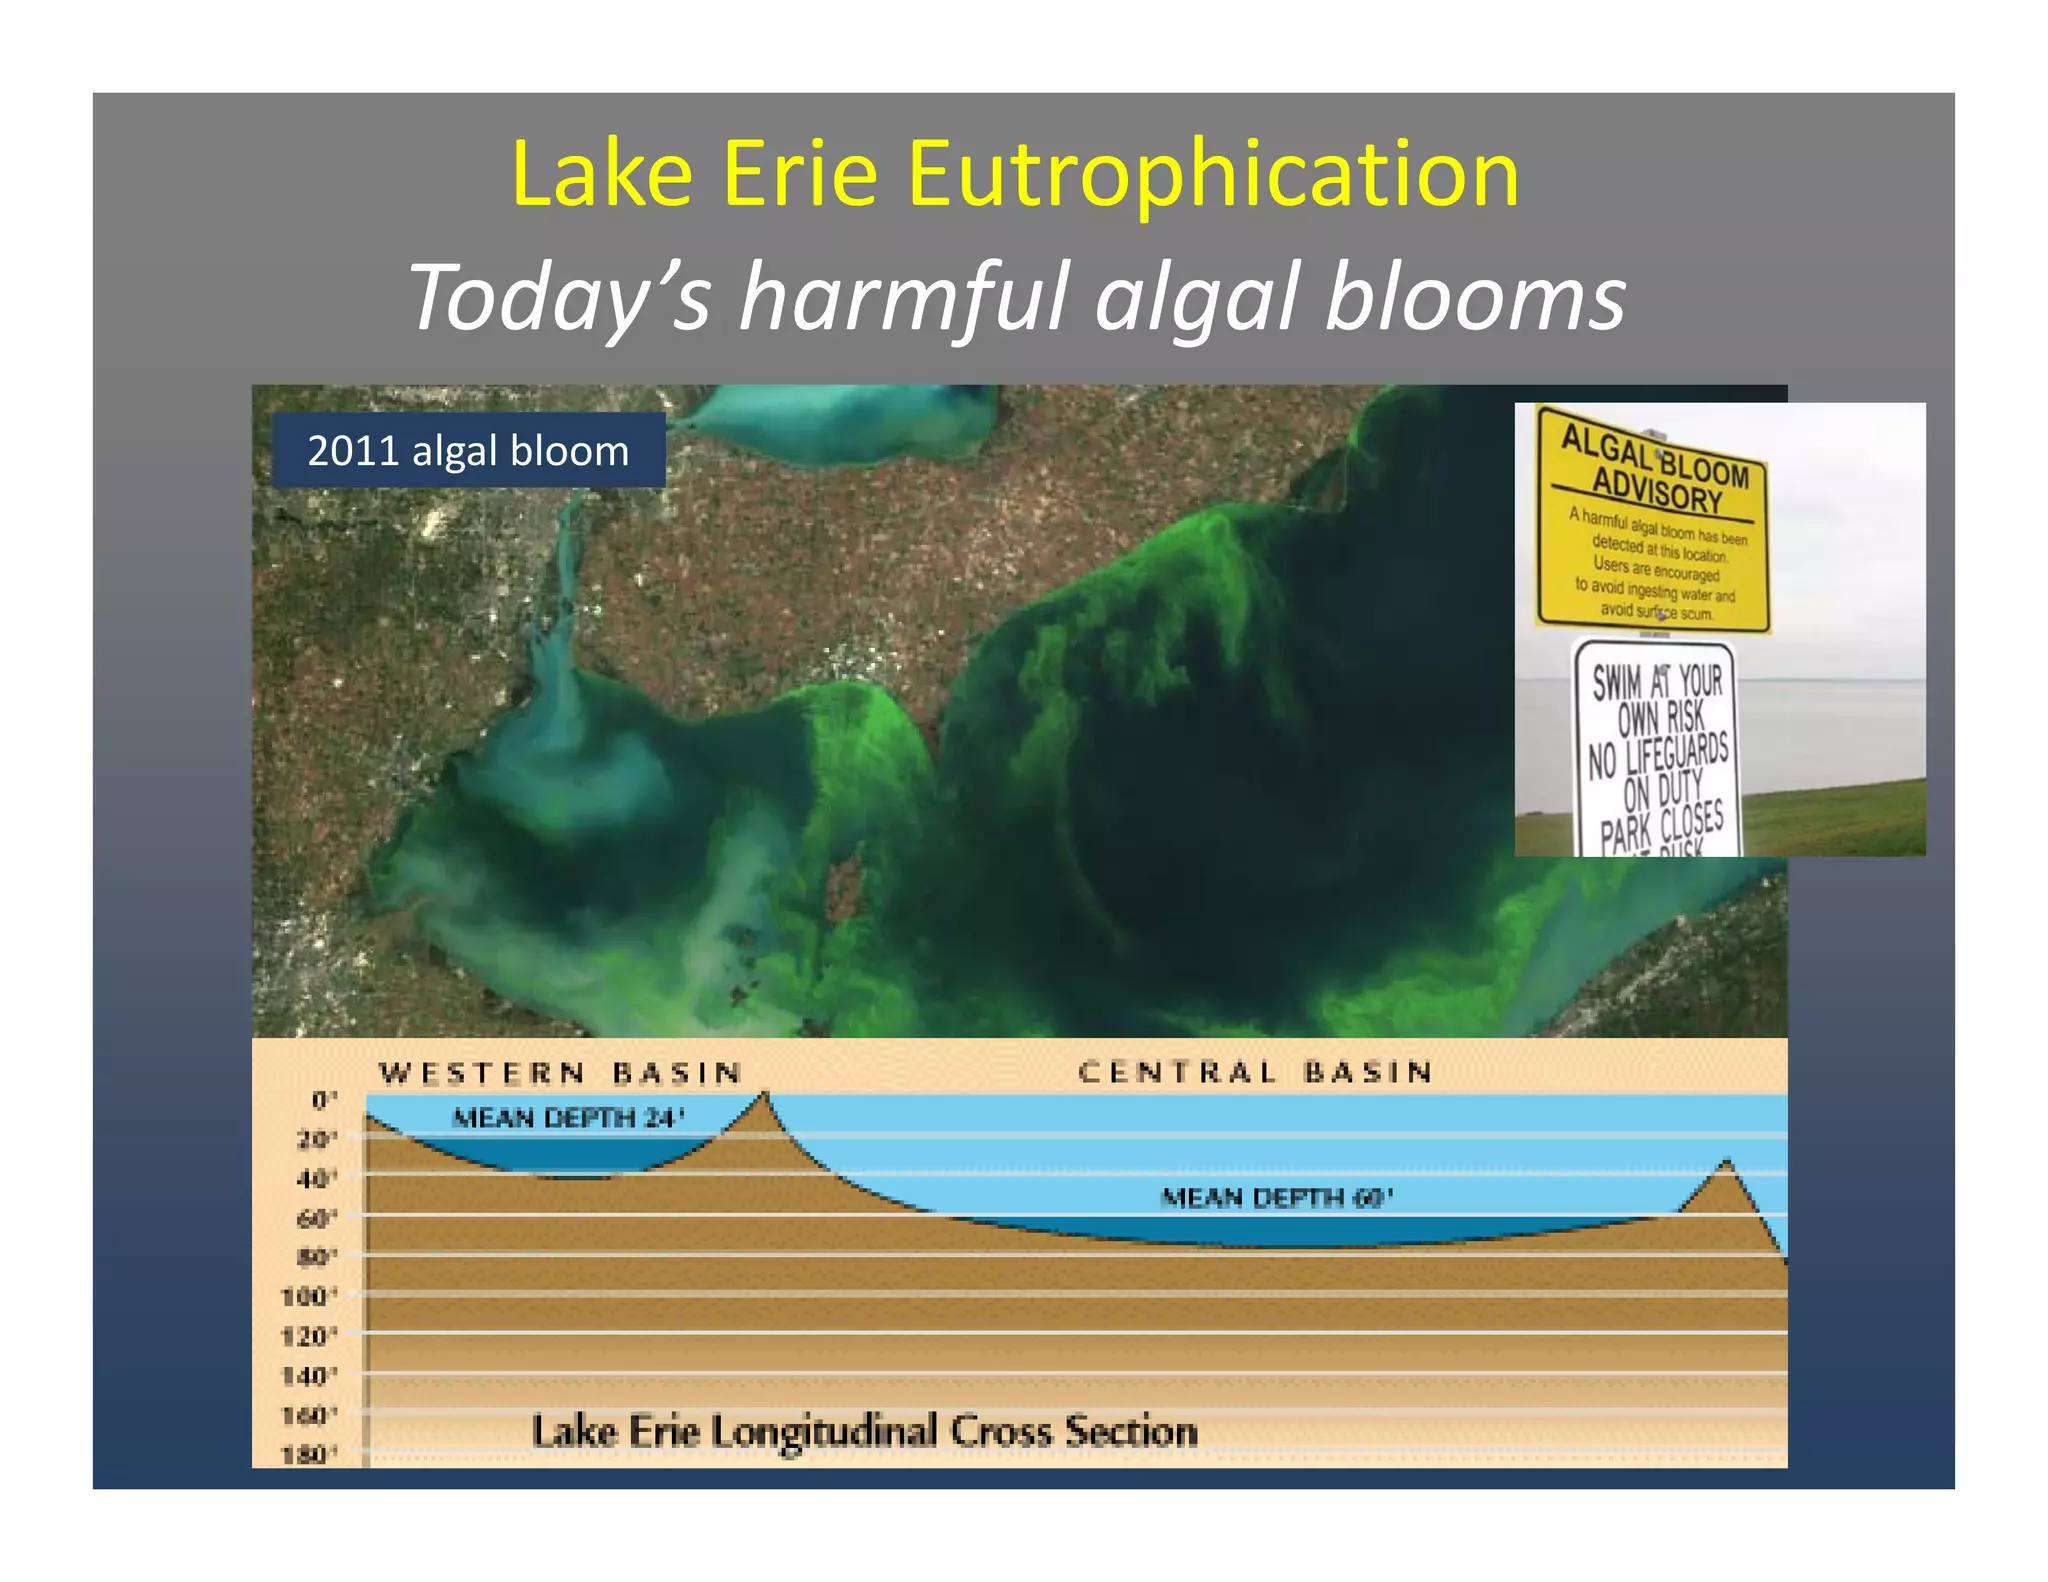
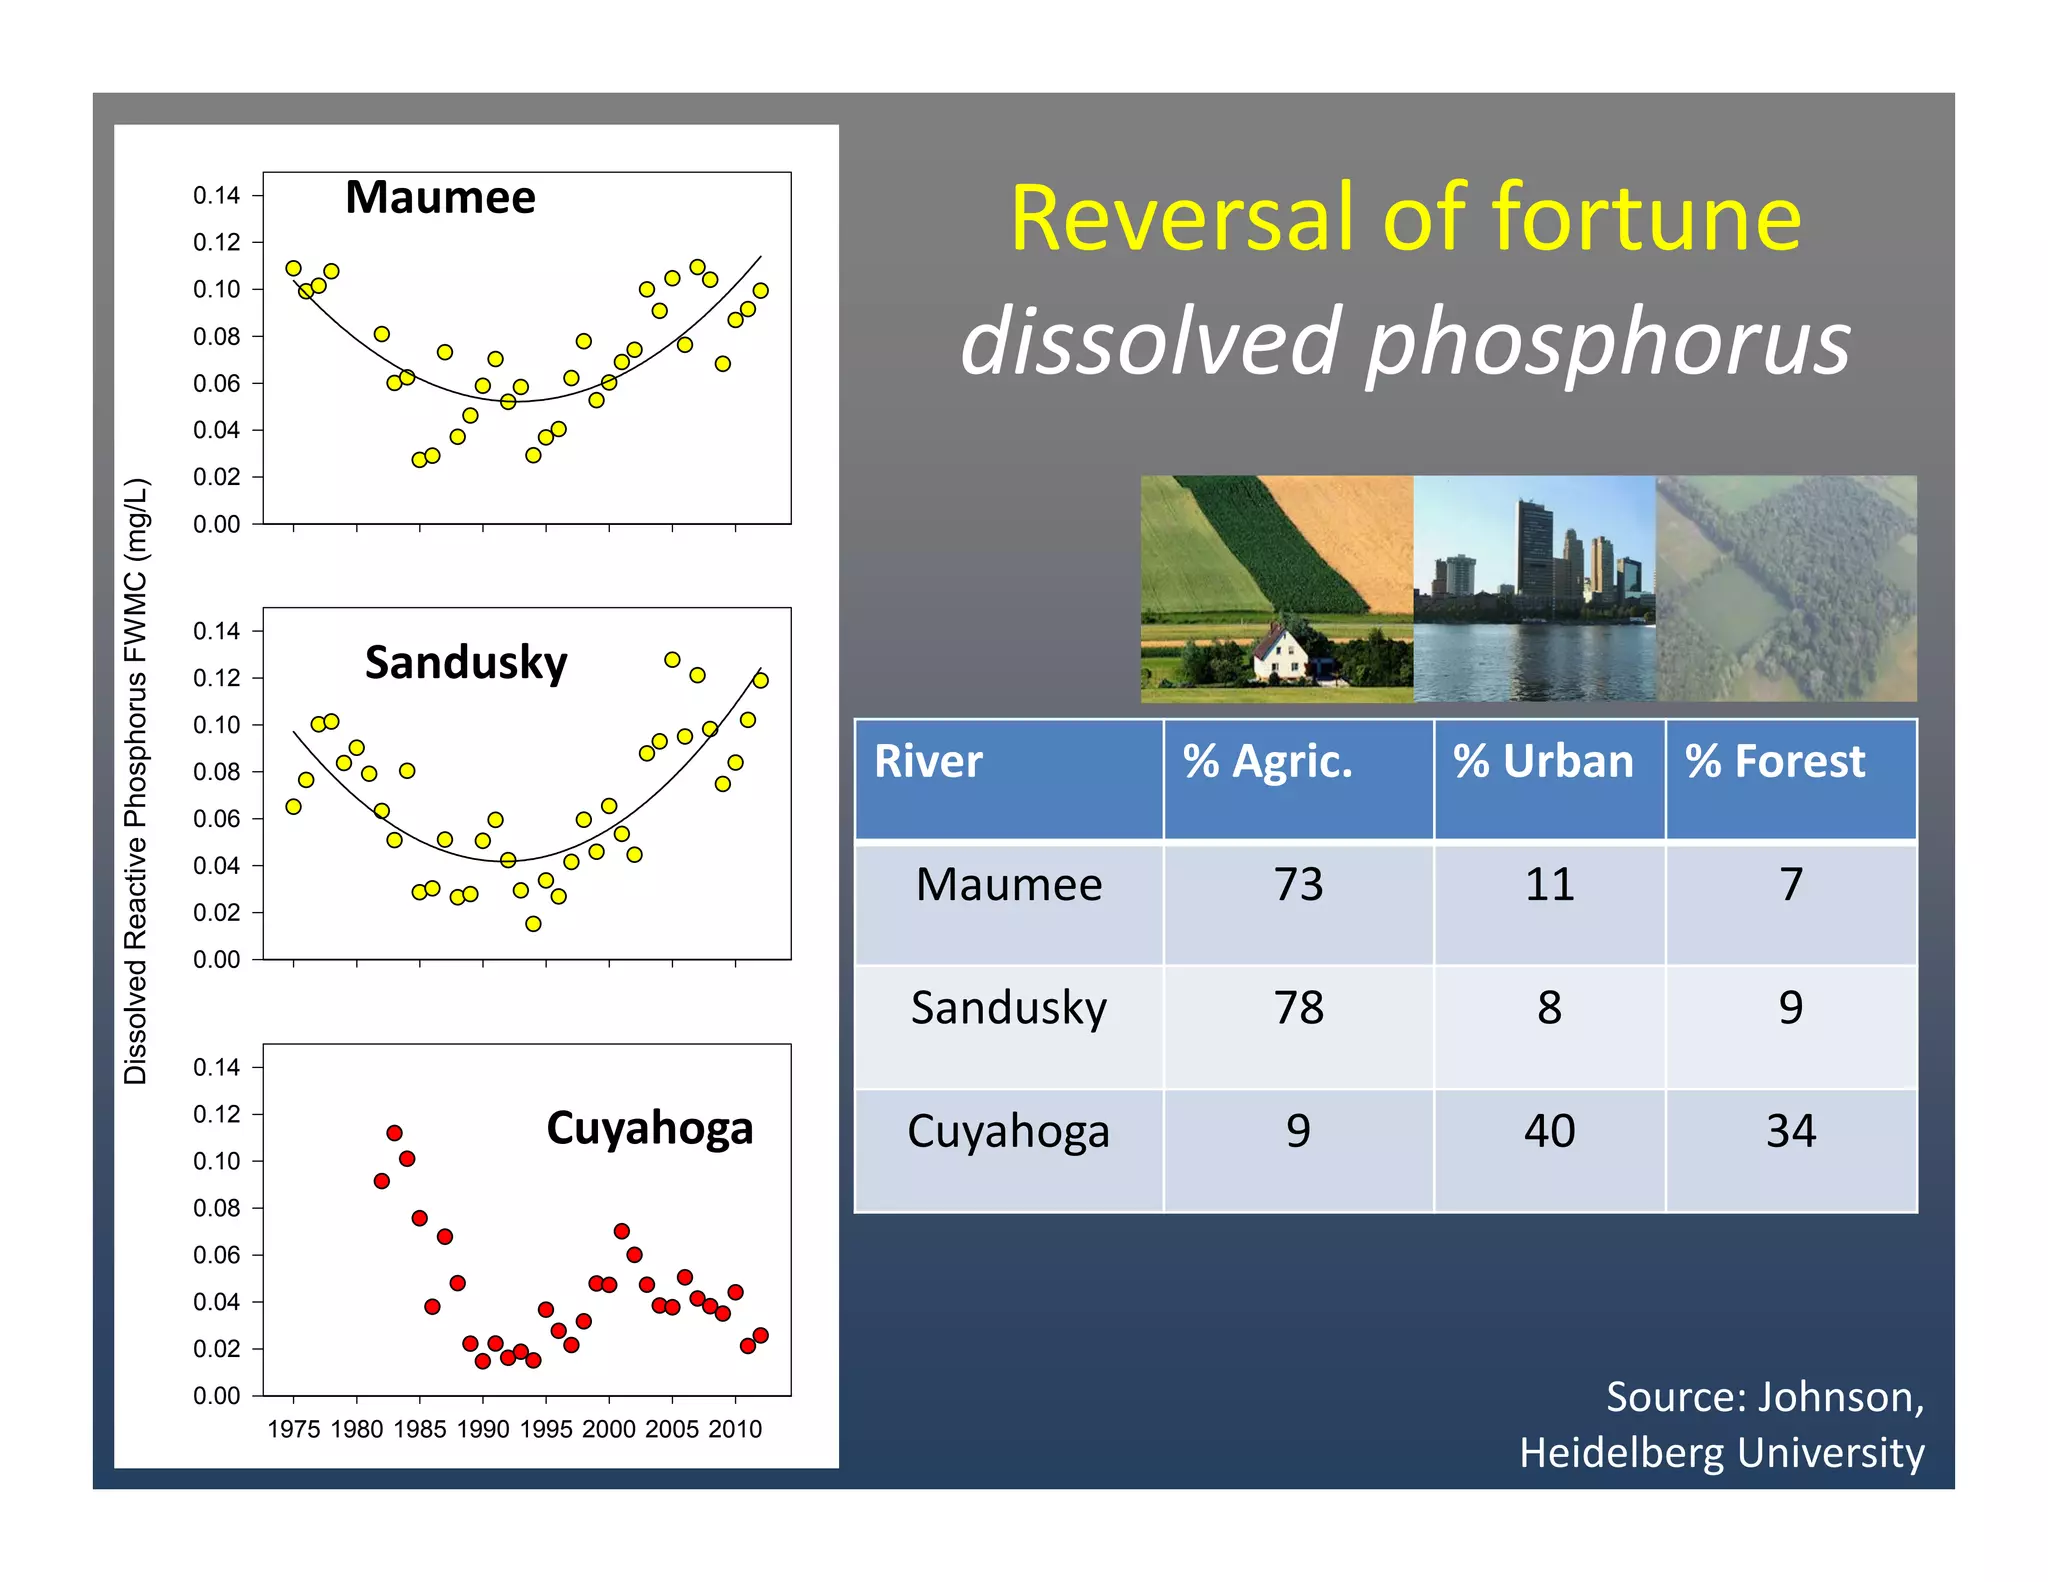
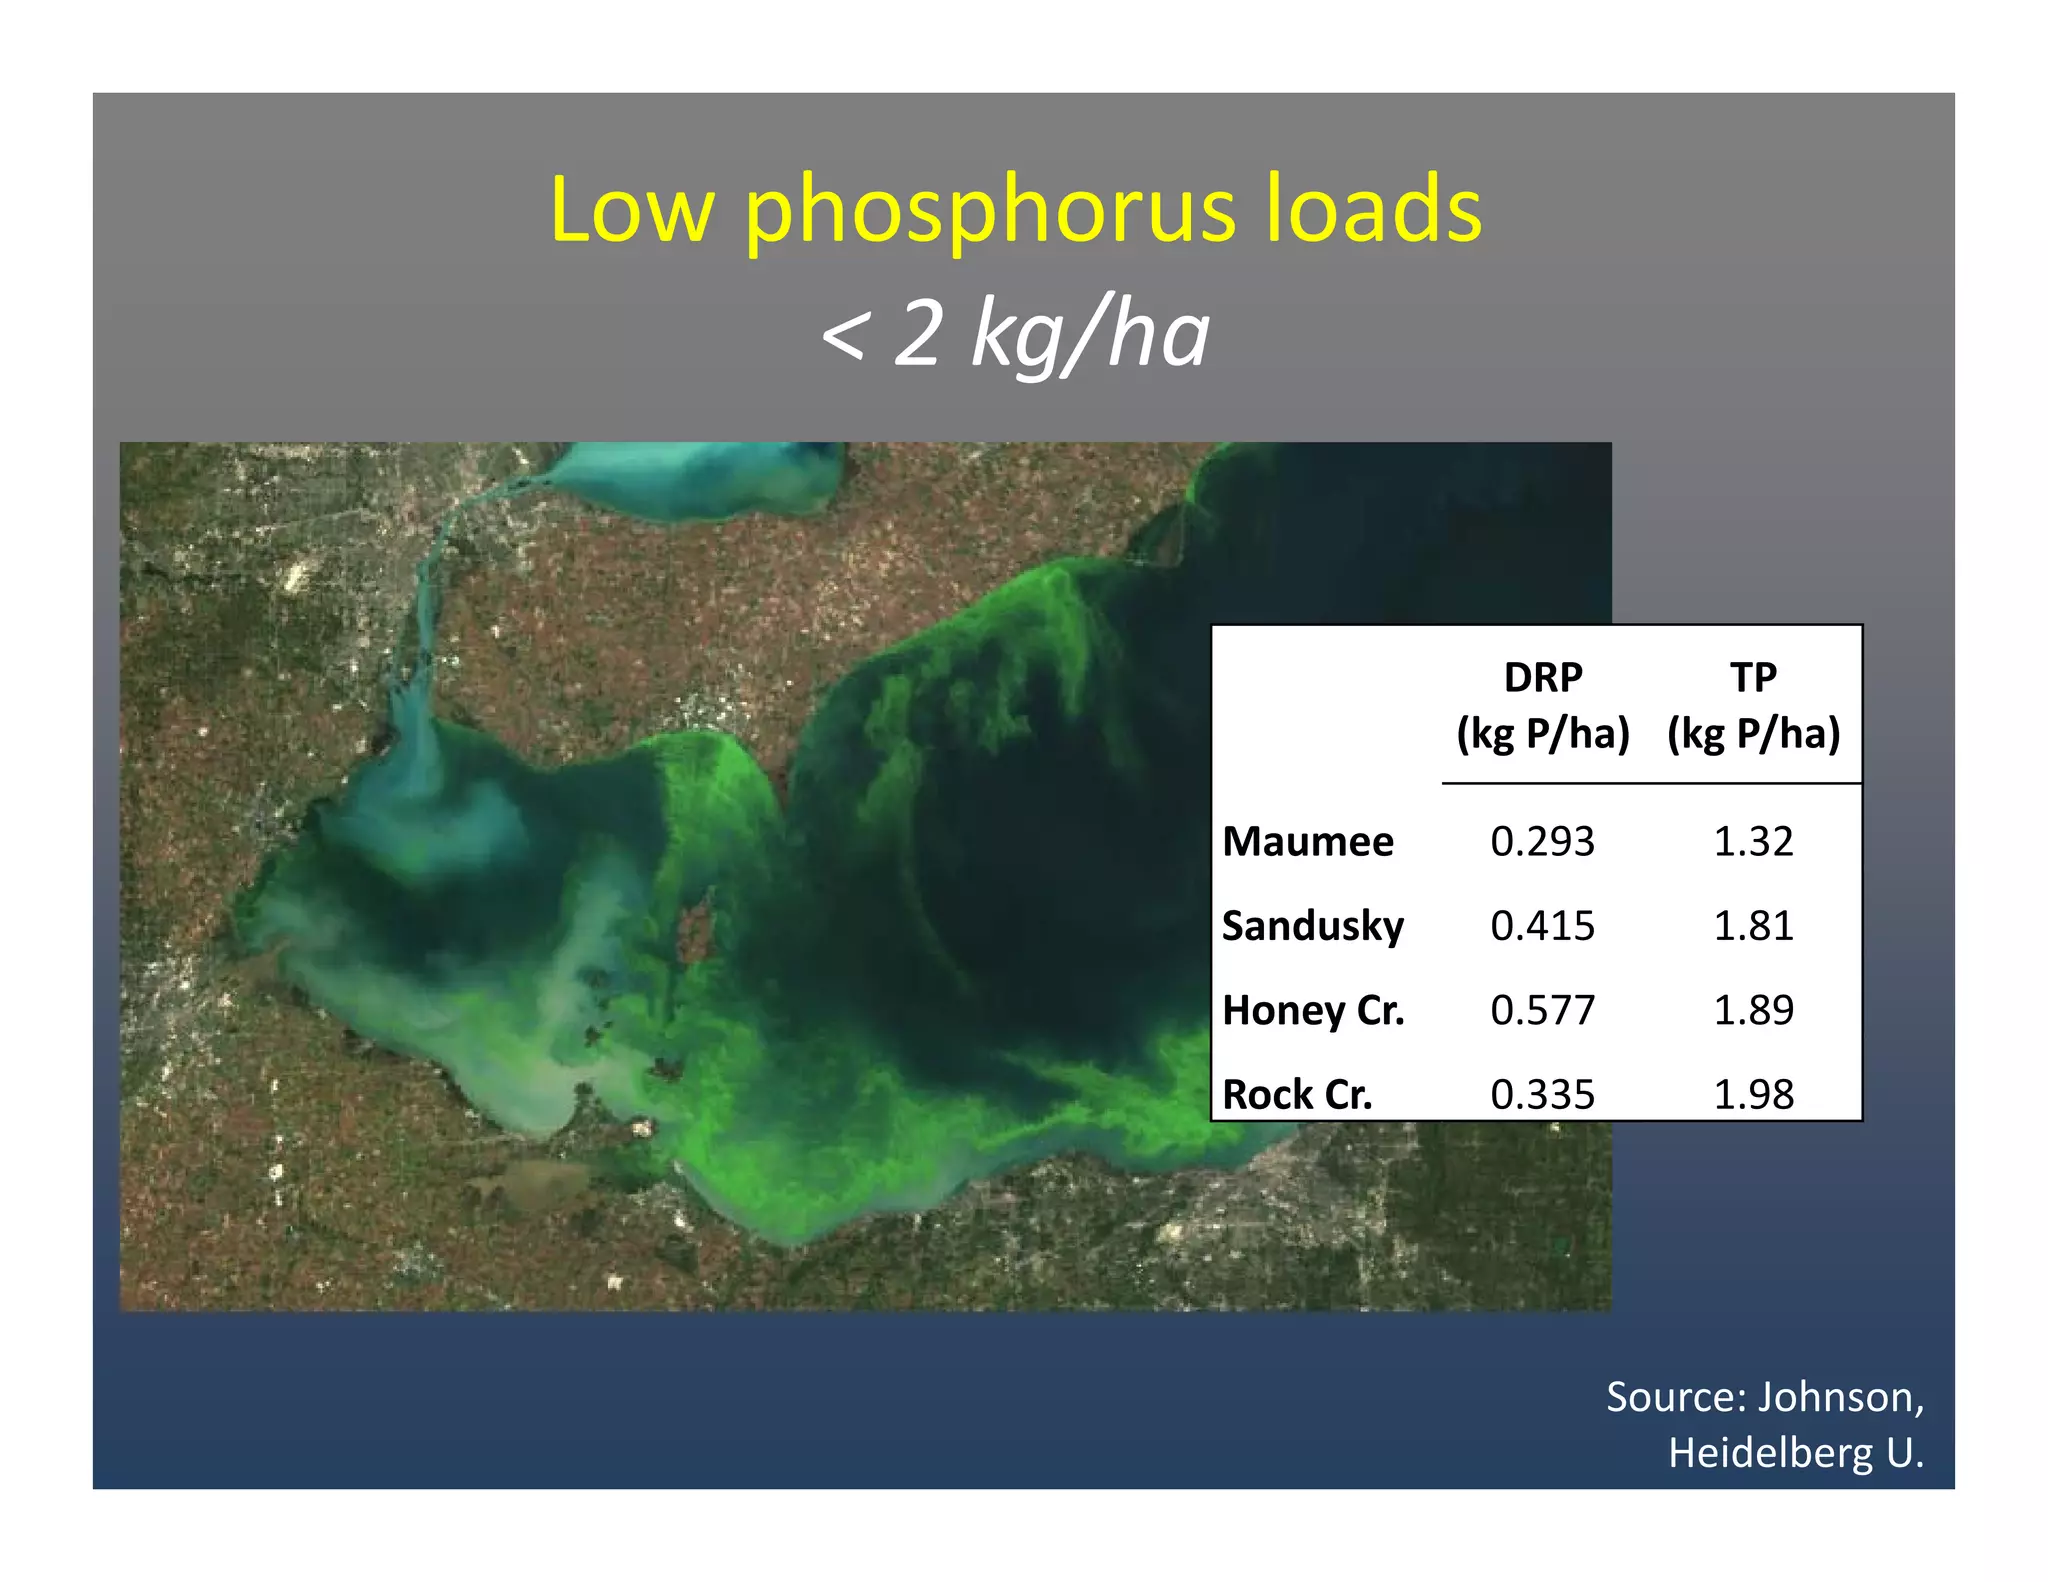
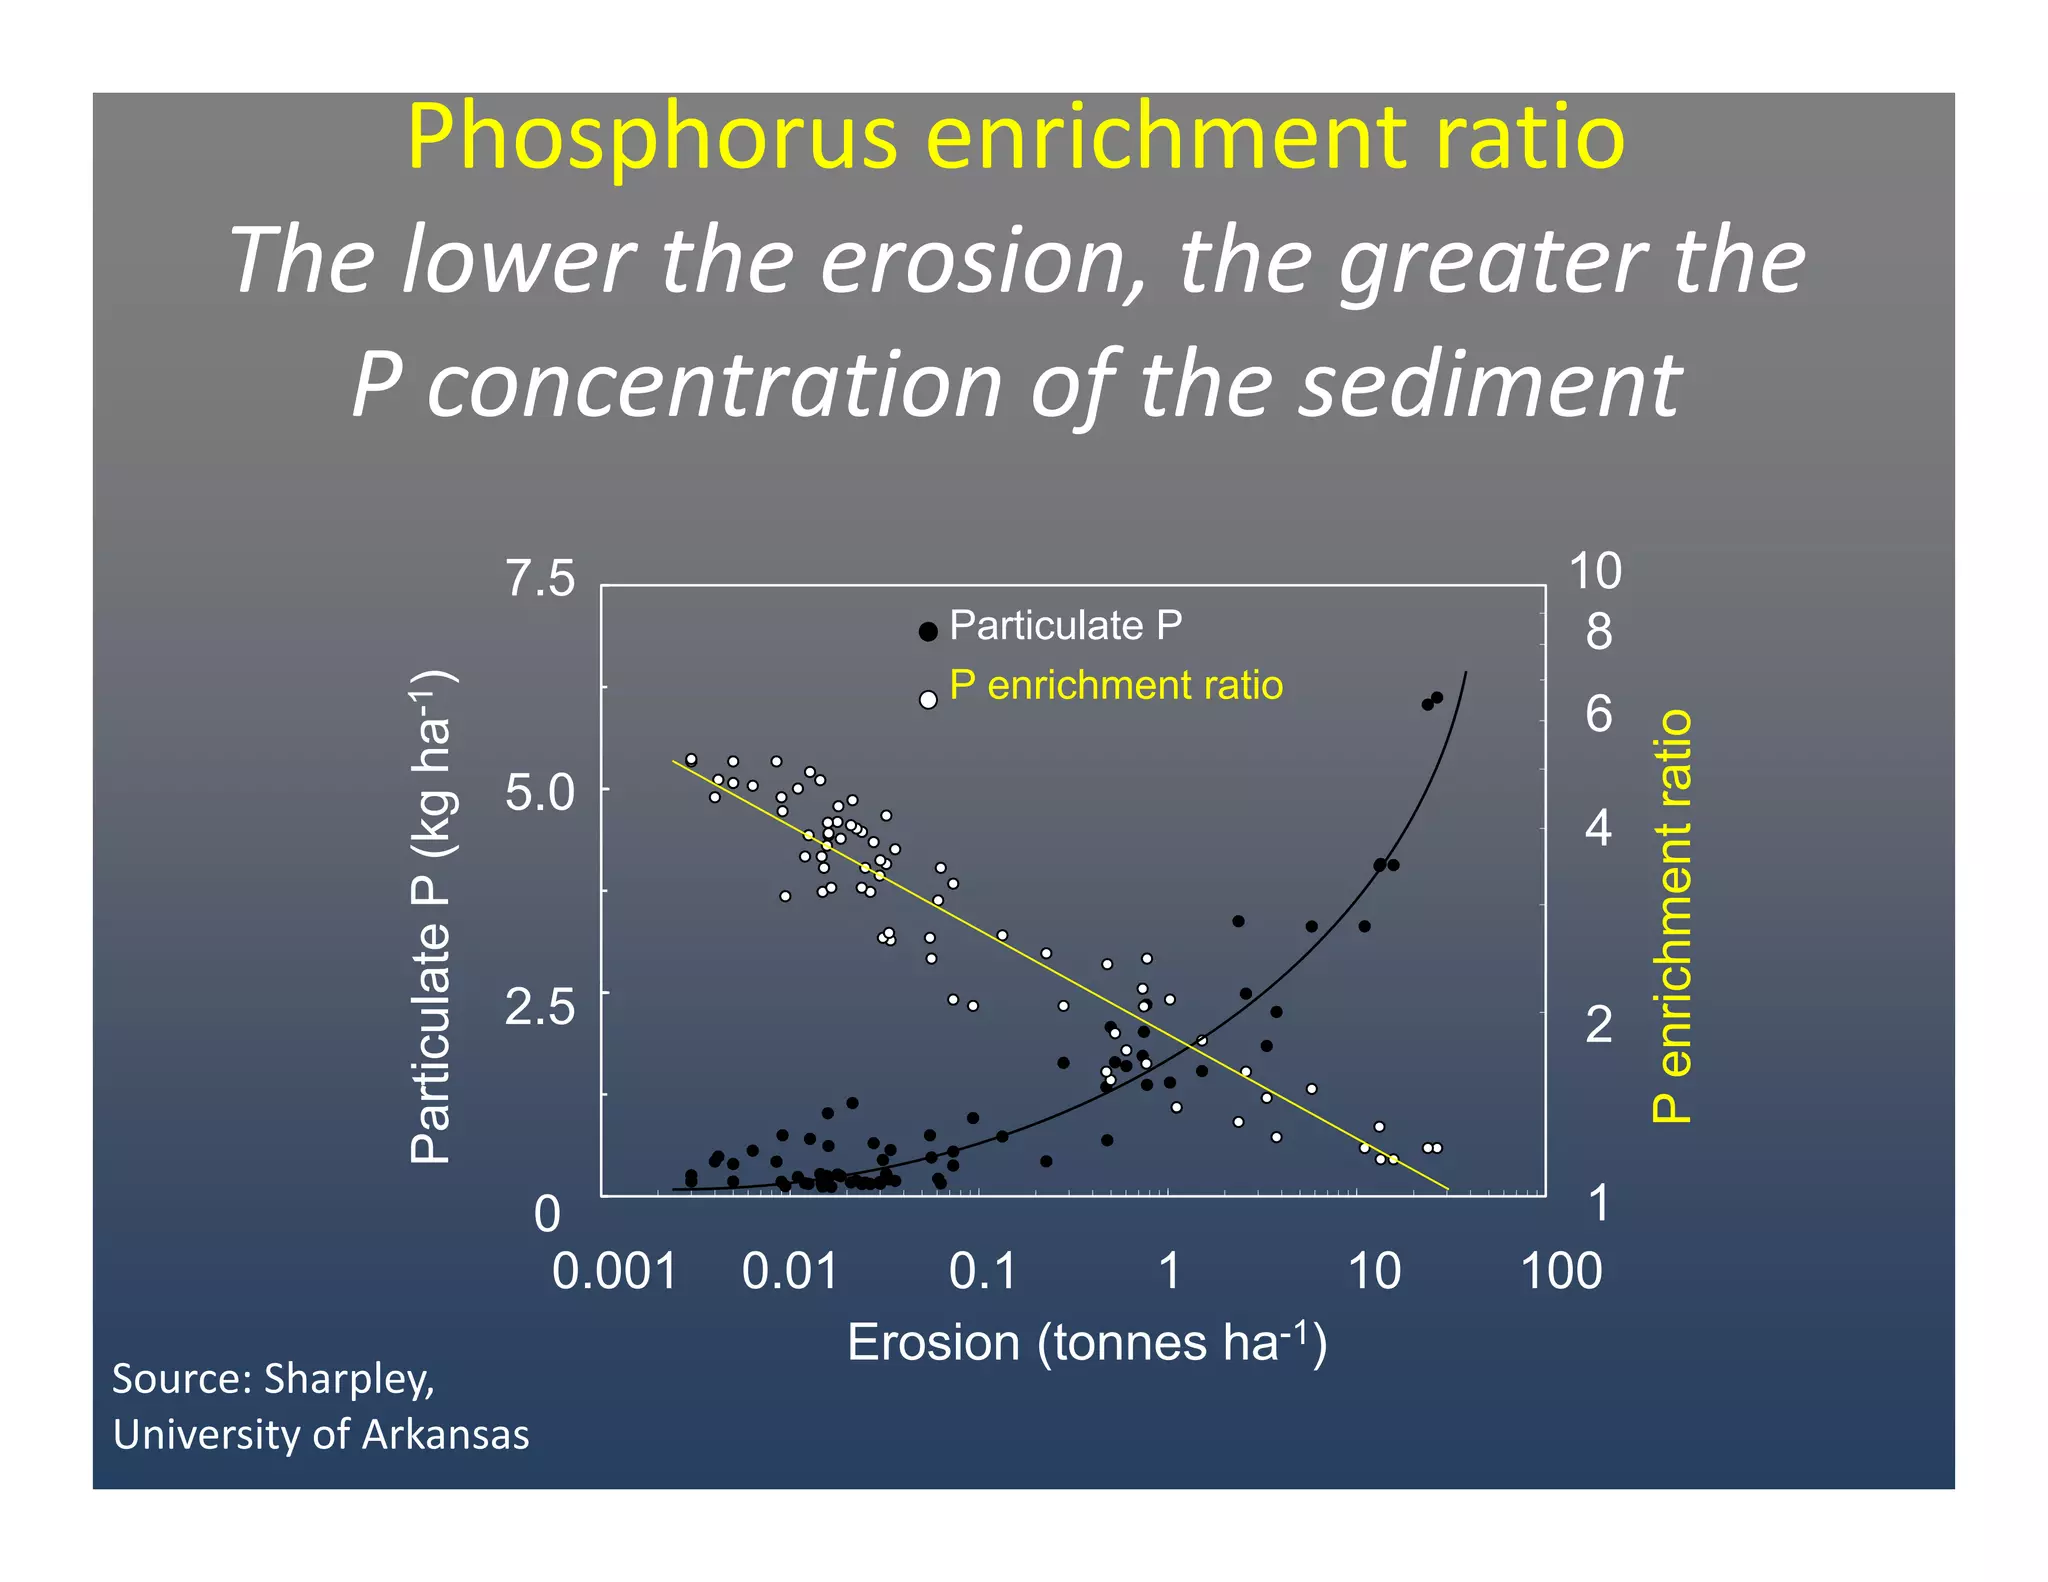
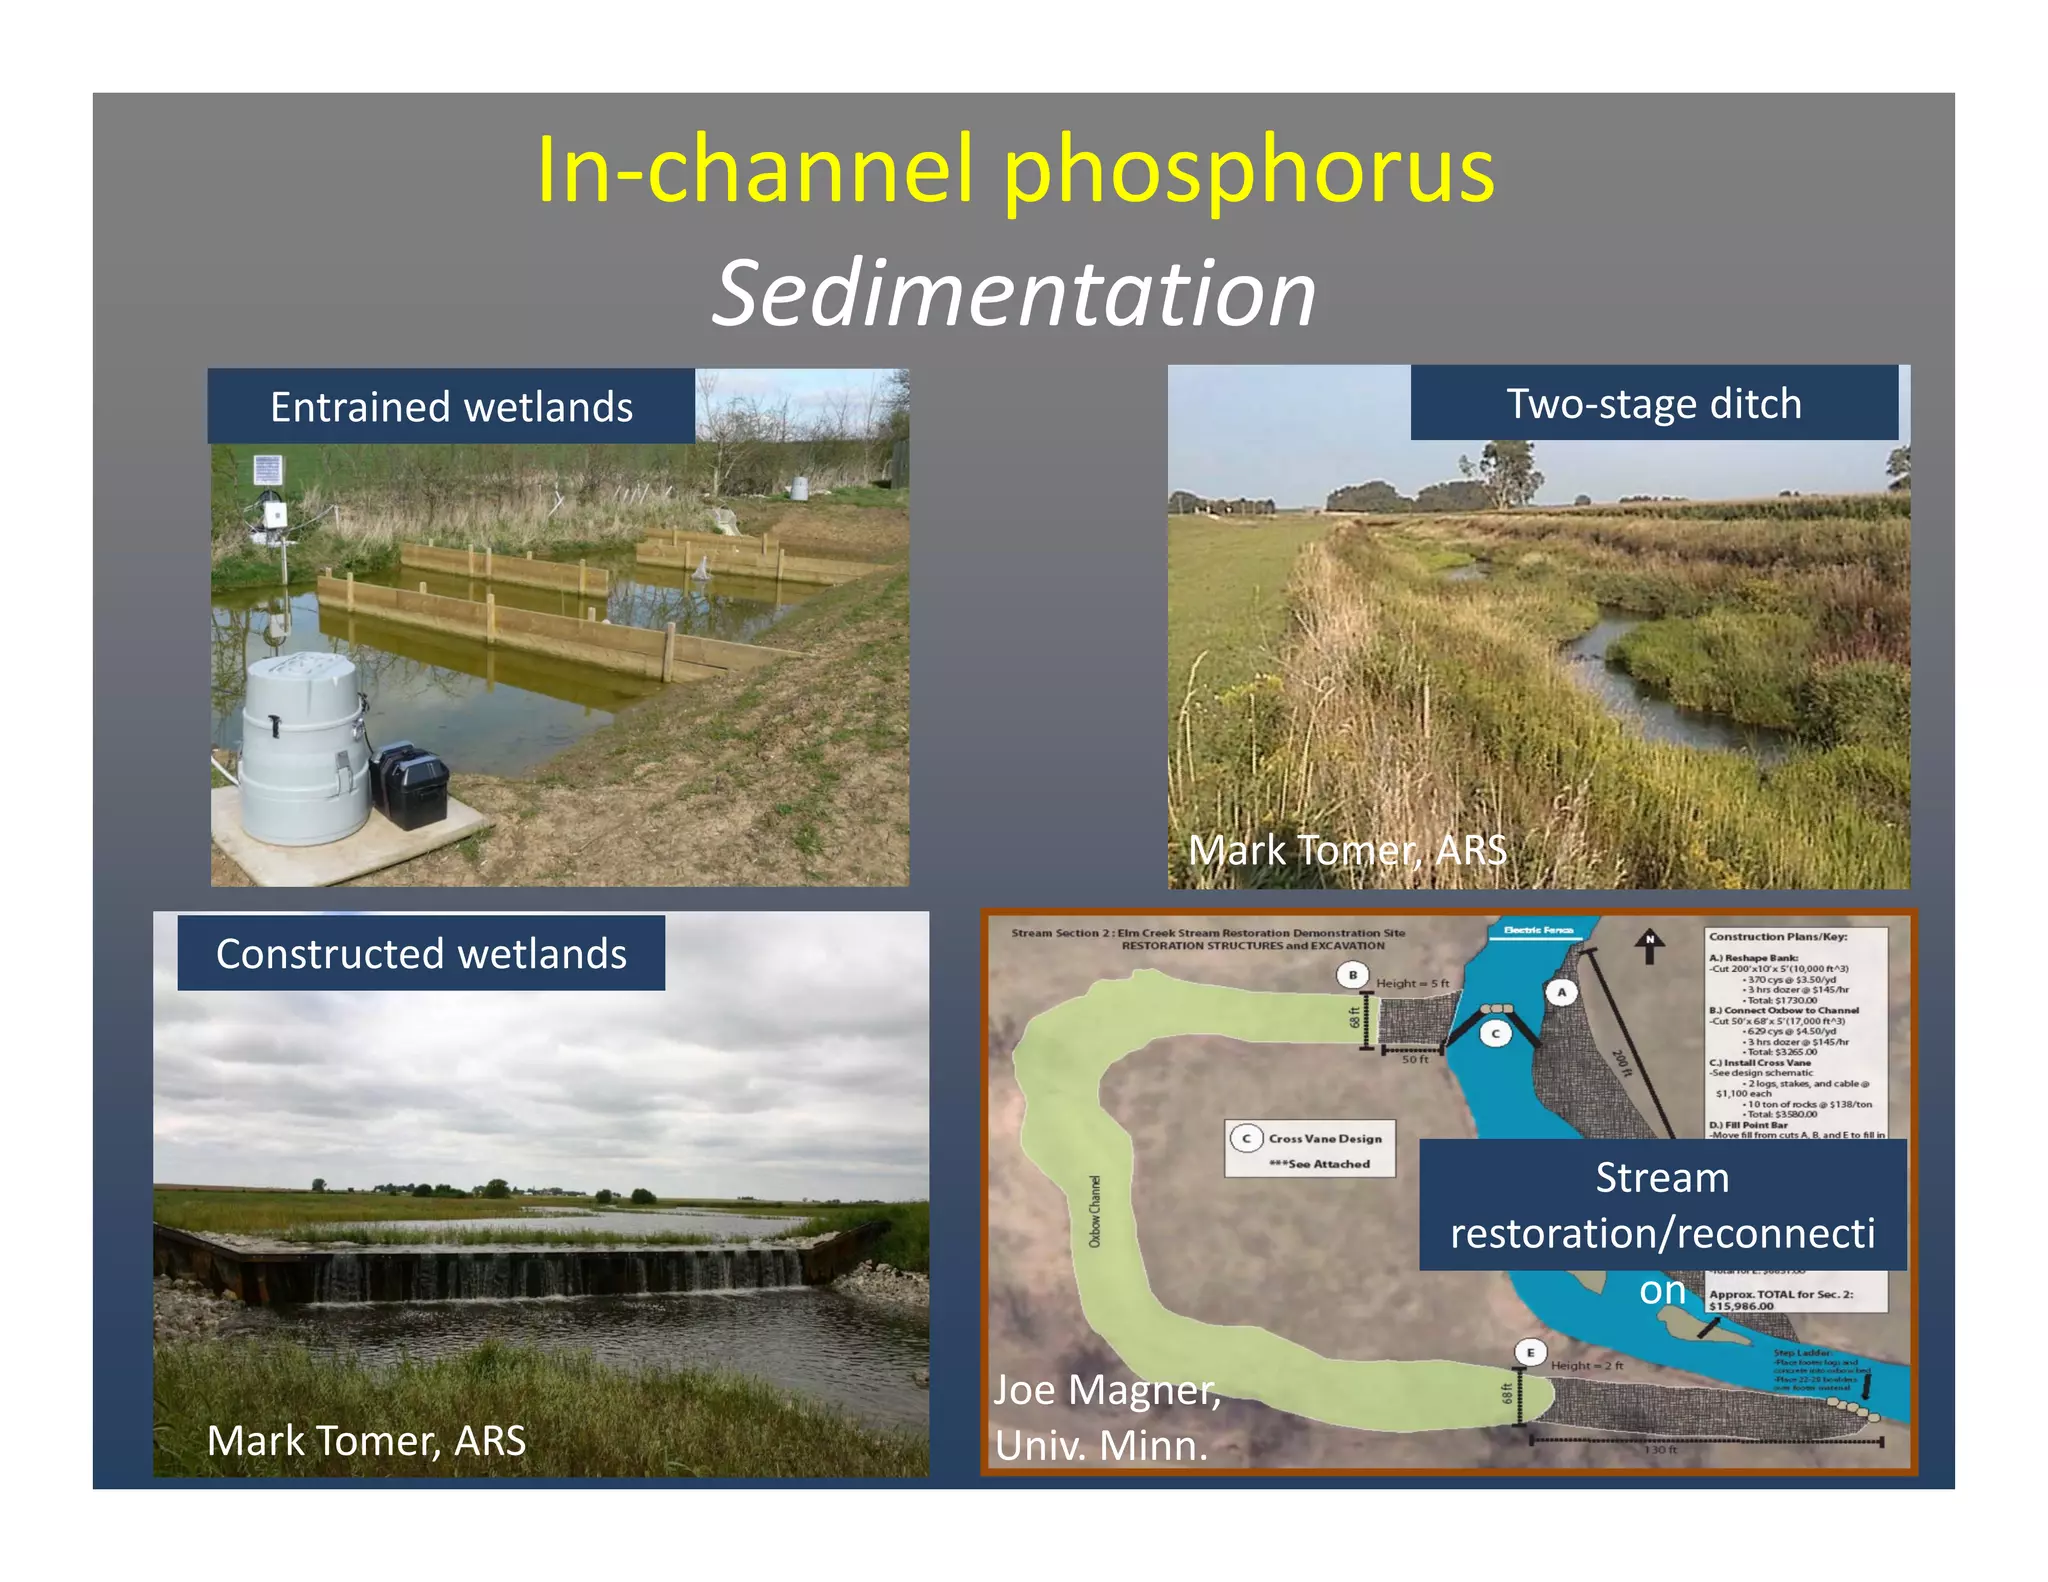
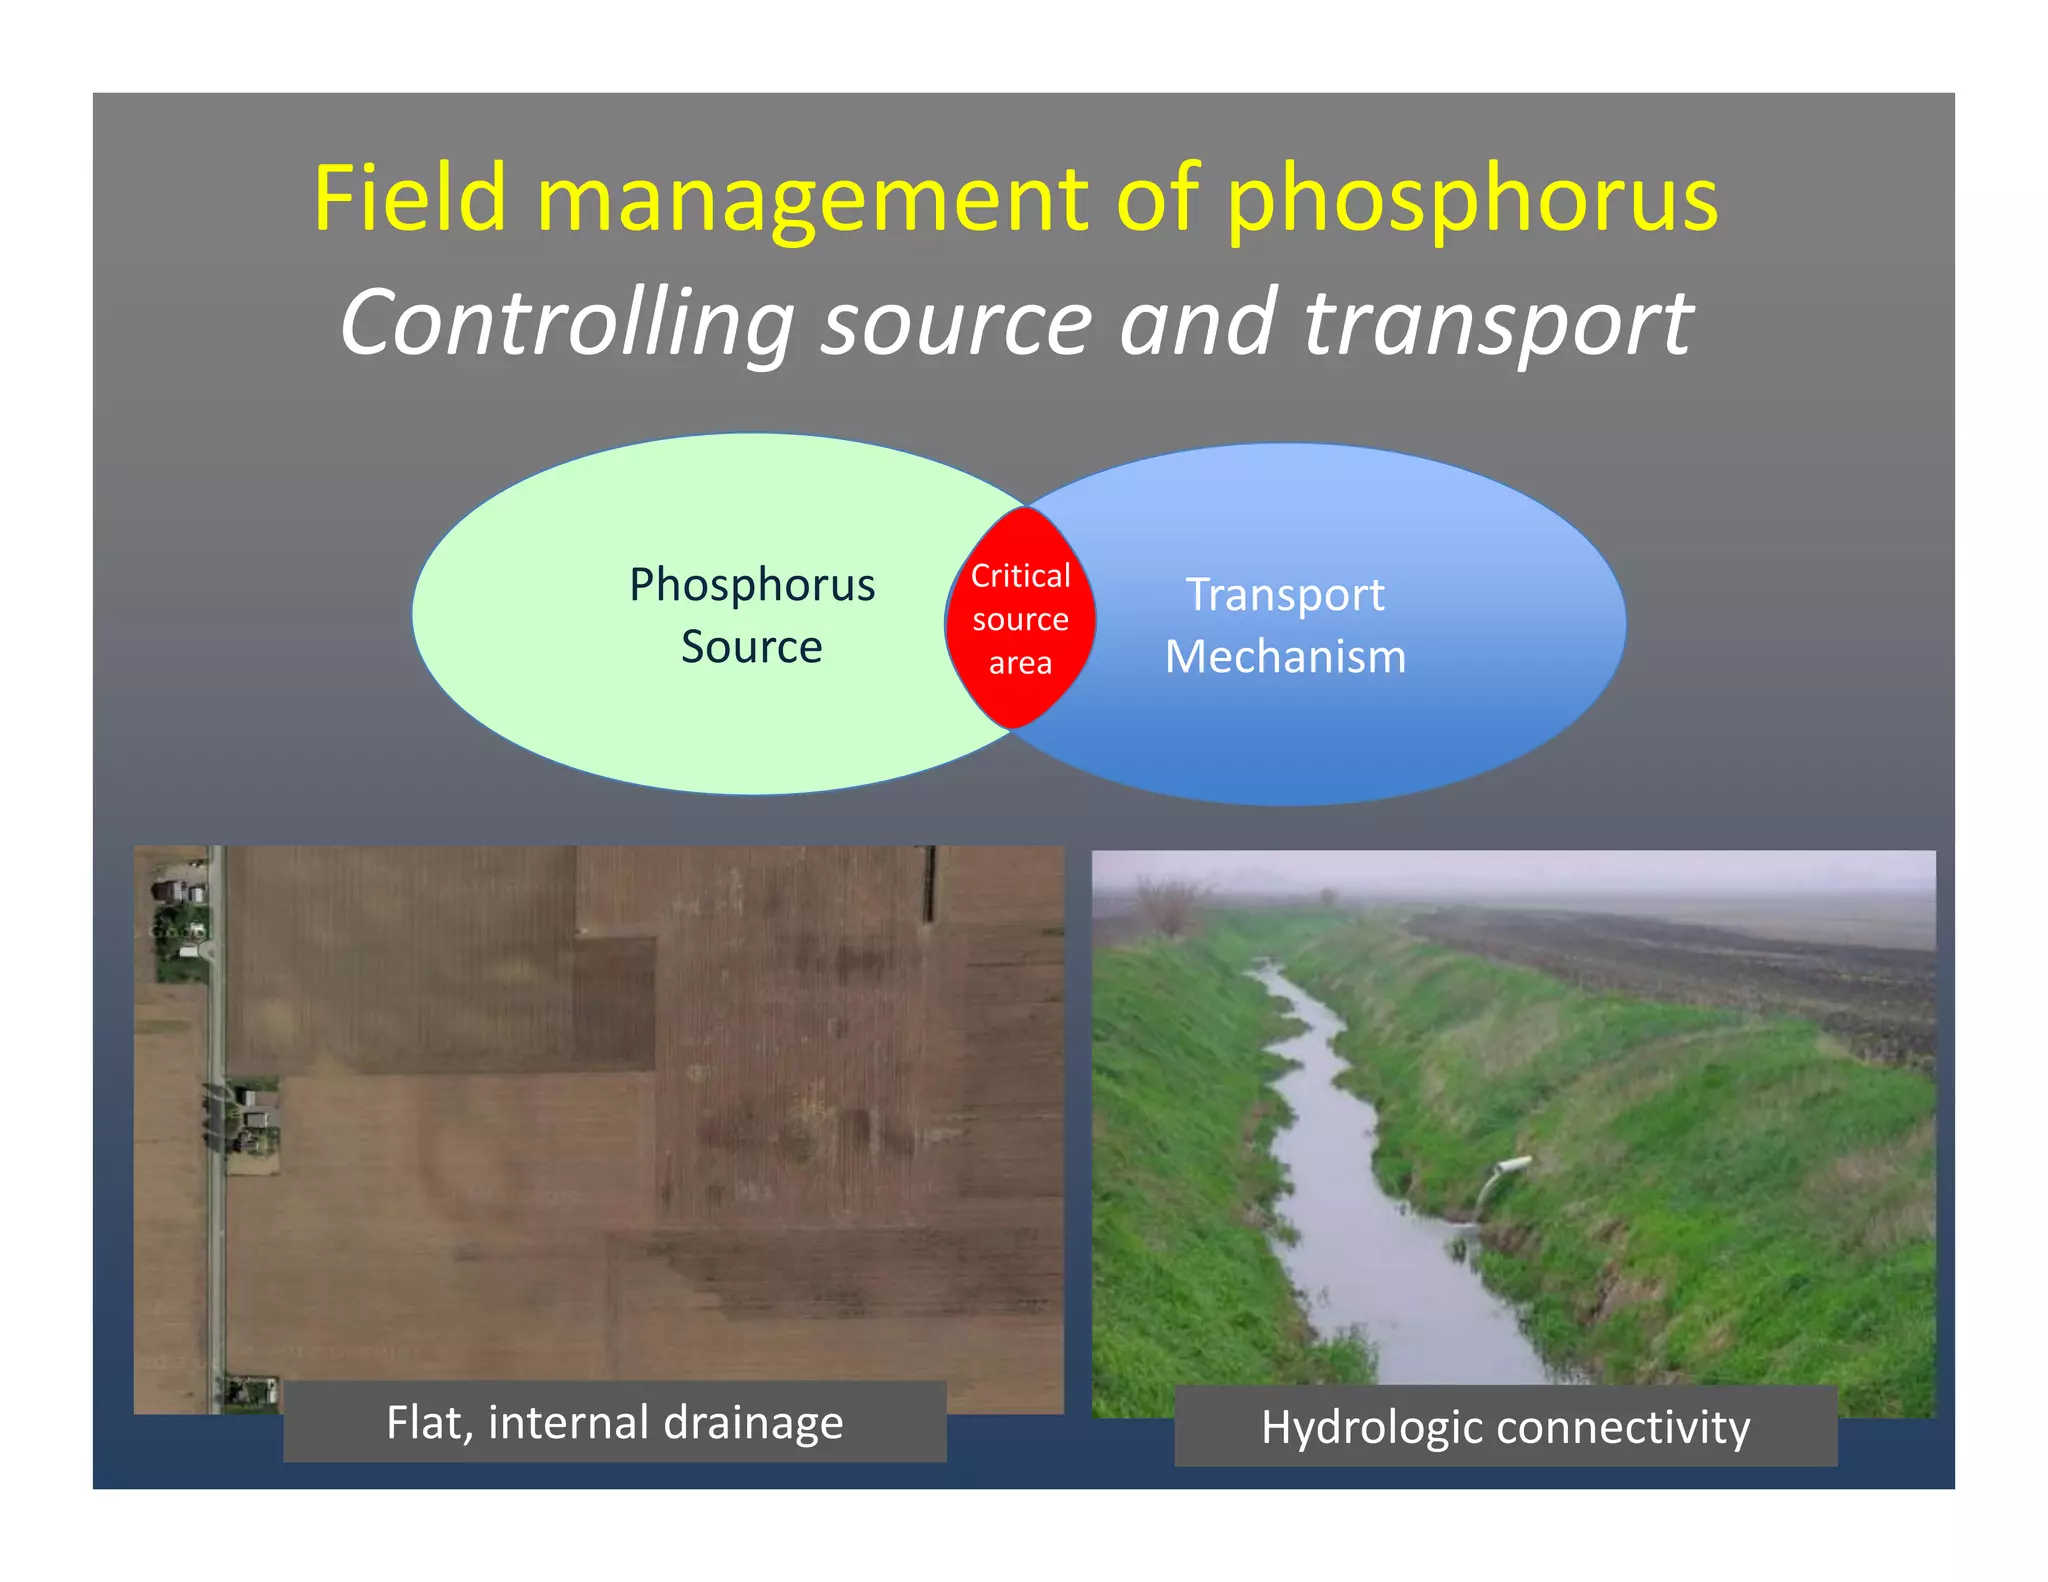
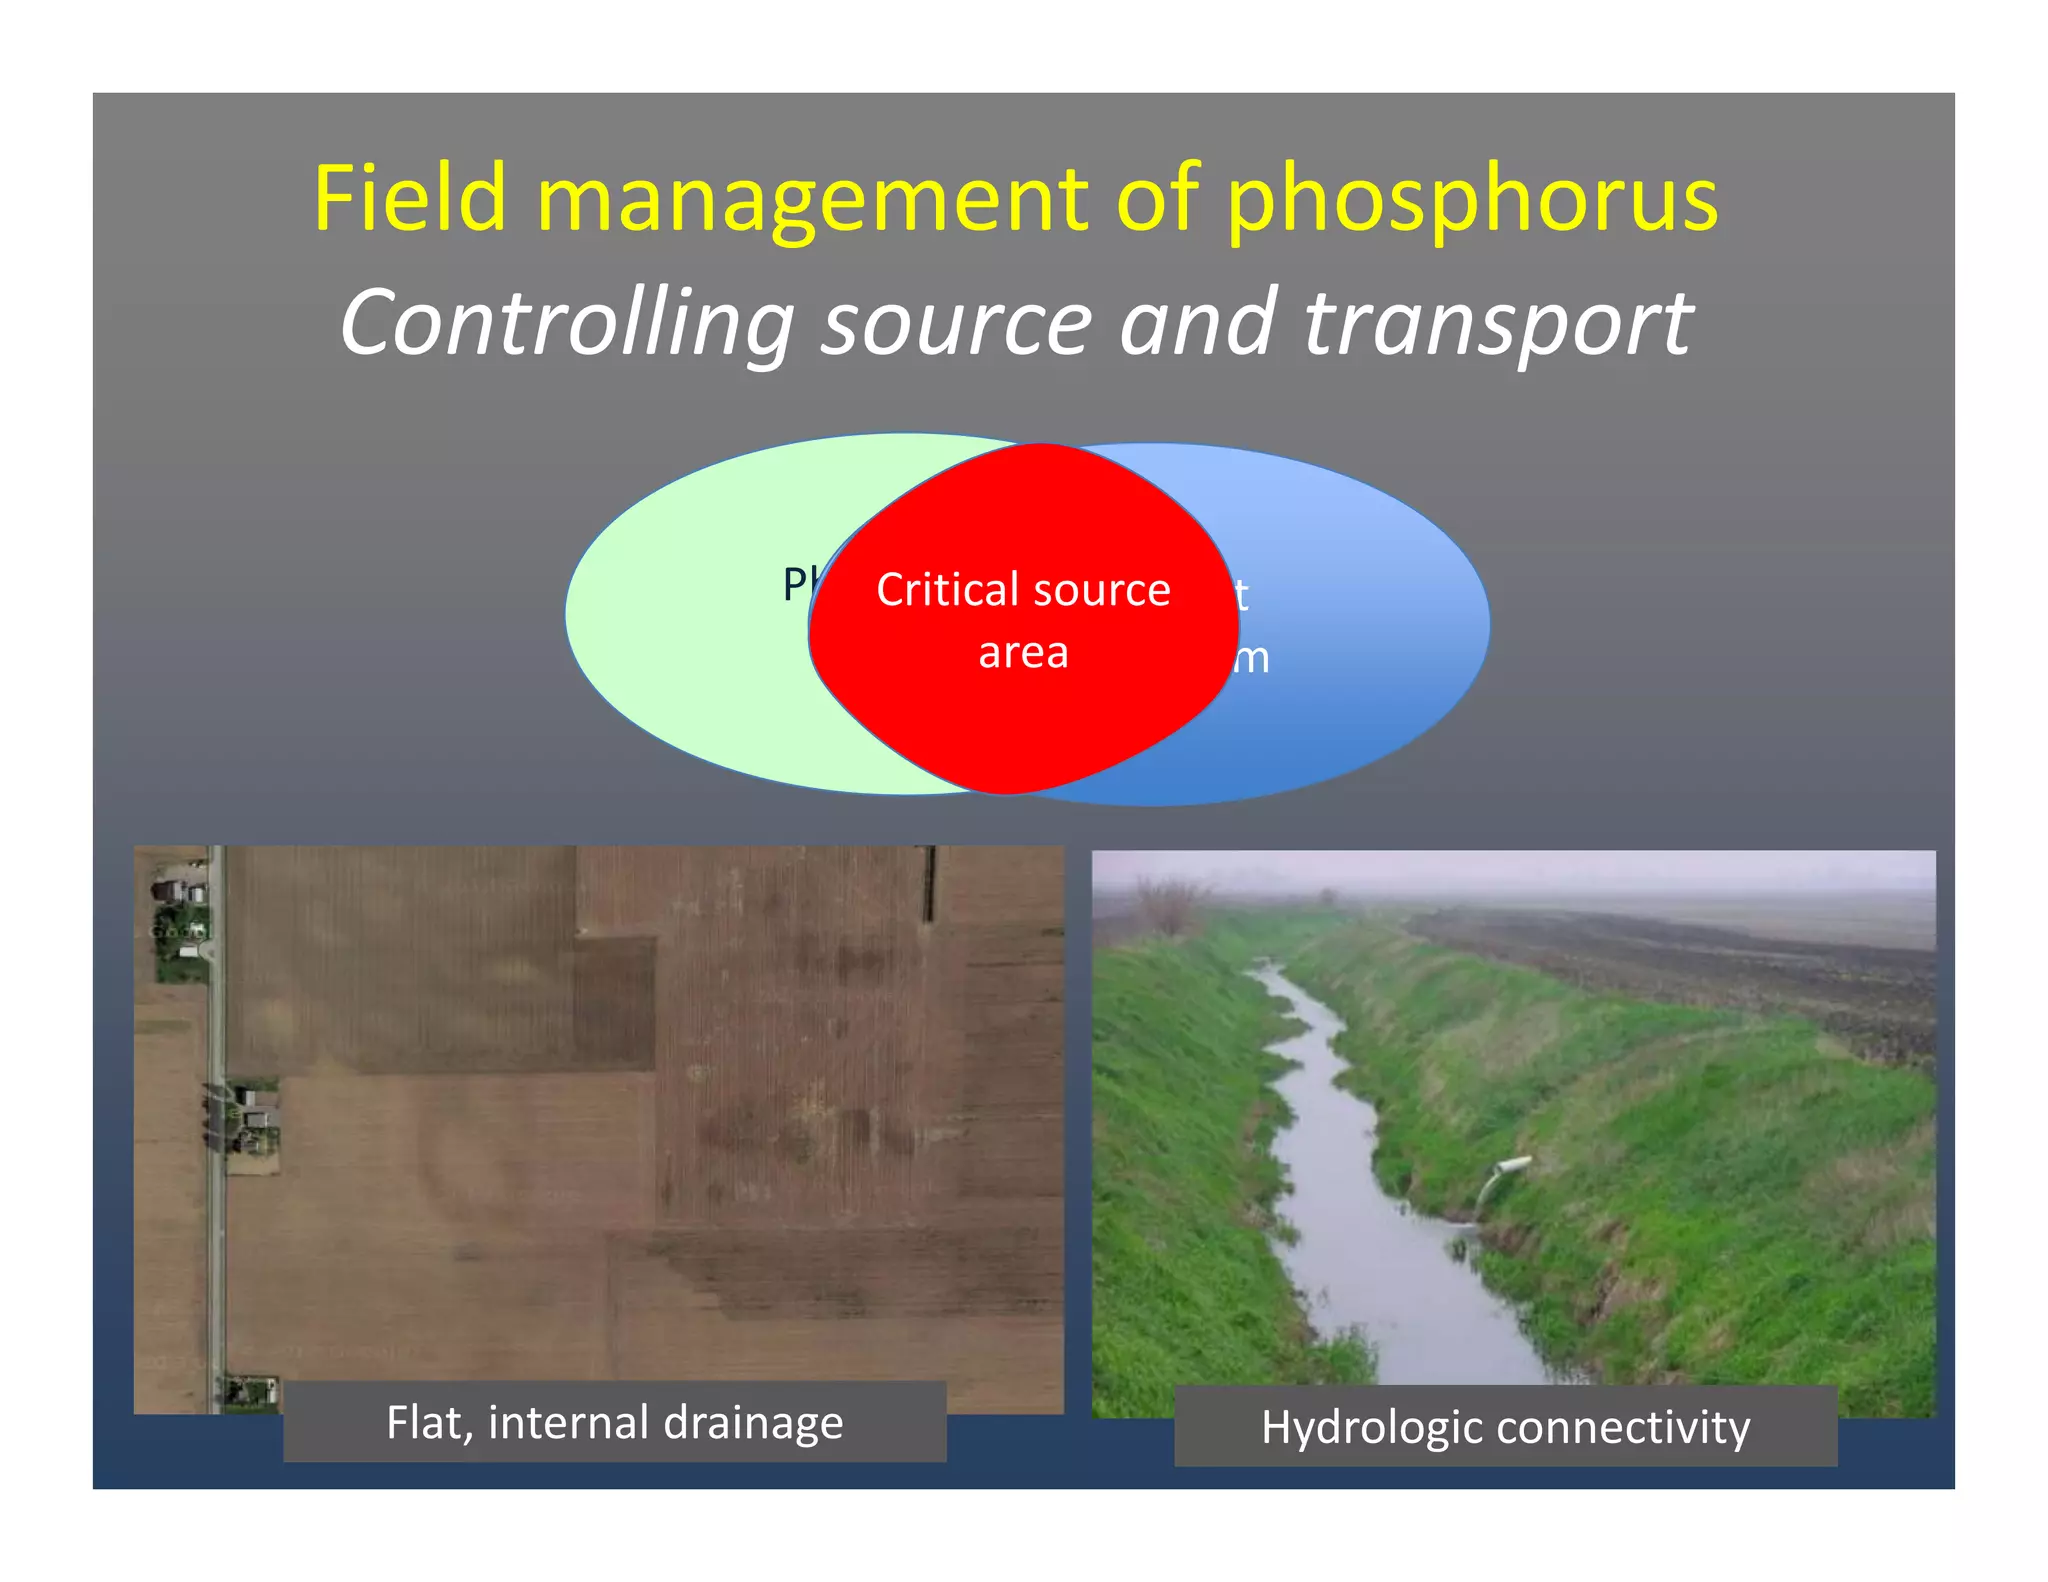
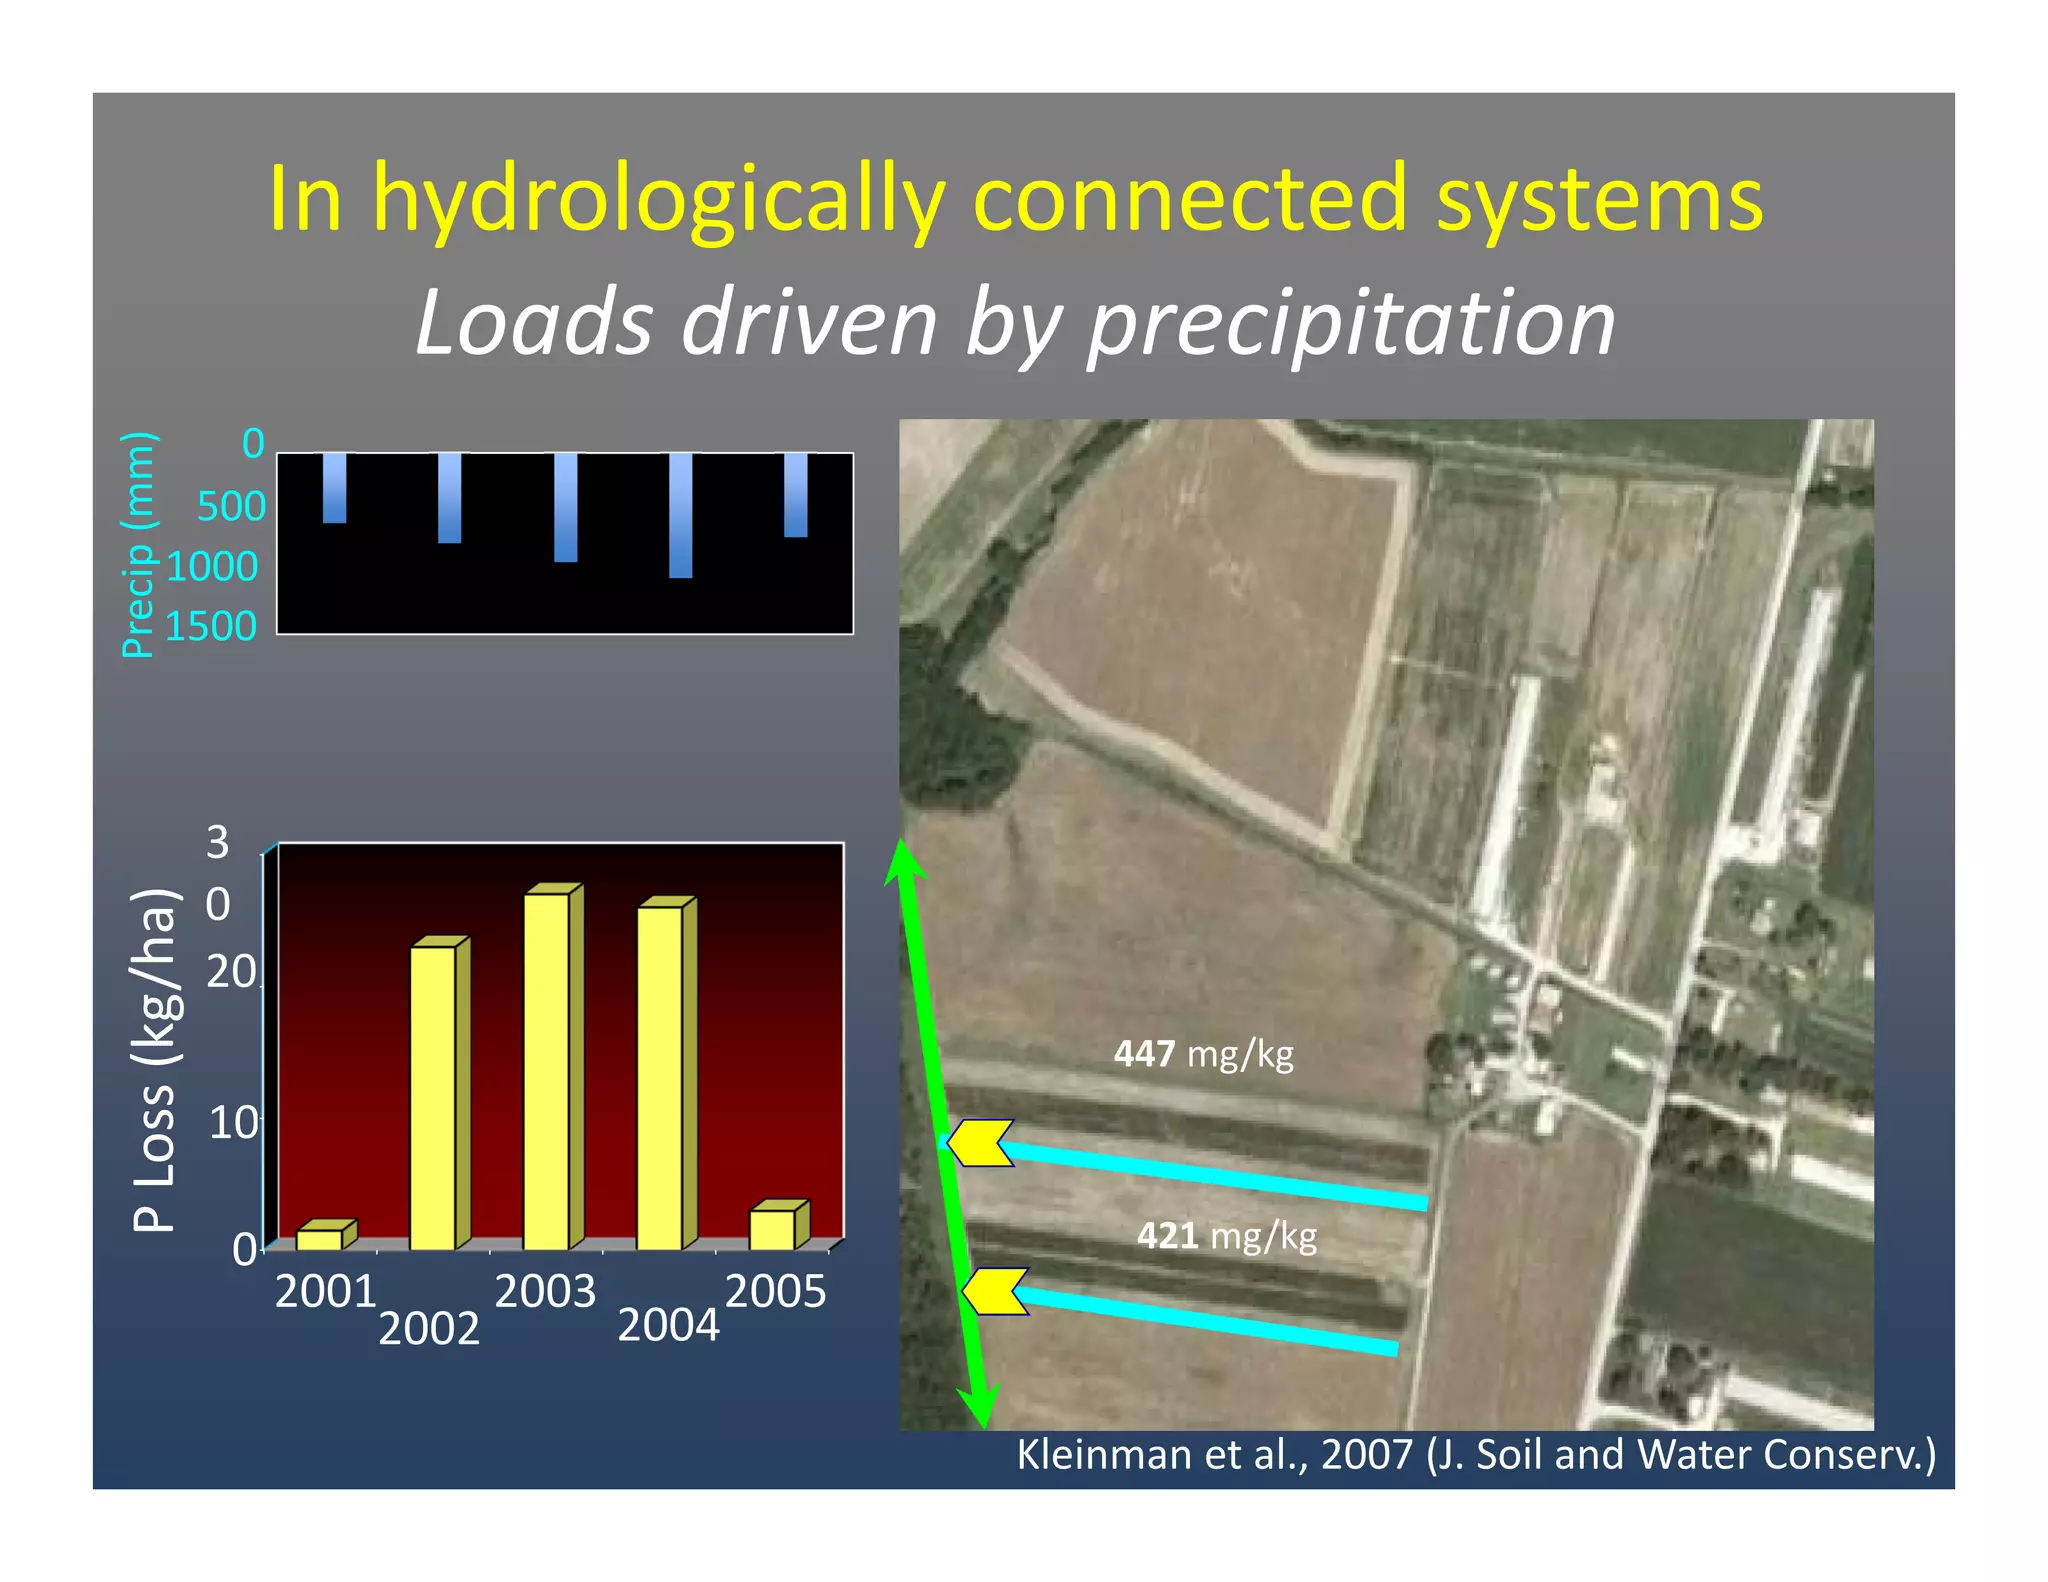
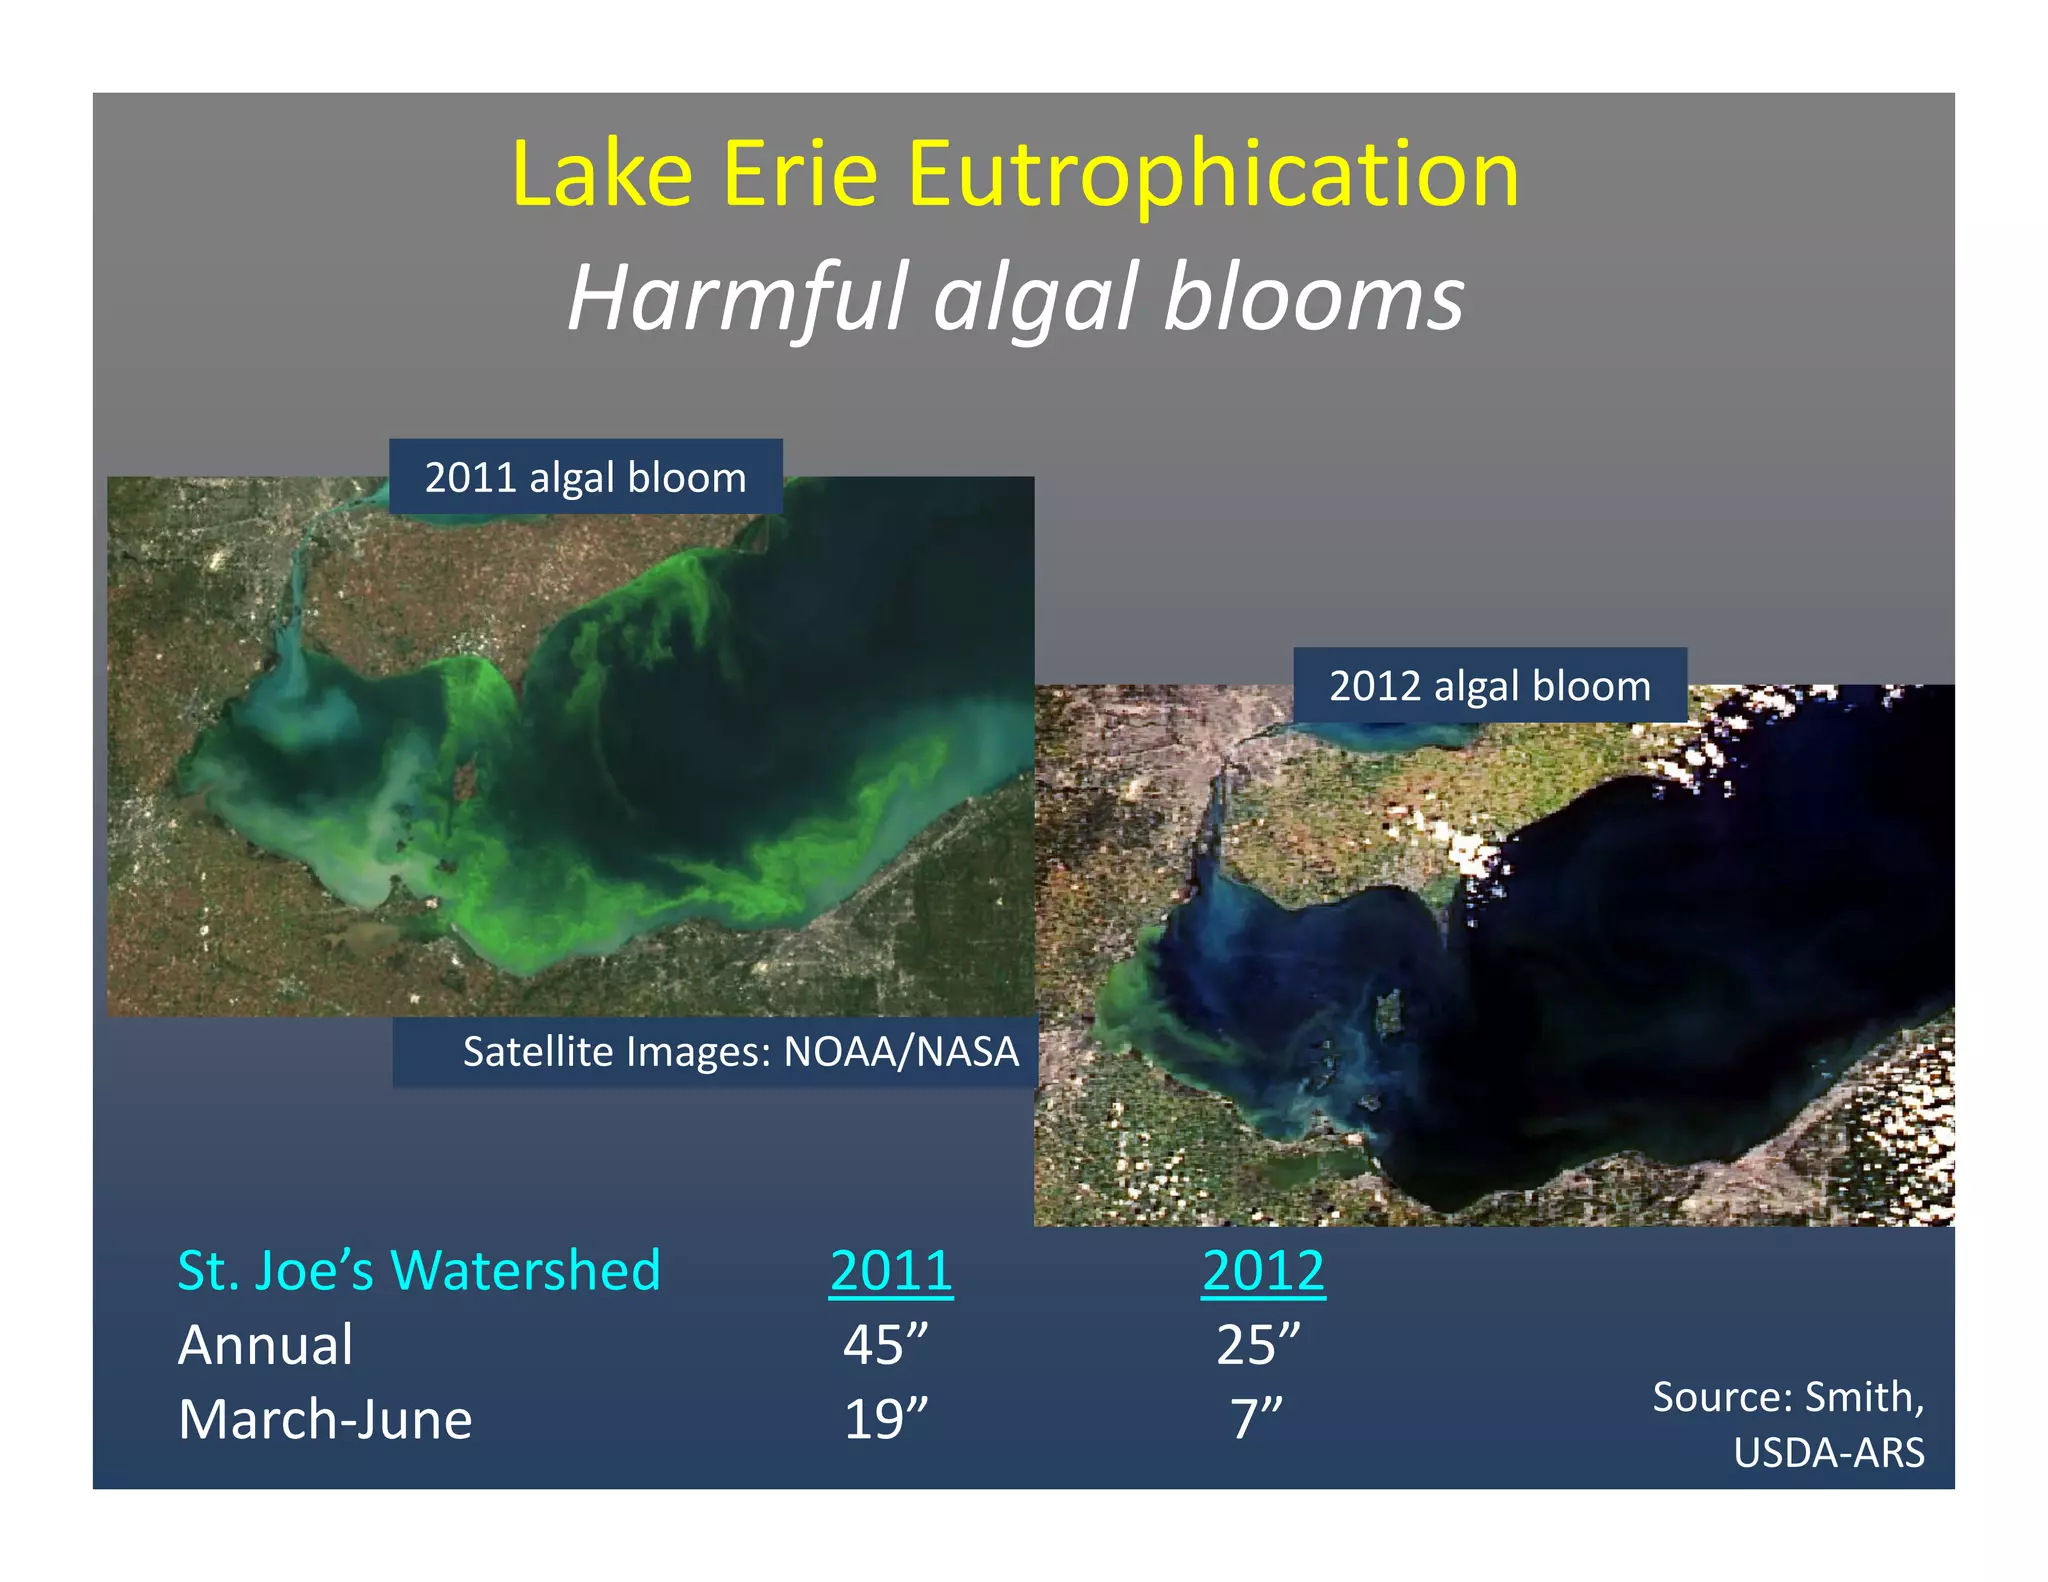
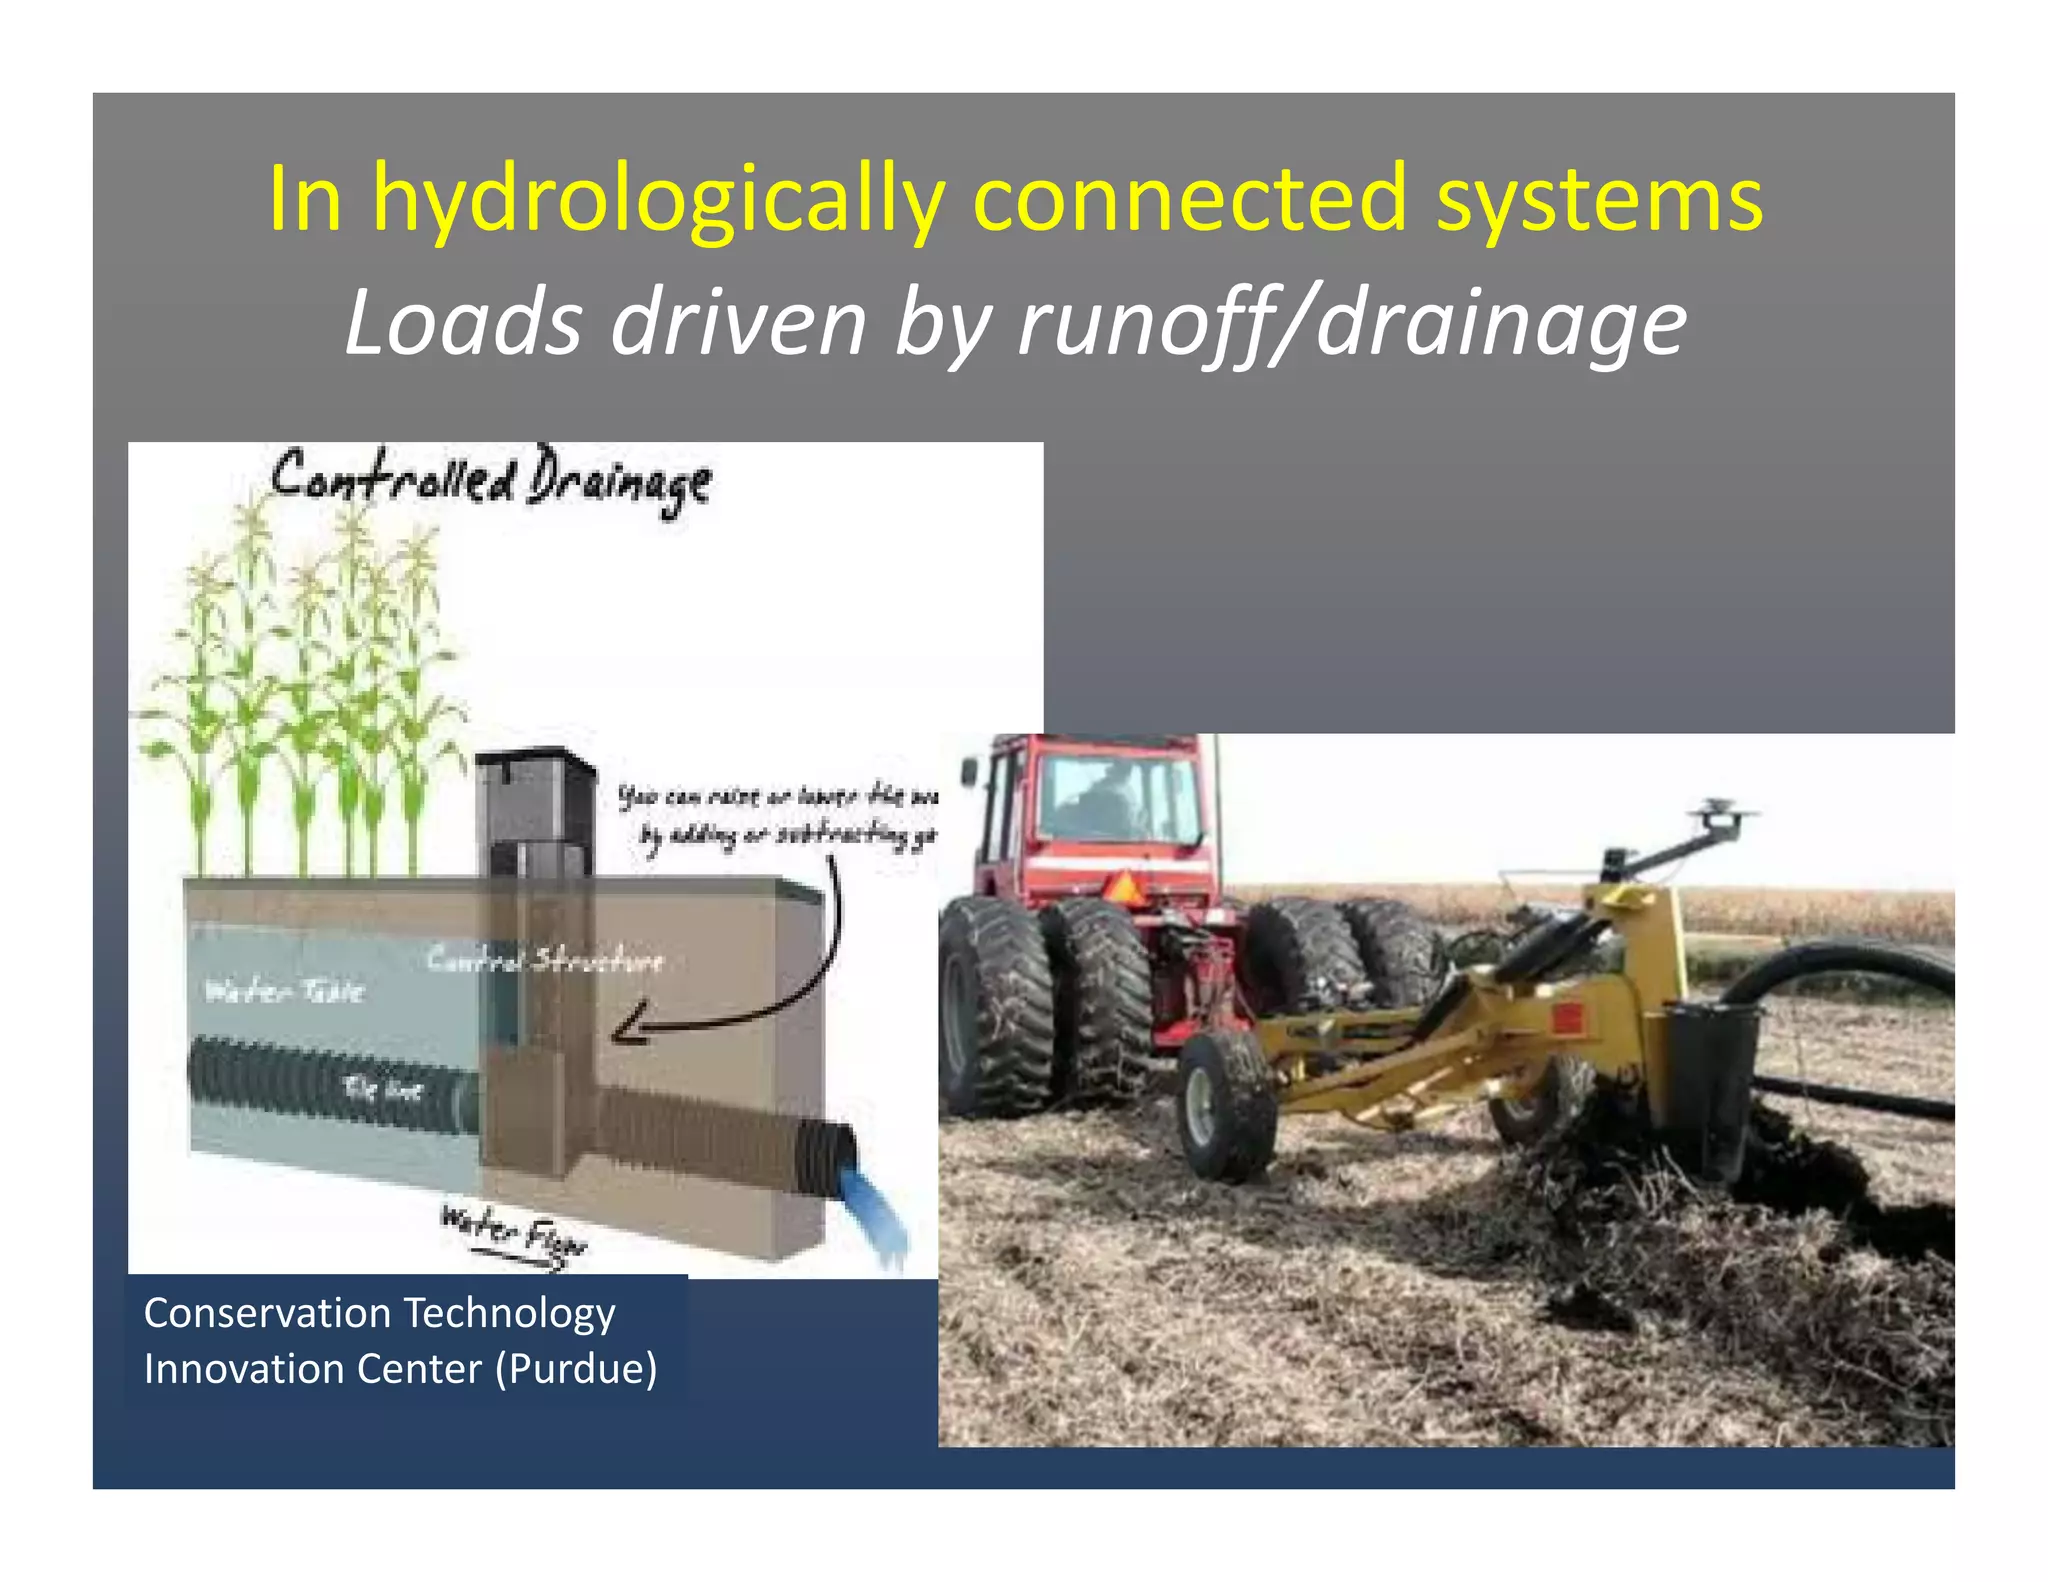
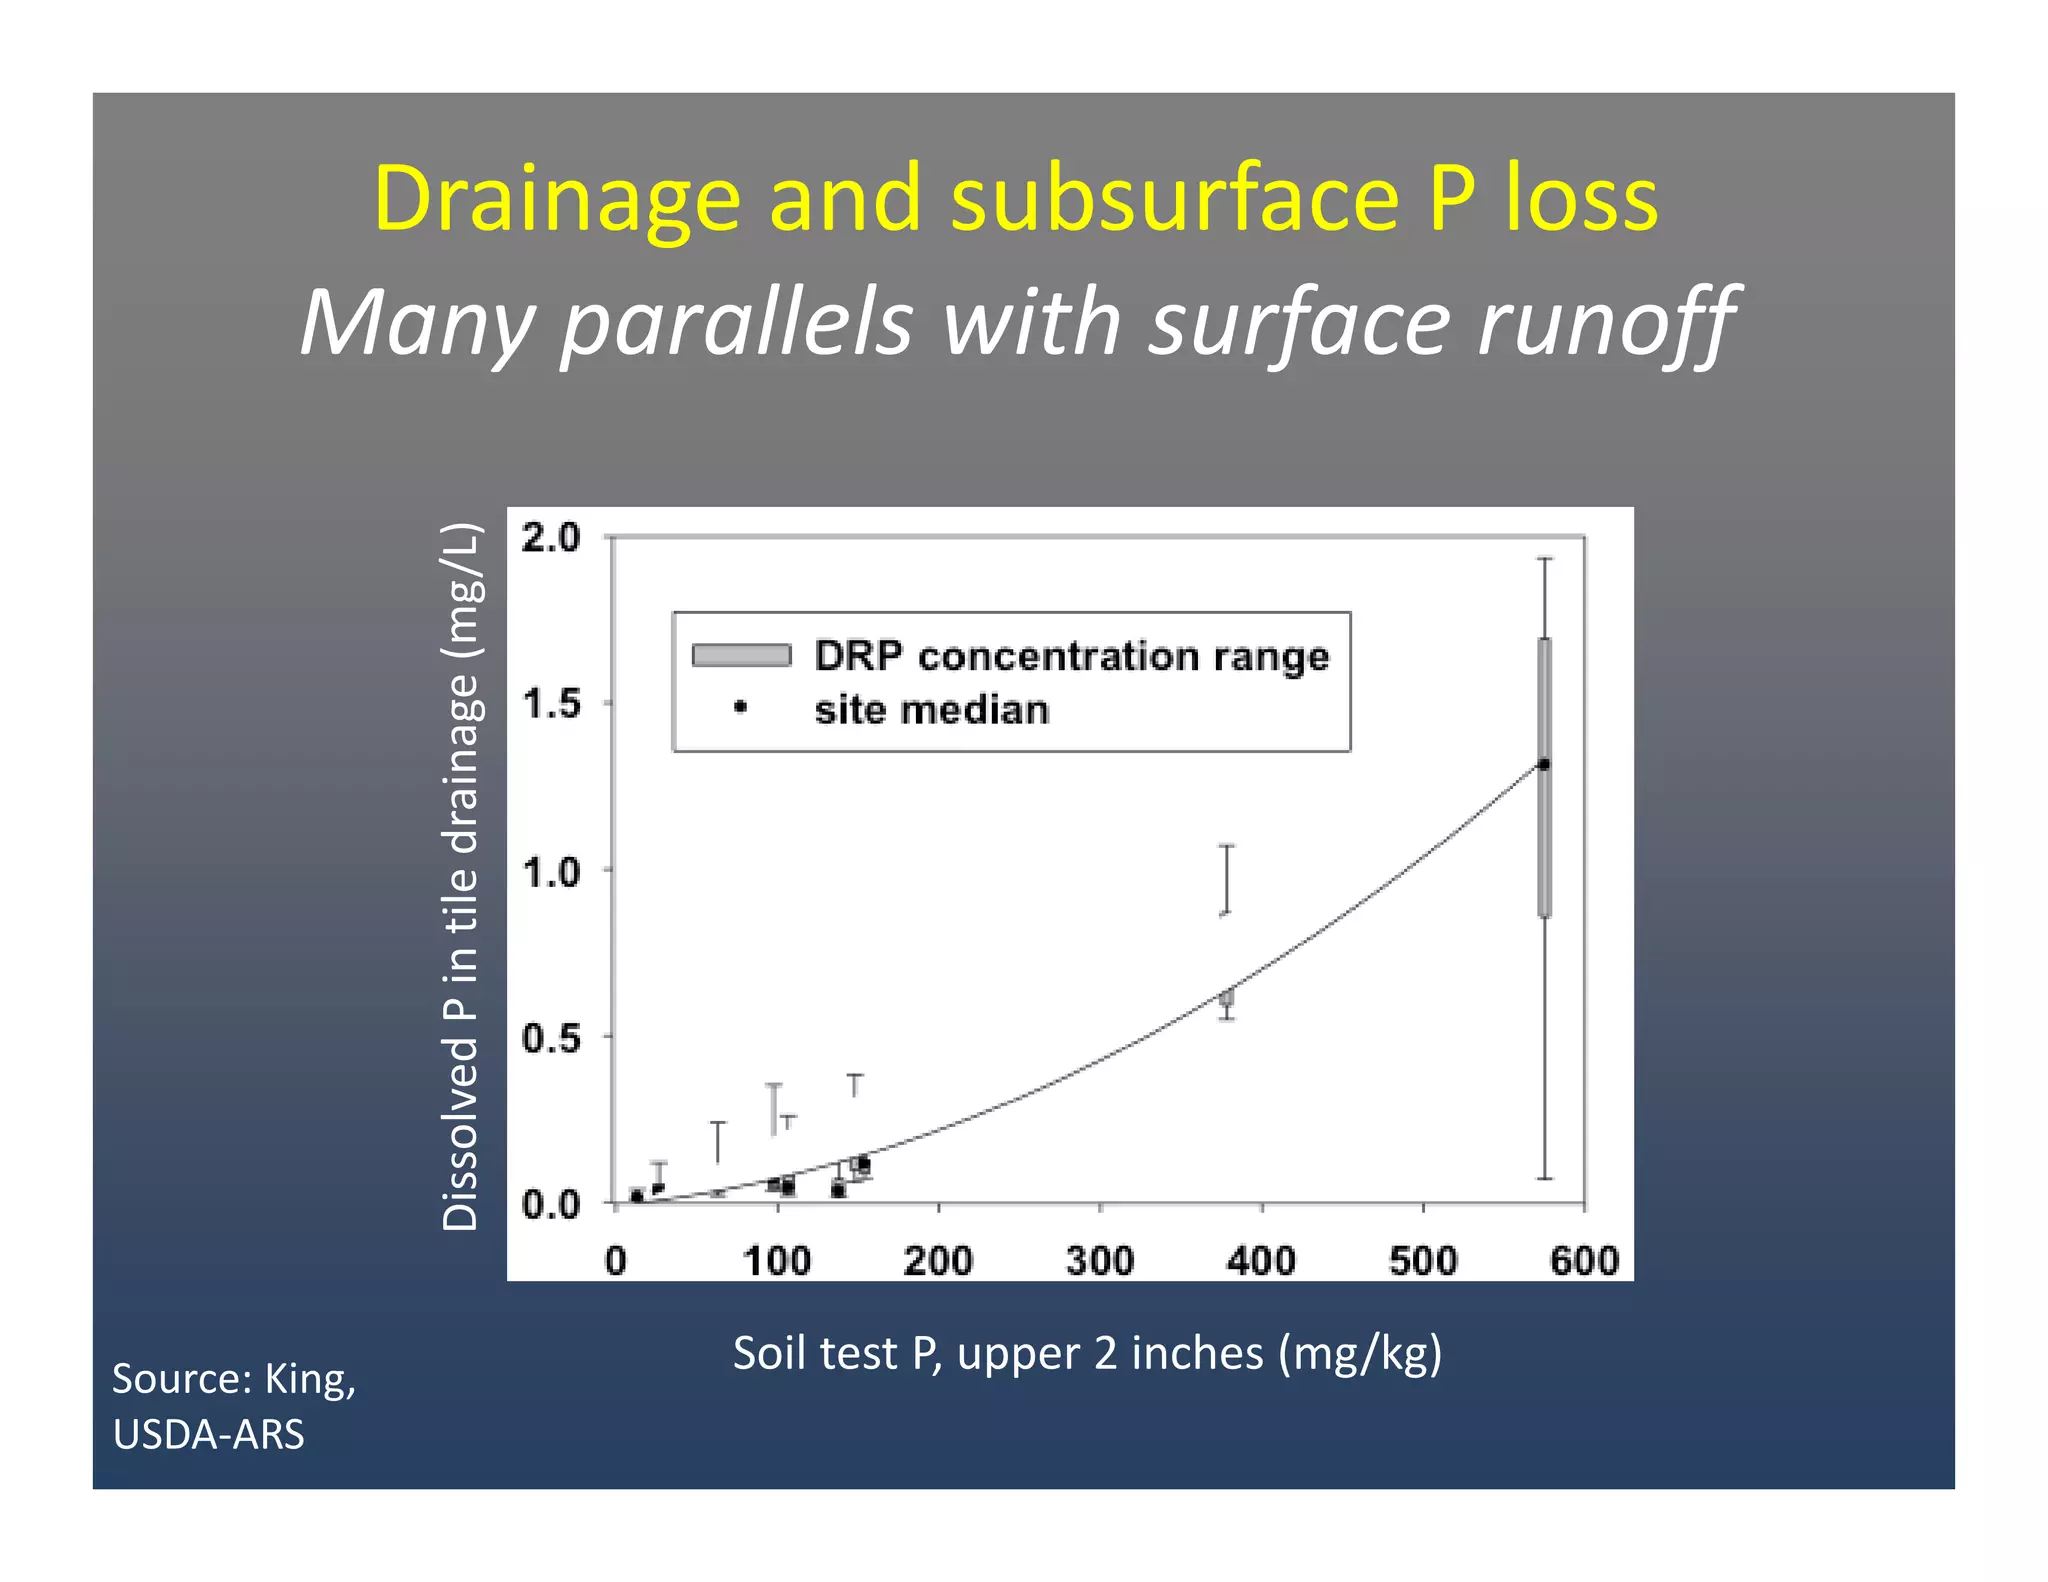
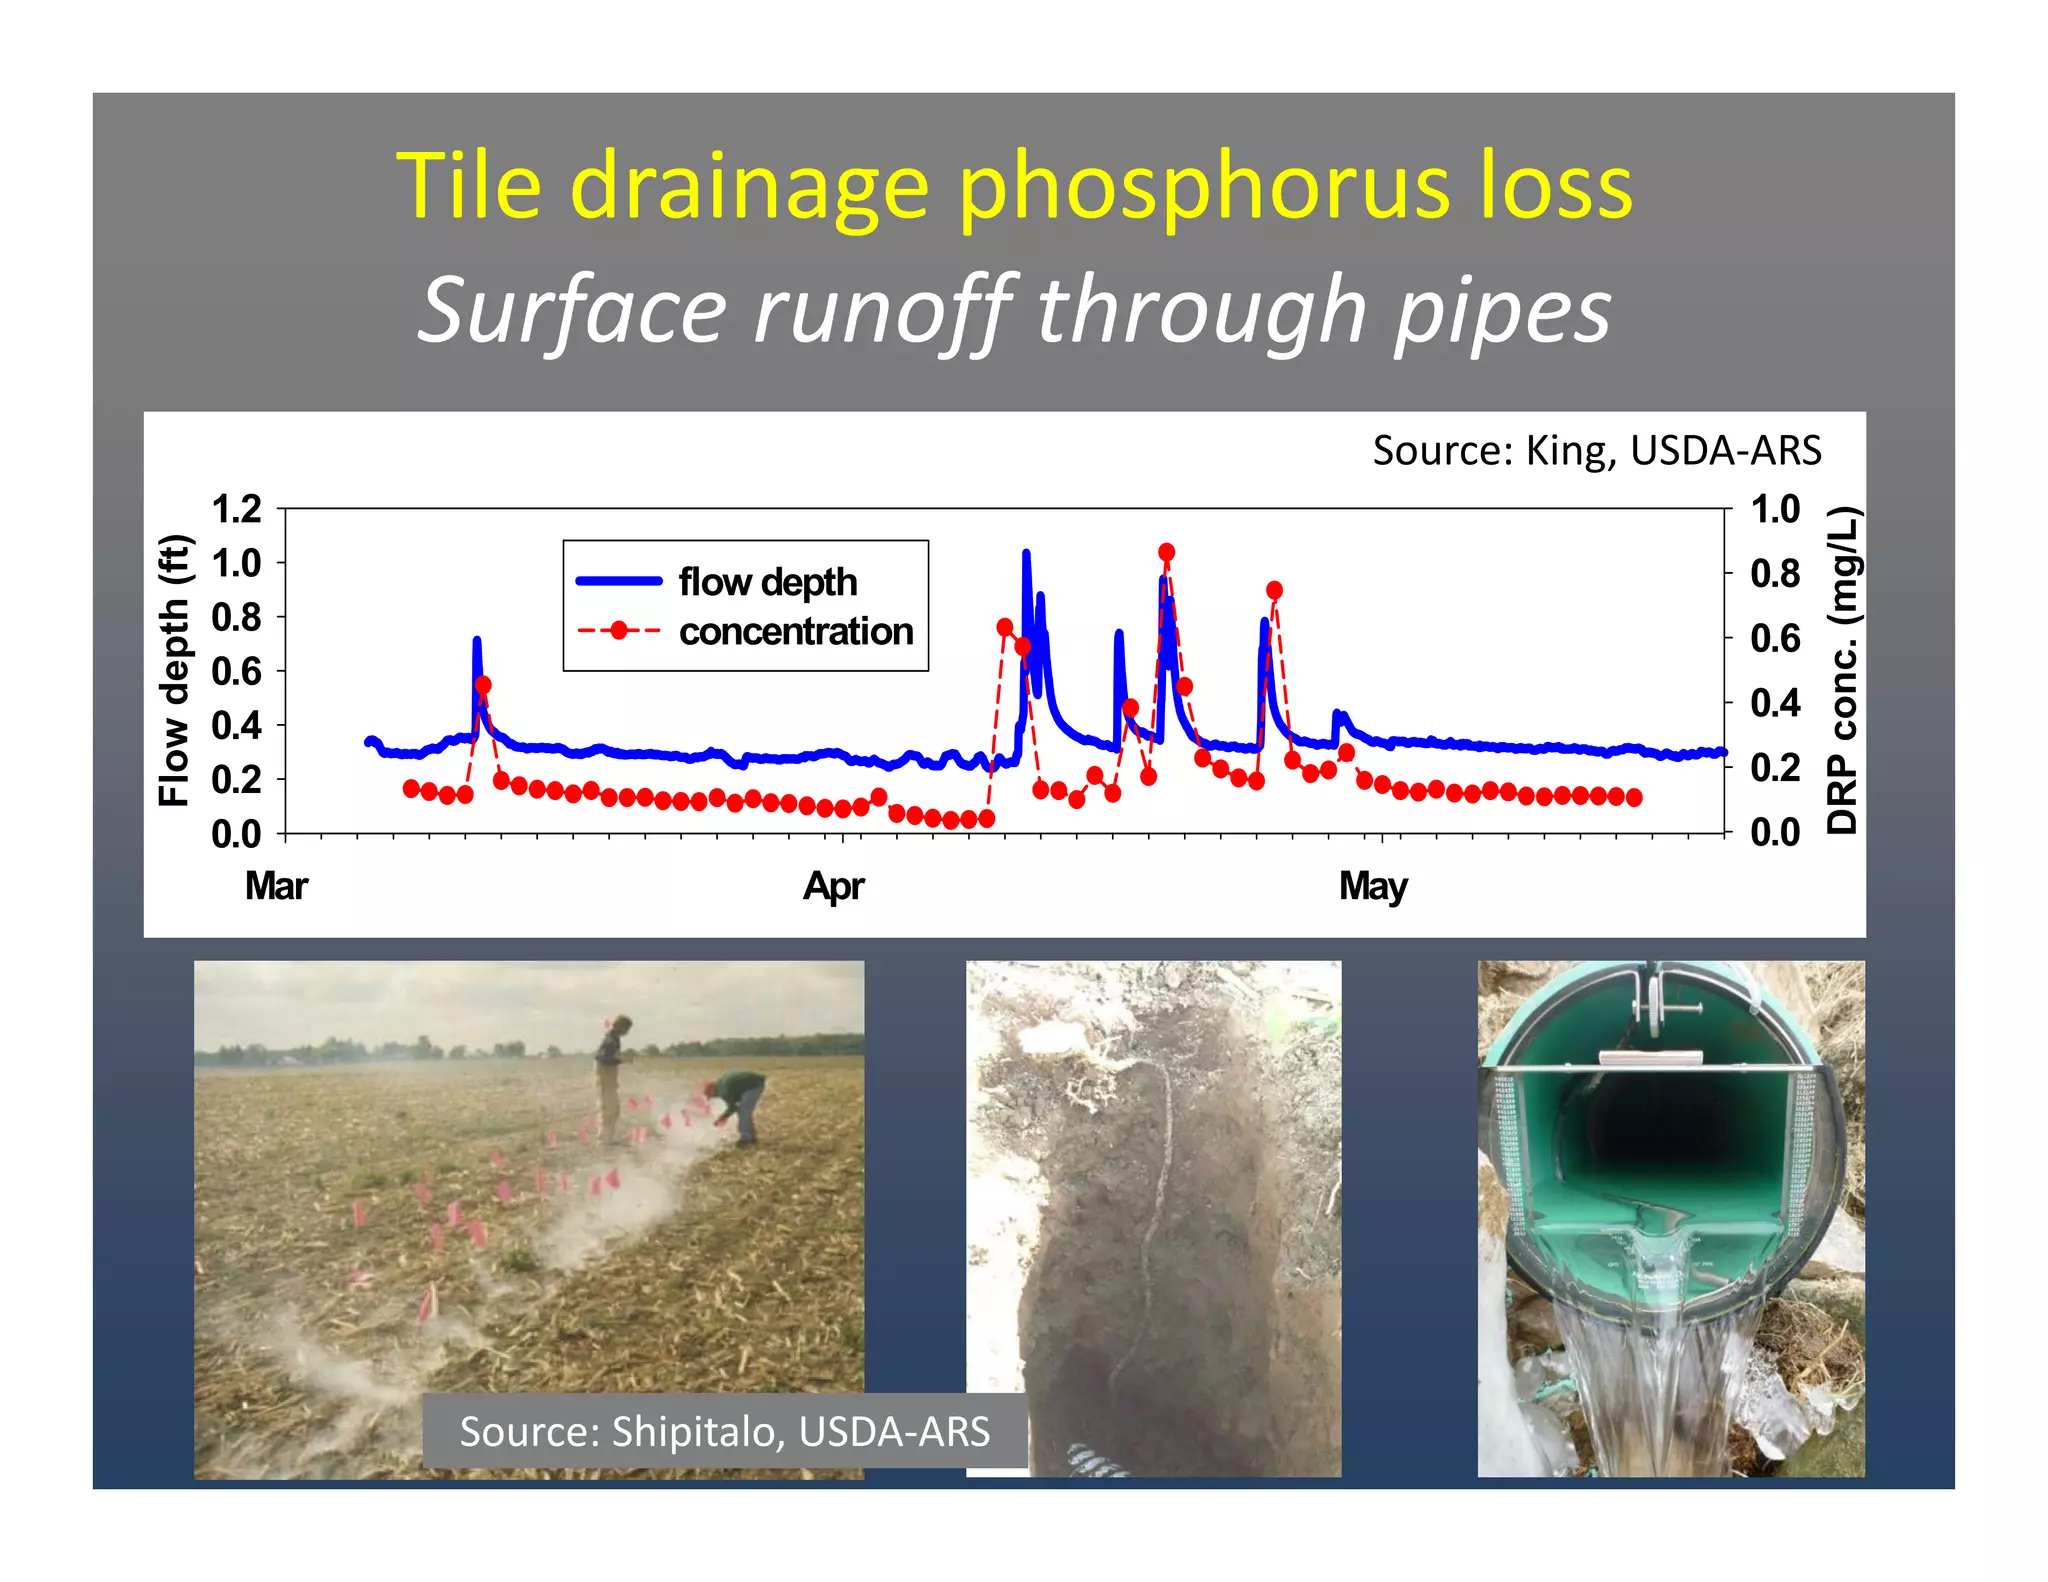
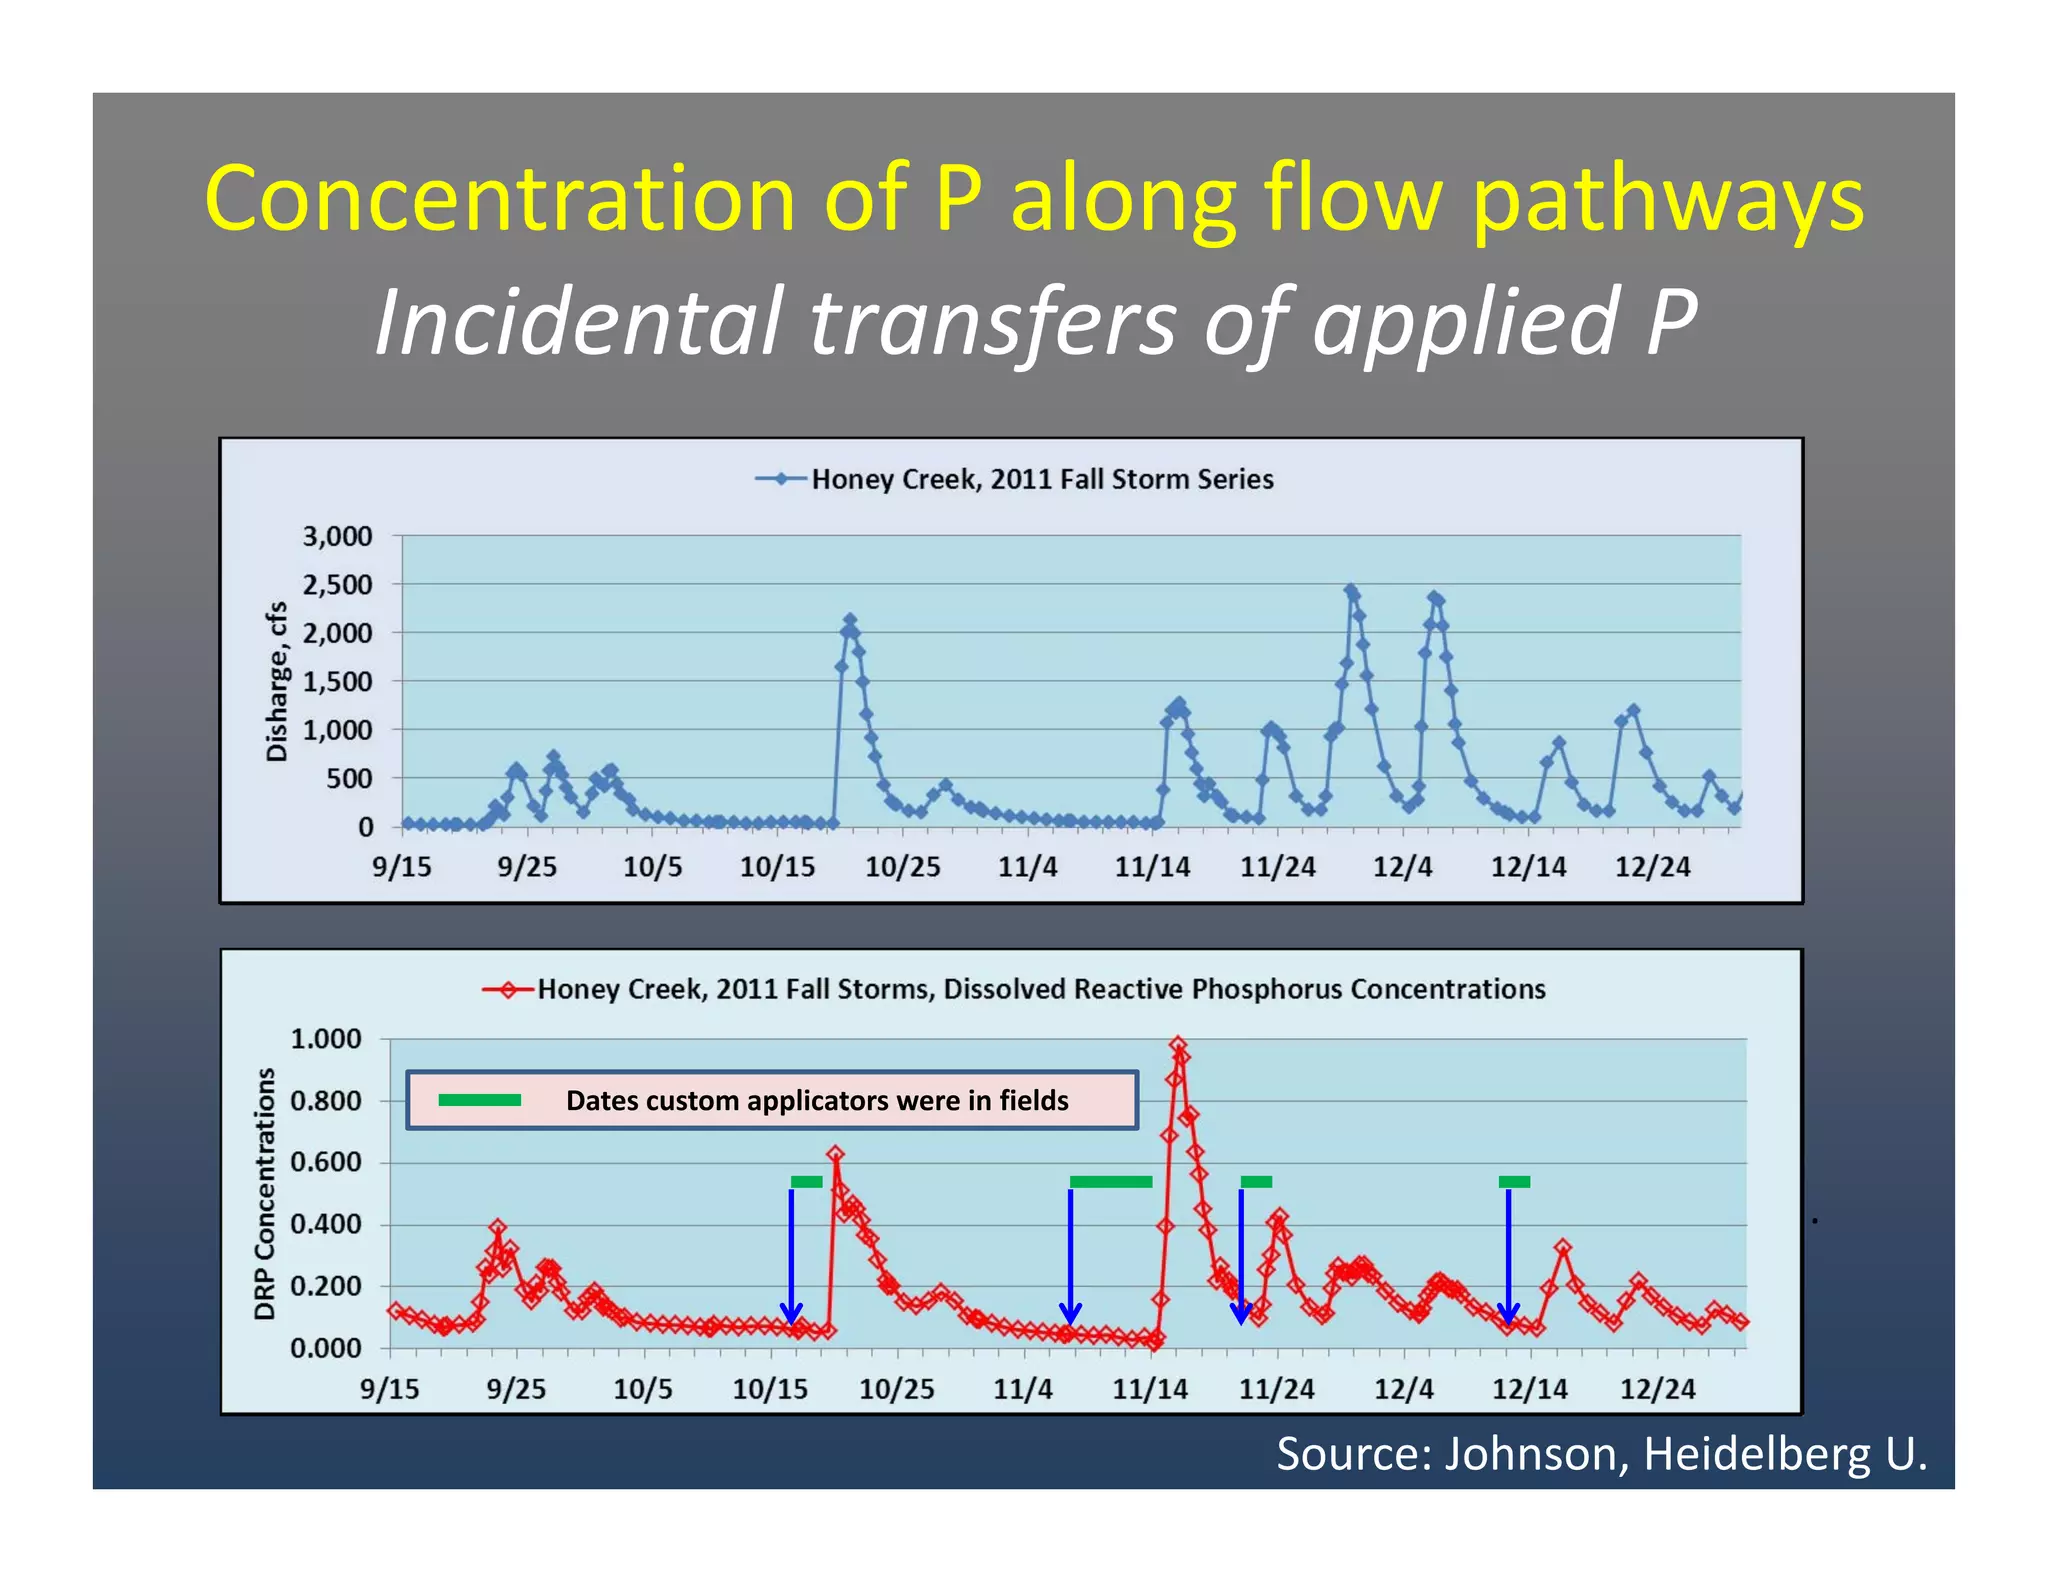
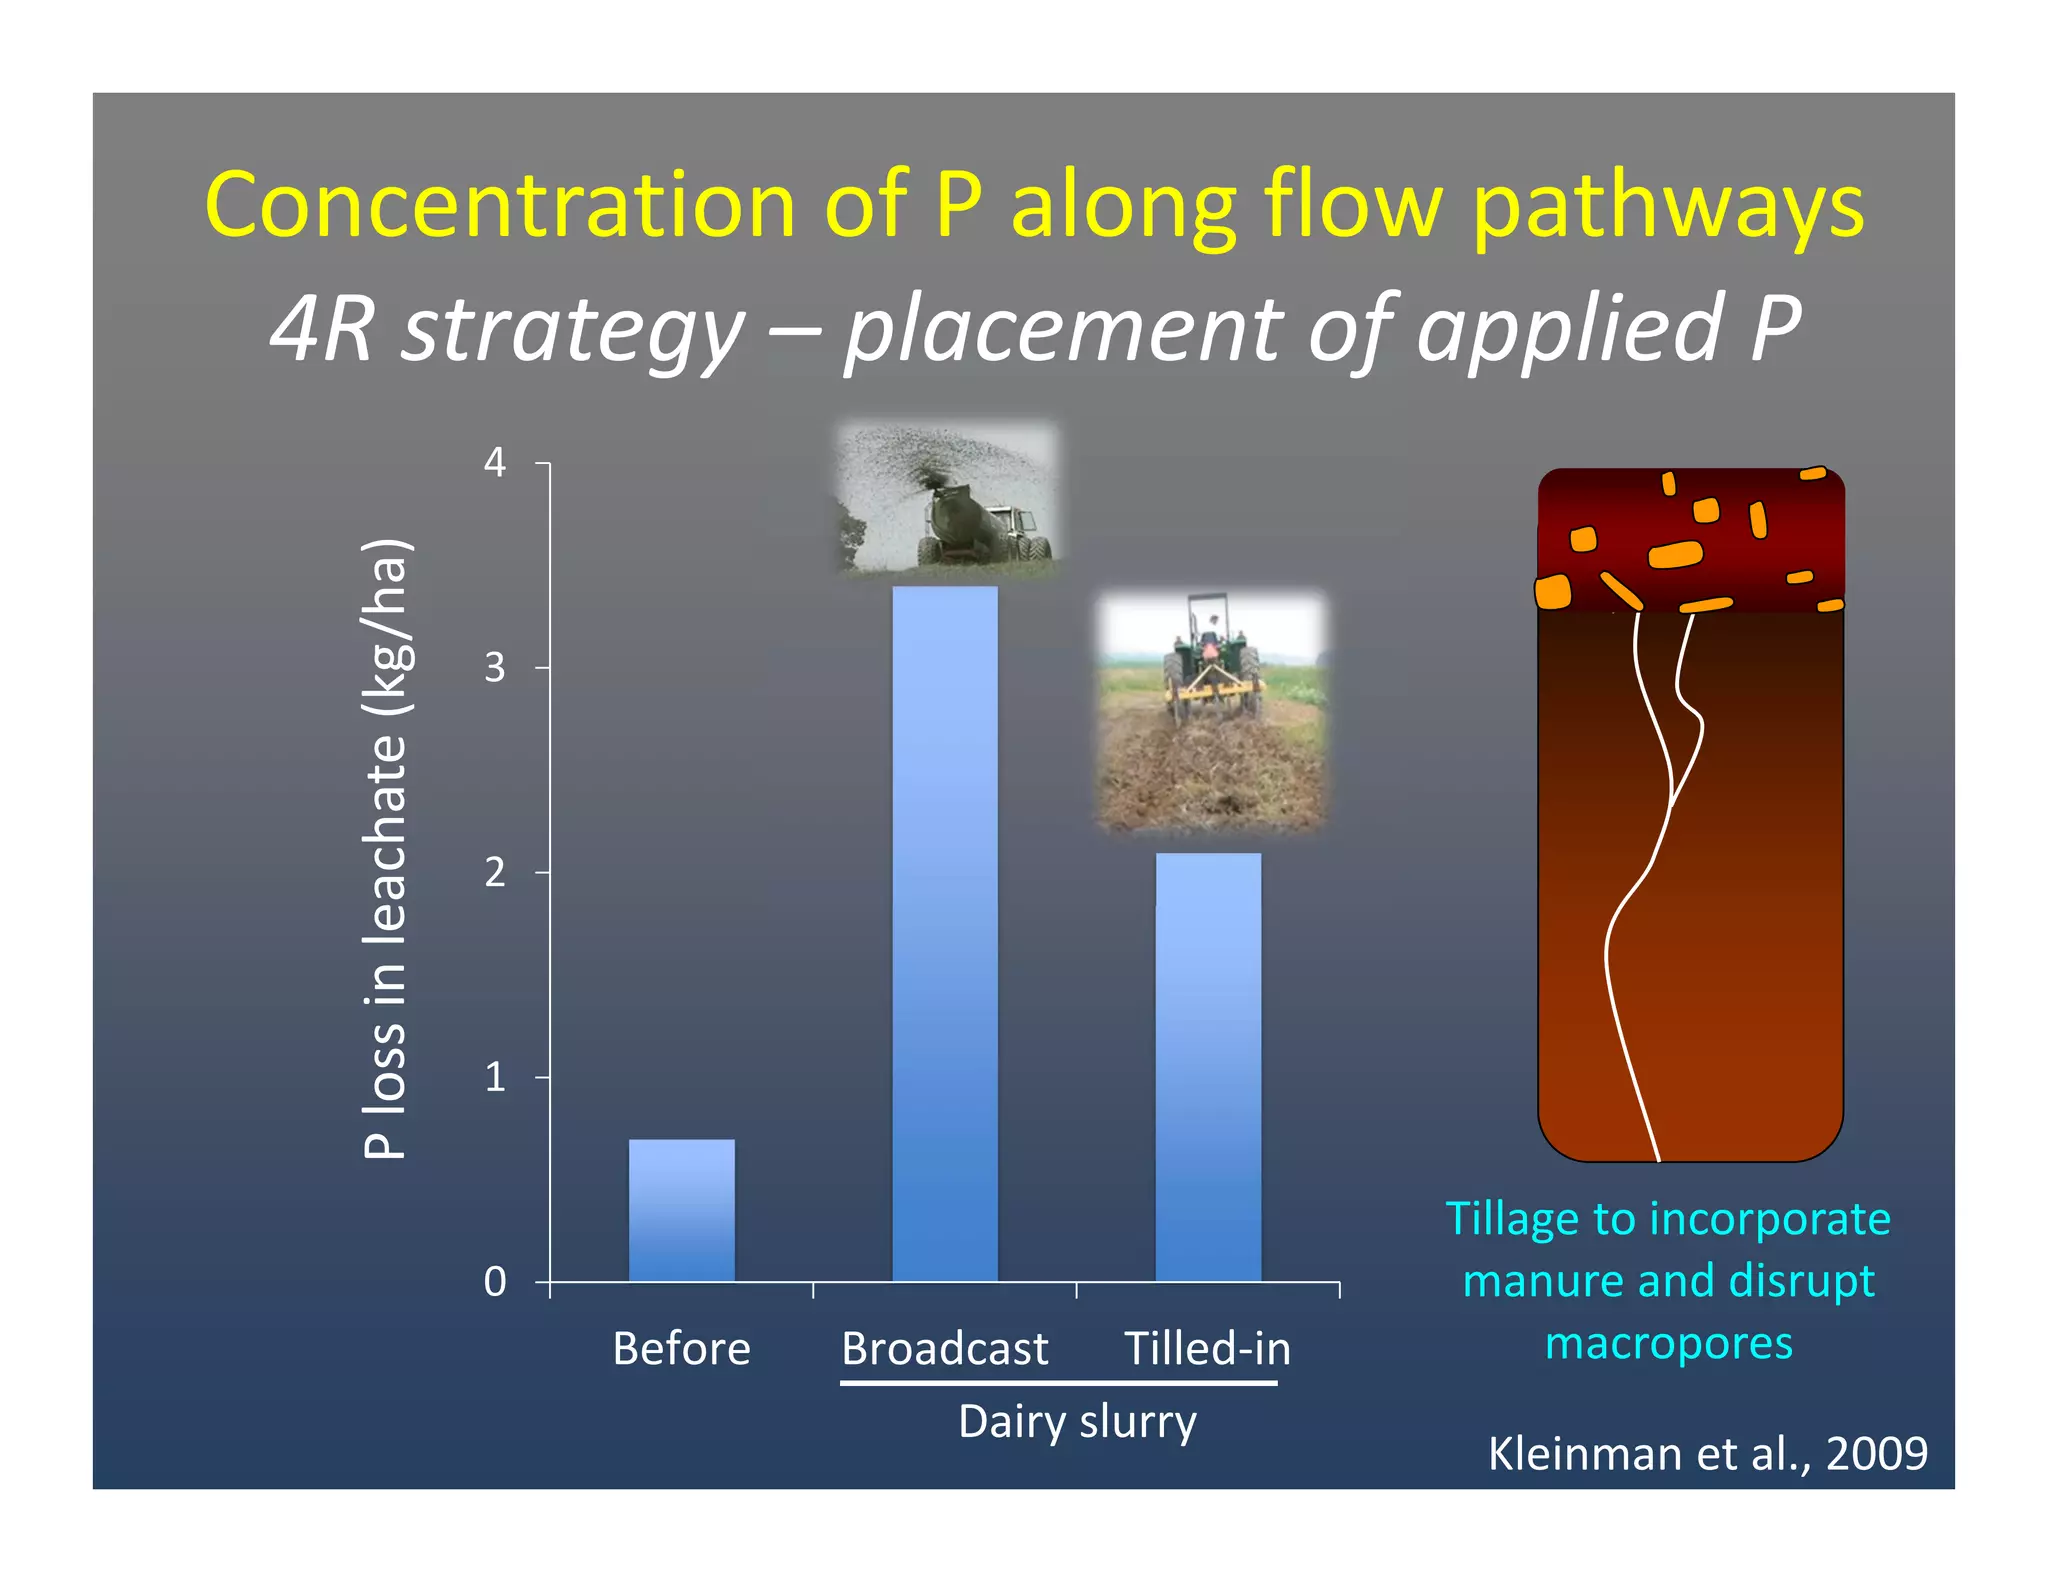
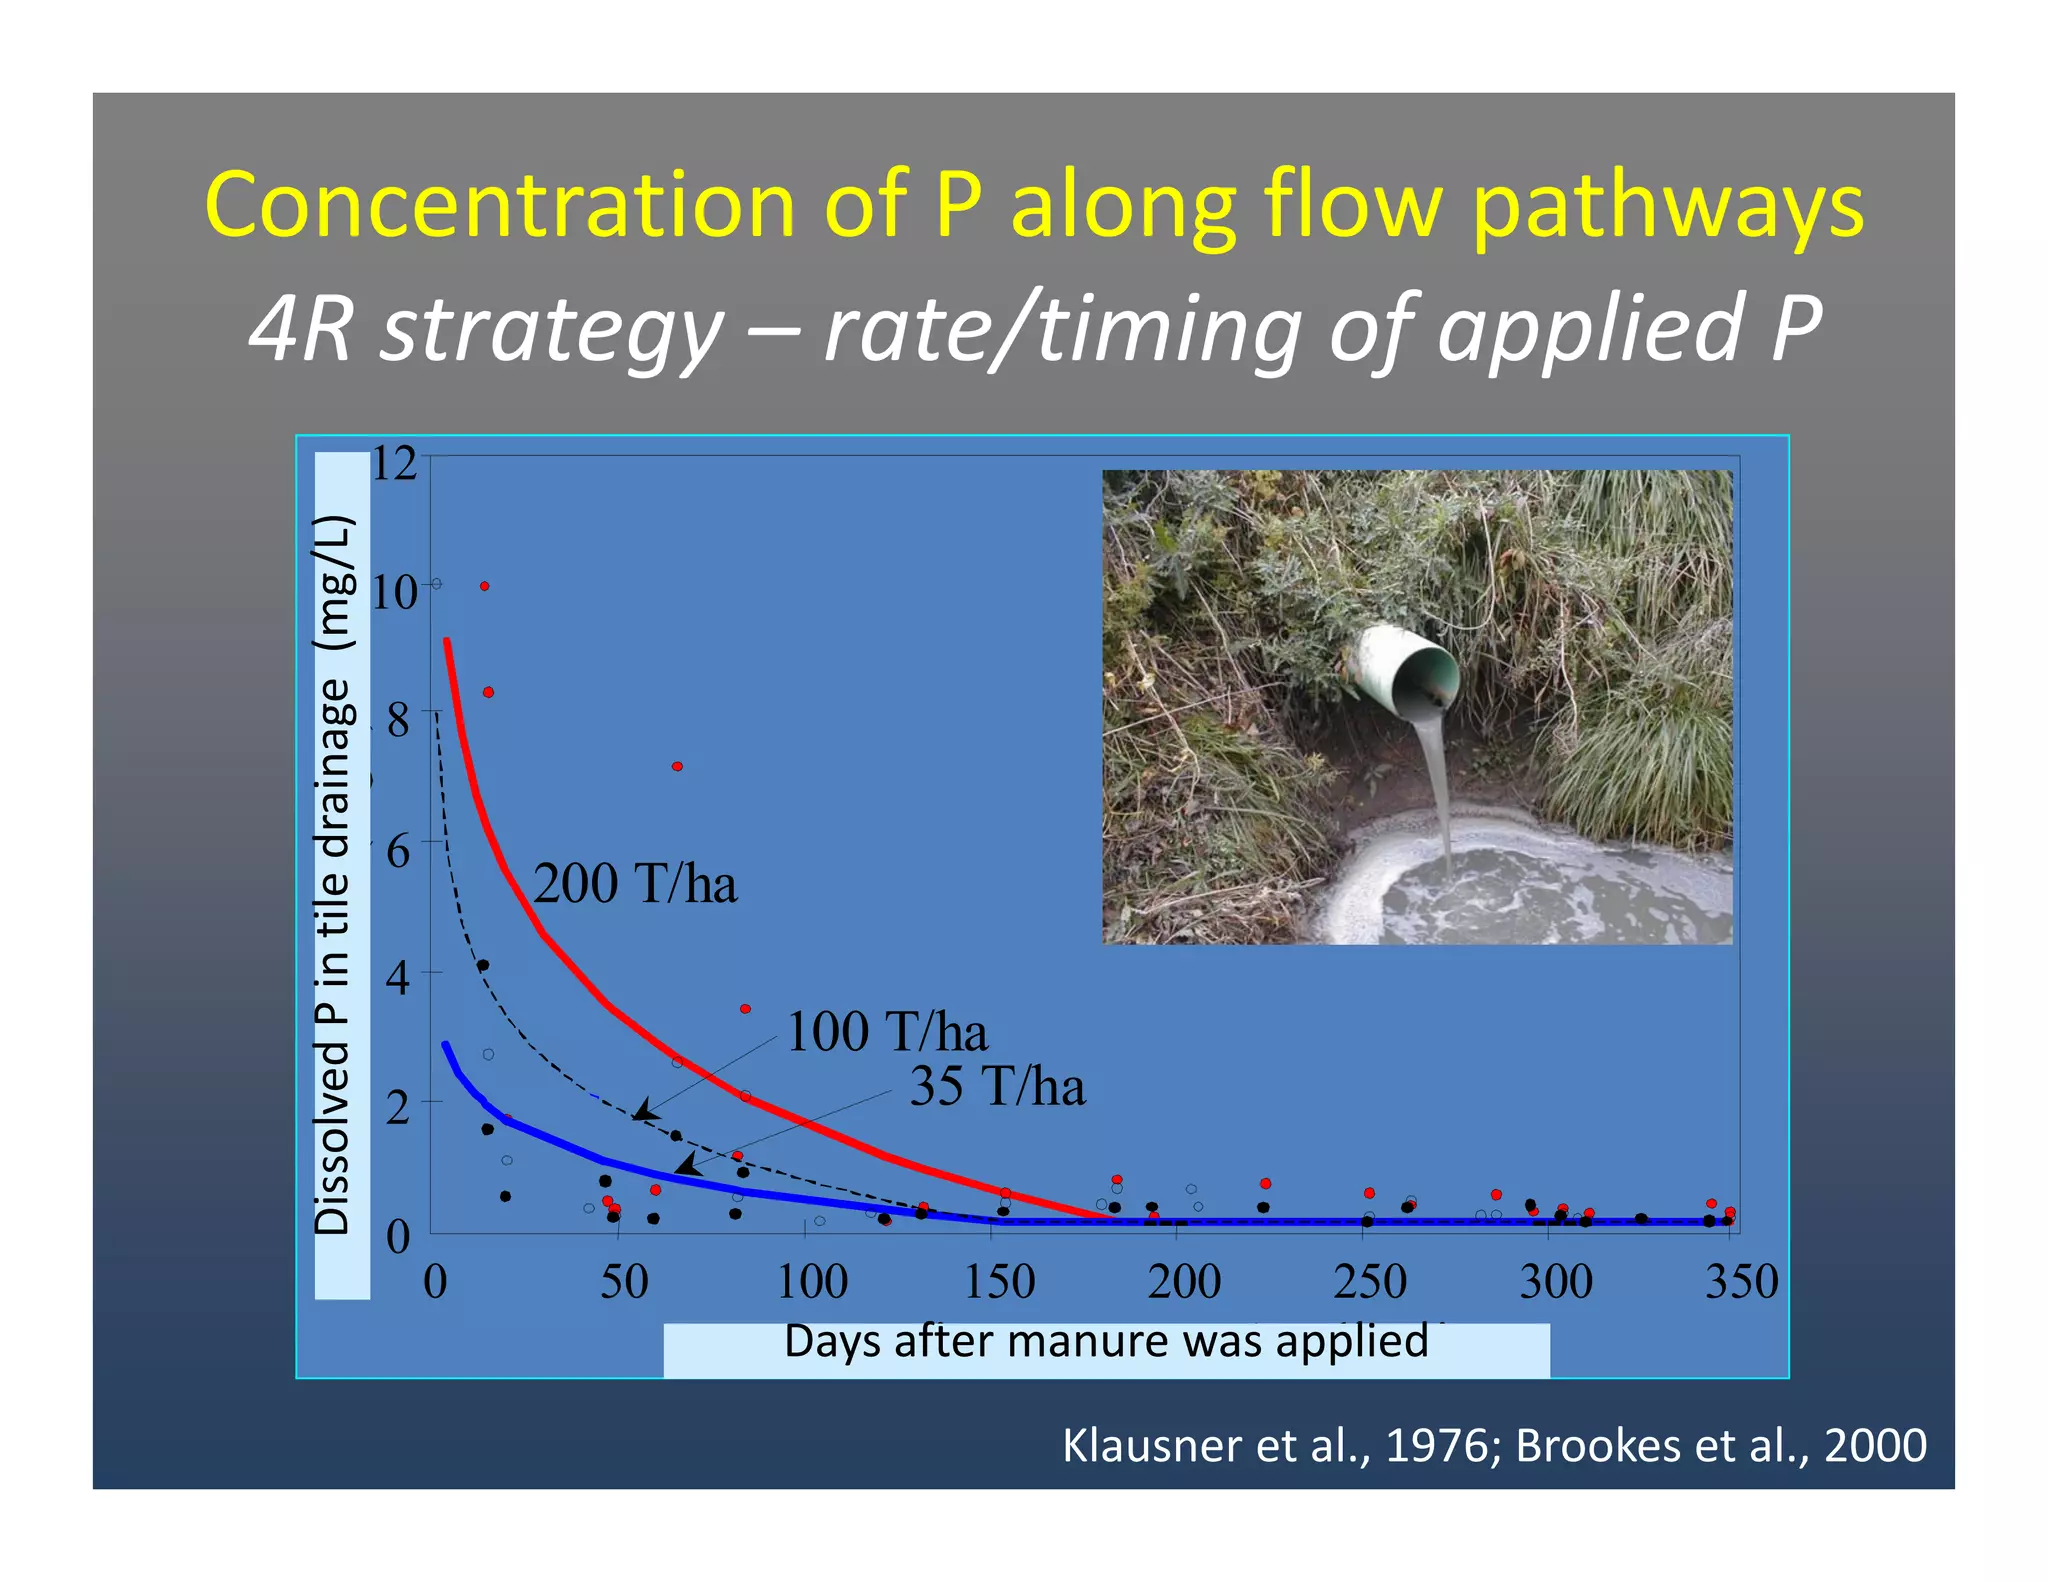
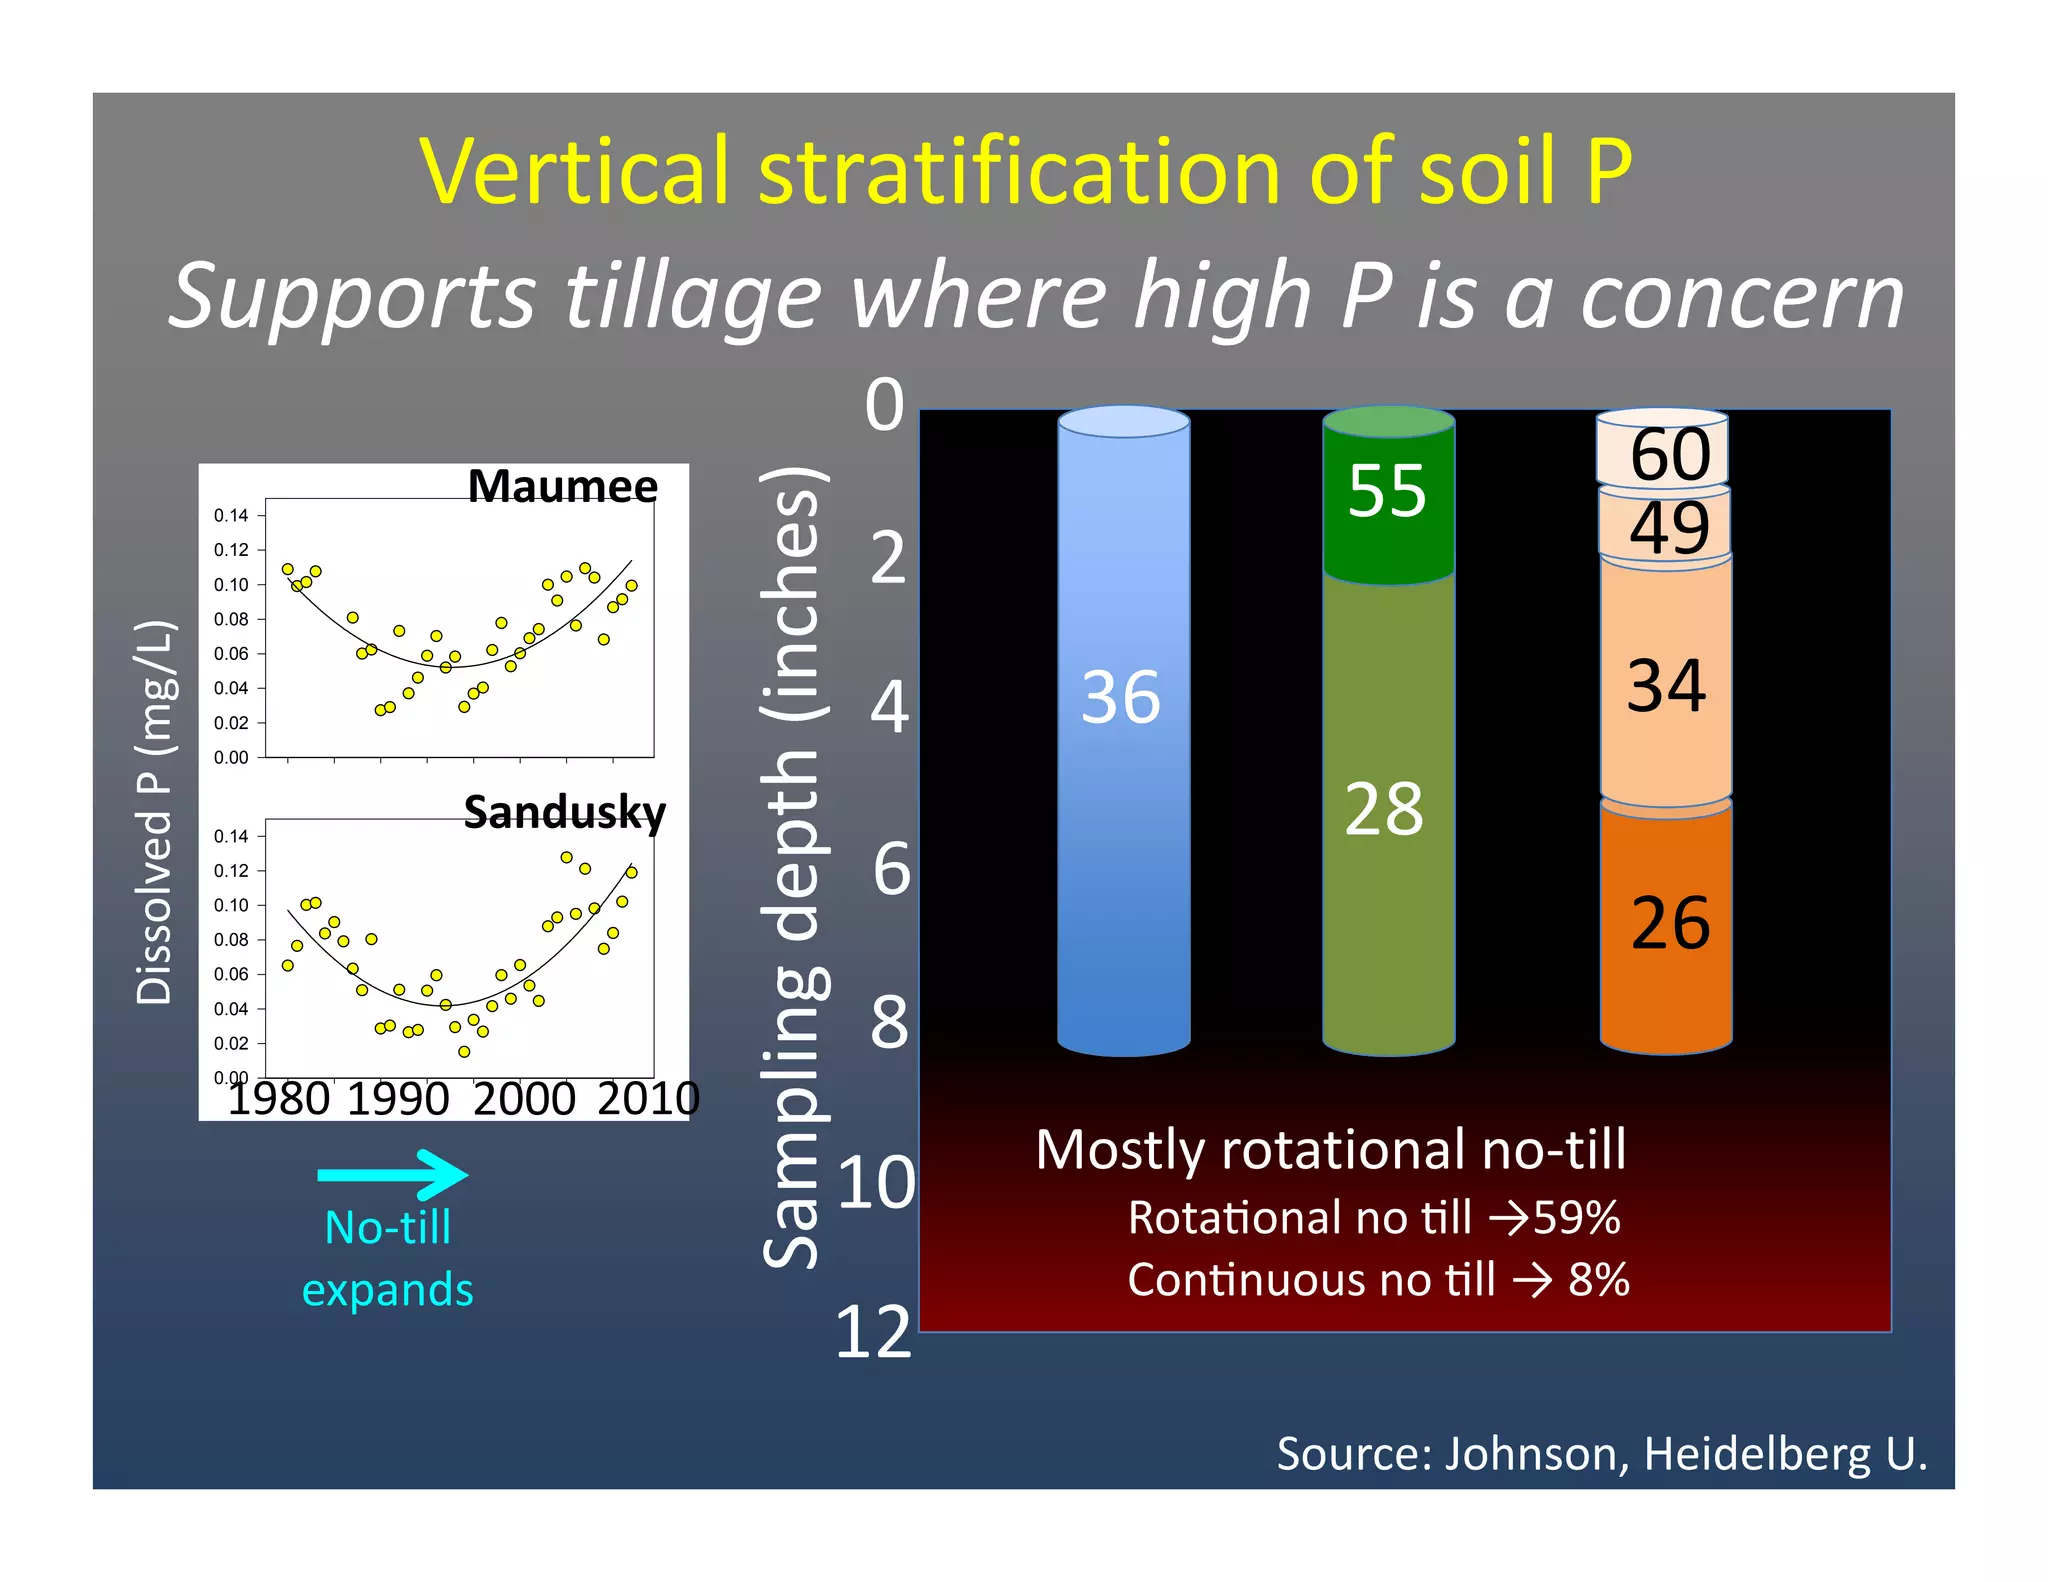
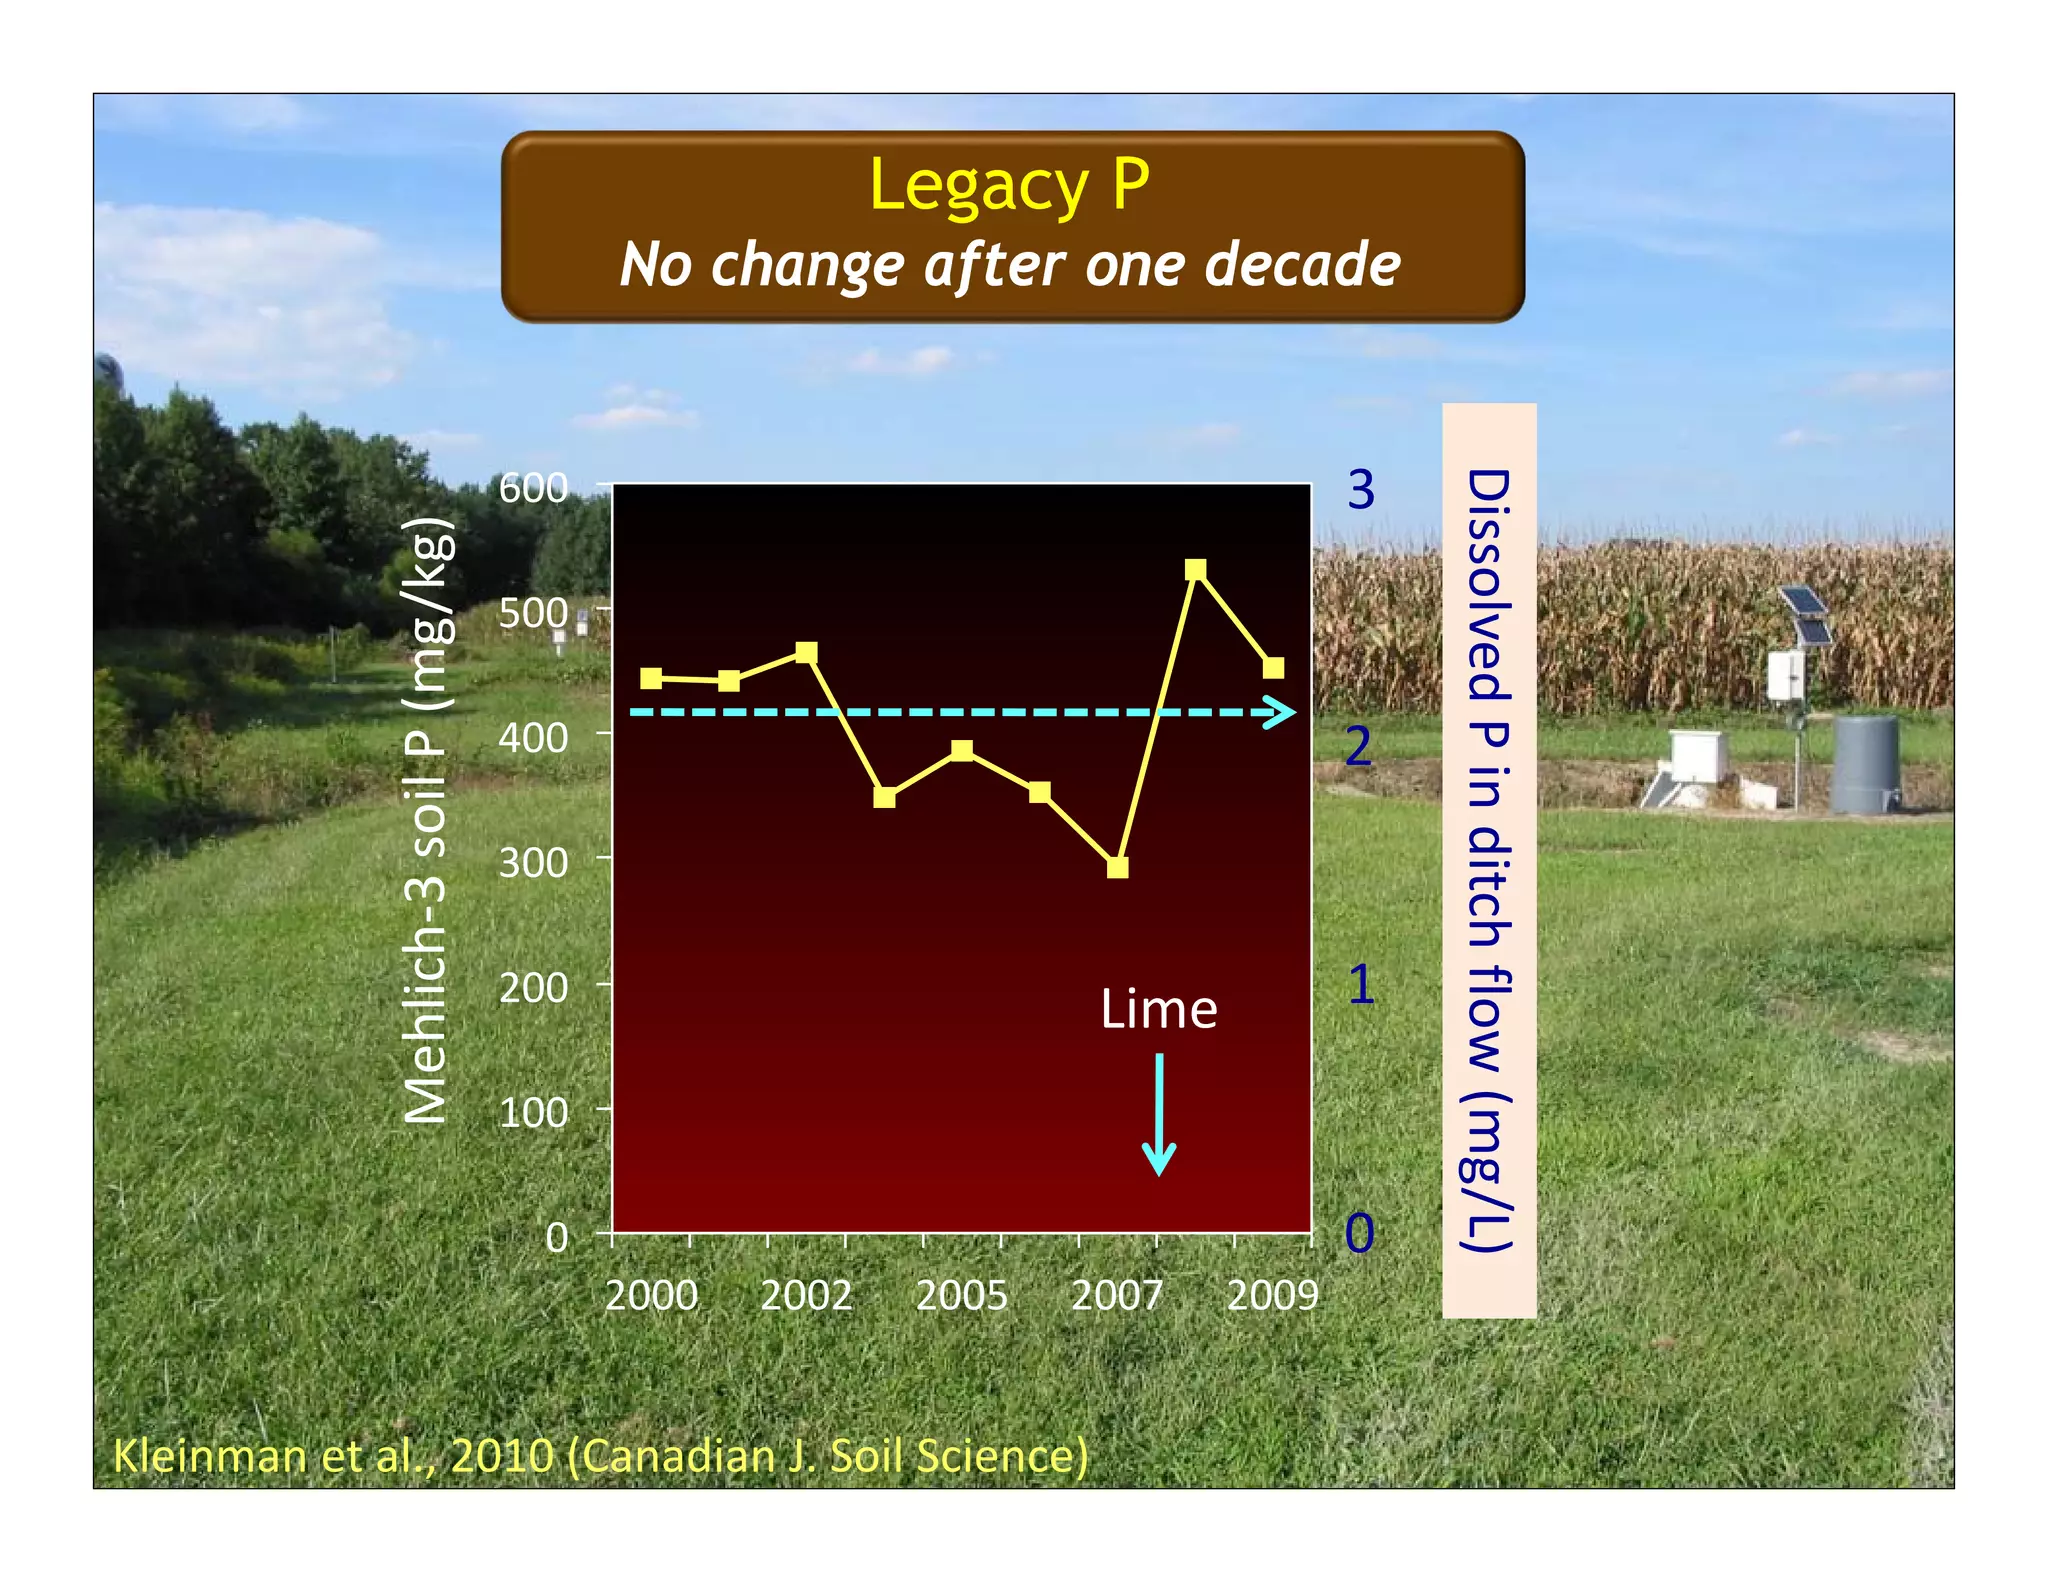
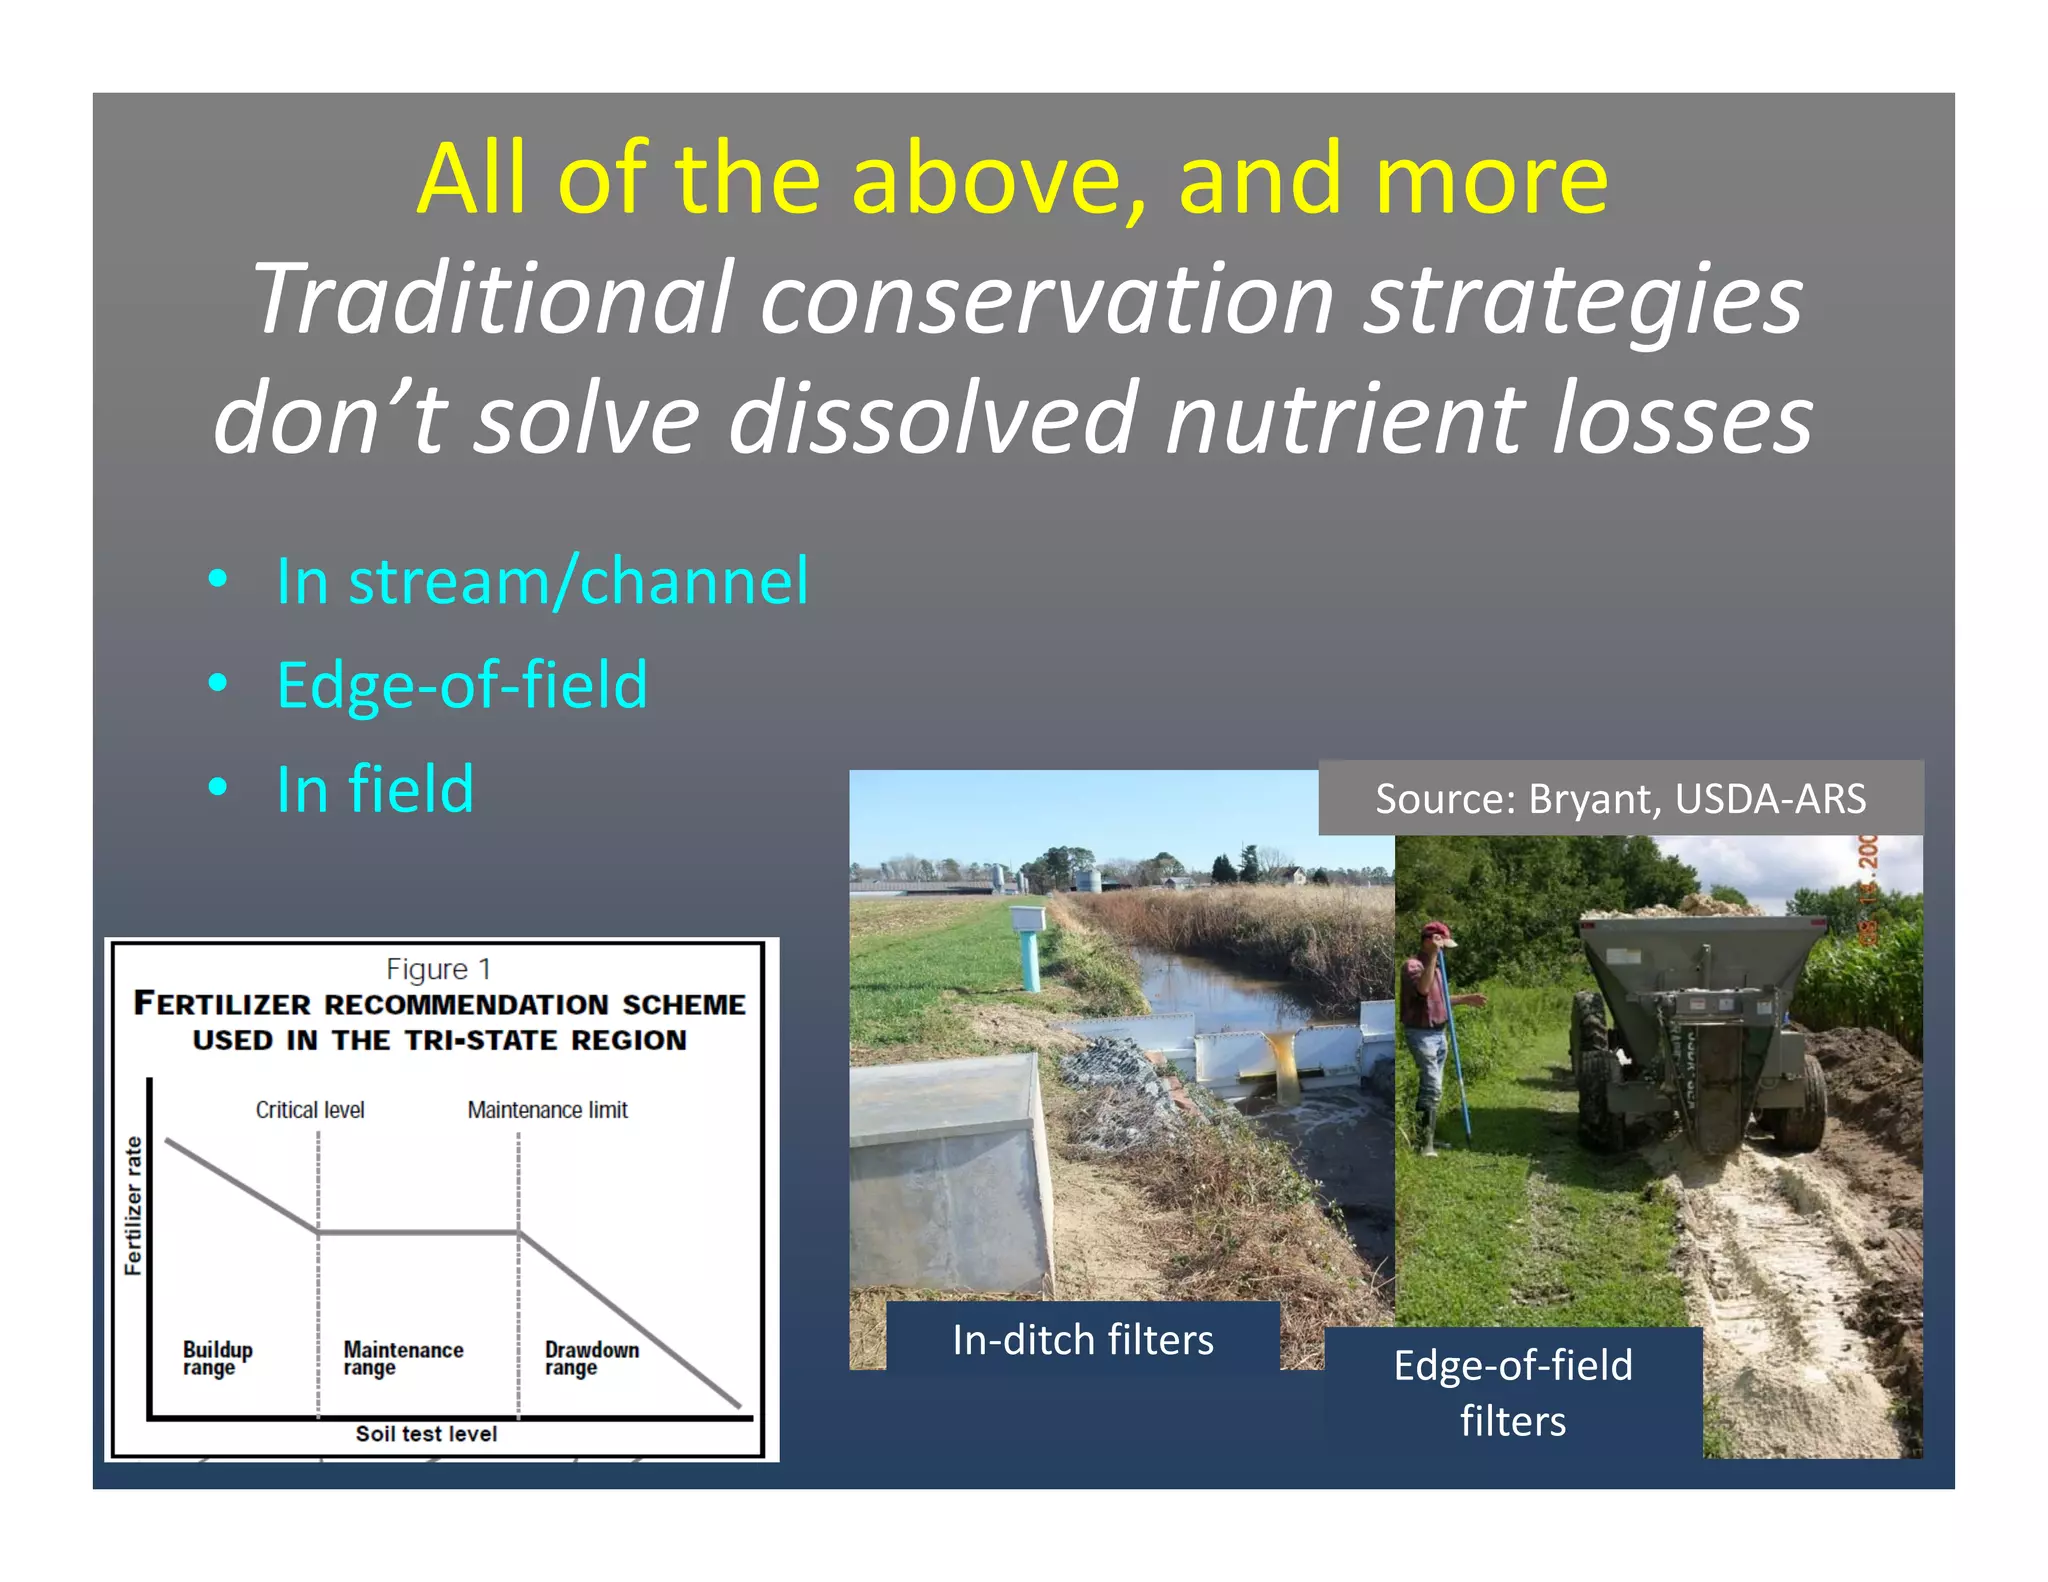
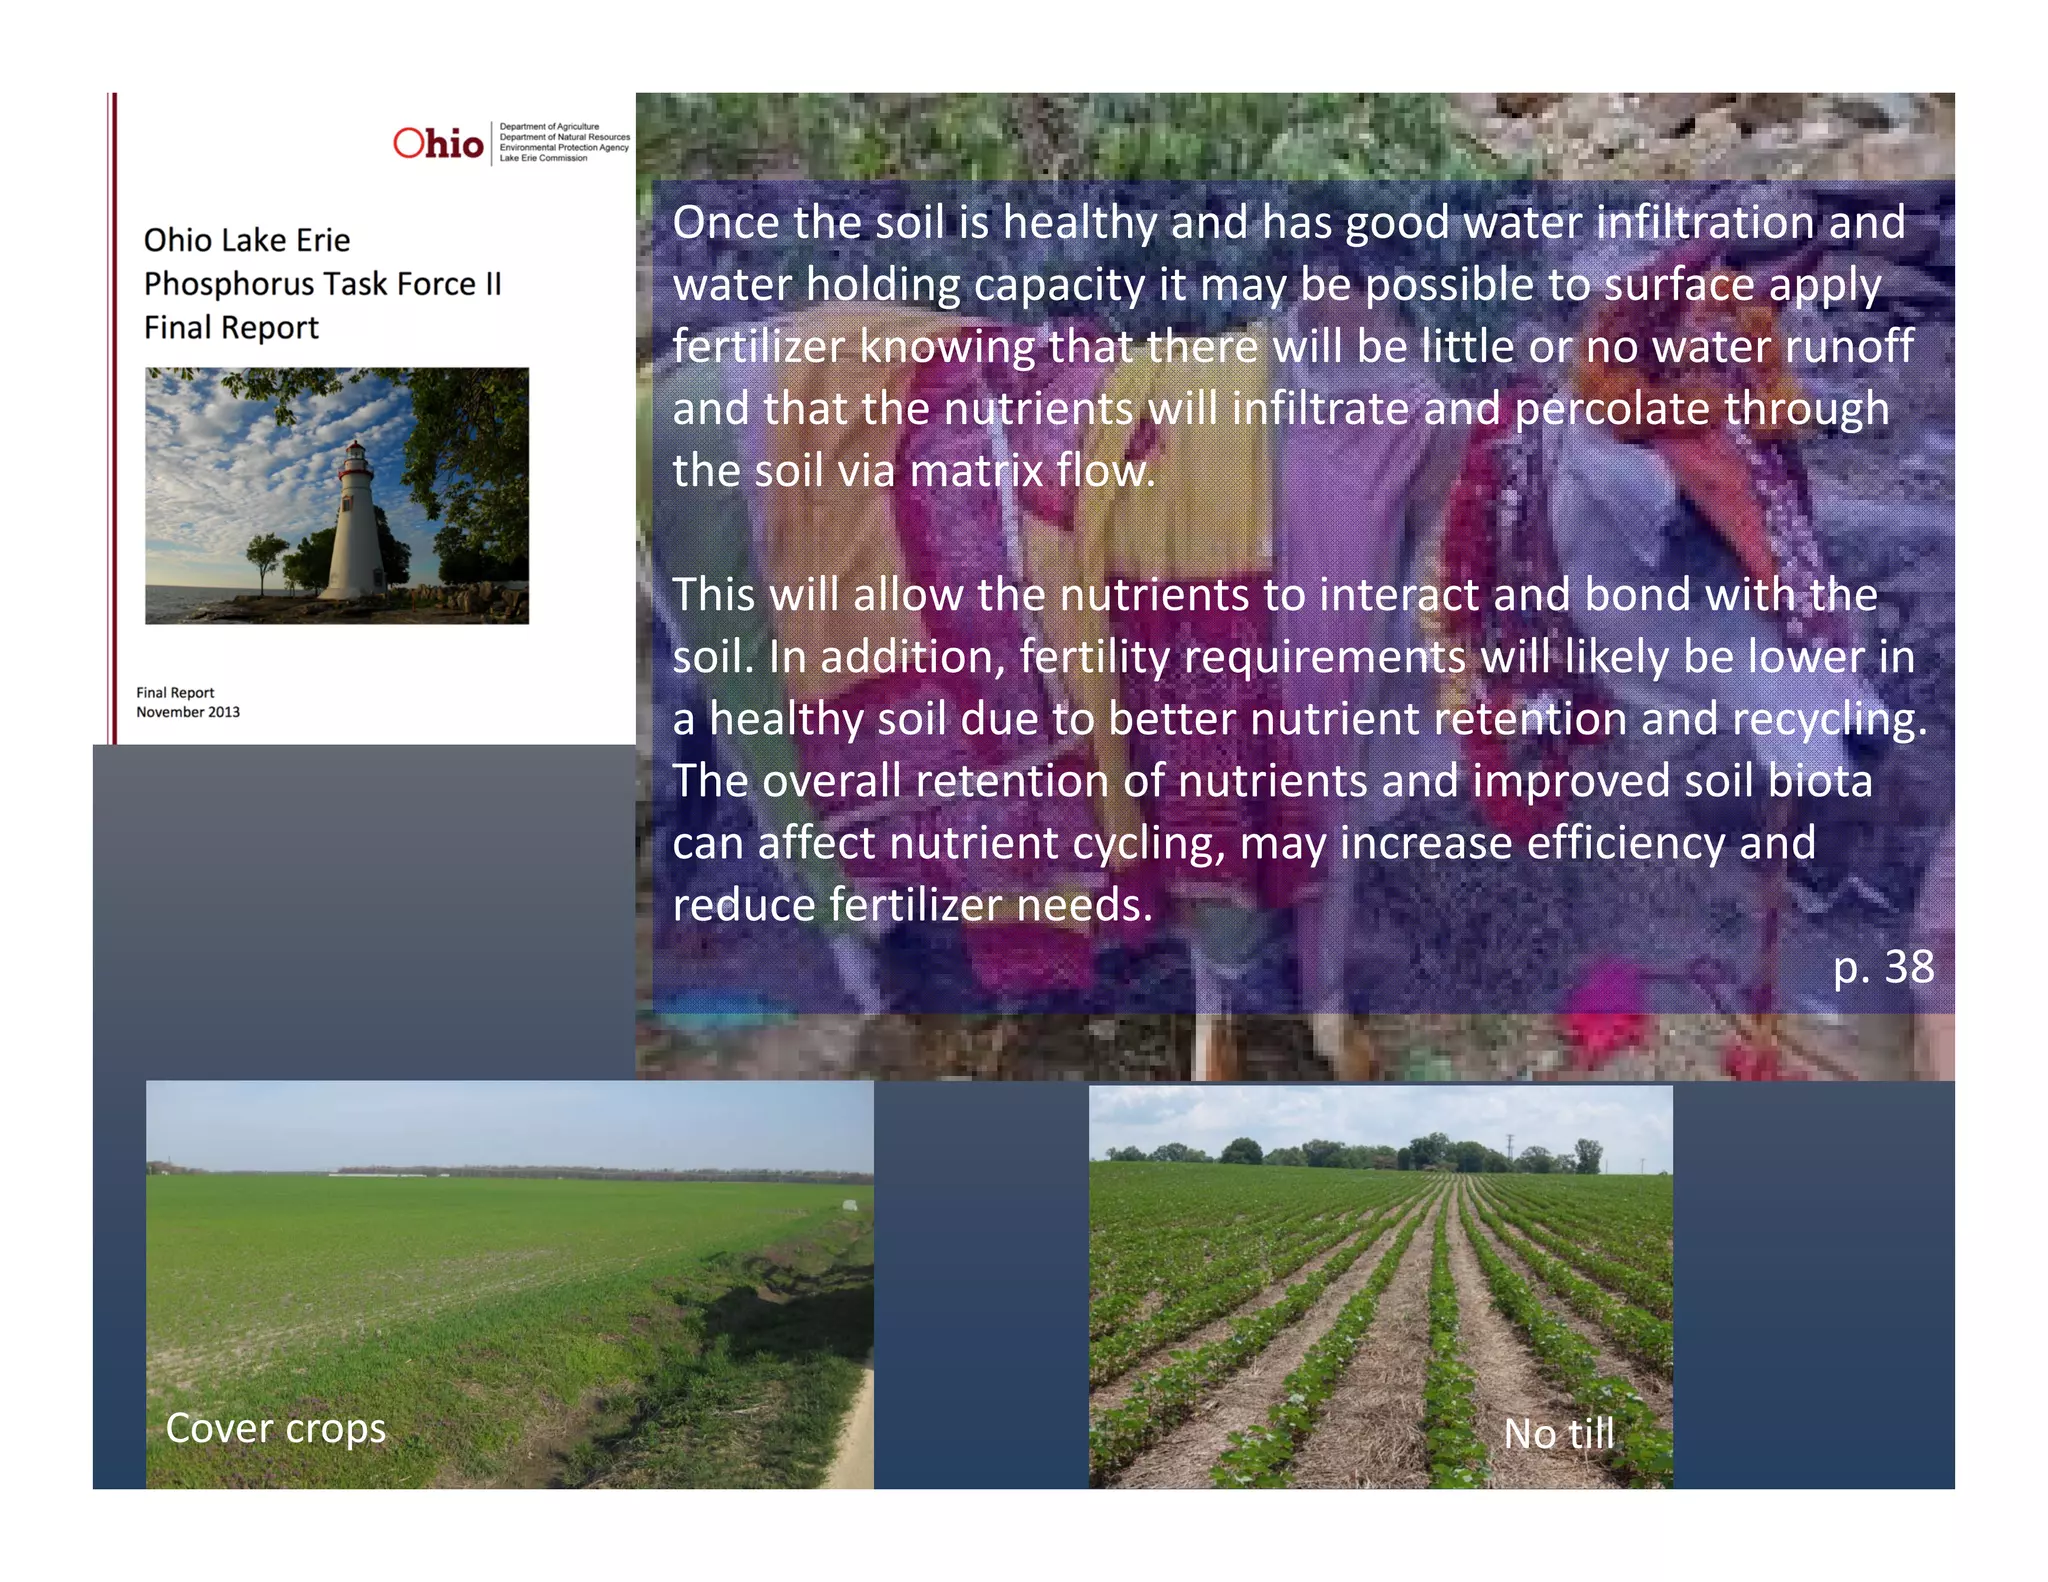

The document discusses the impact of agricultural phosphorus on eutrophication in Western Lake Erie, highlighting sources of phosphorus and the resulting harmful algal blooms. It emphasizes the importance of managing phosphorus sources and transport mechanisms through various conservation strategies to mitigate nutrient loss. The findings suggest that improving soil health can enhance nutrient retention and reduce the need for fertilizers.


![Pollution.ppt [Autosaved].ppt yogesh kumbhar](https://cdn.slidesharecdn.com/ss_thumbnails/pollution-251205194856-d30cfee8-thumbnail.jpg?width=640&height=640&fit=bounds)


