👉Chandigarh Call Girls 👉9878799926👉Just Call👉Chandigarh Call Girl In Chandiga...
Weekly Market Report
1. Market Review and Outlook
QE Index and Volume
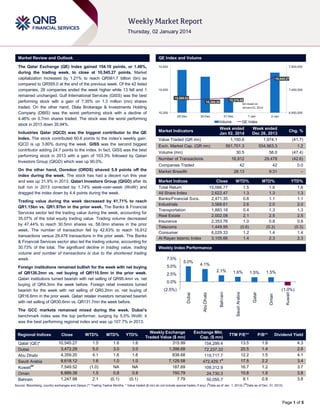
The Qatar Exchange (QE) Index gained 154.10 points, or 1.48%,
during the trading week, to close at 10,545.27 points. Market
capitalization increased by 1.21% to reach QR561.7 billion (bn) as
compared to QR555.0 at the end of the previous week. Of the 42 listed
companies, 28 companies ended the week higher while 13 fell and 1
remained unchanged. Gulf International Services (GISS) was the best
performing stock with a gain of 7.35% on 1.3 million (mn) shares
traded. On the other hand, Dlala Brokerage & Investments Holding
Company (DBIS) was the worst performing stock with a decline of
4.46% on 0.7mn shares traded. The stock was the worst performing
stock in 2013 down 35.94%.
10,650
7,900,000
10,545.27
10,450
7,400,000
10,360.02
10,379.59
QE closed on
January 01, 2014
10,368.20
10,250
6,900,000
29-Dec
30-Dec
31-Dec
Volume
On the other hand, Ooredoo (ORDS) shaved 5.9 points off the
index during the week. The stock has had a decent run this year
and was up 31.9% in 2013. Qatari Investors Group (QIGD) after its
bull run in 2013 corrected by 1.74% week-over-week (WoW) and
dragged the index down by 4.4 points during the week.
Week ended
Dec 26, 2013
1,974.1
561,701.3
554,963.3
1.2
58.0
(47.4)
16,912
29,478
(42.6)
42
42
0.0
28:13
9:31
–
Market Breadth
Value Traded (QR mn)
Exch. Market Cap. (QR mn)
Volume (mn)
Number of Transactions
Companies Traded
Market Indices
Close
Total Return
15,066.77
All Share Index
2,622.47
Banks/Financial Svcs.
2,471.35
Industrials
3,568.61
Transportation
1,883.18
Real Estate
2,002.08
Insurance
2,353.76
Telecoms
1,449.95
Consumer
6,029.33
Al Rayan Islamic Index
3,105.66
Market Indices
Weekly Index Performance
5.0%
5.0%
Qatar (QE)*
Dubai
Abu Dhabi
Saudi Arabia
Kuwait##
Oman
Bahrain
Close
10,545.27
3,472.29
4,359.20
8,618.12
7,549.52
6,889.38
1,247.98
WTD%
MTD%
YTD%
1.5
5.0
4.1
1.6
(1.0)
1.5
2.1
1.6
3.0
1.6
1.0
NA
0.8
(0.1)
1.6
3.0
1.6
1.0
NA
0.8
(0.1)
(41.7)
MTD%
1.6
1.3
1.1
2.0
1.3
2.5
0.8
(0.3)
1.4
2.3
YTD%
1.6
1.3
1.1
2.0
1.3
2.5
0.8
(0.3)
1.4
2.3
2.1%
1.6%
1.5%
1.5%
0.0%
Weekly Exchange
Traded Value ($ mn)
315.99
1,398.68
838.68
7,129.58
187.69
150.79
7.79
#
Kuwait
Oman
Qatar
Bahrain
Abu Dhabi
Exchange Mkt.
Cap. ($ mn)
154,299.4
72,237.33
119,717.7
472,429.1#
109,312.9
24,730.3
50,055.7
Saudi Arabia
(1.0%)
(2.5%)
The GCC markets remained mixed during the week. Dubai’s
benchmark index was the top performer, surging by 5.0% WoW; it
was the best performing regional index and was up 107.7% in 2013.
Regional Indices
WTD%
1.5
1.3
0.8
2.6
0.4
2.1
1.0
(0.6)
1.2
1.4
Chg. %
4.1%
2.5%
Dubai
Foreign institutions remained bullish for the week with net buying
of QR126.2mn vs. net buying of QR110.5mn in the prior week.
Qatari institutions turned bearish with net selling of QR95.4mn vs. net
buying of QR4.3mn the week before. Foreign retail investors turned
bearish for the week with net selling of QR0.2mn vs. net buying of
QR16.6mn in the prior week. Qatari retailer investors remained bearish
with net selling of QR30.6mn vs. QR131.7mn the week before.
QE Index
Week ended
Jan 02, 2014
1,150.6
Market Indicators
7.5%
2-Jan
30.5
Industries Qatar (IQCD) was the biggest contributor to the QE
Index. The stock contributed 60.6 points to the index‟s weekly gain.
IQCD is up 3.80% during the week. GISS was the second biggest
contributor adding 24.7 points to the index. In fact, GISS was the best
performing stock in 2013 with a gain of 103.3% followed by Qatari
Investors Group (QIGD) which was up 90.0%.
Trading value during the week decreased by 41.71% to reach
QR1.15bn vs. QR1.97bn in the prior week. The Banks & Financial
Services sector led the trading value during the week, accounting for
35.07% of the total equity trading value. Trading volume decreased
by 47.44% to reach 30.5mn shares vs. 58.0mn shares in the prior
week. The number of transaction fell by 42.63% to reach 16,912
transactions versus 29,478 transactions in the prior week. The Banks
& Financial Services sector also led the trading volume, accounting for
30.73% of the total. The significant decline in trading value, trading
volume and number of transactions is due to the shortened trading
week.
1-Jan
TTM P/E**
P/B**
Dividend Yield
13.5
20.5
12.2
17.5
16.7
10.8
8.1
1.8
1.4
1.5
2.2
1.2
1.6
0.9
4.3
2.6
4.1
3.4
3.7
3.8
3.8
##
Source: Bloomberg, country exchanges and Zawya (** Trailing Twelve Months; * Value traded ($ mn) do not include special trades, if any) ( Data as of Jan. 1, 2014) ( Data as of Dec. 31, 2013)
Page 1 of 5
2. News
Economic News
Qatar’s GDP growth accelerates to 6.2% YoY in 3Q2013 –
The Ministry of Development Planning and Statistics (MDPS)
said that Qatar's GDP growth, adjusted for inflation, accelerated
to 6.2% YoY in 3Q2013 from a revised 5.7% in 2Q2013. The
MDPS figures suggested that output in the mining & quarrying
sector, which includes oil & gas production and accounts for
more than 40% of the country‟s GDP, grew 3.5% QoQ (+1.8%
YoY) in 3Q2013. Meanwhile, the financial and real estate sector
jumped to 10.5% YoY, while the construction sector expanded
to 13.0% on the back of government spending on infrastructure
projects. (Gulf-Times.com)
MDPS: Qatar trade surplus drops 4% in November 2013 as
imports jump – According to the preliminary estimates of the
Ministry of Development Planning & Statistics (MDPS), Qatar‟s
trade surplus fell more than 4% YoY to QR30.88bn in
November 2013, as its imports witnessed double-digit growth
while exports fell. The country‟s total exports were down 0.9%
to QR39.83bn despite a 96% surge in shipments to China.
Japan continued to be the top destination of Qatar‟s exports,
followed by South Korea, India, China and Singapore.
However, Qatar‟s re-exports surged 70.3% to QR625mn during
the review period. The country‟s exports of domestic products
fell 1.5% to QR39.21bn in November mainly on lower
shipments of crude products and other commodities. Petroleum
gases and other gaseous hydrocarbons constituted 60.95% of
total exports in November 2013 as compared to 60.6% in
November 2012; while crude petroleum oils constituted 19.28%
(19.61%); non-crude petroleum oils and bituminous minerals
6.32% (5.68%) and other commodities 13.41% (14.14%). (GulfTimes.com)
MDPS: 208,000 expats came to Qatar in 2013 – According to
the data released by the Ministry of Development Planning &
Statistics (MDPS), a record high number of around 208,000
foreign workers, including family members, arrived in the
country last year. The figure should be higher considering that
around 23,000 people left the country last month. A vast
majority of these people could have travelled overseas on
winter holiday break, as over 18,500 of them were women. The
country‟s population stood at 2.04mn on December 31, 2013 as
against 1.83mn by 2012-end. (Peninsula Qatar)
Market & Corporate News
FLSmidth to supply cement production line to for Al Khalij
Cement – Denmark-based FLSmidth & Company has received
an order worth 515m Danish krone from Al Khalij Cement
Company for the supply of a complete cement production line
at the company‟s plant in Umm Bab. This production line will be
similar to the existing line, which was supplied by FLSmidth in
2007. This production line is being supplied in cooperation with
CNBM International Engineering, which is part of China
National Building Materials (CNBM). (Bloomberg)
Ooredoo Maldives expands 3G+ coverage – Ooredoo
(ORDS) Maldives has announced the expansion of its 3G+
network across the island nation. First launched on eight
islands, Ooredoo Maldives‟ service is expected to reach at least
28 islands by the year-end. The telecom operator said that the
coverage is now available on 166 islands. It aims to cover 84%
of the population by year-end. (Bloomberg)
Barwa Bank participates in finance facility for QPI unit –
Barwa Bank has announced its participation of $123mn in a
finance facility for Qatar Petroleum International Upstream
OPC, a fully owned subsidiary of Qatar Petroleum International
Limited (QPI). This facility will be utilized to part finance Qatar
Petroleum International Upstream OPC for its investment in
Total‟s operations in Congo. The investment is through a share
capital increase in Total E&P Congo resulting in QPI holding a
15% share of the company. (Gulf-Times.com)
GDI to become a wholly owned subsidiary of GISS – Gulf
International Services (GISS) has entered into discussions with
the foreign partner in its joint venture, Gulf Drilling International
(GDI), regarding the acquisition of its 30% stake in the capital of
GDI in order for GDI to become a wholly owned subsidiary of
Gulf International Services. (Company Press Release)
QNBK’s BoD to meet on January 14 – QNB Group (QNBK)
announced that its board of directors will hold a meeting on
January 14, 2014 to discuss the company‟s financial results for
the period ending on December 31, 2013. (QE)
ABQK BoD to meet on January 15 to discuss financial
results – Ahli Bank‟s (ABQK) board of directors will meet on
January 15, 2014 to discuss the financial results for the period
ending December 31, 2013. Moreover, the board will discuss
the proposal of profit distribution for FY2013 as well as to elect
the bank‟s BoD. (QE)
QPI takes 15% stake in Total E&P Congo – France-based oil
major Total said that Qatar Petroleum International (QPI) has
purchased a 15% stake in Total E&P Congo through a share
capital increase following a framework agreement signed in
May. Total said that the $1.6bn increase of Total E&P Congo's
capital will consolidate its financial capacity at a time when the
development of the Moho Nord deep offshore project is
progressing. This deal is part of a wider agreement signed by
the two companies in March 2010 to cooperate on their projects
in Africa. (Peninsula Qatar)
MARK’s BoD to meet on January 27 – Masraf Al Rayan
(MARK) announced that its board of directors will hold a
meeting on January 27, 2014 to discuss the company‟s
financial results for the period ending on December 31, 2013.
(QE)
DHBK takes part in QPI arm’s loan deal – Doha Bank
(DHBK) has announced its participation of $123mn in a loan
deal for Qatar Petroleum International Upstream OPC, a fully
owned subsidiary of Qatar Petroleum International (QPI). The
loan will be utilized to part finance Qatar Petroleum
International Upstream OPC for its investment in Total‟s
operations in Congo. The investment is through a share capital
increase in Total E&P Congo resulting in QPI holding a 15%
share of the company. (Gulf-Times.com)
NLCS BoD to meet on January 16 to discuss financial
results – Alijarah Holding‟s (NLCS) board of directors will meet
on January 16, 2014 to discuss the financial results for the
period ending December 31, 2013. (QE)
QATI to hold general assembly meeting on February 16,
2014 – Qatar Insurance Company‟s (QATI) board of directors
has agreed to hold its general assembly meeting on February
16, 2014. However, if the quorum is not completed, then the
meeting will be adjourned until February 25, 2014. (QE)
VFQS to announce 3Q2014 financial results on January 29
– Vodafone Qatar (VFQS) will announce its financial results for
the quarter ending December 31, 2013 on January 29, 2014.
(Qatar Tribune)
Page 2 of 5
3. Qatar Exchange
Top 5 Gainers
Top 5 Decliners
0.0%
8.0%
7.4%
-1.5%
6.0%
-1.9%
3.8%
4.0%
-3.0%
3.3%
3.1%
-3.2%
2.9%
-3.6%
2.0%
-4.5%
-4.1%
-4.5%
0.0%
Gulf
International
Services
Industries
Qatar
Qatar
Qatar German
International Co. for Medical
Islamic Bank
Devices
Qatar
Insurance
Source: Qatar Exchange (QE)
Dlala Holding Qatar General Widam Food
Insurance &
Co.
Reinsurance
Al Khaleej
Takaful
Insurance
Salam
International
Investment
2.0
2.0
Barwa Real
Estate
United
Development
Source: Qatar Exchange (QE)
Most Active Shares by Value (QR Million)
Most Active Shares by Volume (Million)
200.0
150.0
-6.0%
8.0
149.9
144.2
6.0
5.7
118.8
4.7
100.0
4.0
90.5
82.4
2.6
2.0
50.0
0.0
0.0
Vodafone Qatar
Masraf Al
Rayan
Industries
Qatar
Qatari
Investors
Group
QNB Group
Source: Qatar Exchange (QE)
20.28%
80%
Net Traded Value by Nationality (QR Million)
126
9.31%
14.46%
60%
Qatari
Investors
Group
Source: Qatar Exchange (QE)
Investor Trading Percentage to Total Value Traded
100%
Masraf Al
Rayan
Gulf
International
Services
26.65%
14.48%
274
400
34.94%
40%
20%
Non-Qatari
38.62%
41.28%
(126)
Qatari
877
751
0%
Buy
Sell
Qatari Individuals
Qatari Institutions
Non-Qatari Individuals
Non-Qatari Institutions
Source: Qatar Exchange (QE)
(200)
Net Investment
200
400
Total Sold
600
800
1,000
Total Bought
Source: Qatar Exchange (QE)
Page 3 of 5
4. TECHNICAL ANALYSIS OF THE QE INDEX
Source: Bloomberg
The index started the week on a weak note, but ended on a high, as it jumped 1.6% on Thursday, to start the year on a strong note. The index gained 1.5%
during the week to close at 10,545.27, registering a new 52-week high. The index tested its strong support level of 10,316 on couple of occasions during the
week, but held on to finally bounce back strongly. The index has closed above the 21-day moving average (currently at 10,433.63), which is a bullish sign.
The index continued to tag higher highs and higher lows, indicating that the uptrend is intact. On the upside, the 10,560 level remains a strong resistance
level for the index. The RSI has moved higher after today‟s surge, while the MACD has converged with the signal line. The index will have to hold above the
21-day moving average to sustain its uptrend, a move below which may indicate a trend reversal.
DEFINITIONS OF KEY TERMS USED IN TECHNICAL ANALYSIS
RSI (Relative Strength Index) indicator – RSI is a momentum oscillator that measures the speed and change of price movements. The RSI oscillates
between 0 to 100. The index is deemed to be overbought once the RSI approaches the 70 level, indicating that a correction is likely. On the other hand, if
the RSI approaches 30, it is an indication that the index may be getting oversold and therefore likely to bounce back.
MACD (Moving Average Convergence Divergence) indicator – The indicator consists of the MACD line and a signal line. The divergence or the
convergence of the MACD line with the signal line indicates the strength in the momentum during the uptrend or downtrend, as the case may be. When the
MACD crosses the signal line from below and trades above it, it gives a positive indication. The reverse is the situation for a bearish trend.
Candlestick chart – A candlestick chart is a price chart that displays the high, low, open, and close for a security. The „body‟ of the chart is portion between
the open and close price, while the high and low intraday movements form the „shadow‟. The candlestick may represent any time frame. We use a one-day
candlestick chart (every candlestick represents one trading day) in our analysis.
Doji candlestick pattern – A Doji candlestick is formed when a security's open and close are practically equal. The pattern indicates indecisiveness, and
based on preceding price actions and future confirmation, may indicate a bullish or bearish trend reversal.
Shooting Star/Inverted Hammer candlestick patterns – These candlestick patterns have a small real body (open price and close price are near to each
other), and a long upper shadow (large intraday movement on the upside). The Shooting Star is a bearish reversal pattern that forms after a rally. The
Inverted Hammer looks exactly like a Shooting Star, but forms after a downtrend. Inverted Hammers represent a potential bullish trend reversal.
Page 4 of 5
5. Company Name
Price % Change 5(Jan 2)
Day
% Change
YTD
Market Cap.
QR Million
TTM P/E
P/B
Div. Yield
Qatar National Bank
173.00
0.17
0.58
121,053
13.1
2.4
3.5
Qatar Islamic Bank
69.80
1.16
1.16
16,493
15.3
1.4
5.4
Commercial Bank of Qatar
70.90
0.85
0.14
17,544
10.0
1.3
8.5
Doha Bank
58.80
1.38
1.03
15,192
10.3
1.7
7.1
Al Ahli Bank
55.00
(1.79)
0.00
6,989
13.5
2.0
5.5
Qatar International Islamic Bank
62.20
3.32
0.81
9,415
13.1
1.9
5.6
Masraf Al Rayan
32.55
1.88
3.99
24,413
14.6
2.4
3.1
Al Khaliji Bank
19.98
0.91
(0.05)
7,193
13.5
1.3
5.0
National Leasing
30.10
0.33
(0.17)
1,489
12.7
1.2
6.6
Dlala Holding
22.07
(4.46)
(0.14)
490
N/M
2.2
N/A
Qatar & Oman Investment
12.79
1.35
2.16
403
26.8
1.2
3.9
Islamic Holding Group
45.00
2.27
(2.17)
180
24.2
3.1
2.5
220,854
Banking and Financial Services
Zad Holding
69.00
0.73
(0.72)
903
9.2
0.7
5.8
Qatar German Co. for Medical Devices
14.13
3.14
2.02
163
N/M
0.9
N/A
Salam International Investment
13.10
(1.87)
0.69
1,498
11.6
0.9
5.3
Medicare Group
53.60
1.90
2.10
1,509
24.5
1.9
3.4
Qatar Cinema & Film Distribution
40.15
(0.12)
0.12
229
N/M
1.7
5.0
1.76
1.72
18,776
15.7
3.1
3.5
(3.56)
(0.39)
927
15.4
3.8
7.8
1.36
0.38
2,676
18.4
2.1
6.0
289.00
Qatar Fuel
51.50
Qatar Meat and Livestock
133.80
Al Meera Consumer Goods
26,680
Consumer Goods and Services
50.80
0.79
0.40
2,012
9.5
1.5
5.9
Qatar National Cement
119.00
1.28
0.00
5,843
13.7
2.4
5.0
Industries Qatar
172.30
3.80
2.01
104,242
12.8
3.2
4.5
48.05
(1.74)
9.95
5,974
25.6
2.8
1.6
179.50
(0.28)
(1.32)
17,950
11.9
3.2
4.1
Mannai Corp.
89.90
(0.11)
0.00
4,101
8.9
1.8
5.3
Aamal
14.95
0.00
(0.33)
8,970
14.2
1.3
N/A
Gulf International Services
64.30
7.35
5.41
9,560
15.8
3.3
2.3
Qatar Industrial Manufacturing
Qatari Investors Group
Qatar Electricity and Water
158,651
Industrials
Qatar Insurance
67.50
2.90
1.50
8,669
10.6
1.8
3.0
Doha Insurance
25.60
1.79
2.40
659
11.7
1.3
3.6
Qatar General Insurance & Reinsurance
47.00
(4.08)
(1.88)
2,709
3.1
0.8
1.9
Al Khaleej Takaful Insurance
37.50
(3.23)
2.74
640
13.3
1.1
2.2
Qatar Islamic Insurance
57.10
0.18
(1.38)
857
13.5
3.1
6.1
13,534
Insurance
United Development
23.15
2.84
2.39
7,807
9.5
0.7
4.3
Barwa Real Estate
30.60
1.83
2.68
11,907
17.4
0.9
4.9
Ezdan Real Estate
17.00
0.59
0.00
45,092
N/M
1.6
0.8
Mazaya Qatar Real Estate Development
11.35
(0.61)
1.52
1,135
17.1
1.0
5.3
43,596
16.5
1.8
3.7
9,316
N/M
1.5
N/A
65,941
Real Estate
136.10
(0.66)
(0.80)
11.02
(0.54)
2.89
Qatar Navigation (Milaha)
84.60
0.48
1.93
9,689
9.9
0.8
4.4
Gulf Warehousing
41.20
0.49
(0.72)
1,960
19.7
2.5
N/A
Qatar Gas Transport (Nakilat)
Transportation
20.50
0.39
1.23
11,480
15.0
3.3
4.9
Qatar Telecom
Vodafone Qatar
52,912
Telecoms
23,128
Qatar Exchange
561,701
Source: Bloomberg
Contacts
Saugata Sarkar
Ahmed M. Shehada
Keith Whitney
Sahbi Kasraoui
Head of Research
Head of Trading
Head of Sales
Manager - HNWI
Tel: (+974) 4476 6534
Tel: (+974) 4476 6535
Tel: (+974) 4476 6533
Tel: (+974) 4476 6544
saugata.sarkar@qnbfs.com.qa
ahmed.shehada@qnbfs.com.qa
keith.whitney@qnbfs.com.qa
sahbi.alkasraoui@qnbfs.com.qa
QNB Financial Services SPC
Contact Center: (+974) 4476 6666
PO Box 24025, Doha, Qatar
DISCLAIMER: This publication has been prepared by QNB Financial Services SPC (“QNBFS”) a wholly-owned subsidiary of Qatar National Bank (“QNB”). QNBFS is regulated by the Qatar
Financial Markets Authority and the Qatar Exchange; QNB is regulated by the Qatar Central Bank. This publication expresses the views and opinions of QNBFS at a given time only. It is not an
offer, promotion or recommendation to buy or sell securities or other investments, nor is it intended to constitute legal, tax, accounting, or financial advice. We therefore strongly advise potential
investors to seek independent professional advice before making any investment decision. Although the information in this report has been obtained from sources that QNBFS believes to be
reliable, we have not independently verified such information and it may not be accurate or complete. While this publication has been prepared with the utmost degree of care by our analysts,
QNBFS does not make any representations warranties as to the accuracy and completeness of the information it may contain, and declines any liability in that respect. QNBFS reserves the right
to amend the views and opinions expressed in this publication at any time. It may also express viewpoints or make investment decisions that differ significantly from, or even contradict, the views
and opinions included in this report.
COPYRIGHT: No part of this document may be reproduced without the explicit written permission of QNBFS.
Page 5 of 5