Download as PDF, PPTX

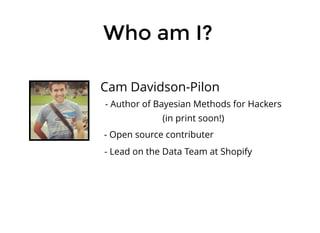


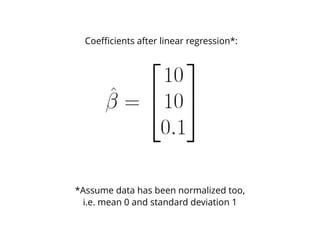

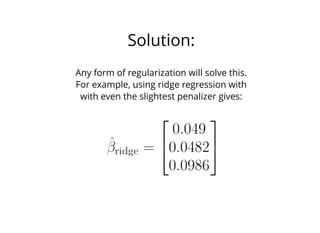

![Suppose we wish to regress Y onto X and W.
The true model of Y is Y = X - W. We don't know this
yet.
Suppose further there is a positive
correlation between X and W, say 0.5.
Apply PCA to [X W], we get a new matrix:
[ X + W, X − W]√2
1
√2
1
√2
1
√2
1](https://image.slidesharecdn.com/decks-150806163451-lva1-app6891/85/Mistakes-I-ve-Made-Cam-Davidson-Pilon-51-320.jpg)
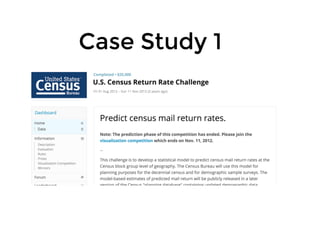
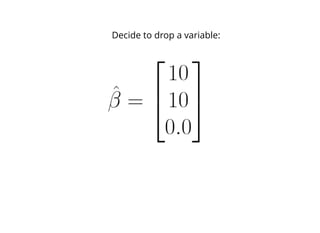
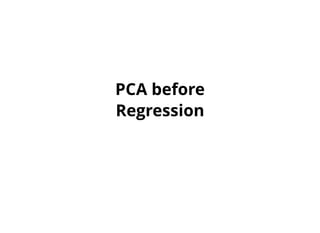
![[ X + W, X − W]√2
1
√2
1
√2
1
√2
1
Textbook analysis tells you to drop the
second dimension from this new PCA.](https://image.slidesharecdn.com/decks-150806163451-lva1-app6891/85/Mistakes-I-ve-Made-Cam-Davidson-Pilon-52-320.jpg)
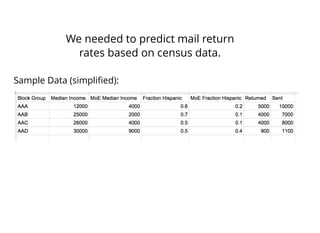
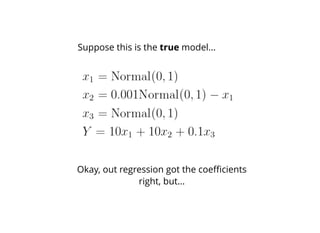
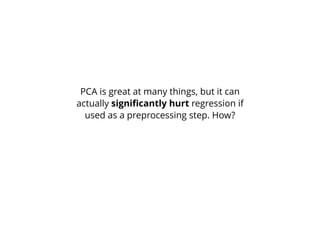
![[ X + W]√2
1
√2
1
So now we are regressing Y onto:
i.e., find values to fit the model:
Y = α + β(X + W)
But there are no good values for these
unknowns!](https://image.slidesharecdn.com/decks-150806163451-lva1-app6891/85/Mistakes-I-ve-Made-Cam-Davidson-Pilon-53-320.jpg)


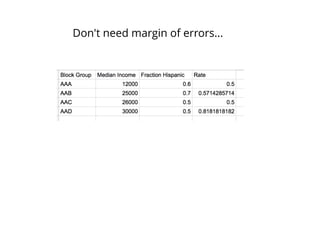
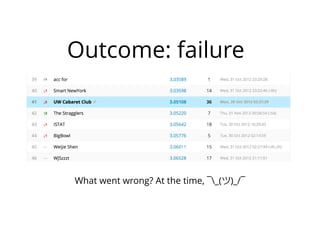
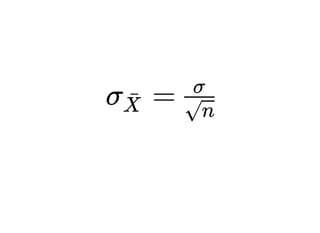
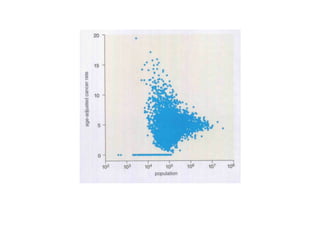
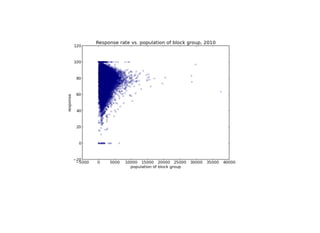
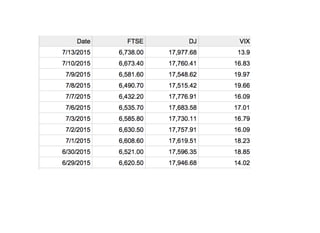
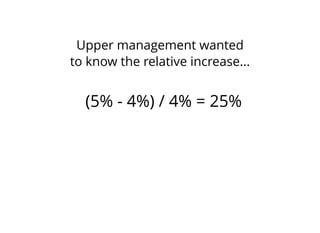
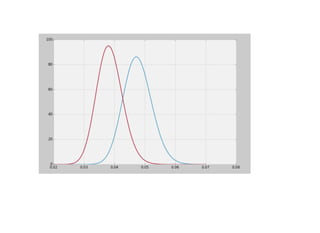
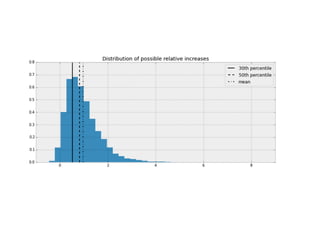
1. The document discusses four case studies of mistakes the author made in data science projects. The first case involved incorrectly predicting mail return rates without considering sample sizes. The second was backtesting a trading strategy without accounting for data leakage. The third was developing statistical software without proper testing. The fourth was incorrectly calculating an A/B test statistic without considering sample size. 2. In each case, the author explains what went wrong and the lessons learned, such as considering sample sizes, understanding where data comes from, testing software appropriately, and not compounding uncertainties when calculating statistics. The author also discusses potential pitfalls in machine learning, like incorrectly sparsifying models or using PCA before regression.