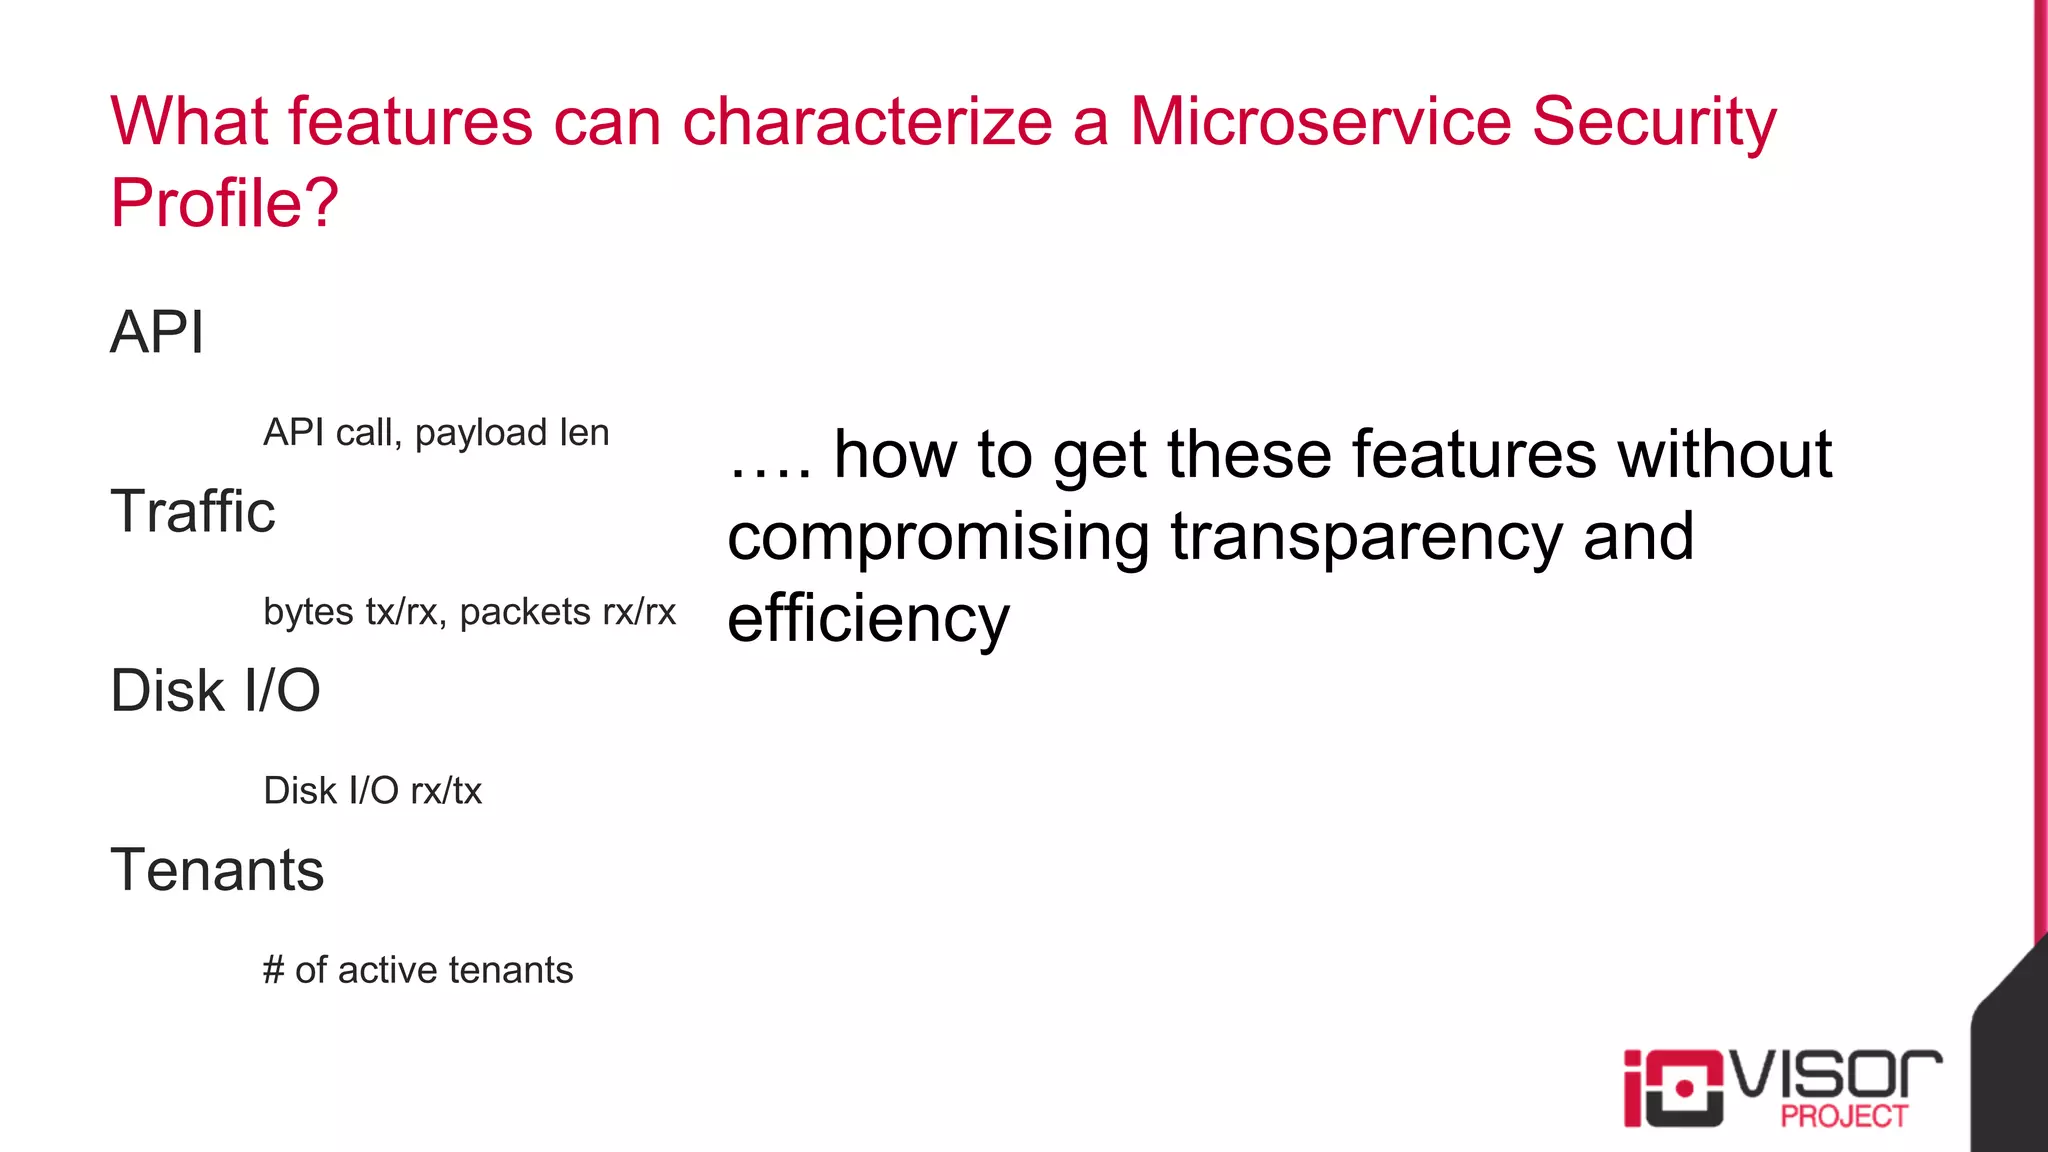
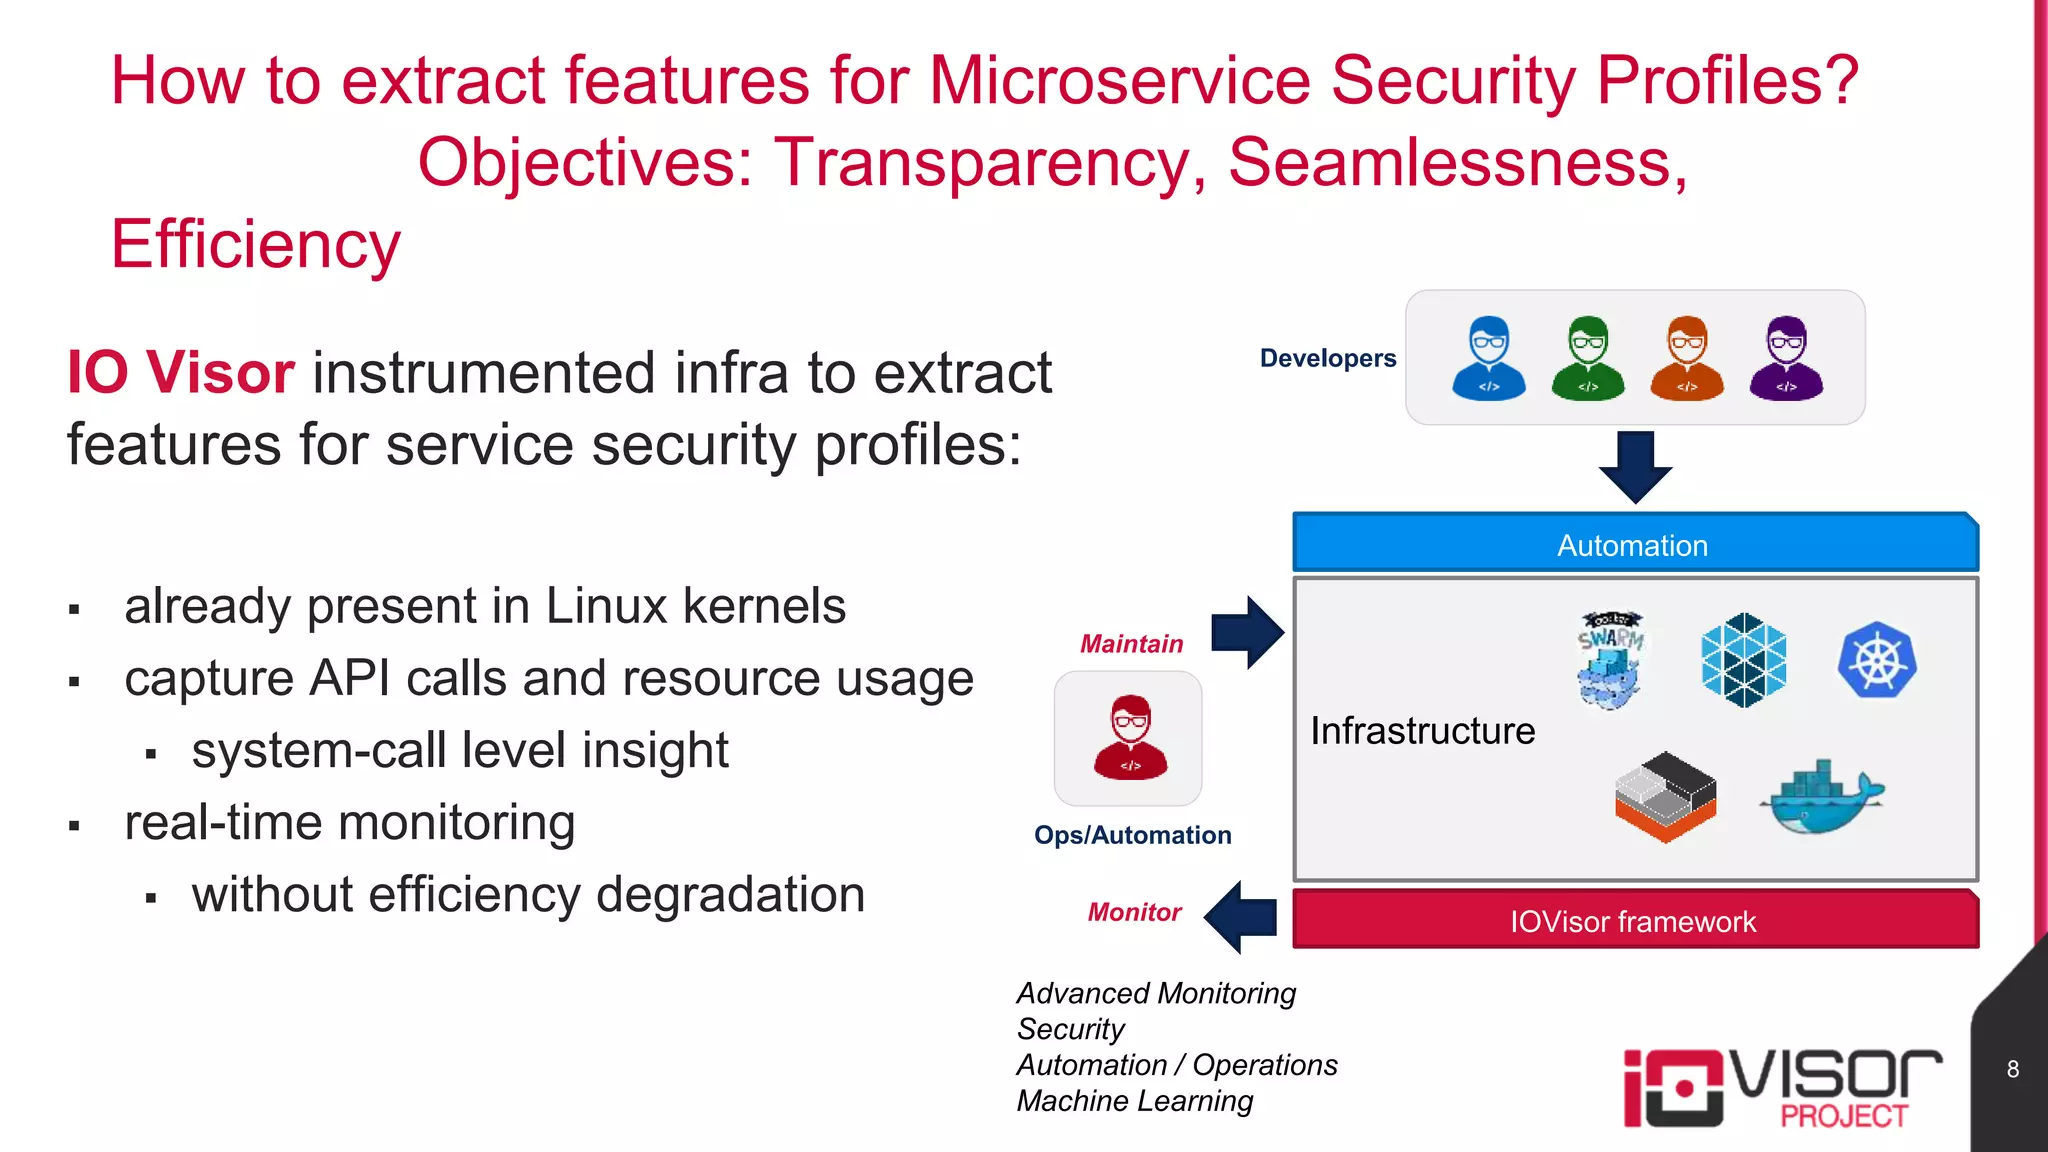
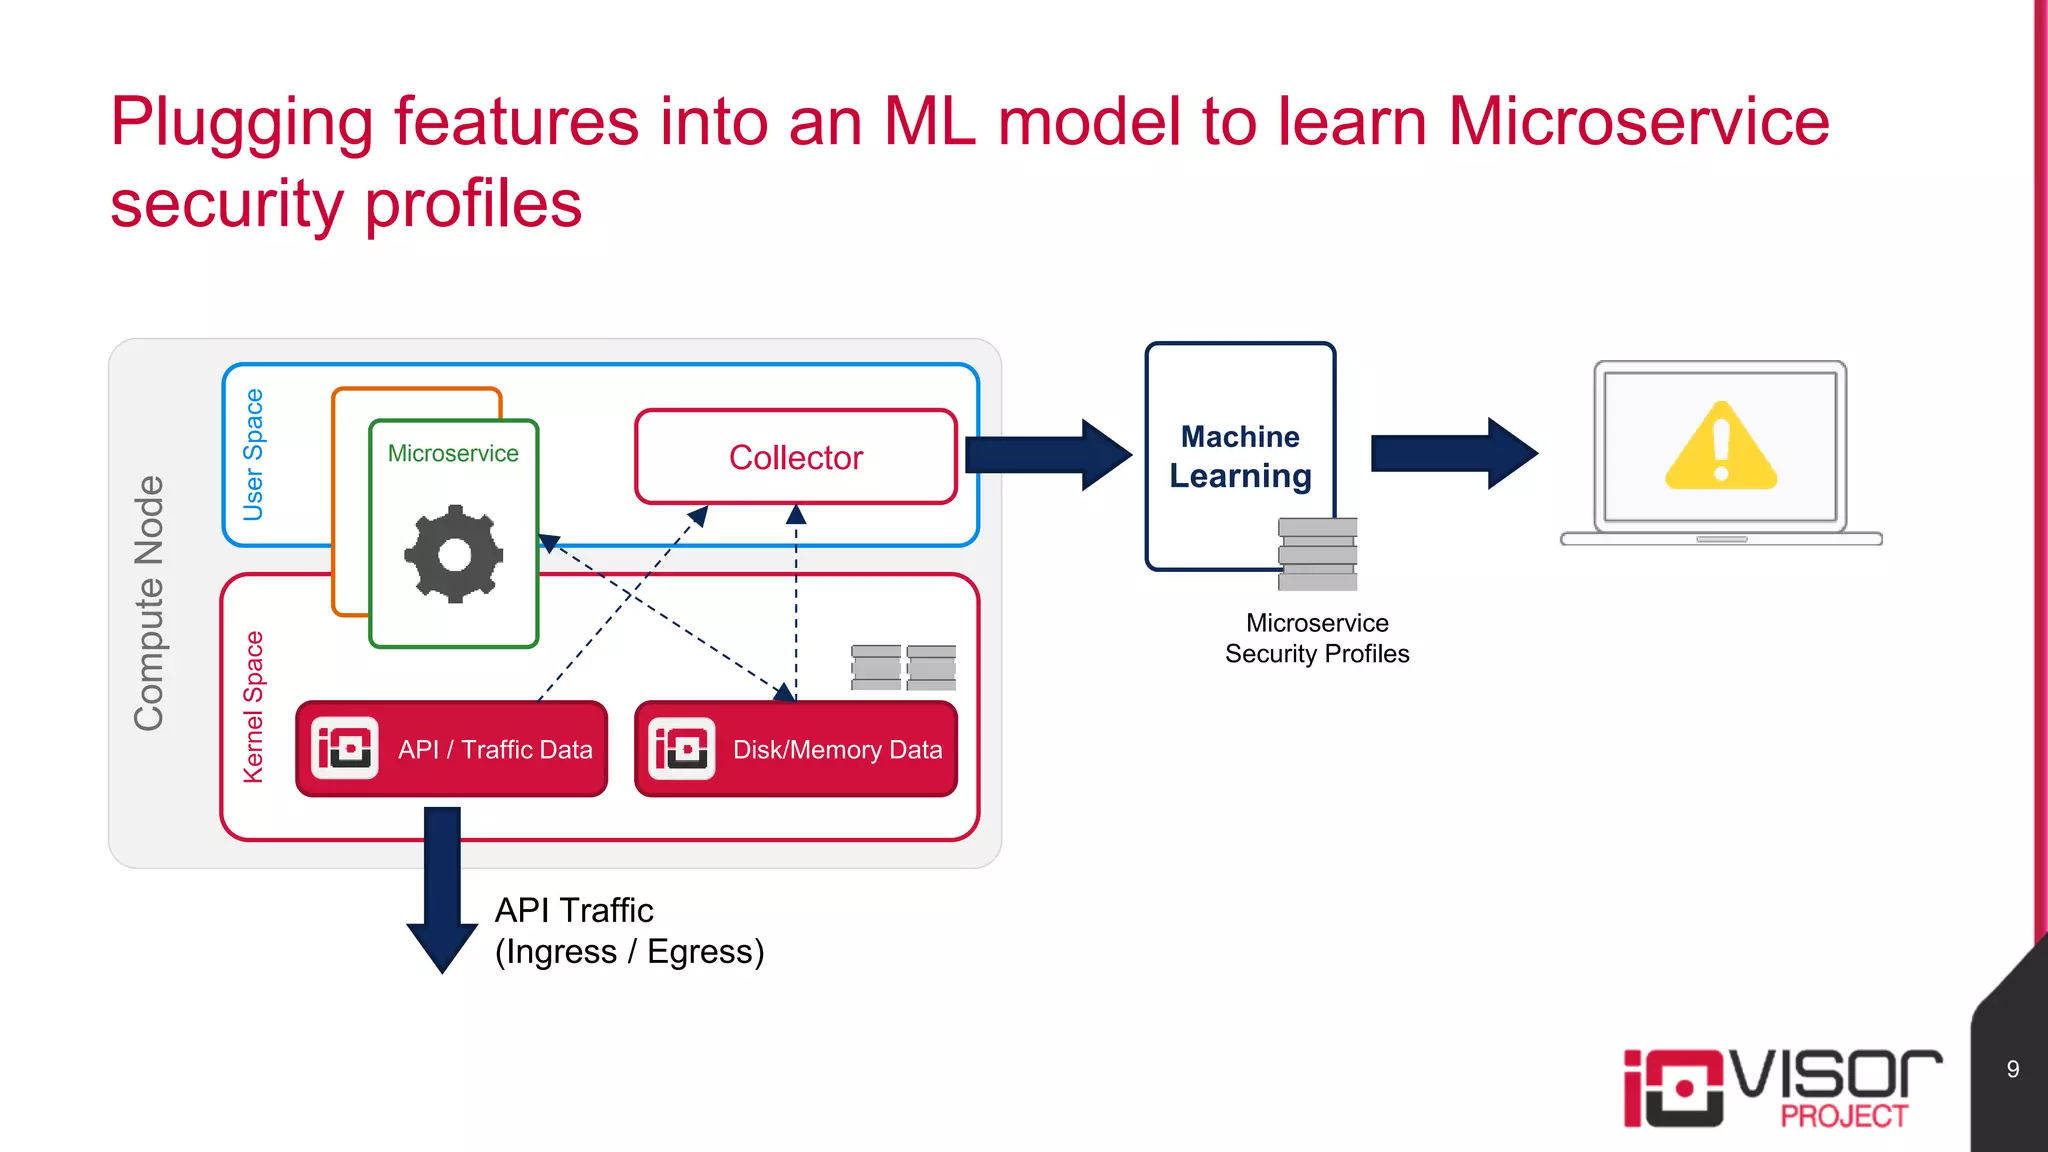
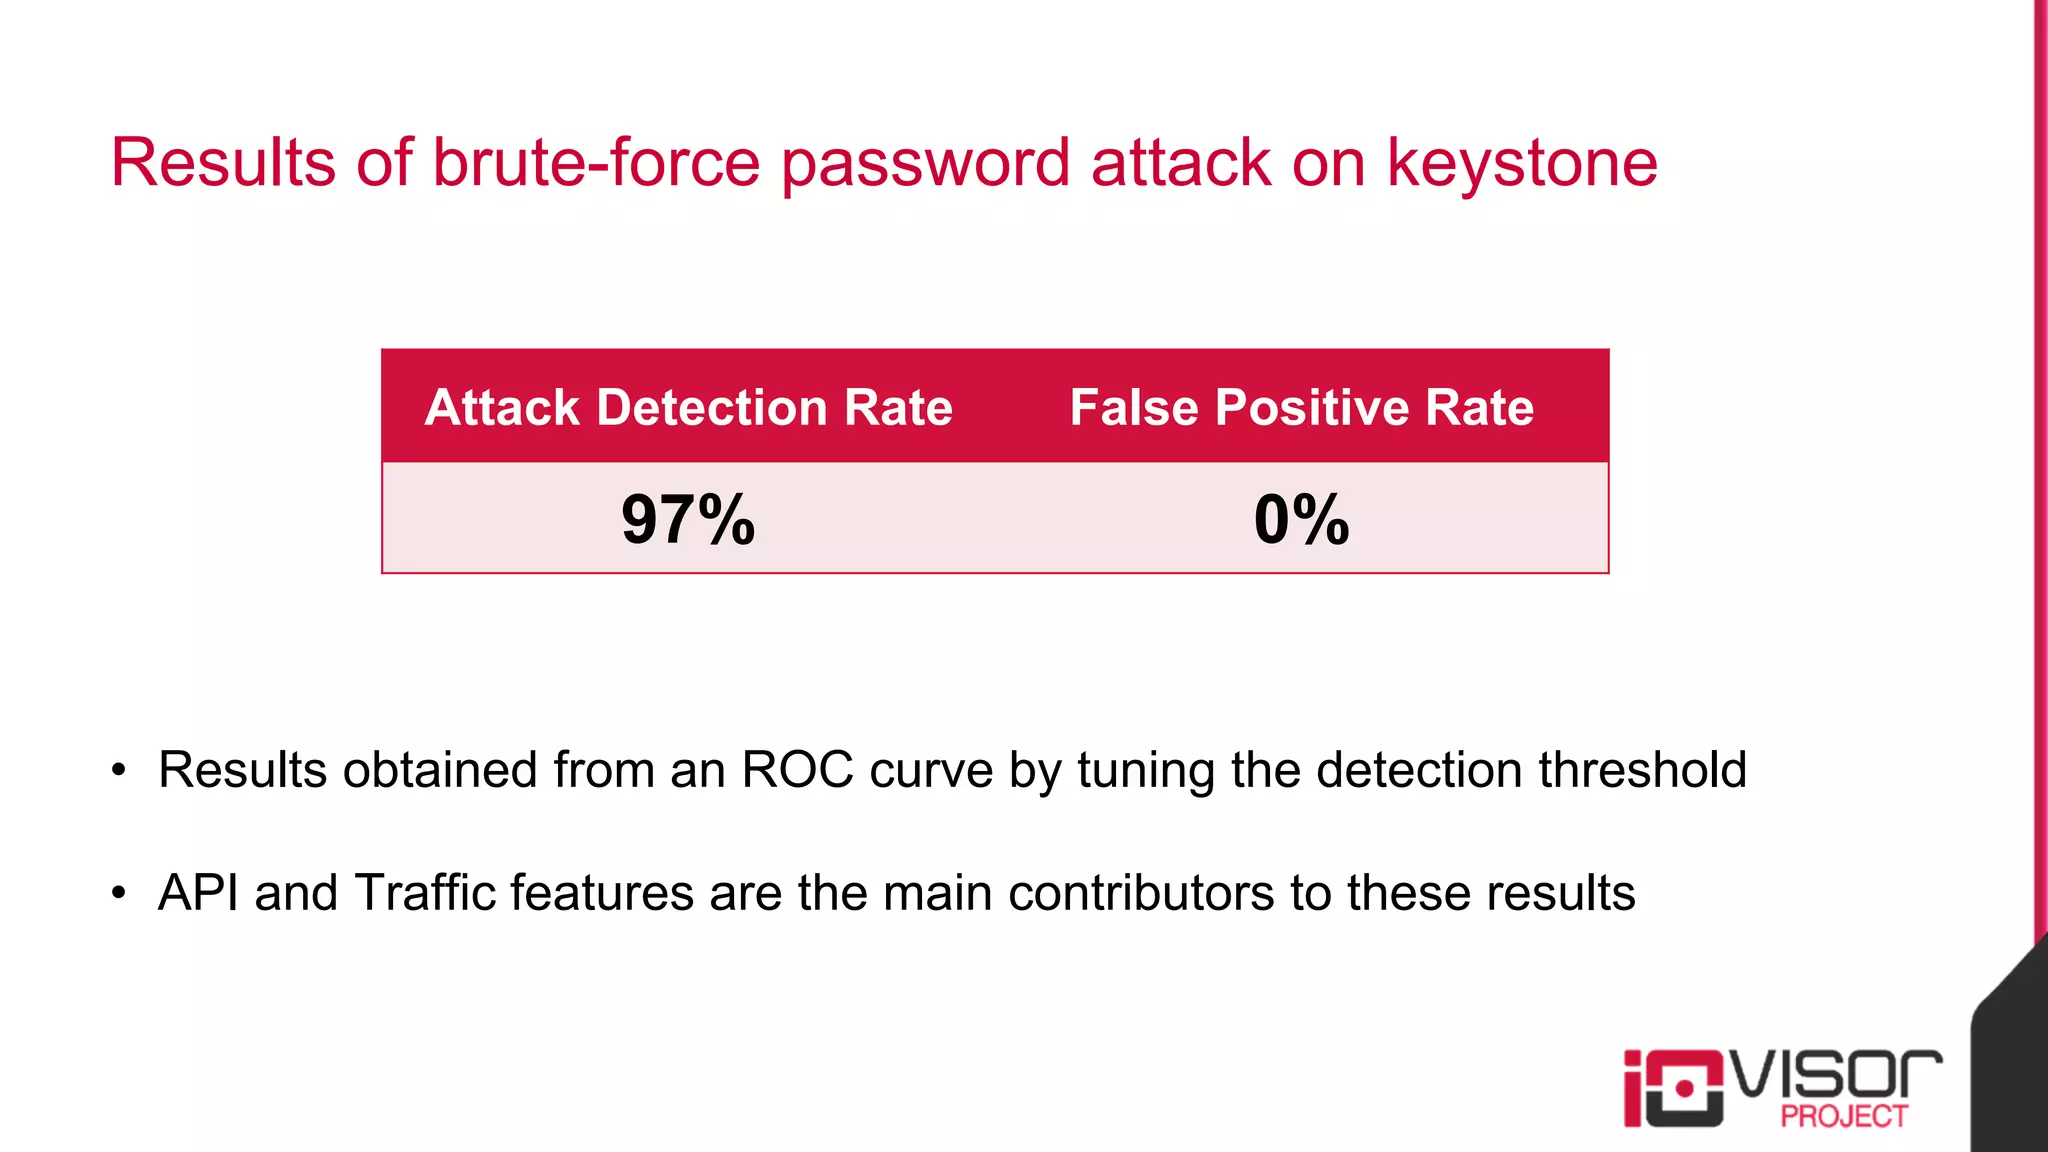
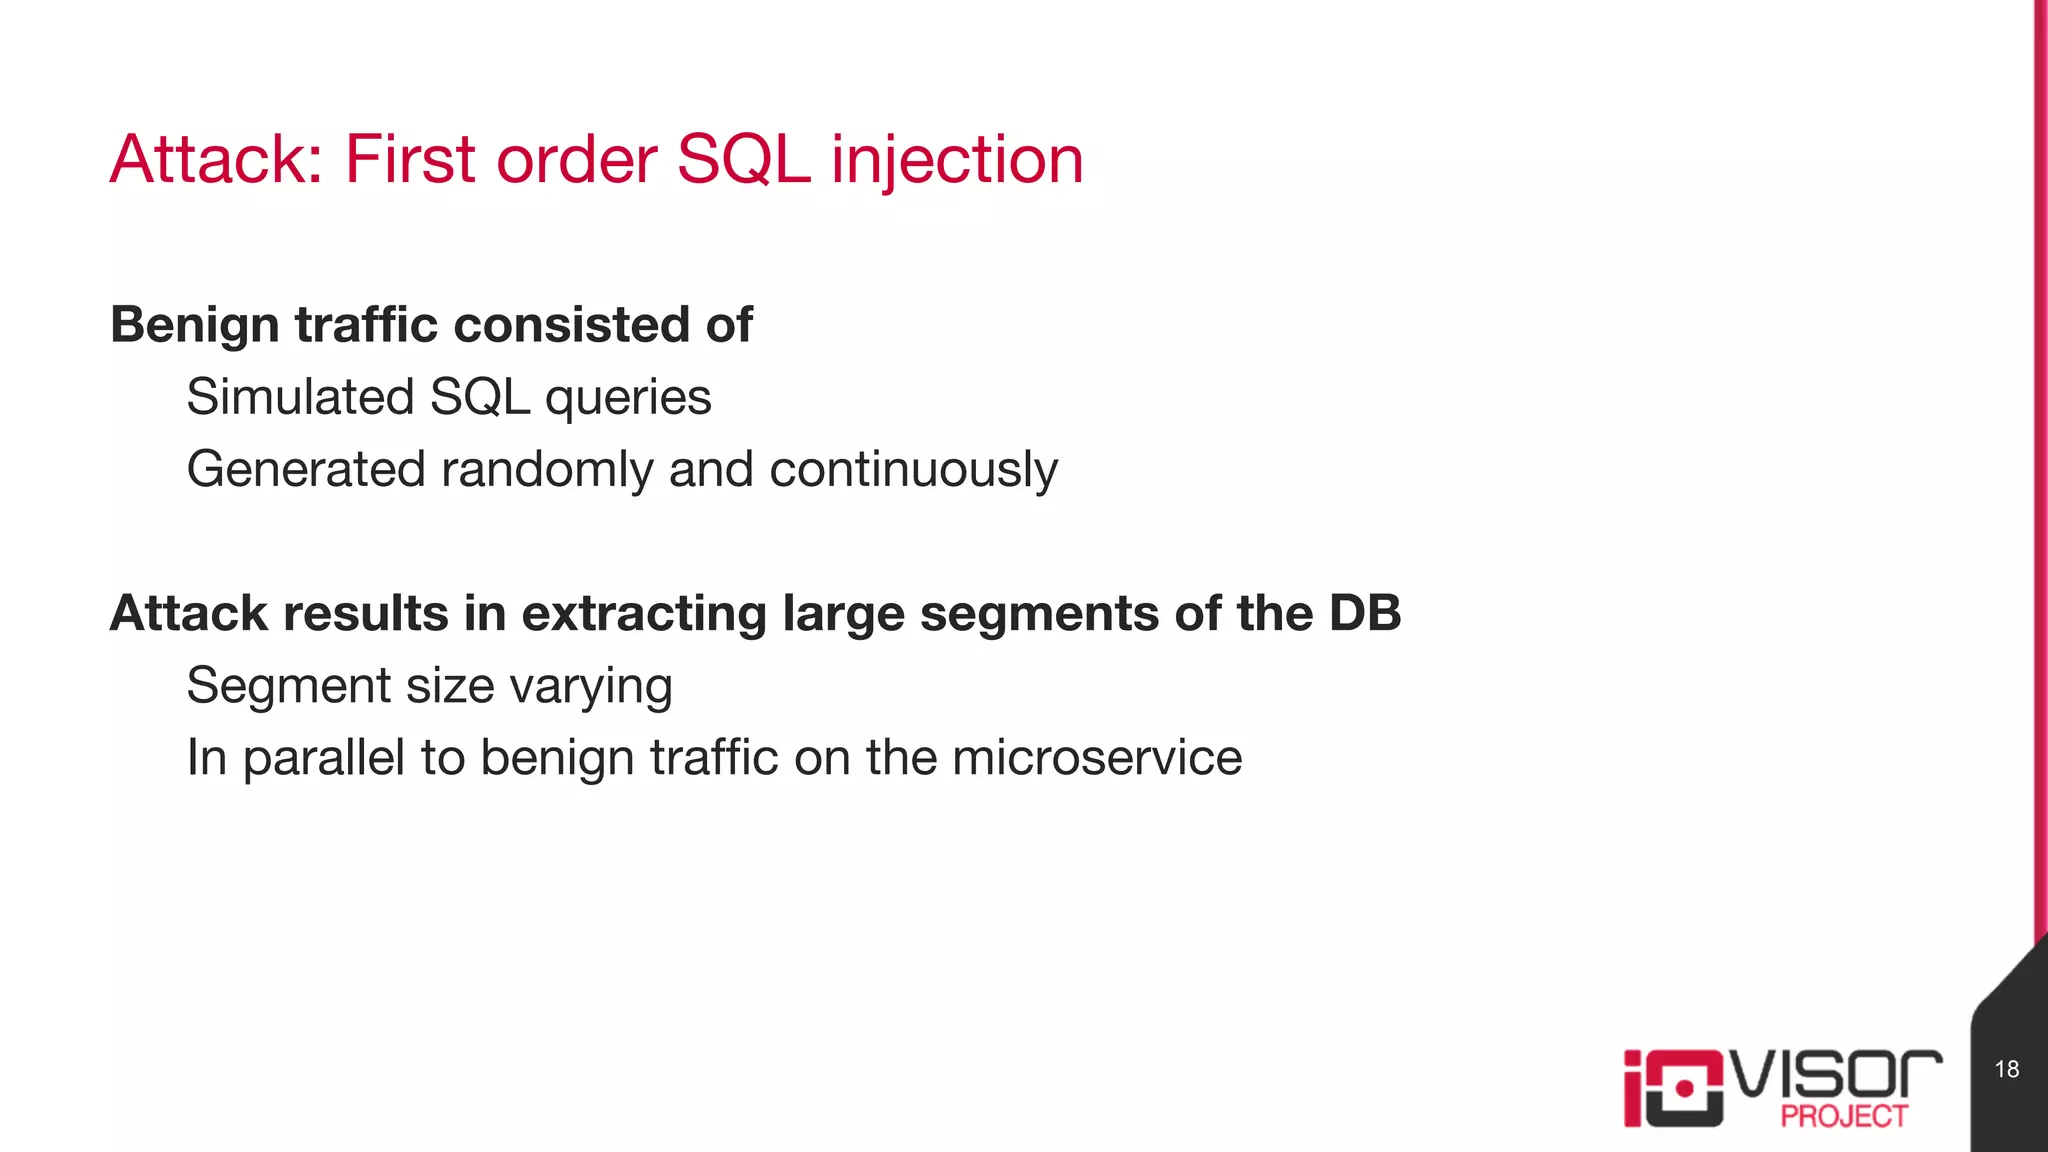
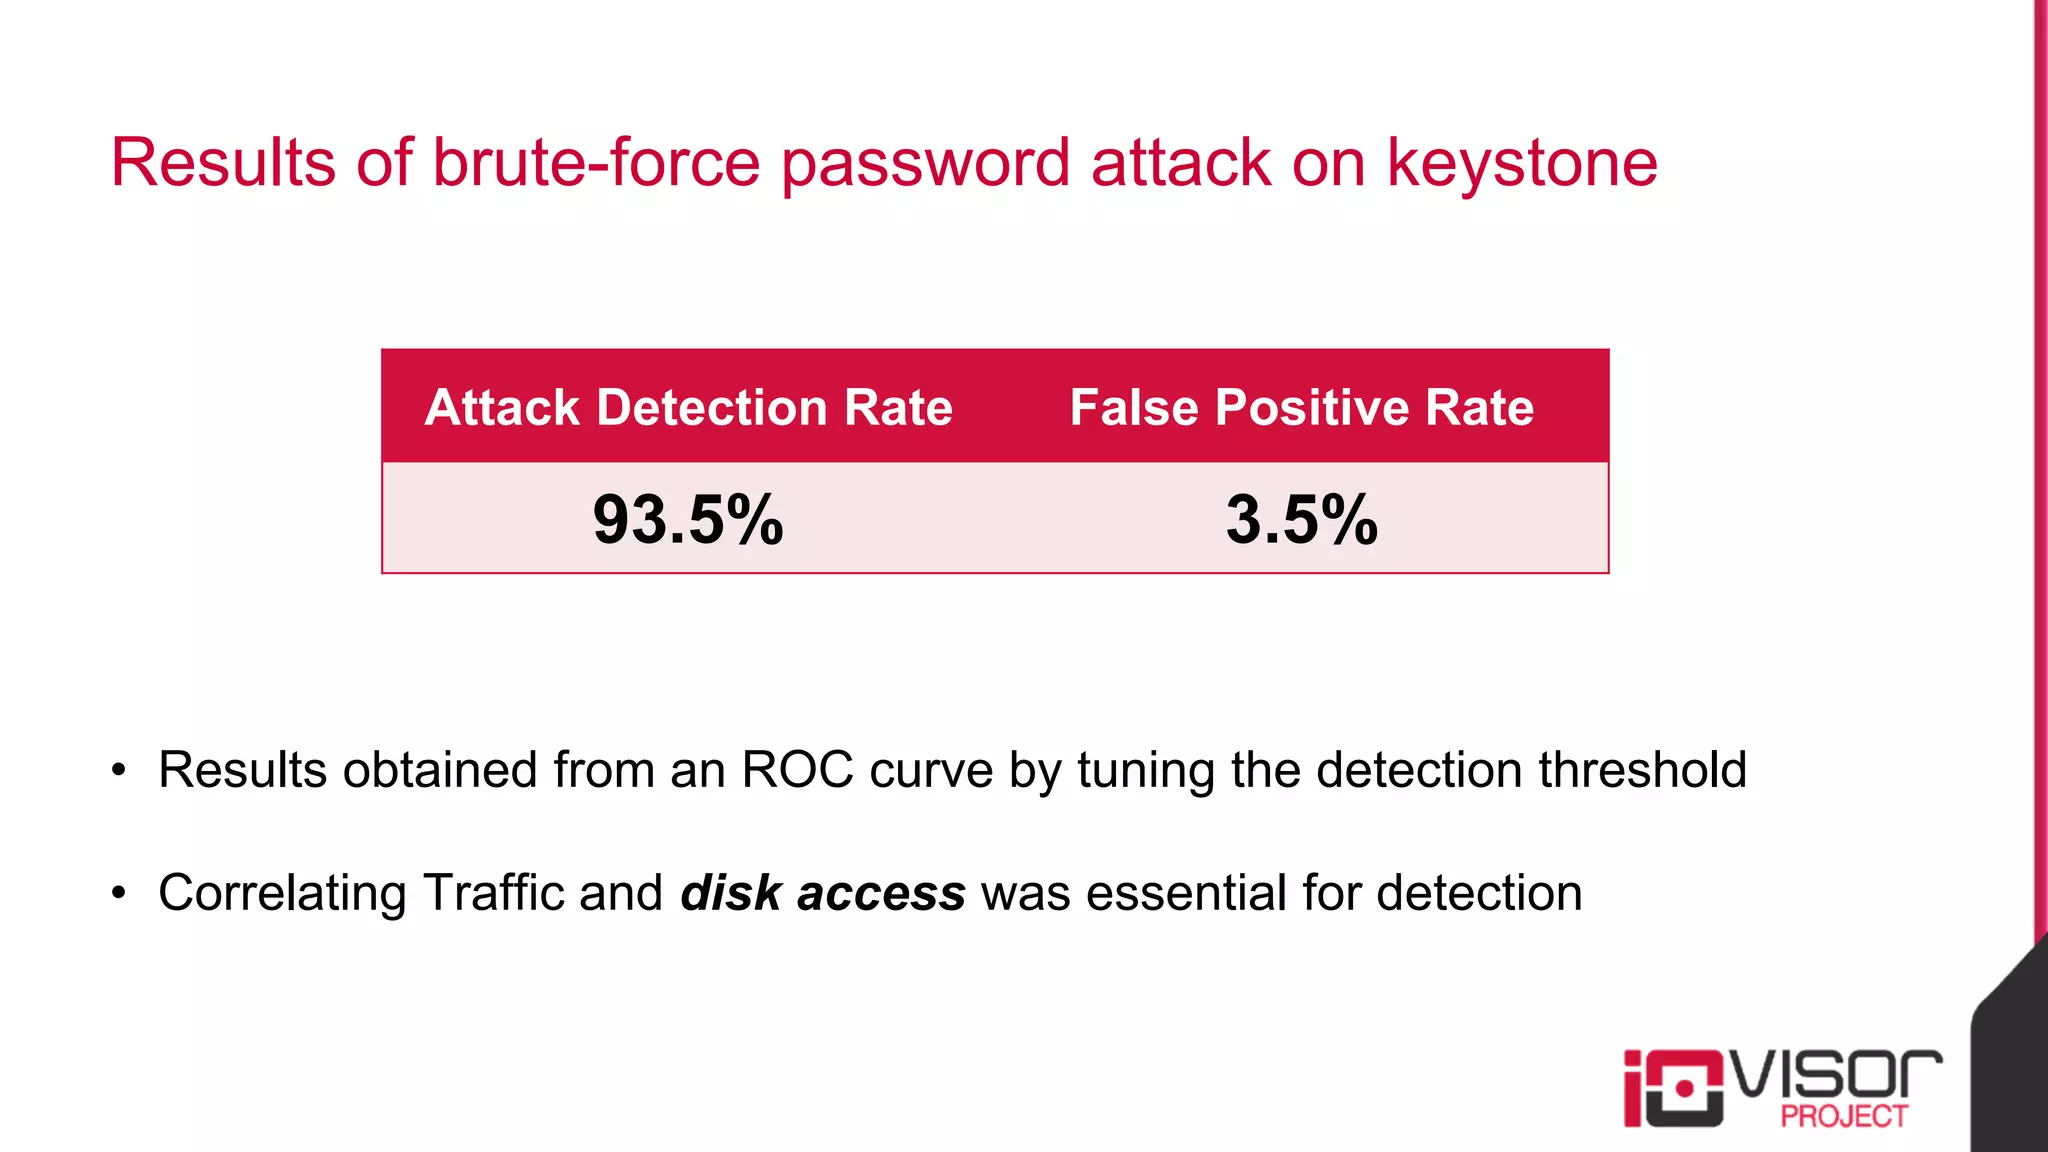
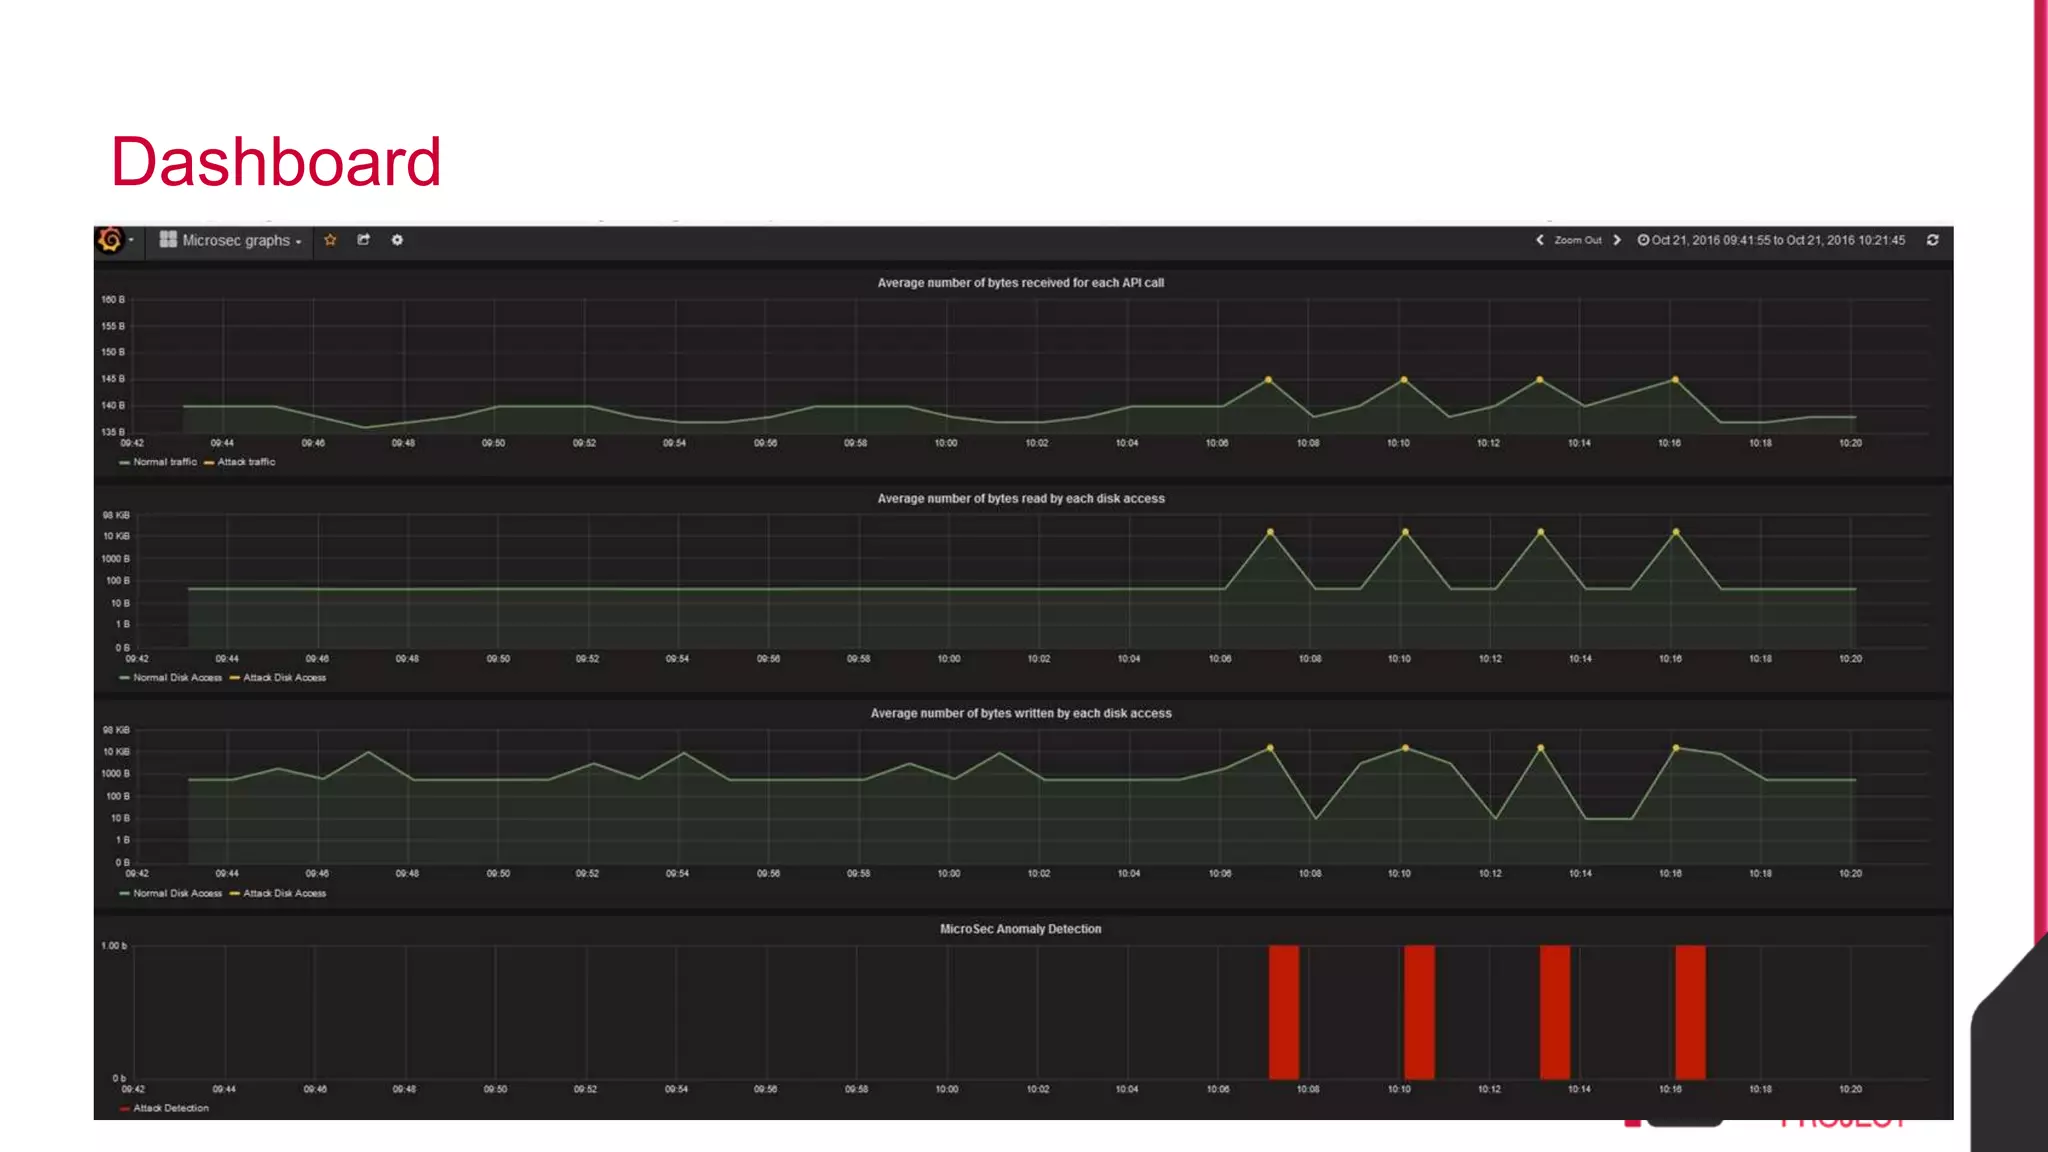
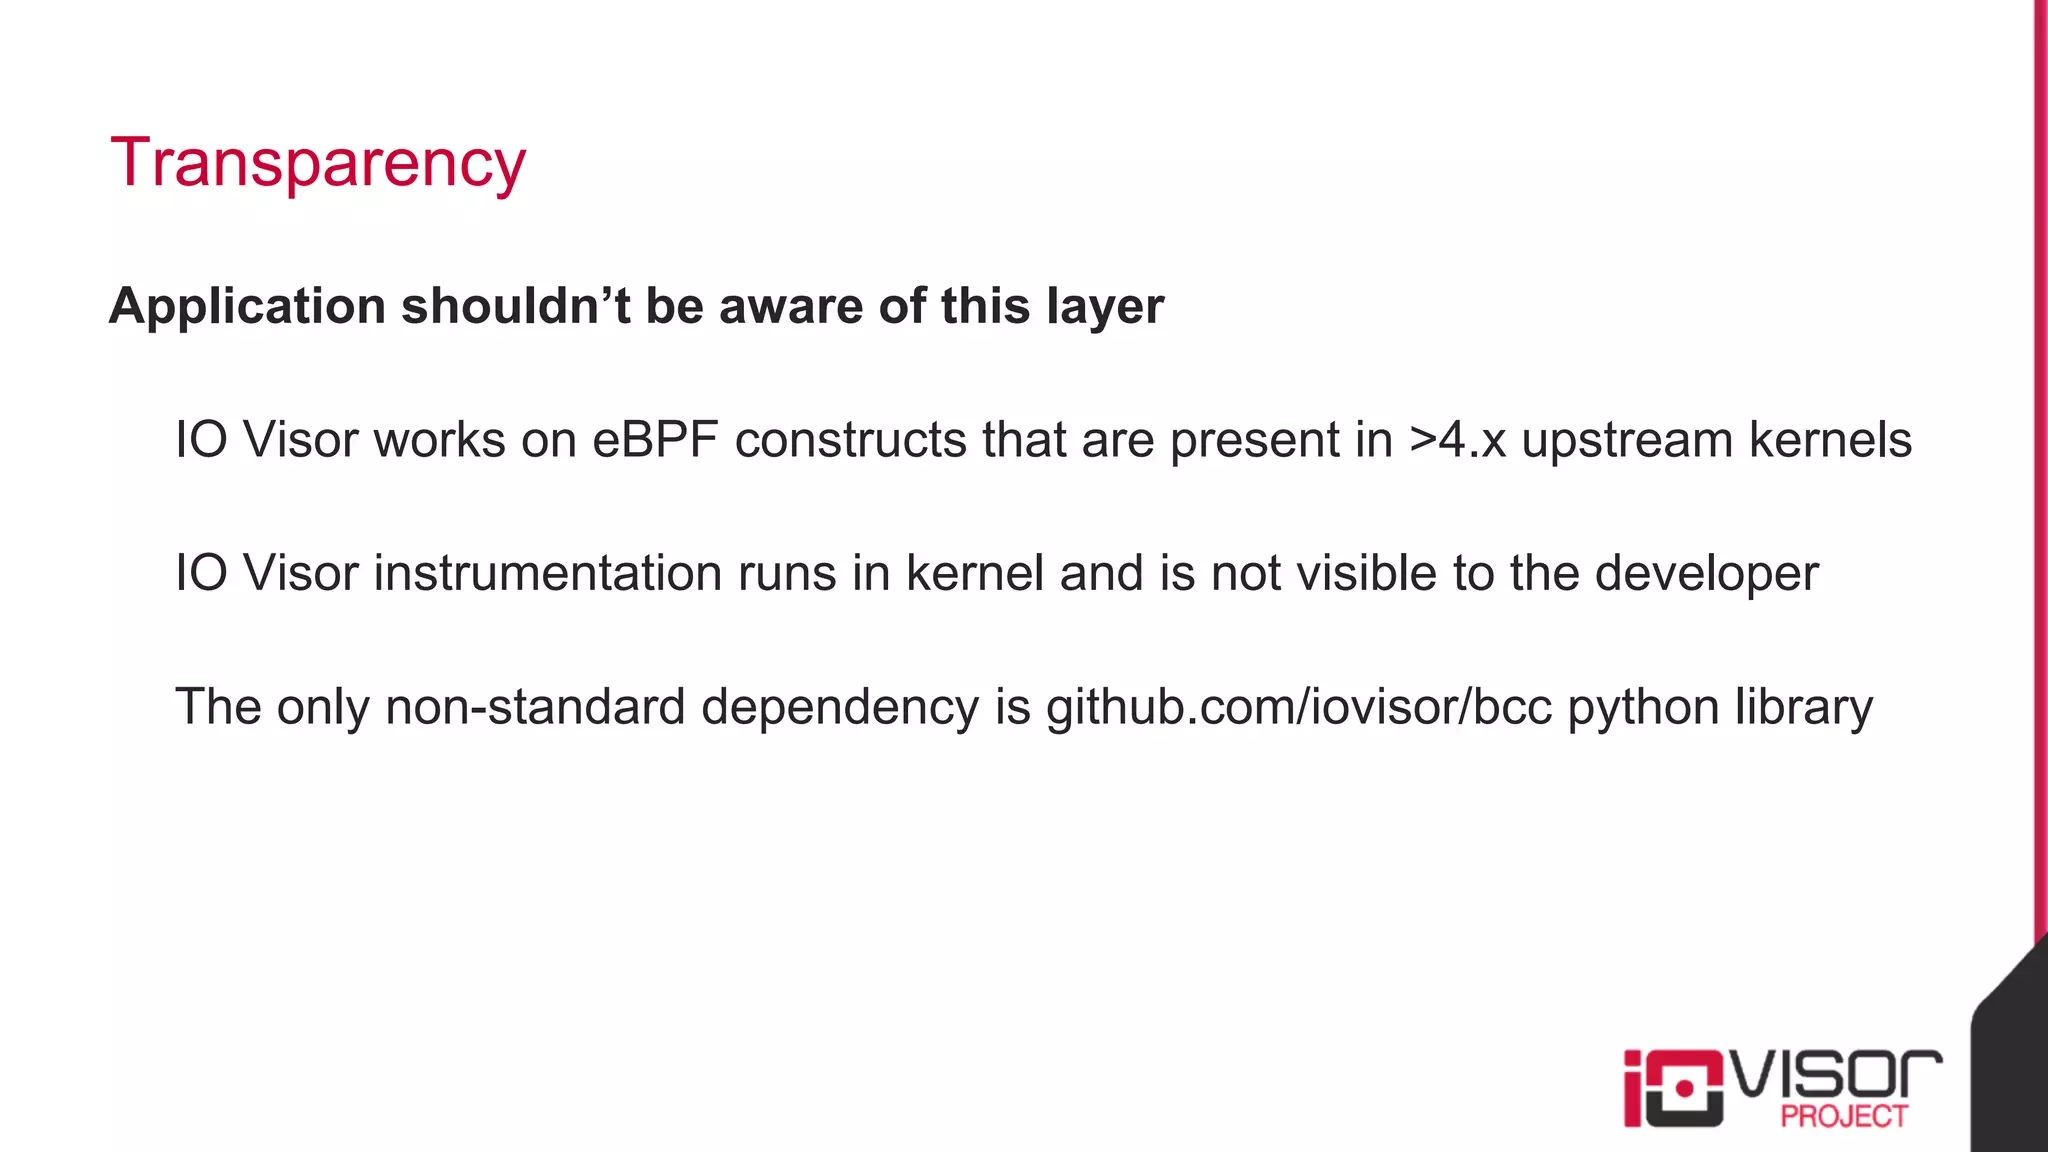
In-kernel Analytics and
Tracing with eBPF for
OpenStack Clouds
October 2016
Brenden Blanco
PLUMgrid
Ali Khayam
PLUMgrid
Thank You to Sponsoring Members
2
IO Visor Project, What is in it?
• A set of development tools, IO Visor Dev
Tools
• A set of IO Visor Tools for management
and operations of the IO Visor Engine
• A set of Applications, Tools and open IO
Modules build on top of the IO Visor
framework
• A set of possible use cases & applications
like Networking, Security, Tracing &
others
3
The promise of Microservices: Better cloud app lifecycle
…… but what about security?
4
Shared kernel Larger attack surface?
Self service Developer = Security Expert?
Shared Infrastructure Insider threats?
Fast Development & Iteration Compromised zero trust?
Where should microservices security be implemented?
All layers…. but from the app cloud provider’s perspective:
best to trust what you build/operate/control
=> “Security-as-a-Service” in the cloud
infrastructure
Infrastructure
Operator
Application
Developer
An ideal Security-as-a-Service offering
Transparent: Application shouldn’t be aware of this layer
No new software installation/configuration
Generically applicable: Should be able to characterize microservice
security profiles for diverse applications, without having visibility into
service behavior
Efficient: No compromises on performance or scalability
What features can characterize a Microservice Security
Profile?
API
API call, payload len
Traffic
bytes tx/rx, packets rx/rx
Disk I/O
Disk I/O rx/tx
Tenants
# of active tenants
…. how to get these features without
compromising transparency and
efficiency
How to extract features for Microservice Security Profiles?
Objectives: Transparency, Seamlessness,
Efficiency
IO Visor instrumented infra to extract
features for service security profiles:
▪ already present in Linux kernels
▪ capture API calls and resource usage
▪ system-call level insight
▪ real-time monitoring
▪ without efficiency degradation
8
Automation
Developers
IOVisor framework
Advanced Monitoring
Security
Automation / Operations
Machine Learning
Infrastructure
Monitor
Ops/Automation
Maintain
Plugging features into an ML model to learn Microservice
security profiles
9
ComputeNode
UserSpaceKernelSpace
API / Traffic Data Disk/Memory Data
Microservice Collector
Machine
Learning
API Traffic
(Ingress / Egress)
Microservice
Security Profiles
IO Visor Code Snippet (Userspace)
IO Visor Code Snippet (Kernel)
www.iovisor.org
Preliminary Evaluation
1) OpenStack Controller Services as
Microservices
12
OpenStack Controller Services as Microservices
IO Visor instrumentation is used to build security profiles of all controller services
nova, neutron, keystone, cinder, etc.
API calls learned as they arrive on the services’ veth interface
no pre-training of API calls
IO Visor hooks to monitor vfs_{read/write} accesses from each service
separated based on PIDs for each container
ML algorithm builds security profiles based on initial (training) data
then security profile deviations are used for attack detection on run-time data
Attack: Bruteforce password cracking on keystone
Lots of Background (benign) Traffic:
Continuous CRUD APIs from a real-world app cloud use case
All API calls (incl. service-to-service) must get auth_token from keystone
first
Attack Traffic:
2-4 password attempts per second
Attack continued for a sustained period of time
Results of brute-force password attack on keystone
Attack Detection Rate False Positive Rate
97% 0%
• Results obtained from an ROC curve by tuning the detection threshold
• API and Traffic features are the main contributors to these results
Preliminary Evaluation
2) Database container using MySQL
16
MySQL Microservice instrumentation
MySQL Docker image (MySQL version 5.7, docker 1.12 )
SQL queries (TCP packets) intercepted by IOVisor hooks on veth pairs
handshakes, teardown and acks ignored
IOVisor hooks for vfs_{read/write} for queries into a large DB (180Mb)
separated on PID and TID for docker
17
Attack: First order SQL injection
Benign traffic consisted of
Simulated SQL queries
Generated randomly and continuously
Attack results in extracting large segments of the DB
Segment size varying
In parallel to benign traffic on the microservice
18
Results of brute-force password attack on keystone
Attack Detection Rate False Positive Rate
93.5% 3.5%
• Results obtained from an ROC curve by tuning the detection threshold
• Correlating Traffic and disk access was essential for detection
Dashboard
Conclusion:
Meeting the requirements of an ideal Security-as-a-
Service offering
21
Transparency
Application shouldn’t be aware of this layer
IO Visor works on eBPF constructs that are present in >4.x upstream kernels
IO Visor instrumentation runs in kernel and is not visible to the developer
The only non-standard dependency is github.com/iovisor/bcc python library
Generic Applicability
Should be able to characterize microservice security profiles for diverse applications,
without having visibility into service behavior
Trained/Tested on SQL
Trained/Tested on OpenStack services
Future Work:
Train/Test for DNS attacks
Train/Test for ransomware attacks
Efficiency
No compromises on performance or scalability
eBPF counting is done inside the kernel with little or no overhead
Main overhead is kernel to userspace interaction
Data polled by userspace every 1 minute
All data structures are reset after polling; data cannot grow
indefinitely
Data is exported by the userspace application to a collector node
Machine learning and classification is applied on the collector node
i.e. no impact to performance on computes
Efficiency
No compromises on performance or scalability
Data structures have low overhead:
vfs_read (BFP_HASH):
size at time ti = Ni x 3, where:
Ni = # of read process at ti
the map has: {key: pid, value1: # of reads, value2: aggregate size of all reads
vfs_write (BFP_HASH): has the the same structure as vfs_read
traffic (BFP_HASH):
size at time ti = Fi x 7, where:
Fi = # of active TCP flows at ti
the map’s key is a 5-tuple flow id, and values are the same as vfs_{read/write}
http_traffic (BPF_HISTOGRAM):
size at time ti = Si x LSi x 7, where:
key is a 5-tuple flow id of http packets
Si = # of active HTTP session at ti
LSi = # of HTTP packets with unique lengths received on session Si
How to Contribute
github.com/akhayam/conmon (this presentation)
www.iovisor.org
github.com/iovisor
#iovisor at irc.oftc.net
lists.iovisor.org/mailman/listinfo/iovisor-dev
26
Questions?

In-kernel Analytics and Tracing with eBPF for OpenStack Clouds

  • 1.
    In-kernel Analytics and Tracingwith eBPF for OpenStack Clouds October 2016 Brenden Blanco PLUMgrid Ali Khayam PLUMgrid
  • 2.
    Thank You toSponsoring Members 2
  • 3.
    IO Visor Project,What is in it? • A set of development tools, IO Visor Dev Tools • A set of IO Visor Tools for management and operations of the IO Visor Engine • A set of Applications, Tools and open IO Modules build on top of the IO Visor framework • A set of possible use cases & applications like Networking, Security, Tracing & others 3
  • 4.
    The promise ofMicroservices: Better cloud app lifecycle …… but what about security? 4 Shared kernel Larger attack surface? Self service Developer = Security Expert? Shared Infrastructure Insider threats? Fast Development & Iteration Compromised zero trust?
  • 5.
    Where should microservicessecurity be implemented? All layers…. but from the app cloud provider’s perspective: best to trust what you build/operate/control => “Security-as-a-Service” in the cloud infrastructure Infrastructure Operator Application Developer
  • 6.
    An ideal Security-as-a-Serviceoffering Transparent: Application shouldn’t be aware of this layer No new software installation/configuration Generically applicable: Should be able to characterize microservice security profiles for diverse applications, without having visibility into service behavior Efficient: No compromises on performance or scalability
  • 7.
    What features cancharacterize a Microservice Security Profile? API API call, payload len Traffic bytes tx/rx, packets rx/rx Disk I/O Disk I/O rx/tx Tenants # of active tenants …. how to get these features without compromising transparency and efficiency
  • 8.
    How to extractfeatures for Microservice Security Profiles? Objectives: Transparency, Seamlessness, Efficiency IO Visor instrumented infra to extract features for service security profiles: ▪ already present in Linux kernels ▪ capture API calls and resource usage ▪ system-call level insight ▪ real-time monitoring ▪ without efficiency degradation 8 Automation Developers IOVisor framework Advanced Monitoring Security Automation / Operations Machine Learning Infrastructure Monitor Ops/Automation Maintain
  • 9.
    Plugging features intoan ML model to learn Microservice security profiles 9 ComputeNode UserSpaceKernelSpace API / Traffic Data Disk/Memory Data Microservice Collector Machine Learning API Traffic (Ingress / Egress) Microservice Security Profiles
  • 10.
    IO Visor CodeSnippet (Userspace)
  • 11.
    IO Visor CodeSnippet (Kernel) www.iovisor.org
  • 12.
    Preliminary Evaluation 1) OpenStackController Services as Microservices 12
  • 13.
    OpenStack Controller Servicesas Microservices IO Visor instrumentation is used to build security profiles of all controller services nova, neutron, keystone, cinder, etc. API calls learned as they arrive on the services’ veth interface no pre-training of API calls IO Visor hooks to monitor vfs_{read/write} accesses from each service separated based on PIDs for each container ML algorithm builds security profiles based on initial (training) data then security profile deviations are used for attack detection on run-time data
  • 14.
    Attack: Bruteforce passwordcracking on keystone Lots of Background (benign) Traffic: Continuous CRUD APIs from a real-world app cloud use case All API calls (incl. service-to-service) must get auth_token from keystone first Attack Traffic: 2-4 password attempts per second Attack continued for a sustained period of time
  • 15.
    Results of brute-forcepassword attack on keystone Attack Detection Rate False Positive Rate 97% 0% • Results obtained from an ROC curve by tuning the detection threshold • API and Traffic features are the main contributors to these results
  • 16.
    Preliminary Evaluation 2) Databasecontainer using MySQL 16
  • 17.
    MySQL Microservice instrumentation MySQLDocker image (MySQL version 5.7, docker 1.12 ) SQL queries (TCP packets) intercepted by IOVisor hooks on veth pairs handshakes, teardown and acks ignored IOVisor hooks for vfs_{read/write} for queries into a large DB (180Mb) separated on PID and TID for docker 17
  • 18.
    Attack: First orderSQL injection Benign traffic consisted of Simulated SQL queries Generated randomly and continuously Attack results in extracting large segments of the DB Segment size varying In parallel to benign traffic on the microservice 18
  • 19.
    Results of brute-forcepassword attack on keystone Attack Detection Rate False Positive Rate 93.5% 3.5% • Results obtained from an ROC curve by tuning the detection threshold • Correlating Traffic and disk access was essential for detection
  • 20.
  • 21.
    Conclusion: Meeting the requirementsof an ideal Security-as-a- Service offering 21
  • 22.
    Transparency Application shouldn’t beaware of this layer IO Visor works on eBPF constructs that are present in >4.x upstream kernels IO Visor instrumentation runs in kernel and is not visible to the developer The only non-standard dependency is github.com/iovisor/bcc python library
  • 23.
    Generic Applicability Should beable to characterize microservice security profiles for diverse applications, without having visibility into service behavior Trained/Tested on SQL Trained/Tested on OpenStack services Future Work: Train/Test for DNS attacks Train/Test for ransomware attacks
  • 24.
    Efficiency No compromises onperformance or scalability eBPF counting is done inside the kernel with little or no overhead Main overhead is kernel to userspace interaction Data polled by userspace every 1 minute All data structures are reset after polling; data cannot grow indefinitely Data is exported by the userspace application to a collector node Machine learning and classification is applied on the collector node i.e. no impact to performance on computes
  • 25.
    Efficiency No compromises onperformance or scalability Data structures have low overhead: vfs_read (BFP_HASH): size at time ti = Ni x 3, where: Ni = # of read process at ti the map has: {key: pid, value1: # of reads, value2: aggregate size of all reads vfs_write (BFP_HASH): has the the same structure as vfs_read traffic (BFP_HASH): size at time ti = Fi x 7, where: Fi = # of active TCP flows at ti the map’s key is a 5-tuple flow id, and values are the same as vfs_{read/write} http_traffic (BPF_HISTOGRAM): size at time ti = Si x LSi x 7, where: key is a 5-tuple flow id of http packets Si = # of active HTTP session at ti LSi = # of HTTP packets with unique lengths received on session Si
  • 26.
    How to Contribute github.com/akhayam/conmon(this presentation) www.iovisor.org github.com/iovisor #iovisor at irc.oftc.net lists.iovisor.org/mailman/listinfo/iovisor-dev 26
  • 27.