Download as PDF, PPTX


![Top down, spotted.
• [availability]
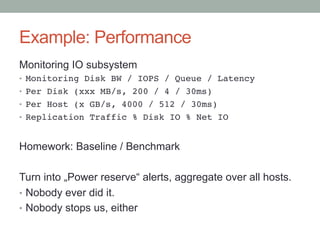
• [performance]
• [business operations]
• [redundancy]](https://image.slidesharecdn.com/opennebulaconf-florianheigl-monitoring-131009091108-phpapp01/85/Monitoring-of-OpenNebula-installations-14-320.jpg)
![Ponder on that:
• All your aircos with their [redundancy] failed.
• Isn‘t your cloud still [available]?
• Your filers are being trashed by the Nagios VM, crippling
[performance]. Everything is still [available], but cloning a
template takes an hour.
• Will that impact [business operations]?](https://image.slidesharecdn.com/opennebulaconf-florianheigl-monitoring-131009091108-phpapp01/85/Monitoring-of-OpenNebula-installations-15-320.jpg)
![Ponder on that too:
Assume you‘re hosting a public cloud.
How will your [business operations] lose more money:
1. A hypervisor is no longer [available] and you even lose
5 VM images
2. Sunstone doesn‘t work for 5 hours
Disclaimer: Your actual business‘ requirements may differ from this example.
J](https://image.slidesharecdn.com/opennebulaconf-florianheigl-monitoring-131009091108-phpapp01/85/Monitoring-of-OpenNebula-installations-16-320.jpg)

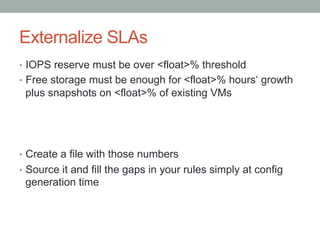
![That KPI stuff creeps back
• All VMs are running, Sunstone is fine. Our storage is low
util, lot of capacity for new VMs
• => [availability] [redundancy] [Peformance] is A+
• But you have a BIG problem.
• You didn‘t notice, because you „just“ monitored that every
piece of „the cloud“ works.
• Customers are switching for another provider!
• Couldn‘t you easily notice anyway?](https://image.slidesharecdn.com/opennebulaconf-florianheigl-monitoring-131009091108-phpapp01/85/Monitoring-of-OpenNebula-installations-18-320.jpg)


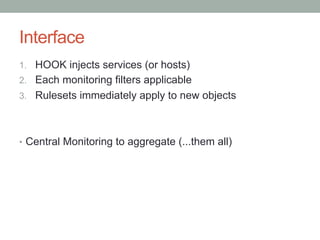
![Live data
• ONE frontend nodes know about all HV hosts
• All about its ressouces
• All about its networks
• So lets source that.
• Add attributes (which we do know) automatically
• The rules will match on those attributes
for _vnet in _one_info[vnets].keys():!
checks += [([ „one-infra“ ], „VM vrouter-%s“ % vnet )]!](https://image.slidesharecdn.com/opennebulaconf-florianheigl-monitoring-131009091108-phpapp01/85/Monitoring-of-OpenNebula-installations-35-320.jpg)


The document discusses the importance of effective monitoring strategies within OpenNebula environments, highlighting various elements such as redundancy, performance, and business impacts. It emphasizes the need for dynamic configuration and proactive monitoring to better manage virtual systems, making a distinction between availability, performance, and business operations. Additionally, it suggests using predefined monitoring rules and leveraging live data for optimized alerting and reporting against set KPIs.