
Download as PDF, PPTX
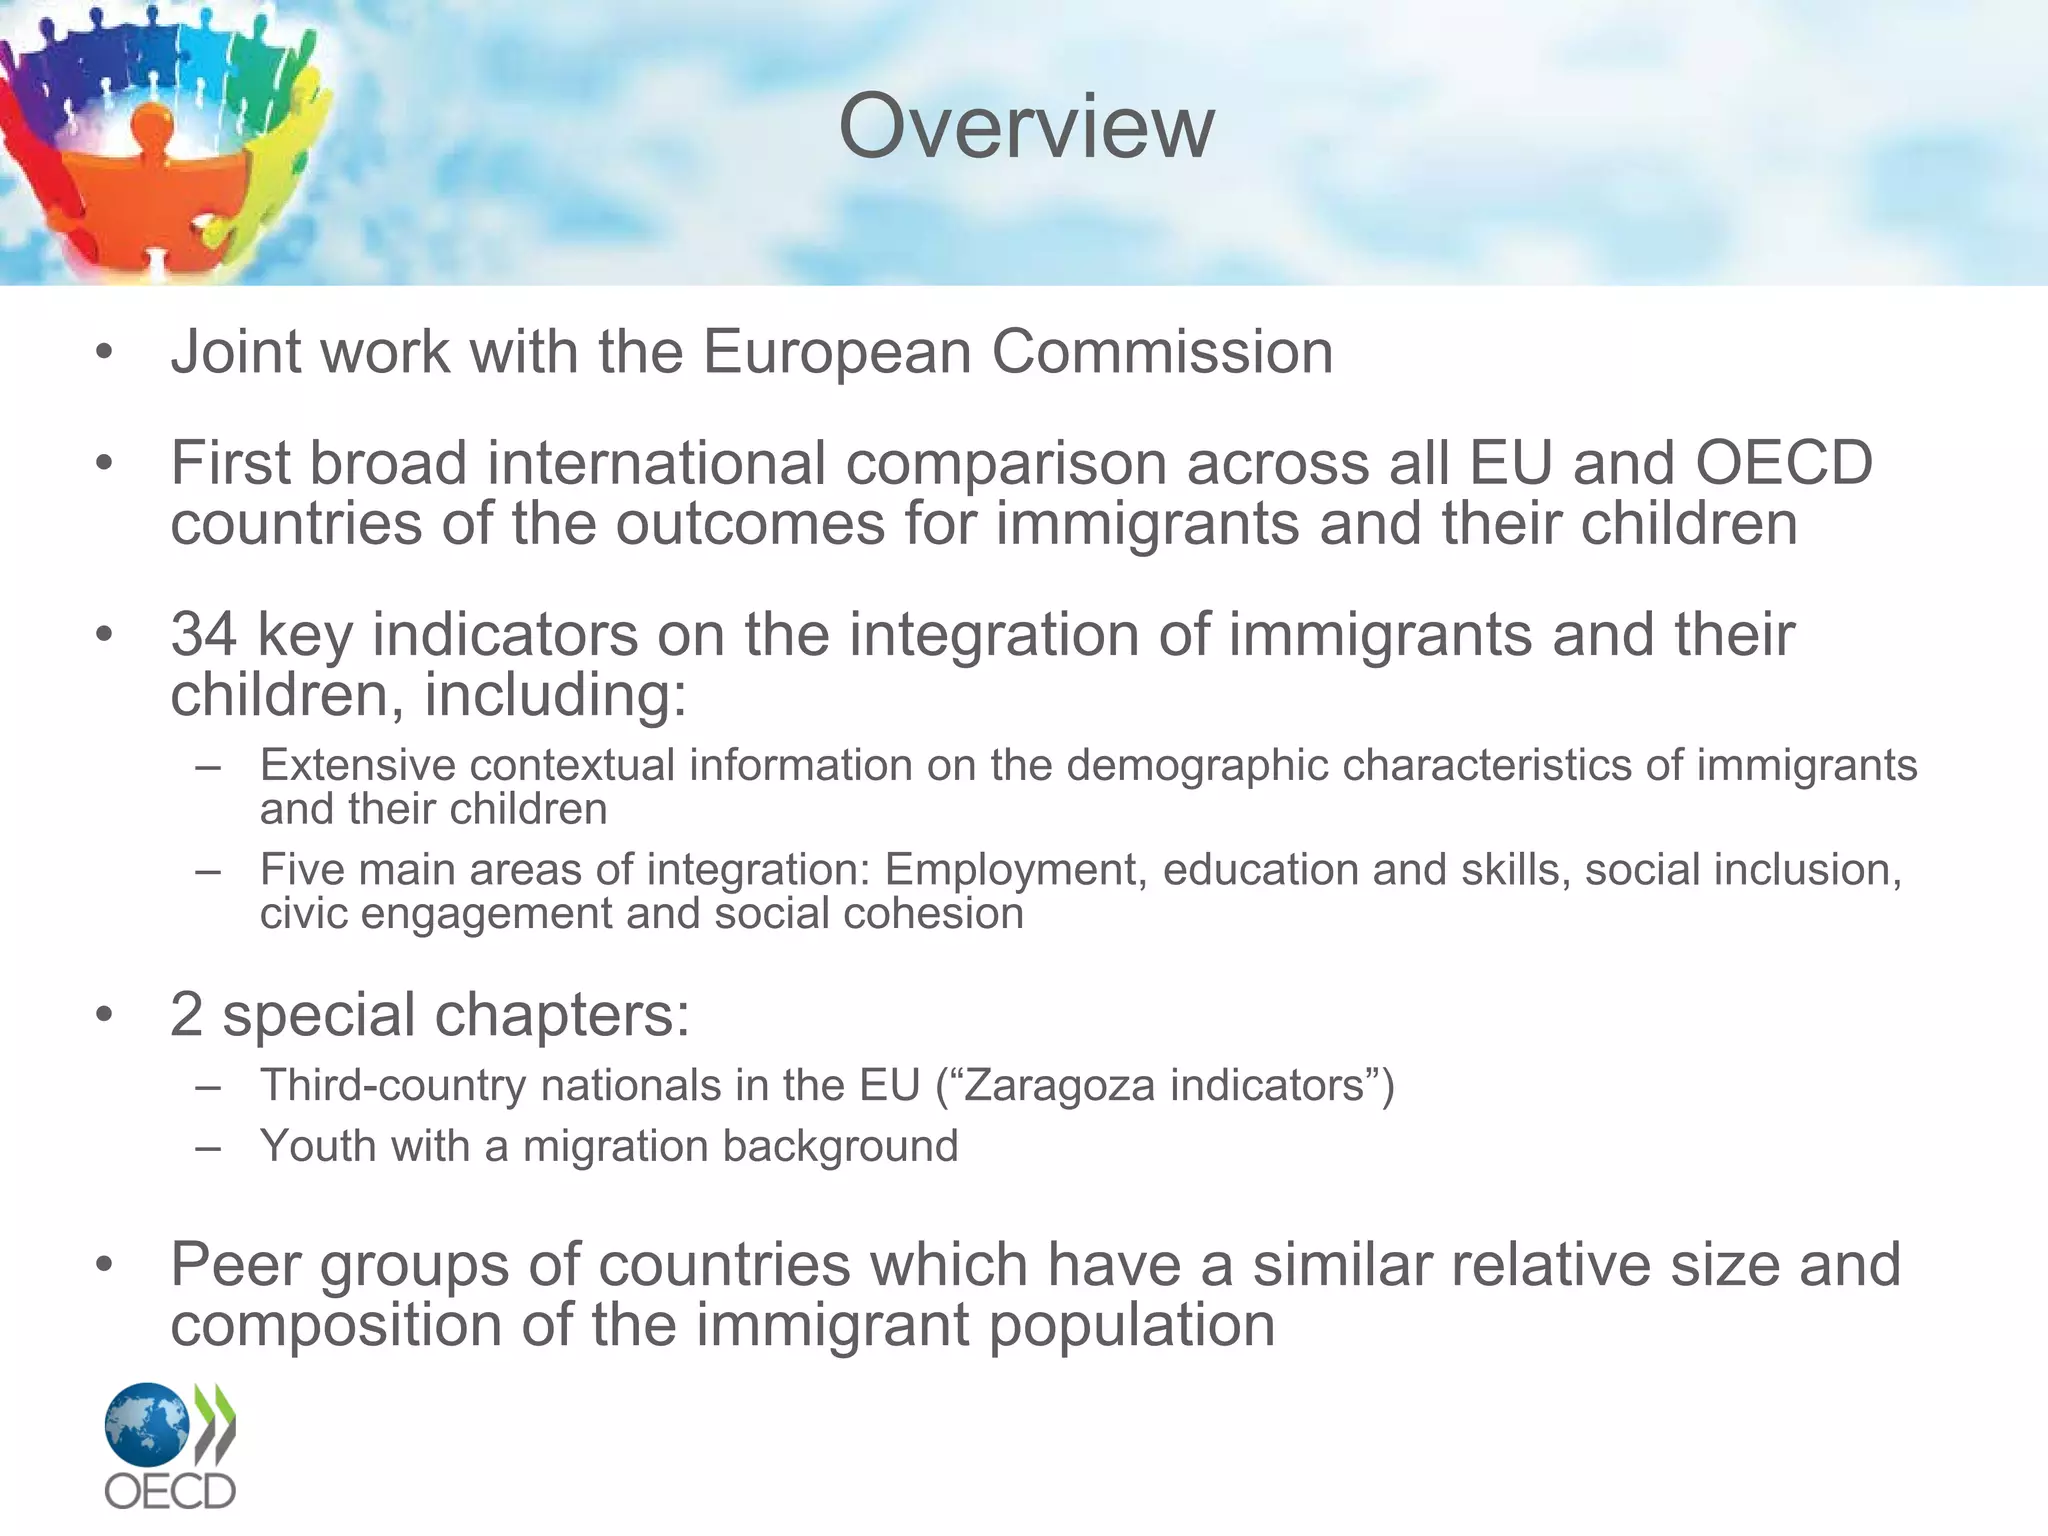

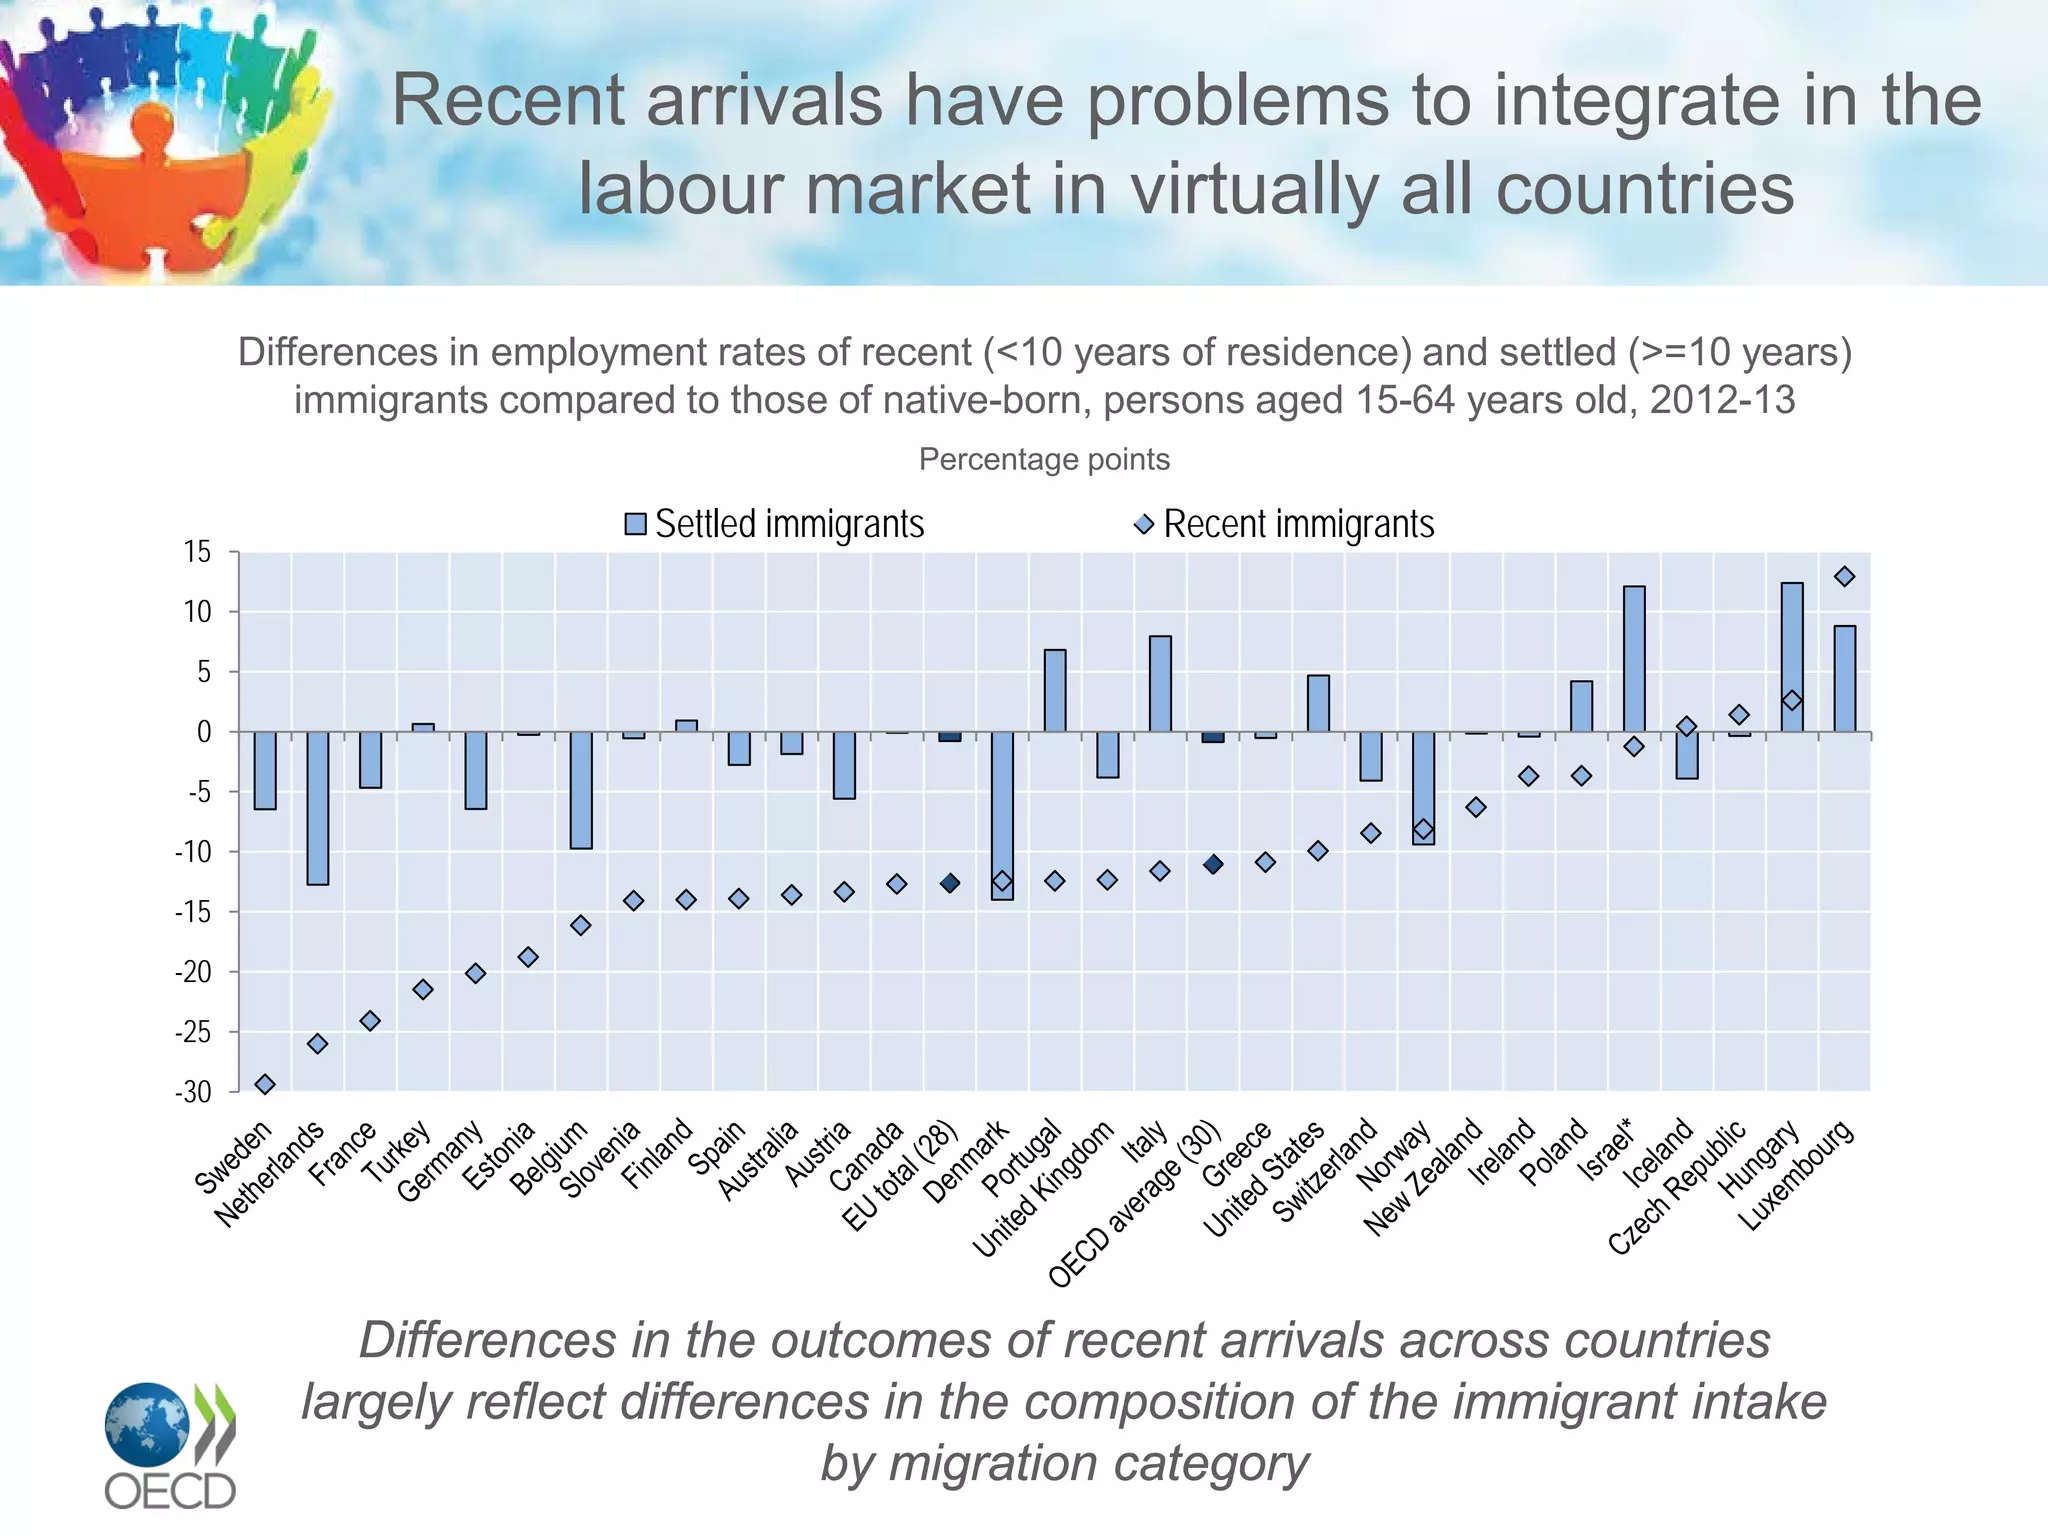
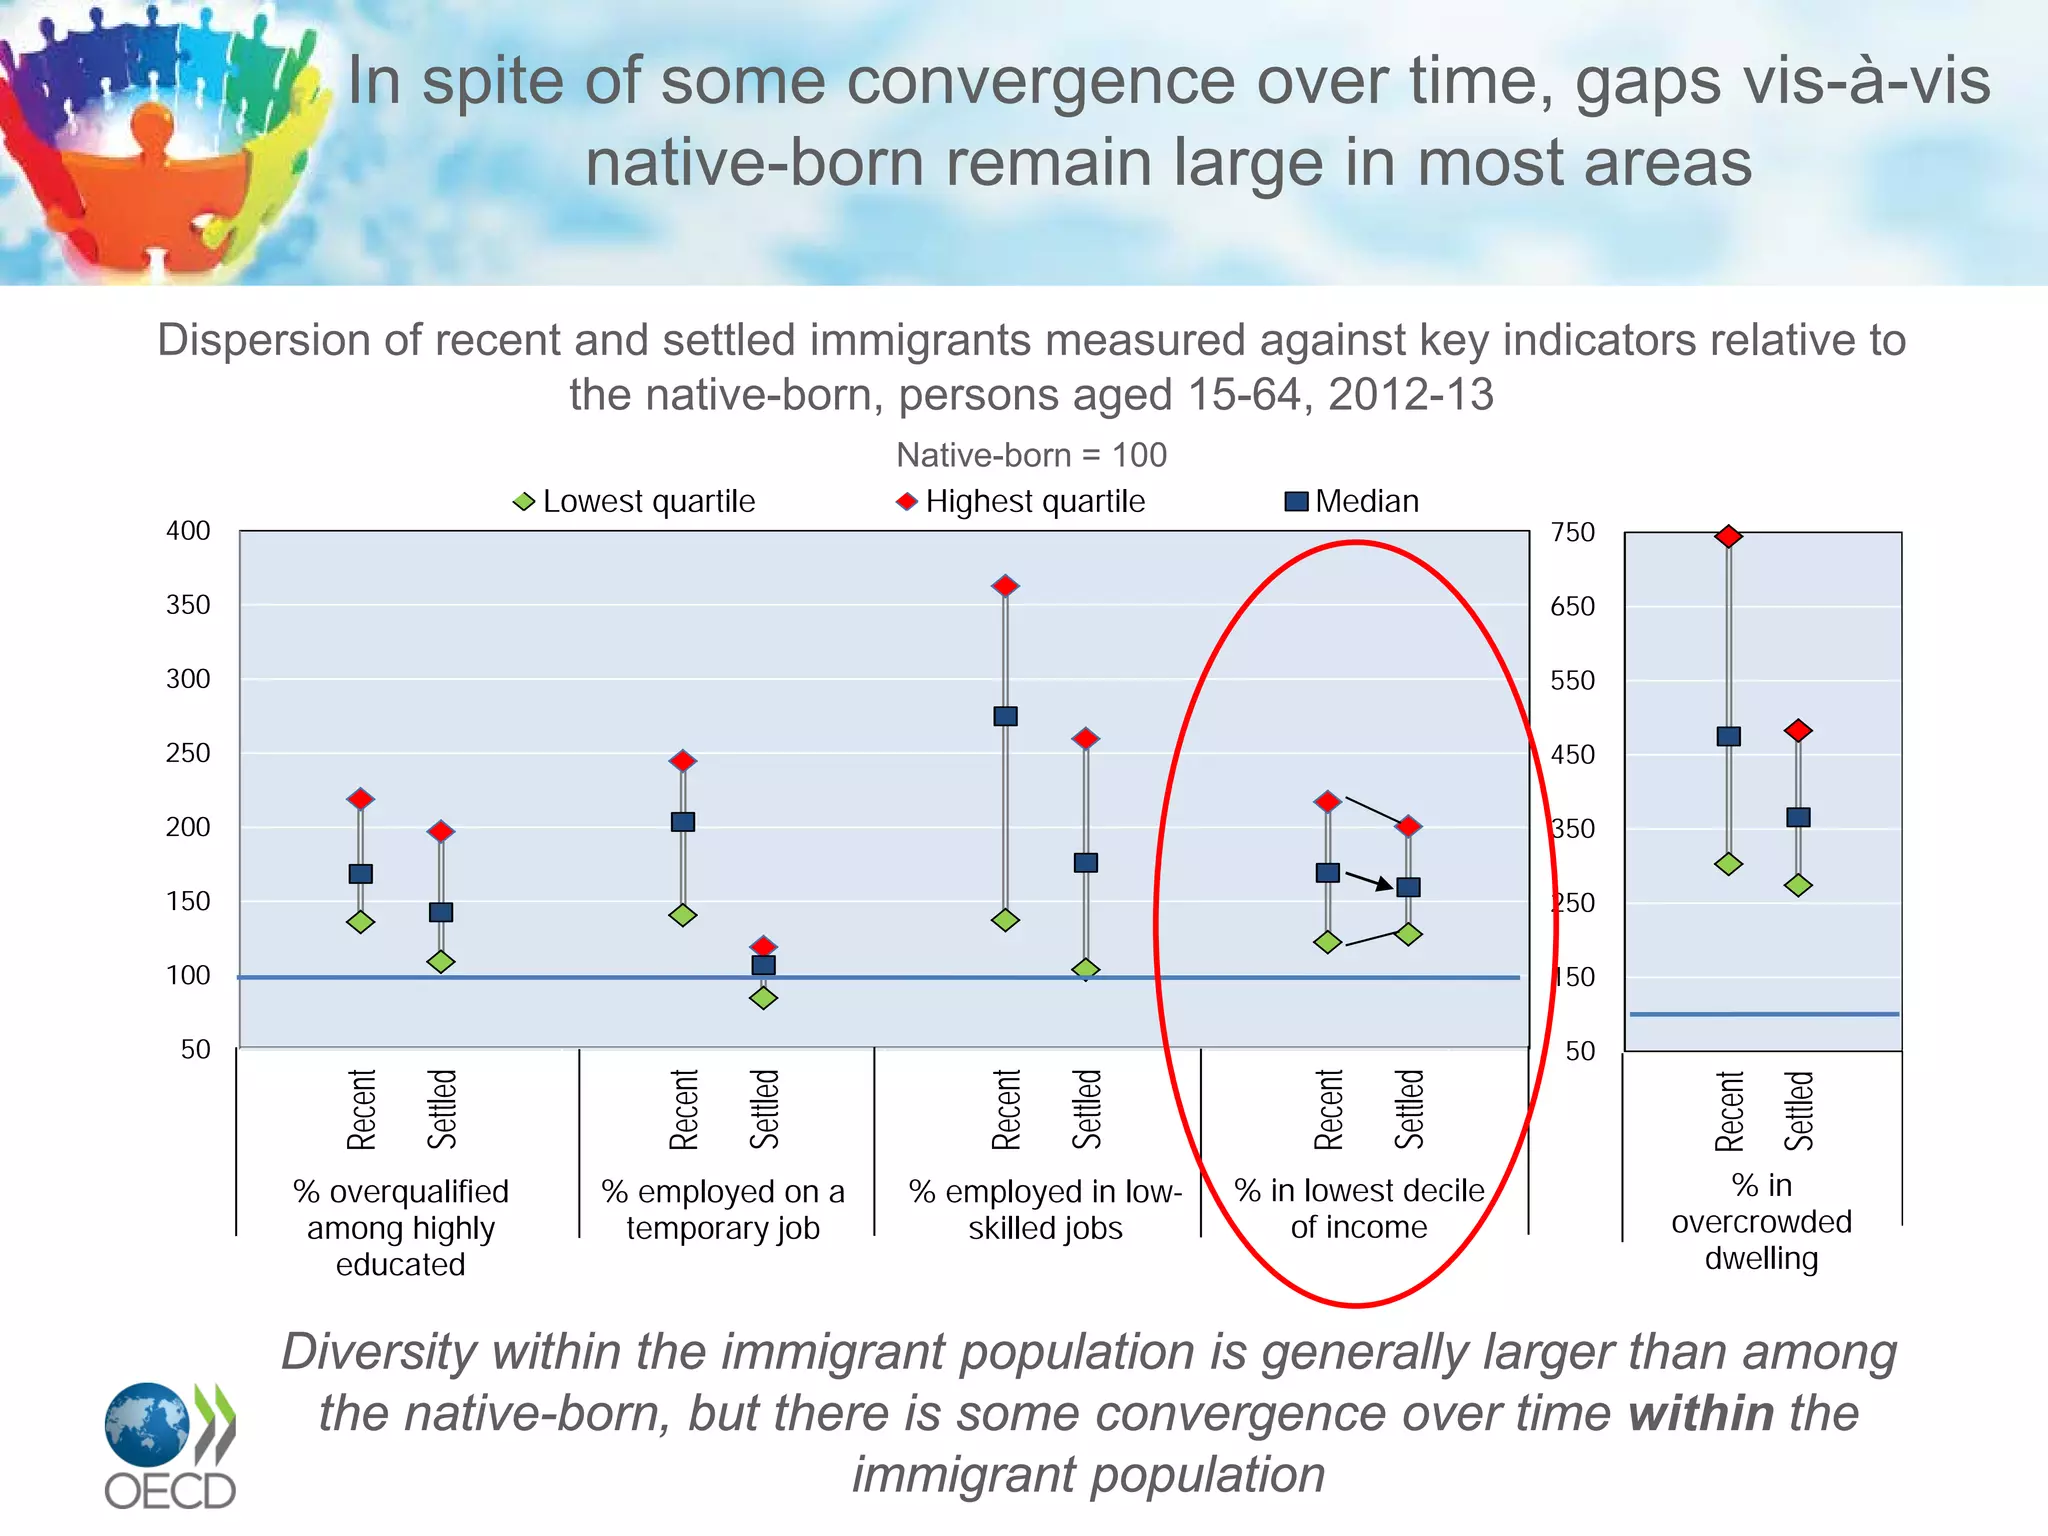
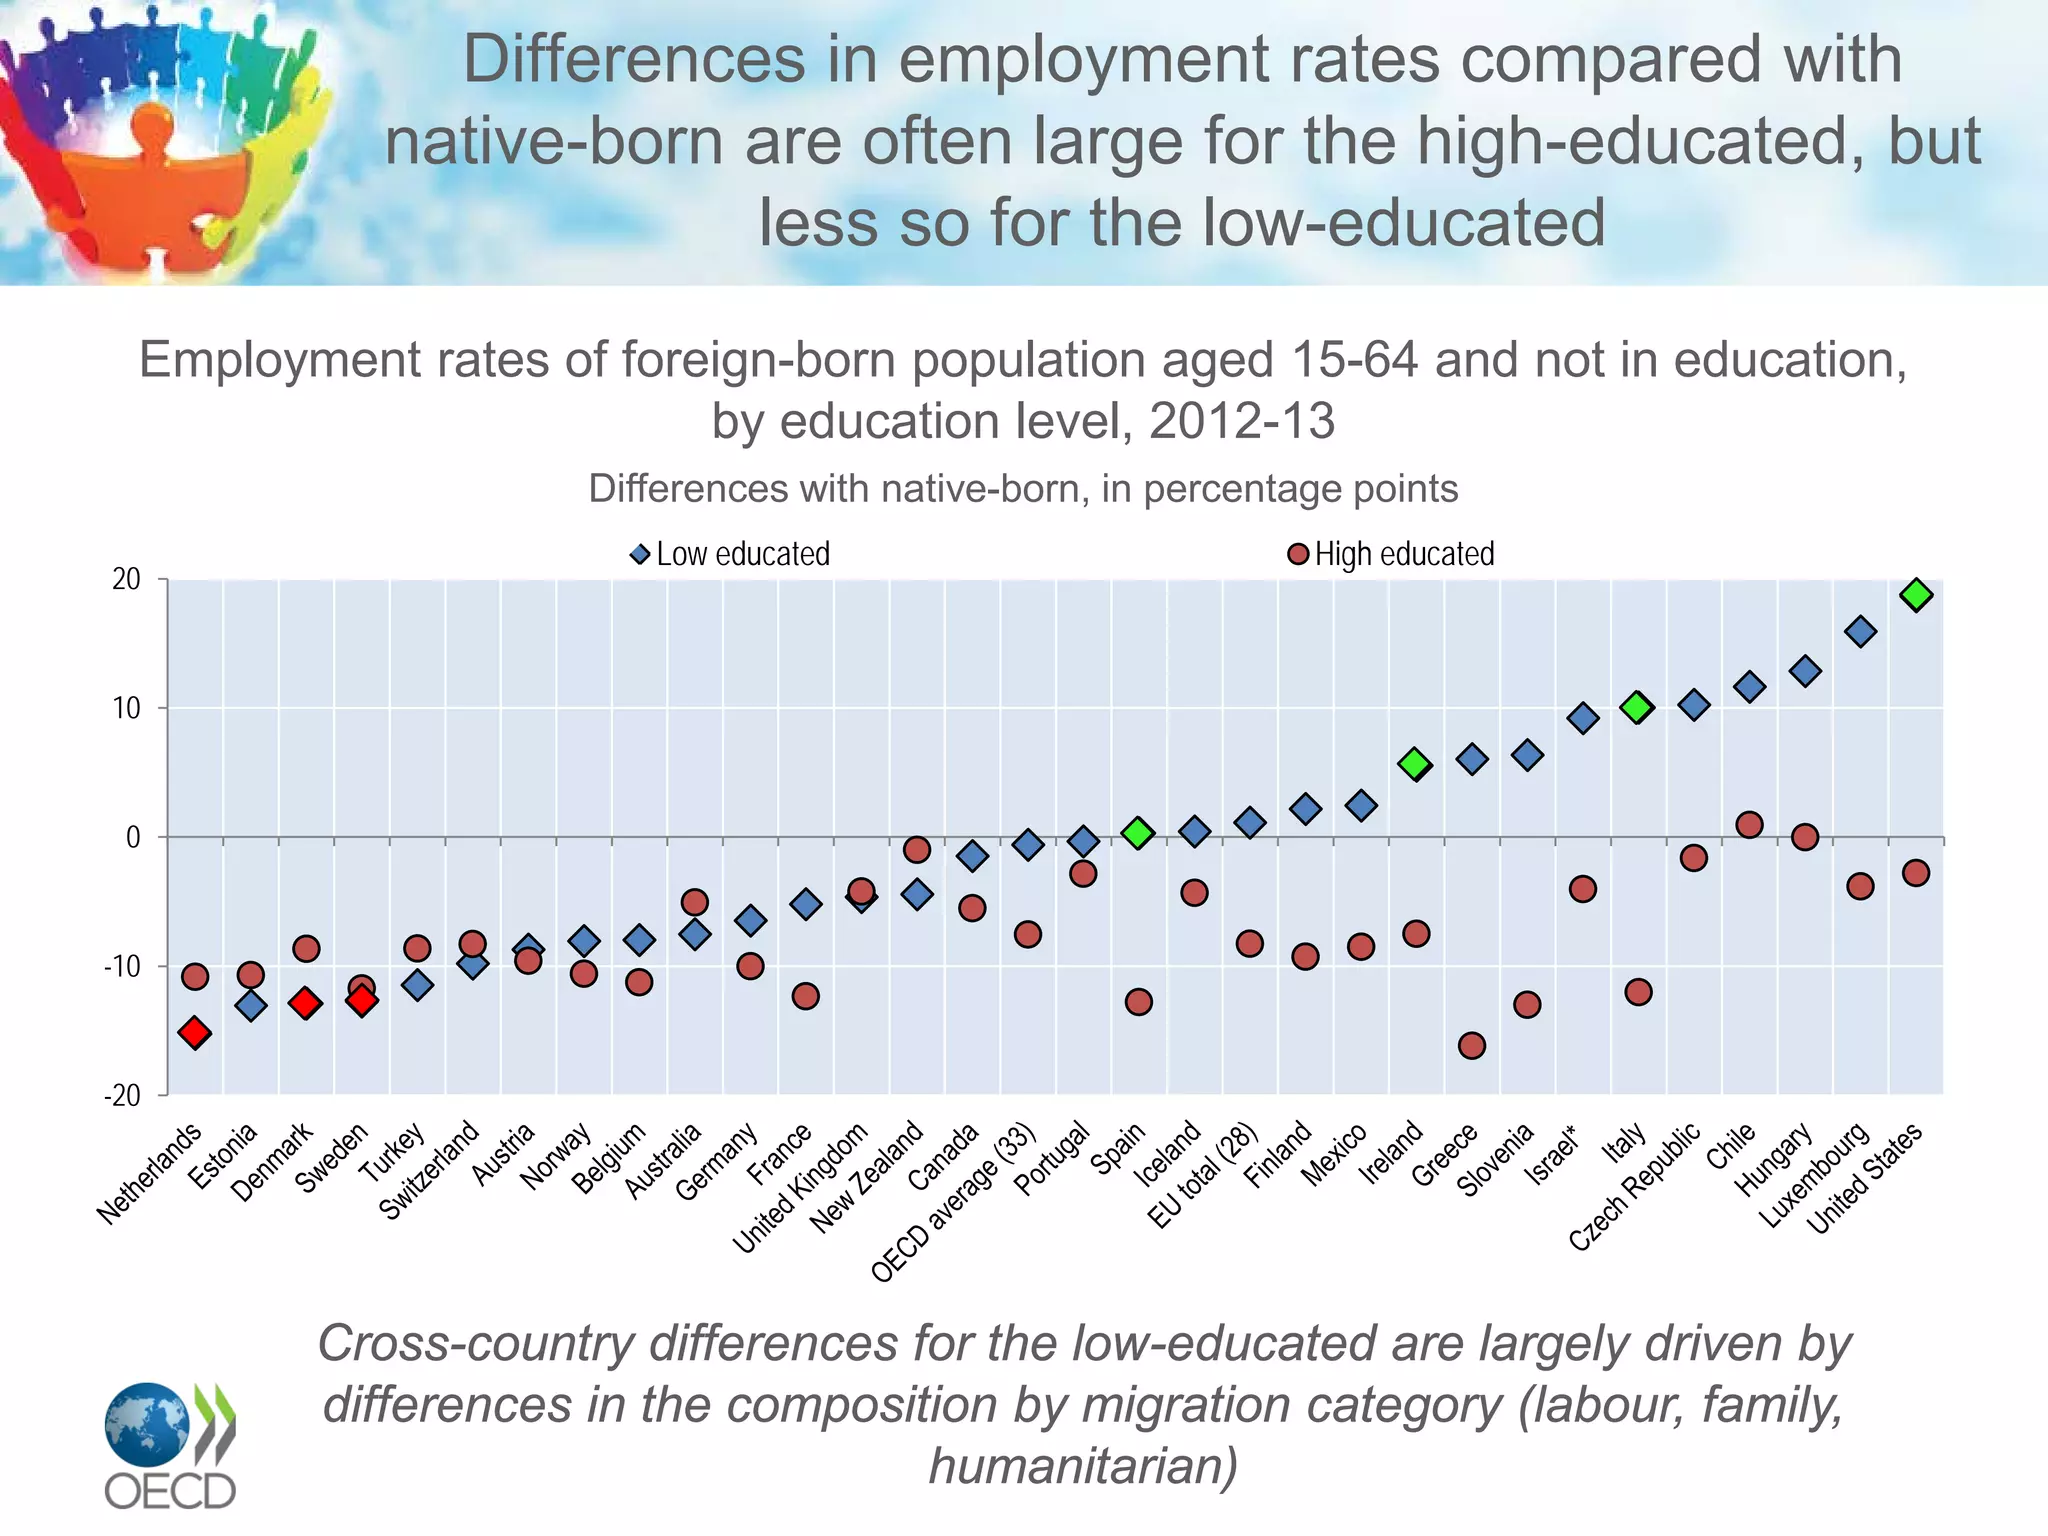
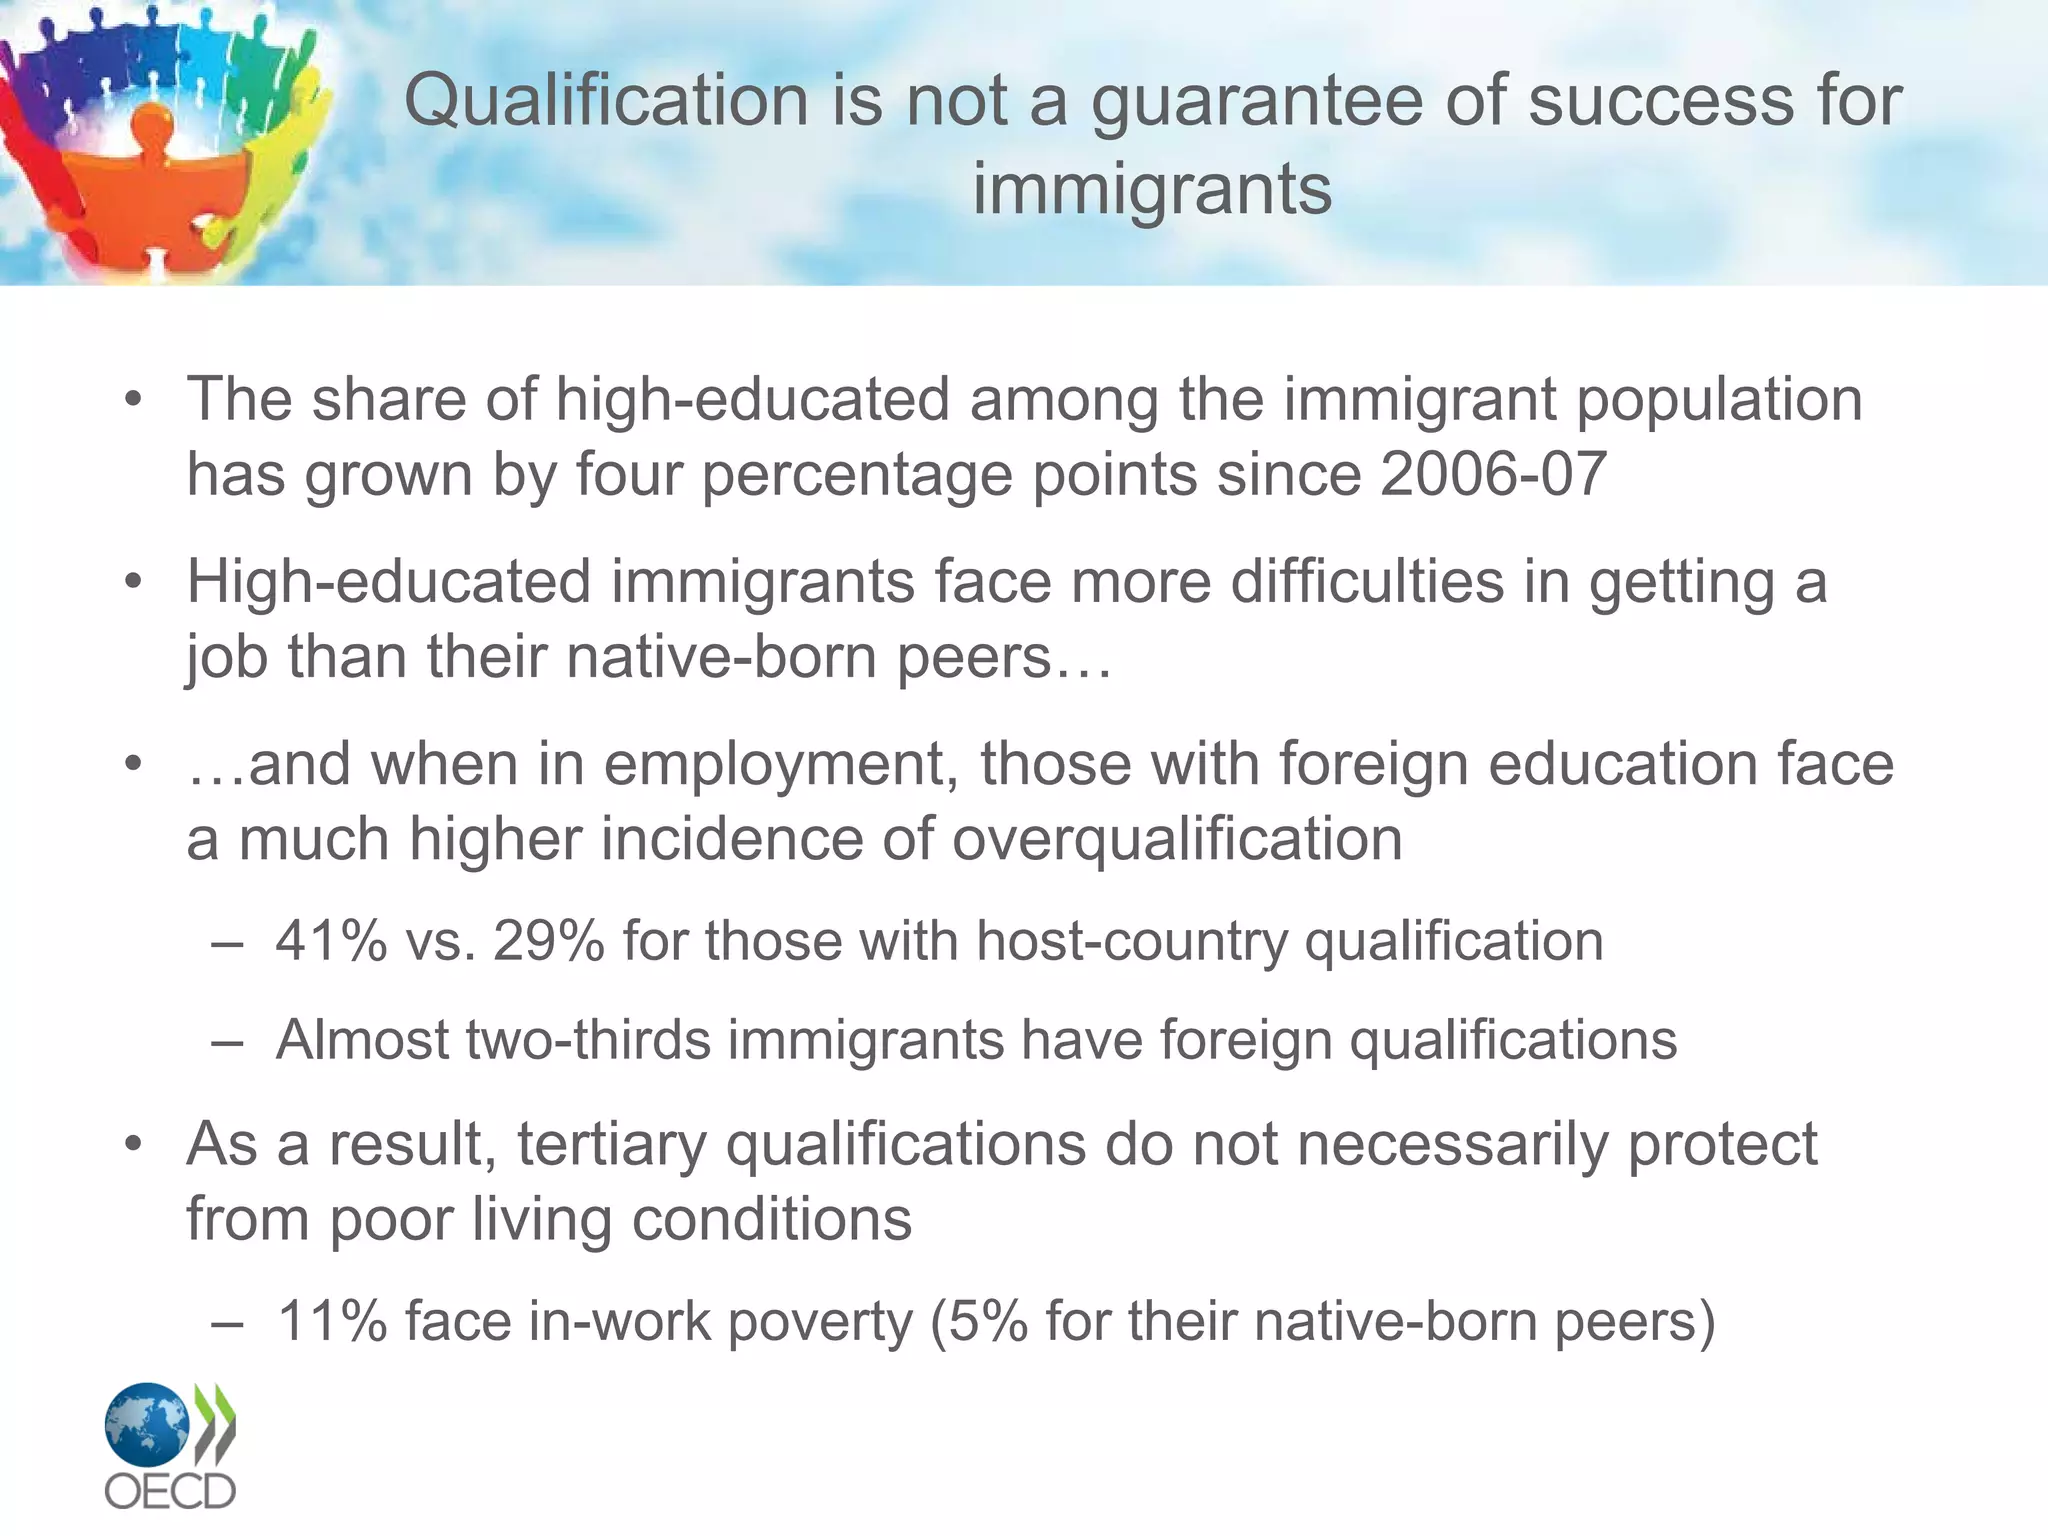
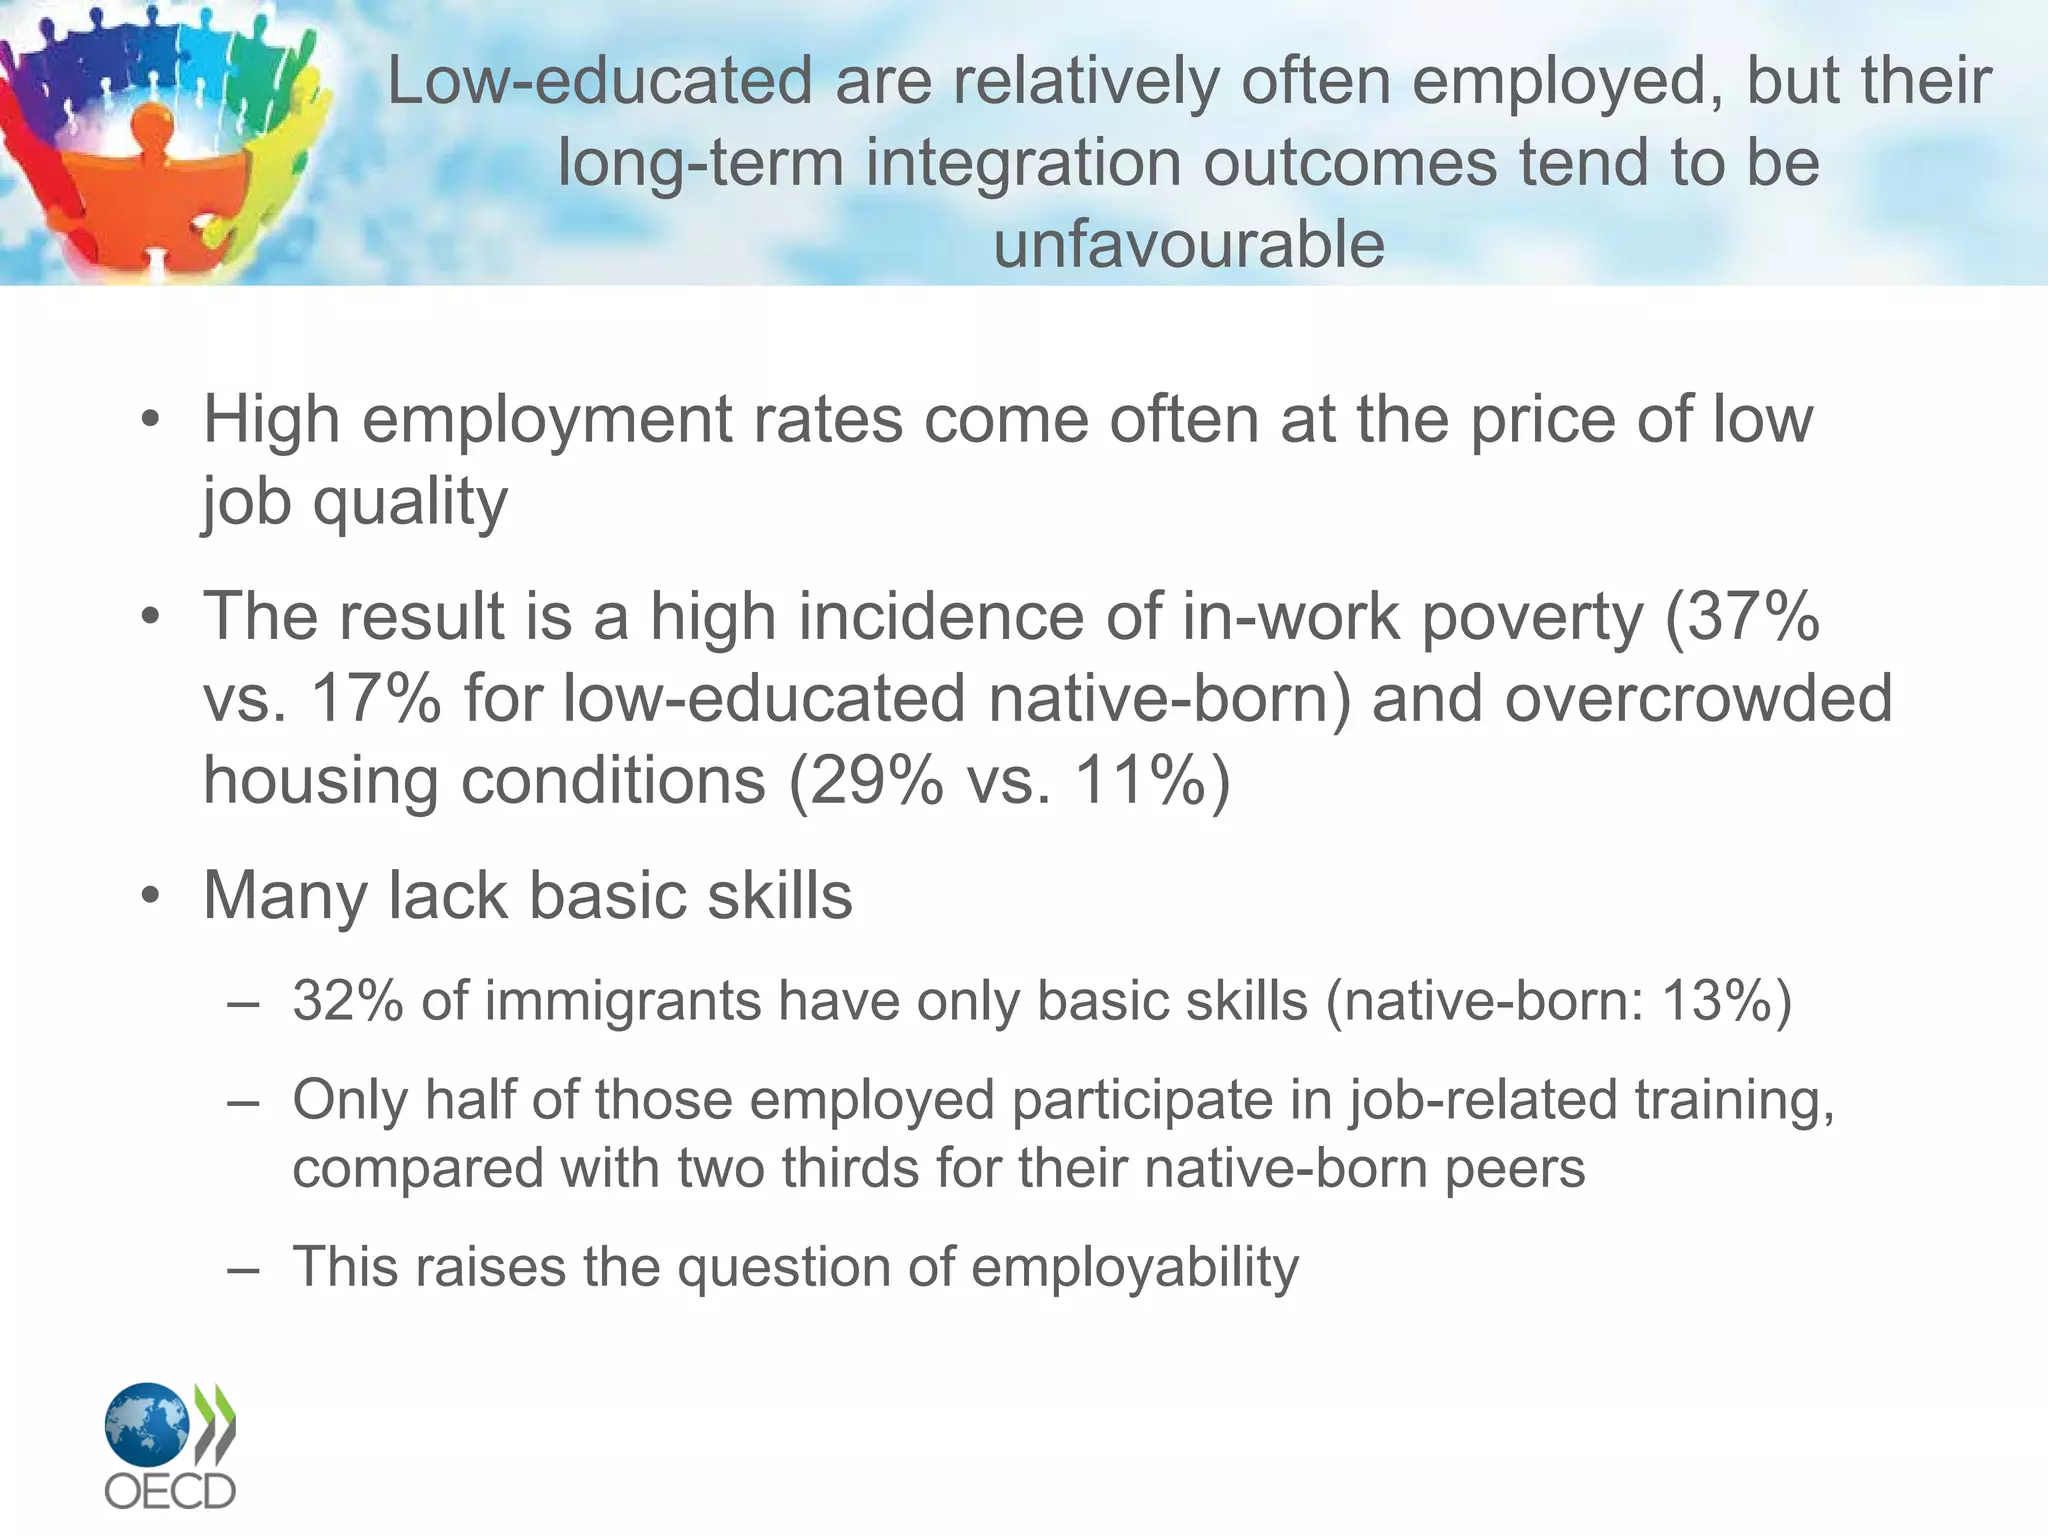
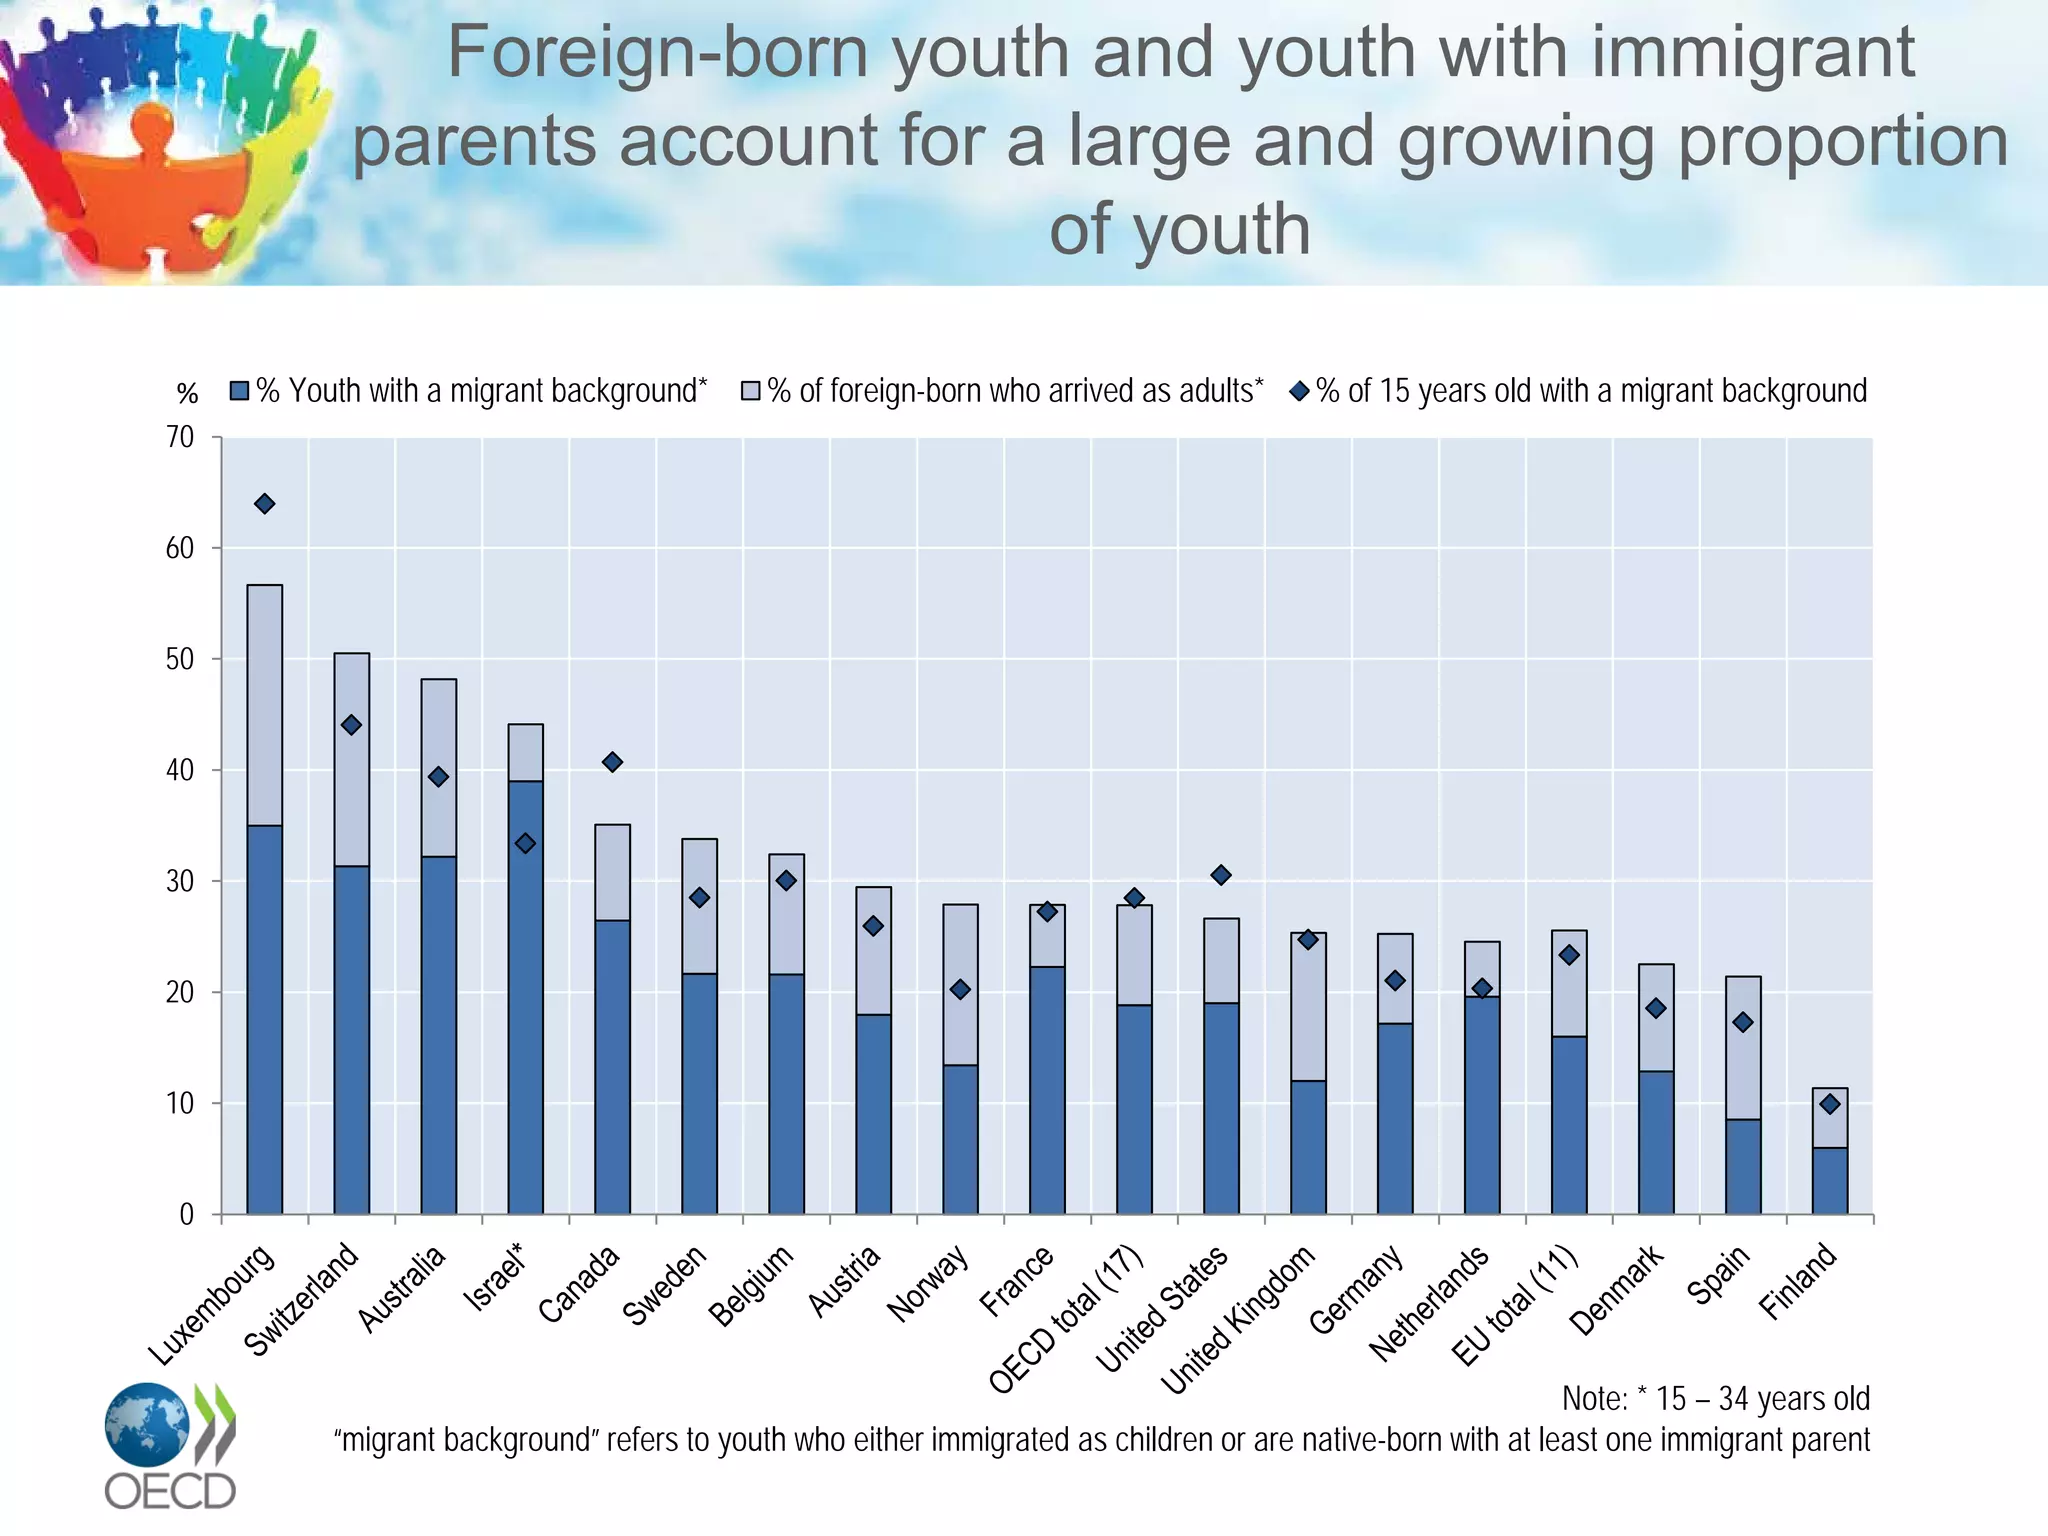
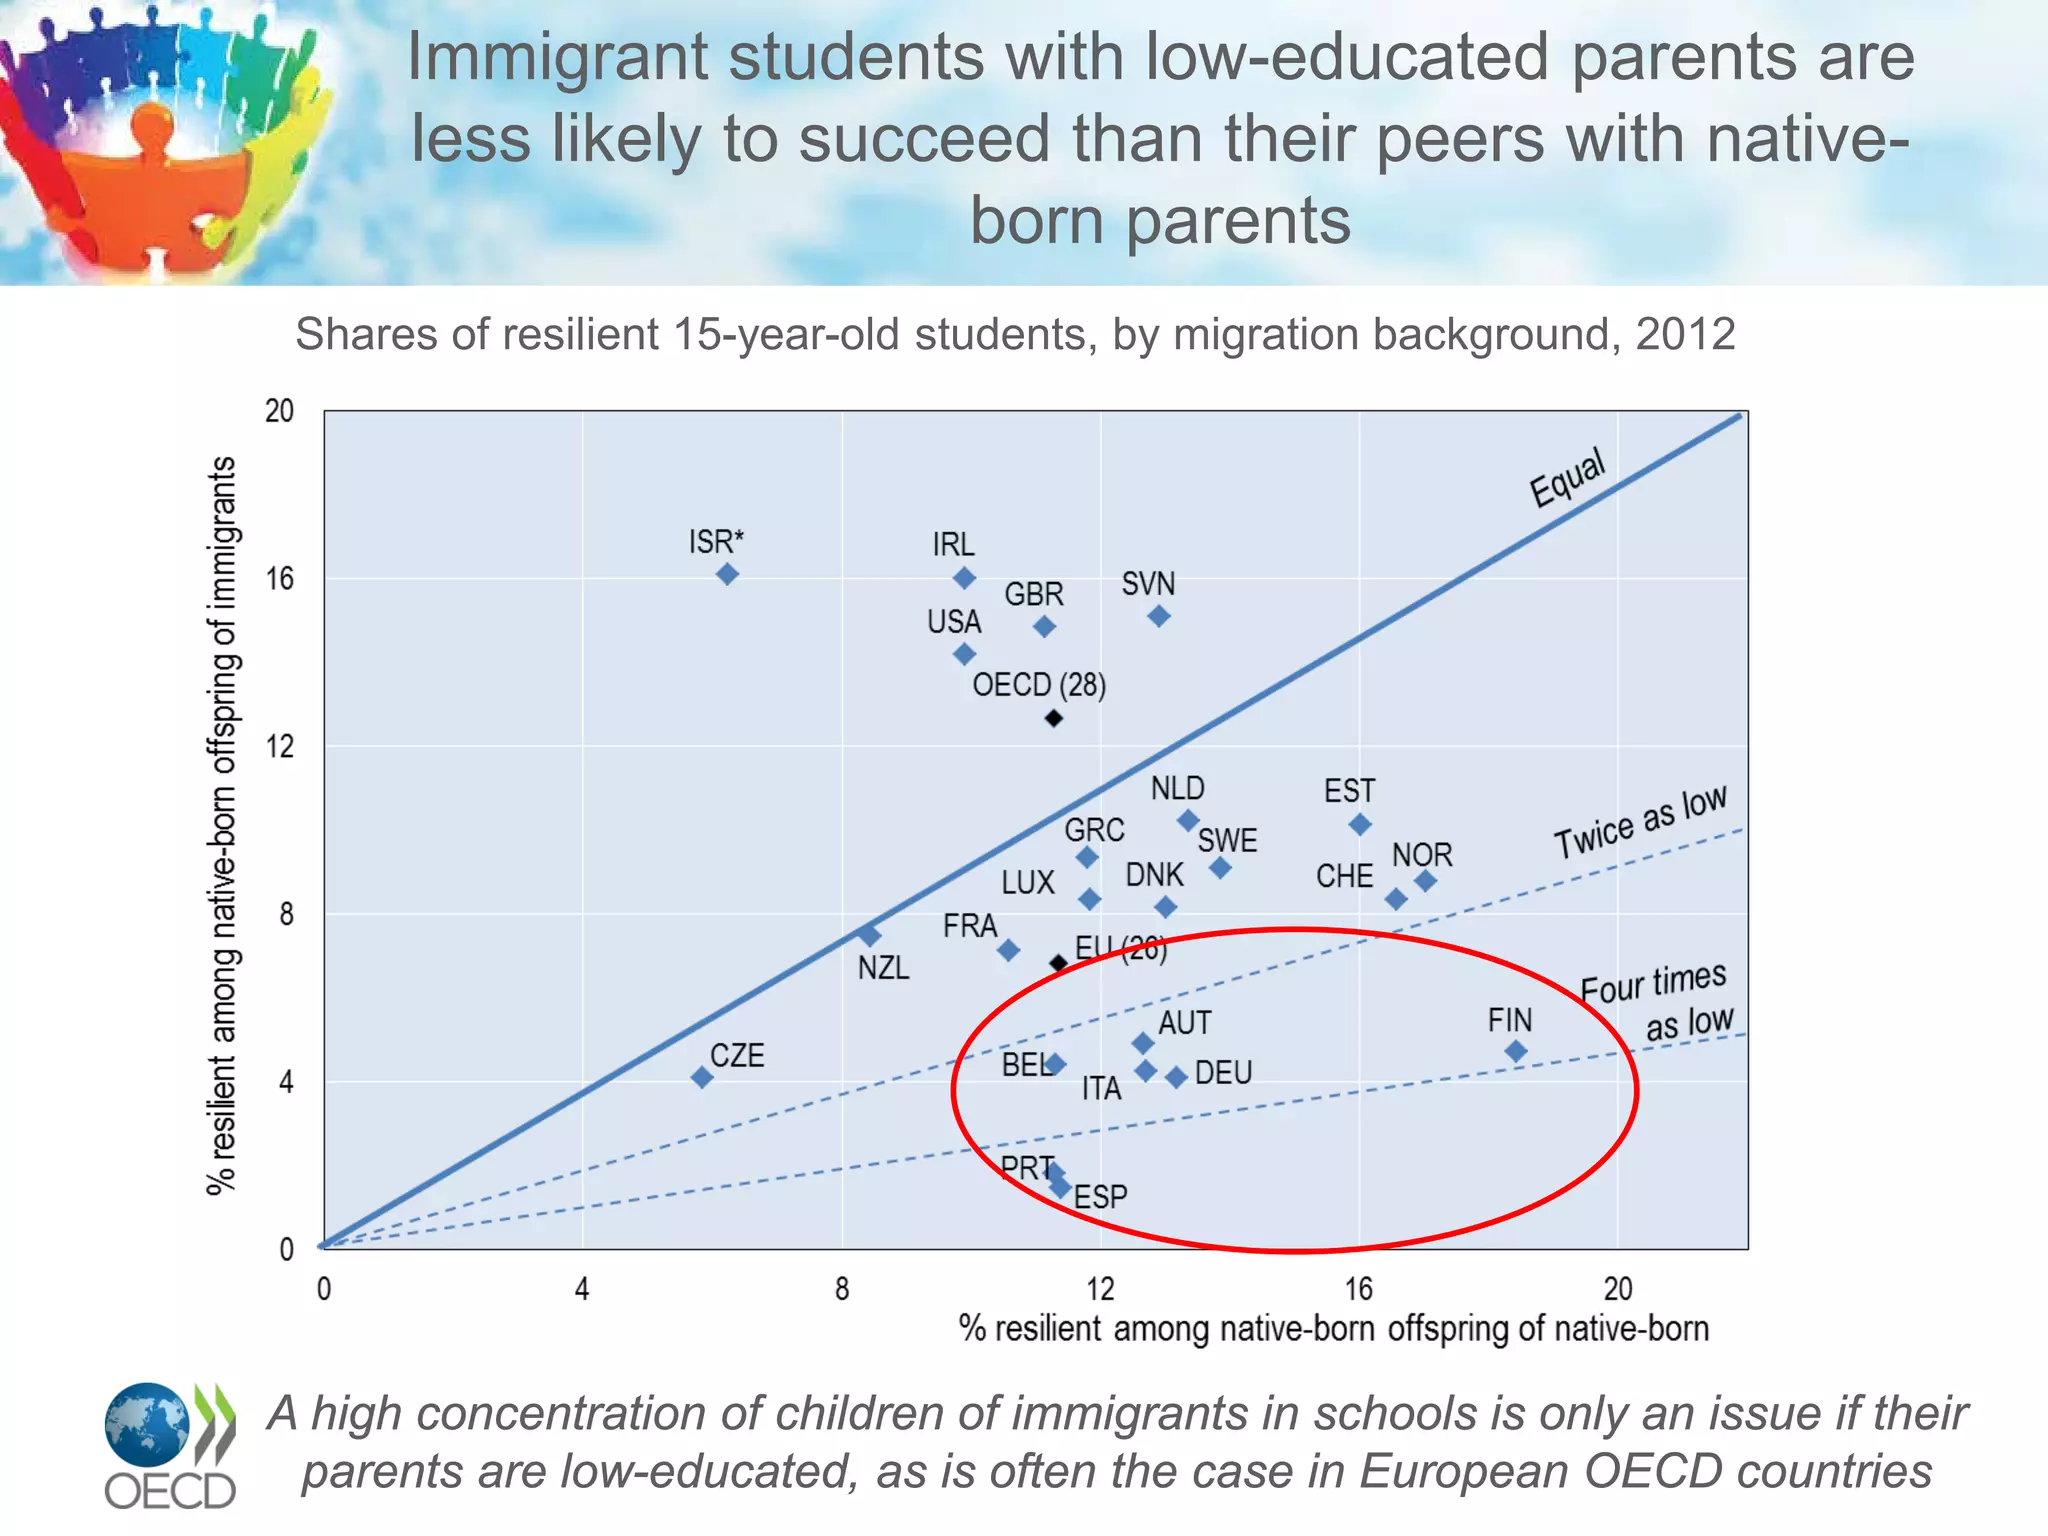
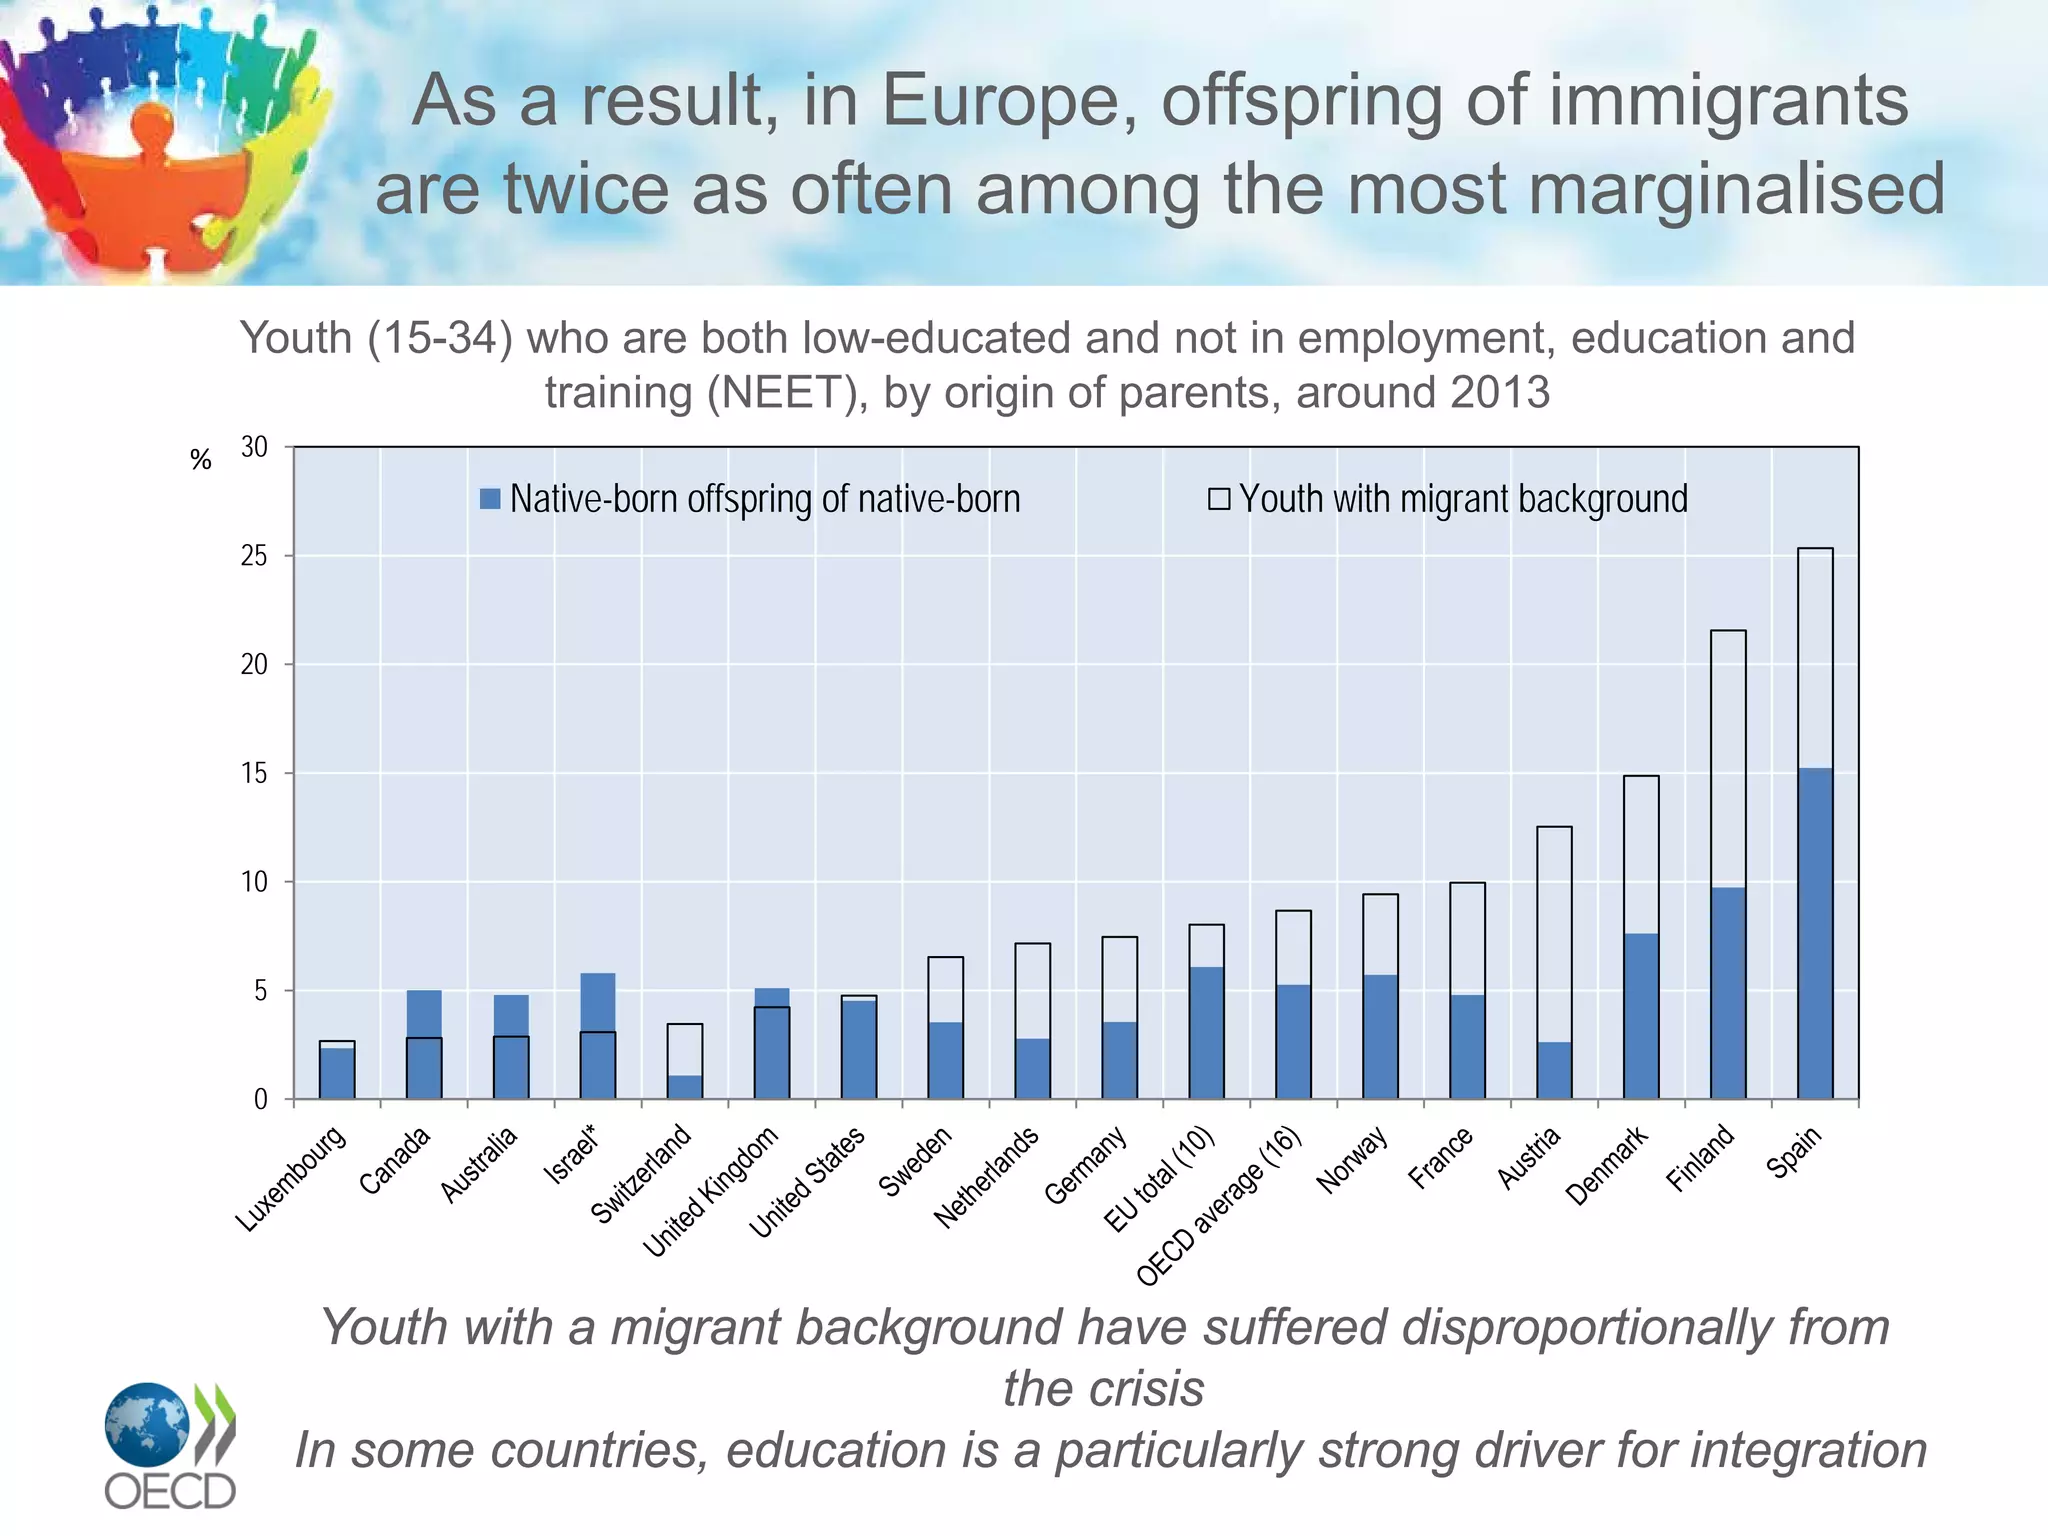
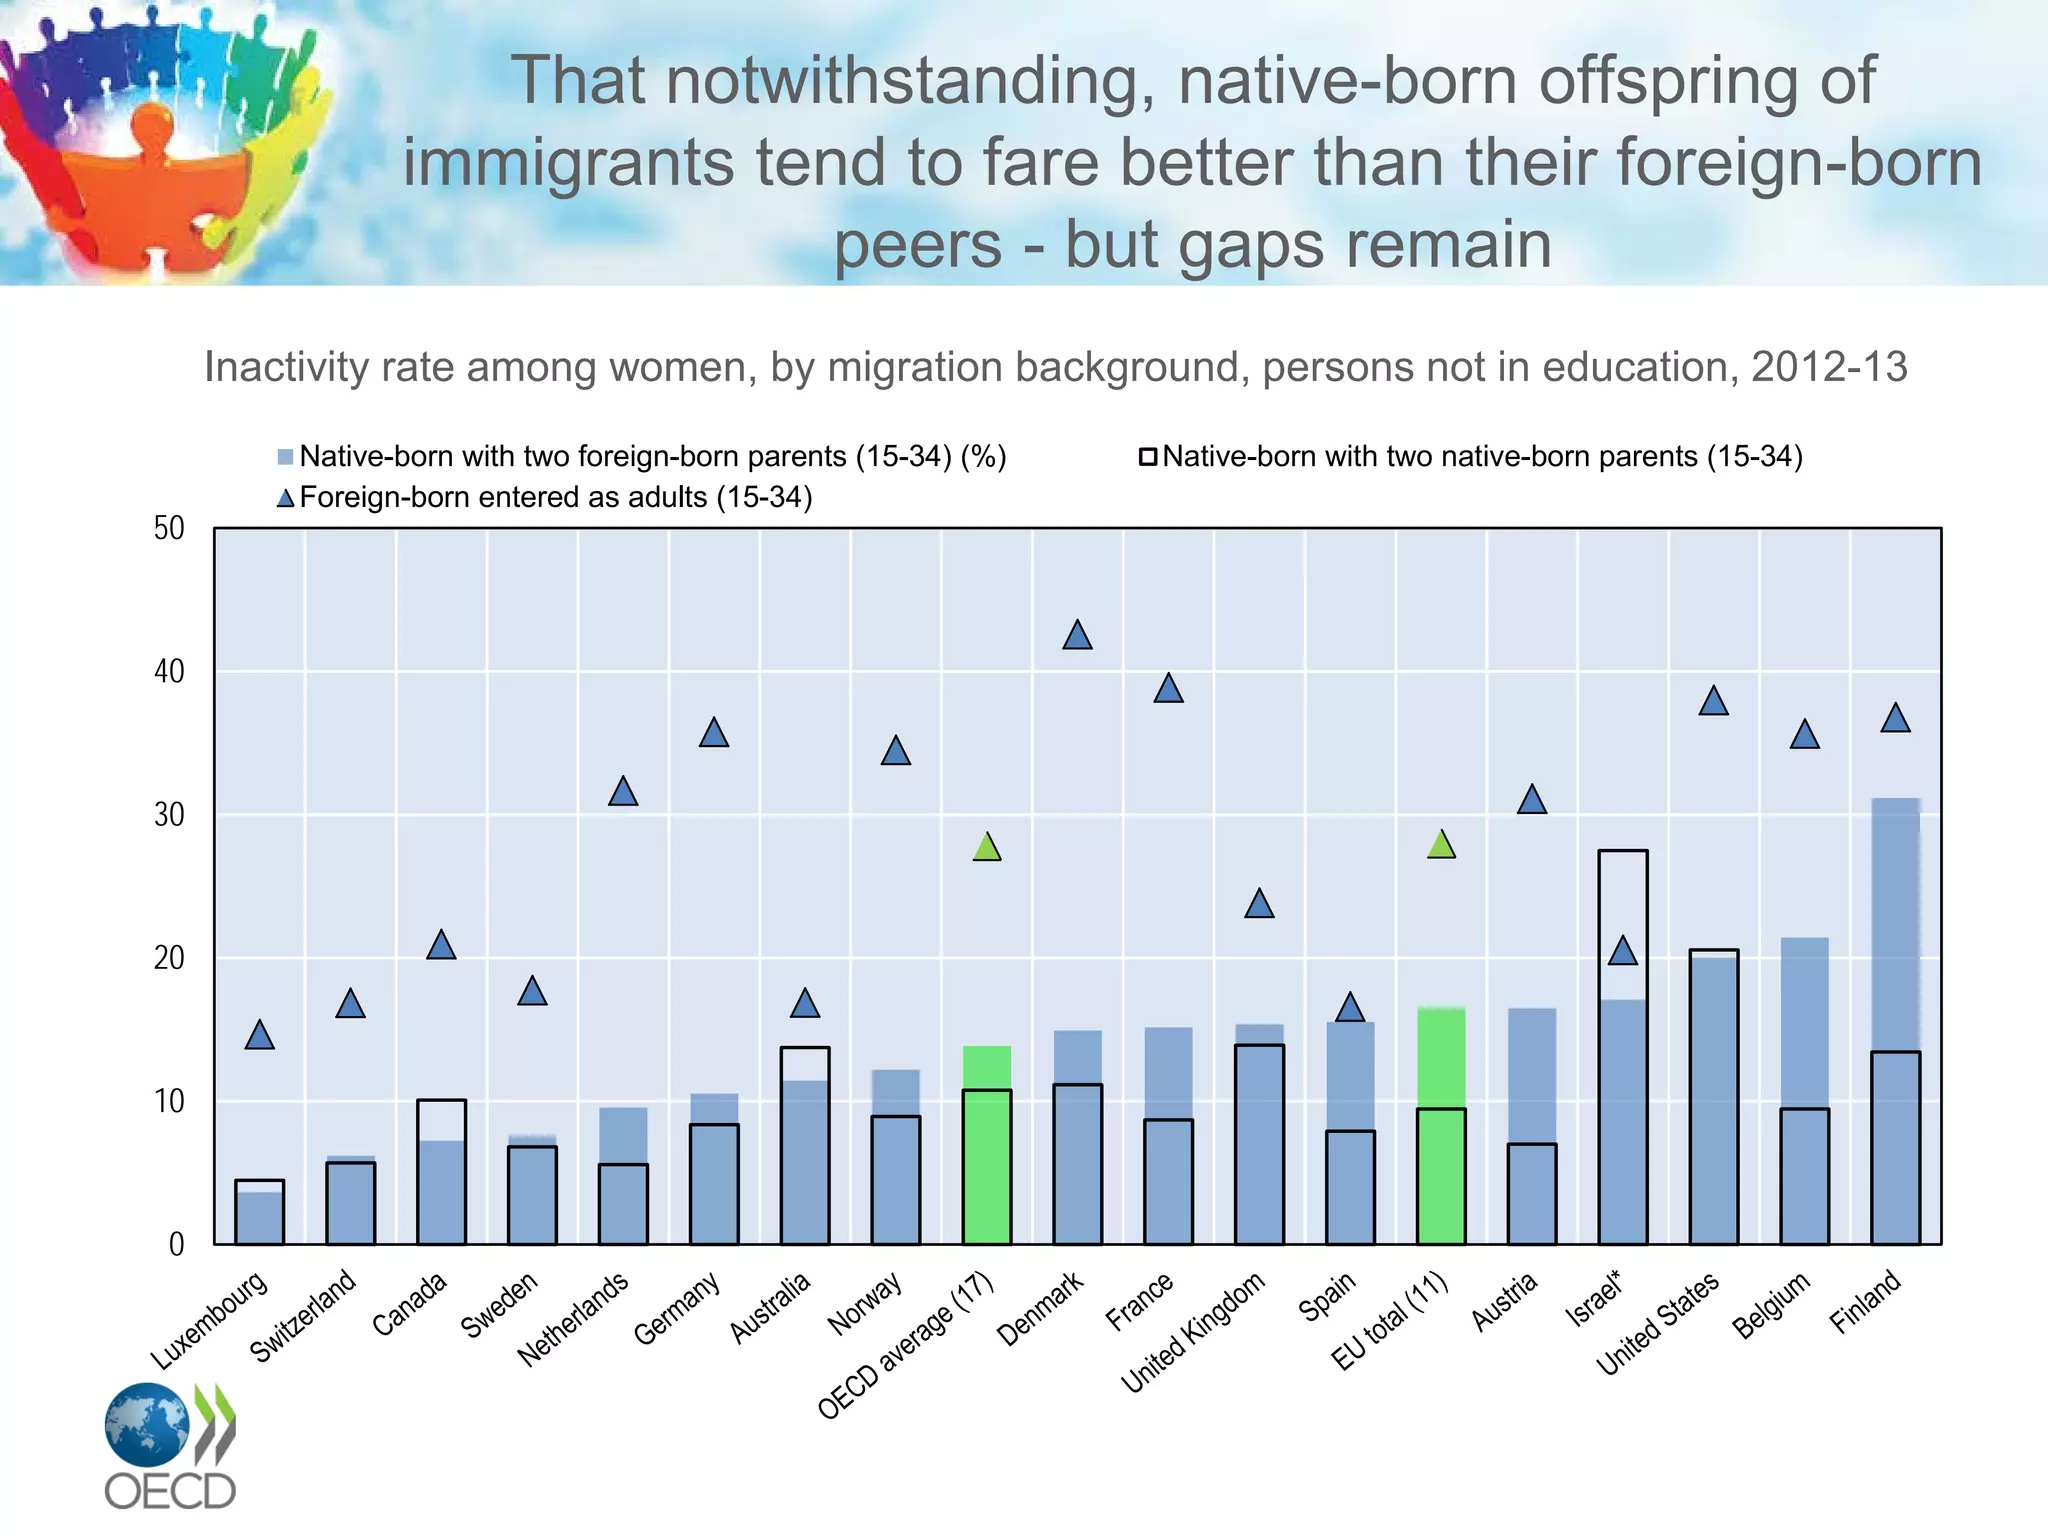
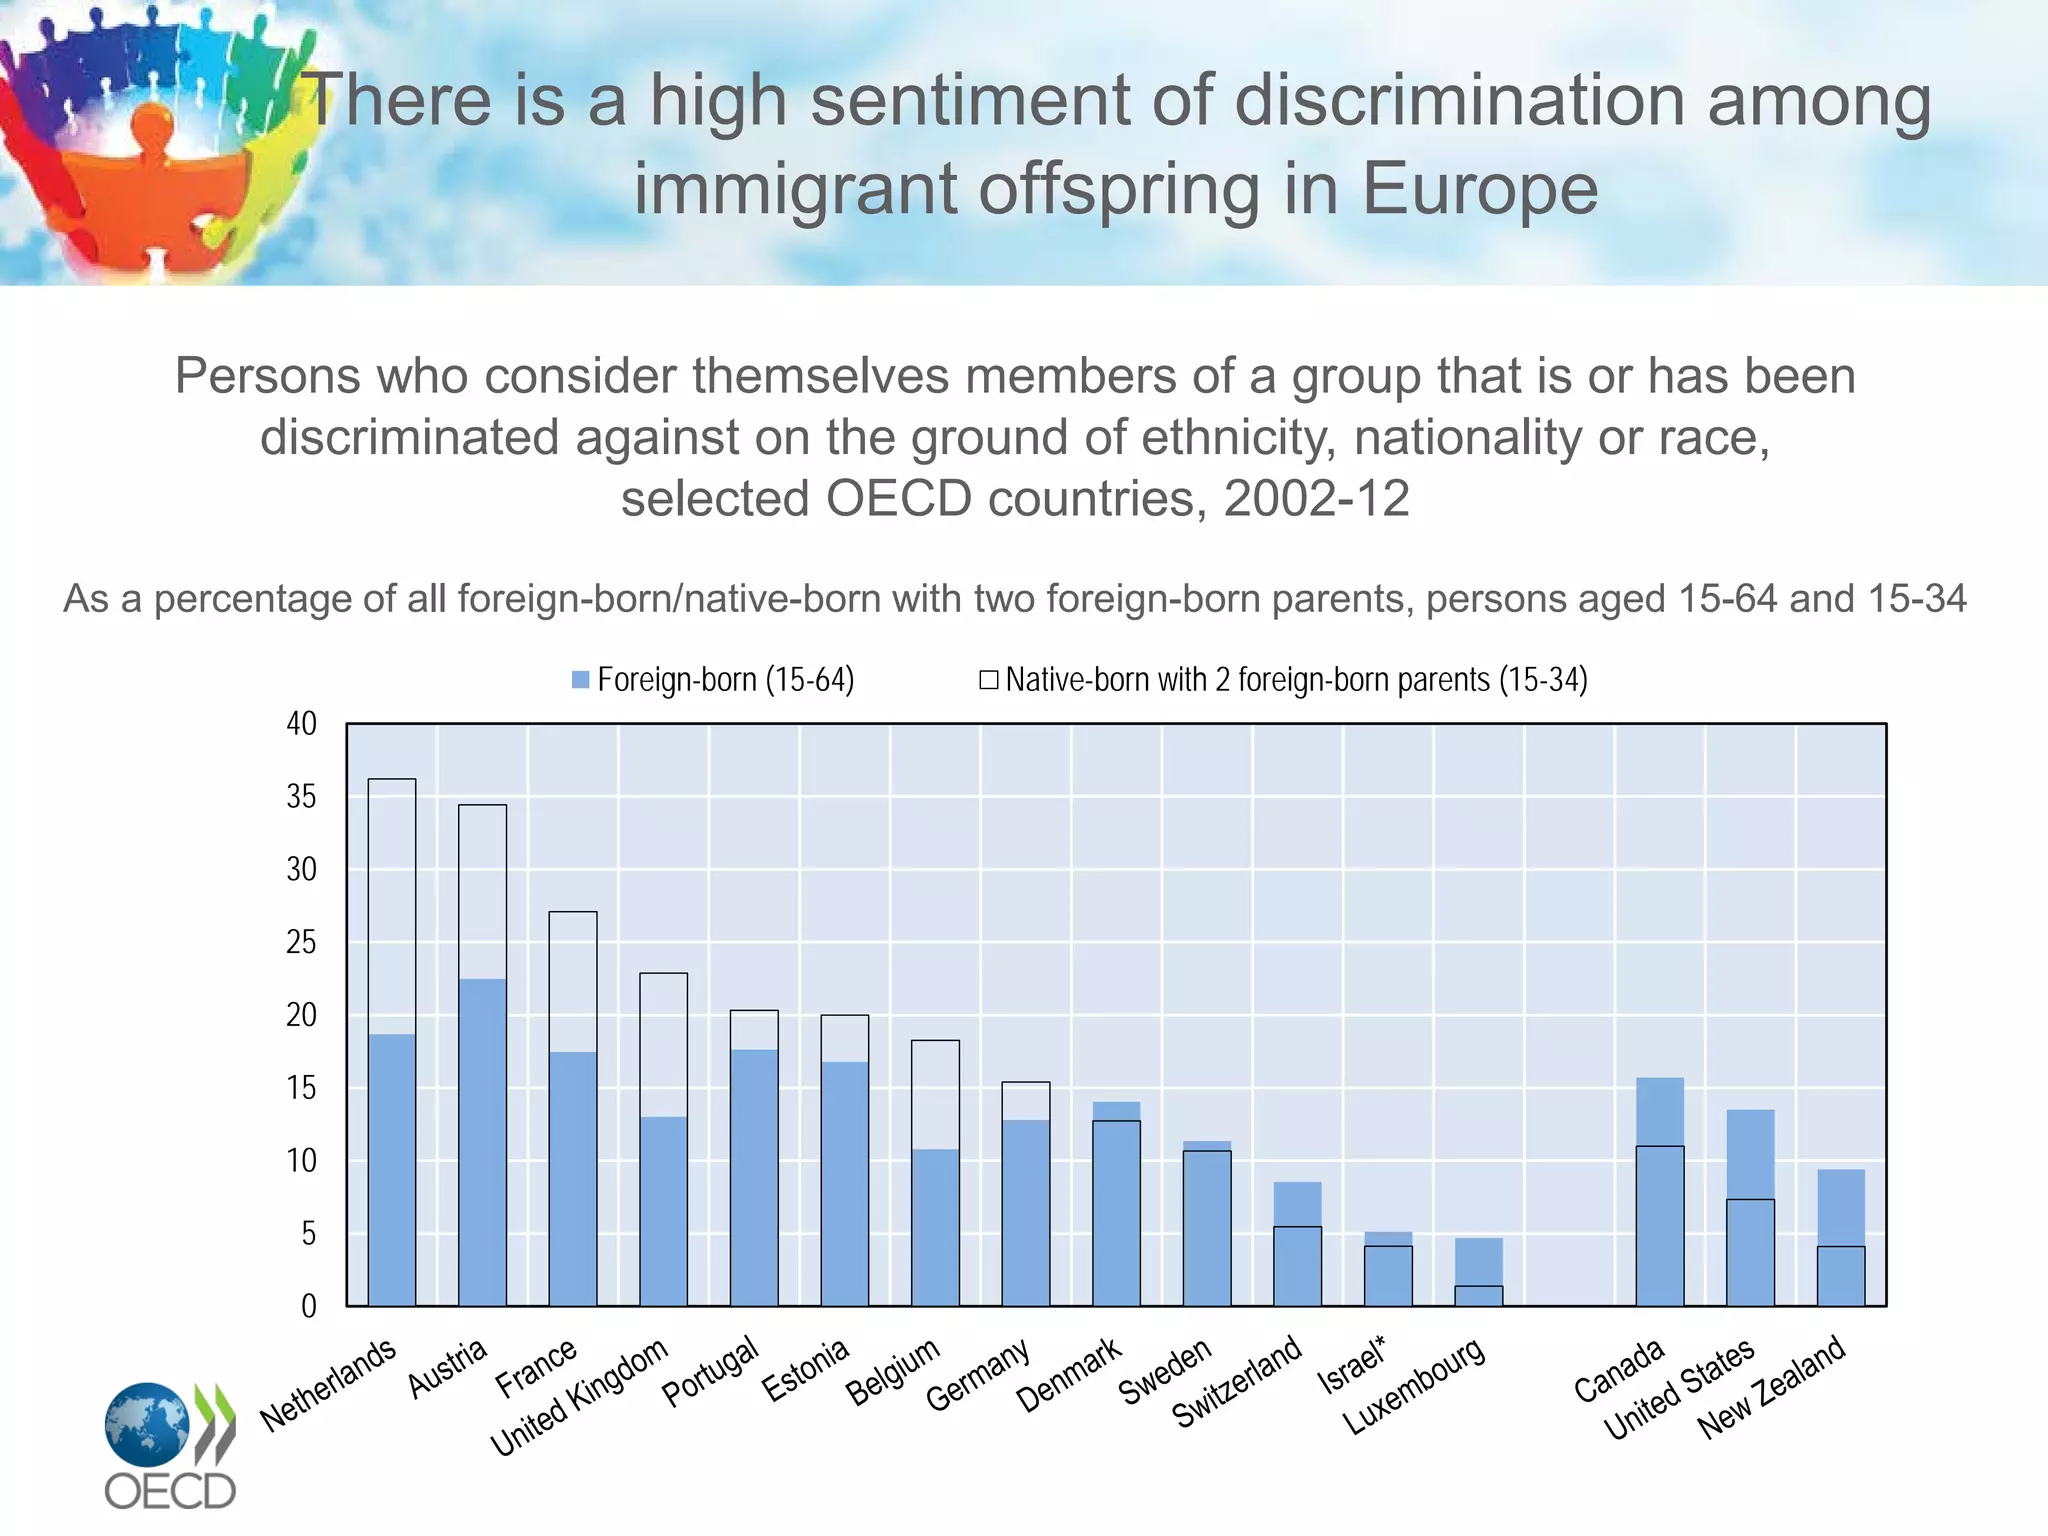
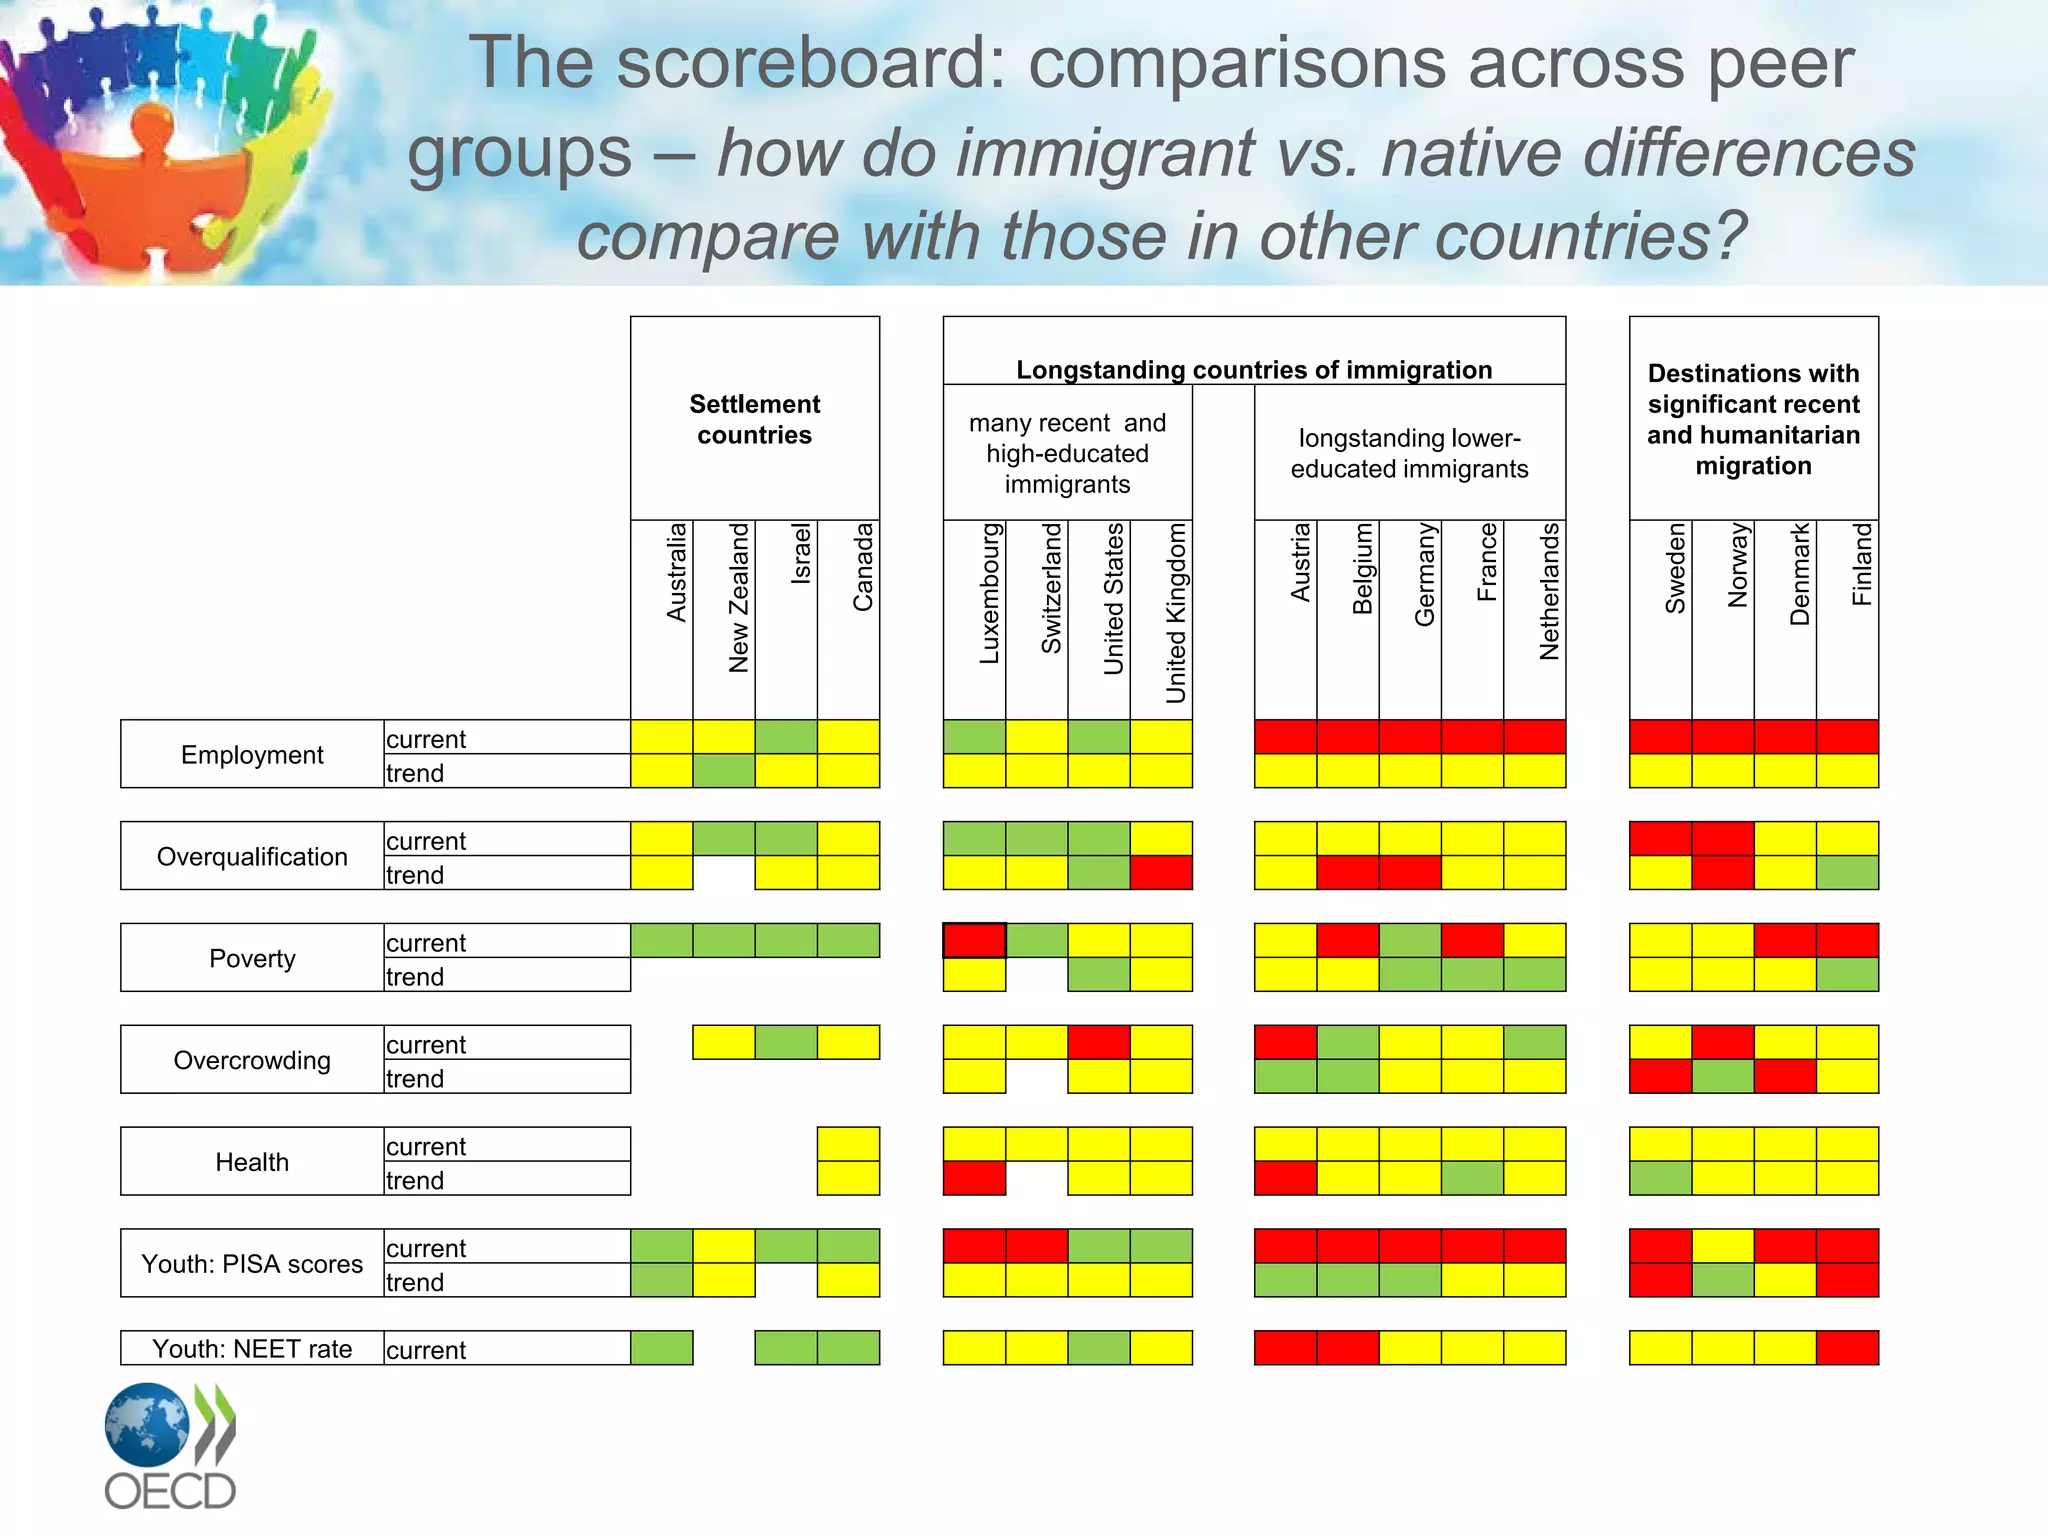
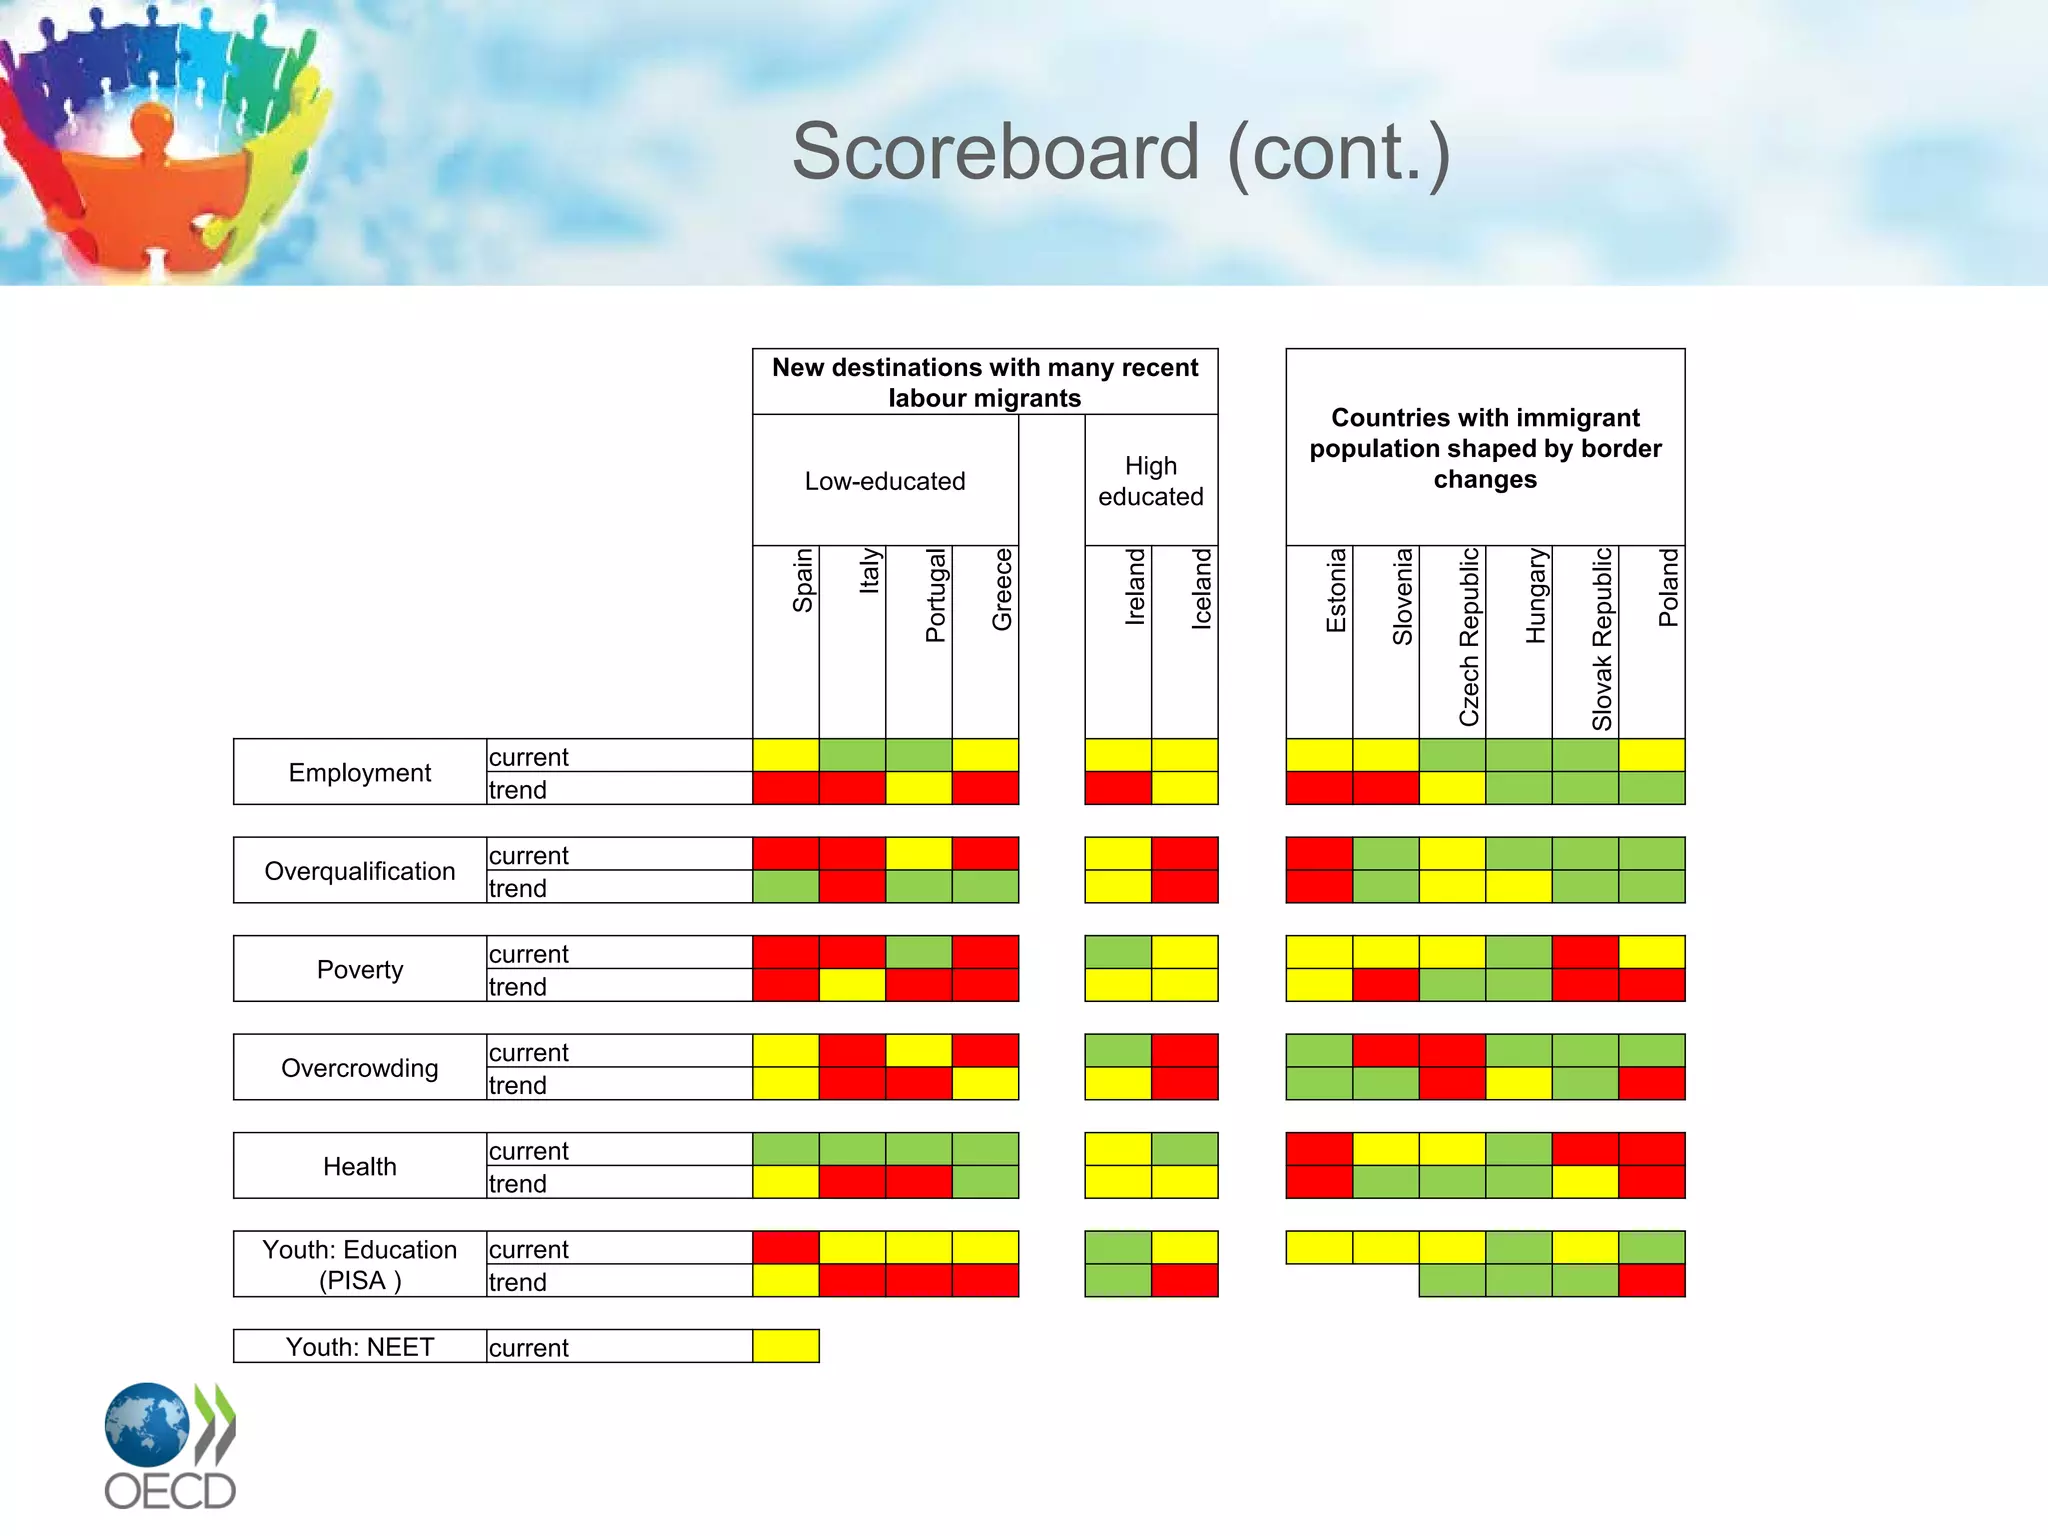
This document provides an overview and analysis of indicators related to immigrant integration across OECD and EU countries. It examines integration outcomes for immigrants and their children across five areas: employment, education/skills, social inclusion, civic engagement, and social cohesion. Recent immigrants generally have lower employment rates than native-born individuals or settled immigrants. Highly educated immigrants also face challenges finding jobs that match their qualifications. Immigrant youth and children of immigrants make up a large share of the youth population in many countries. Offspring of low-educated immigrant parents tend to have less successful educational outcomes. Discrimination is a concern for many immigrant communities. The document concludes with a "scoreboard" comparing integration outcomes across different peer groups of countries.


