1. US Update
No recession, but slower growth
Nordea Research, 29 November 2011
While the US economy looks healthier in the near
No US recession unless the Euro-area
term, there are reasons to believe that growth will
financial crisis turns out to be more severe
slow in H1 2012.
than assumed.
First, the financial crisis in the Euro area is
Another credit crunch is a risk that will
likely to act as a drag on US growth.
hang over the US economy until the
Second, considering the decline in net wealth
problems in Europe are resolved once
and sustained high unemployment US
and for all.
households are unlikely to continue dipping
US fiscal policy is another significant into their savings to increase spending.
threat to our relatively optimistic story for Third, increasing federal fiscal restraint
the US economy. suggests growth is likely to slow in the near
The pick-up in GDP growth in H2 2011 will term.
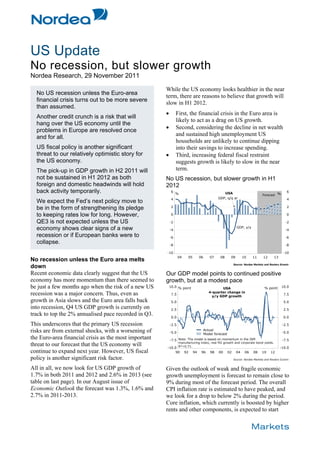
not be sustained in H1 2012 as both No US recession, but slower growth in H1
foreign and domestic headwinds will hold 2012
back activity temporarily. 6
% USA 6
Forecast %
4 GDP, q/q ar 4
We expect the Fed’s next policy move to
2 2
be in the form of strengthening its pledge
to keeping rates low for long. However, 0 0
QE3 is not expected unless the US -2 -2
GDP, y/y
economy shows clear signs of a new -4 -4
recession or if European banks were to -6 -6
collapse. -8 -8
-10 -10
04 05 06 07 08 09 10 11 12 13
No recession unless the Euro area melts
Source: Nordea Markets and Reuters Ecowin
down
Recent economic data clearly suggest that the US Our GDP model points to continued positive
economy has more momentum than there seemed to growth, but at a modest pace
be just a few months ago when the risk of a new US
recession was a major concern. Thus, even as
growth in Asia slows and the Euro area falls back
into recession, Q4 US GDP growth is currently on
track to top the 2% annualised pace recorded in Q3.
This underscores that the primary US recession
risks are from external shocks, with a worsening of
the Euro-area financial crisis as the most important
threat to our forecast that the US economy will
continue to expand next year. However, US fiscal
policy is another significant risk factor.
All in all, we now look for US GDP growth of Given the outlook of weak and fragile economic
1.7% in both 2011 and 2012 and 2.6% in 2013 (see growth unemployment is forecast to remain close to
table on last page). In our August issue of 9% during most of the forecast period. The overall
Economic Outlook the forecast was 1.3%, 1.6% and CPI inflation rate is estimated to have peaked, and
2.7% in 2011-2013. we look for a drop to below 2% during the period.
Core inflation, which currently is boosted by higher
rents and other components, is expected to start
2. declining in 2012 towards 1.5% as economic slack activity, as well as a significant slowdown in global
will remain high. growth.
It is encouraging that despite the economic
Foreign headwinds
slowdown seen in H1 2011 and the uncertainty
Looking only at the trade linkages, the Euro-area
generated by the debt ceiling debacle and resulting
crisis is not much of a threat to the US. US exports
credit rating downgrade of US Treasuries over the
to the GIIPS (Greece, Italy, Ireland, Portugal and
summer, US banks have not tightened their lending
Spain) amount to only 0.2% of US GDP, while US
standards. But the real danger is that the events in
exports to the whole Euro area are only 1.6% of US
Europe trigger a sharp fall in the willingness of US
exports (see table).
banks to lend.
US exposure to the Euro area
Financial and trade links in Q2 2011 (USDbn and % of GDP) Another credit crunch is a risk that will hang over
GIIPS Rest of Euro area Total
Trade
the US economy until the problems in Europe are
US exports
US imports
37
94
0.2%
0.6%
164
206
1.3%
1.4%
200
300
1.6%
2.0%
resolved once and for all.
Finance
Foreign claims of US banks 181 1.2% 705 4.7% 886 5.9% Banks’ Tier 1 capital ratio at a record high
- Public sector 26 0.2% 109 0.7% 135 0.9%
- Banks 64 0.4% 375 2.5% 439 2.9%
Other potential exposures 587 3.9% 1,328 8.8% 1,915 12.8%
- Guarantees extended (CDS) 1 518 3.4% 1,118 7.4% 1,636 10.9%
Total financial risk 767 5.1% 2,033 13.5% 2,800 18.7%
1) Measured in terms of gross notional values of CDS sold by
US banks. Source: BIS, Nordea Markets and Reuters Ecowin.
Thus, a mild recession in line with our forecast for
the Euro area – or even a severe recession – is
unlikely by itself to pull the US economy into
recession. (For more on our new Euro-area forecast,
see The Euro area in debt crisis maelstrom, 29
November 2011).
However, the financial linkages between the US
and the Euro area represent the much bigger threat Domestic headwinds
to the US economy. Thus, with US direct and Persistent domestic headwinds are also likely to
indirect financial exposure to the PIIGS estimated hold back activity in early 2012.
at USD 767bn (5.1% of US GDP) and to the whole The recent strength in US consumer spending
Euro area at around USD 2,800bn (18.7% of US growth has only been possible because households
GDP) US banks are heavily exposed to the Euro have been willing to dip into their savings. Thus,
area. over the past year spending has increased at a faster
This clearly suggests that the unfolding crisis in the pace than disposable income. As a consequence, the
Euro area is by far the biggest threat to our savings rate has declined to 3.8% in Q3 2011,
relatively optimistic story for the US economy. which is the lowest level since the recession began,
down from its recent 6.2% peak.
While predicting the extent and timing of European
bank failures is impossible, our baseline scenario Recent GDP growth largely driven by
assumes that the Euro-area crisis is eventually consumer spending
resolved in an orderly manner. Hence, our forecast
that the US economy will gain more traction in H2
2012 is partly based on the assumption that the
European financial crisis will start abating during
H1 2012.
However, even though US banks are definitely in a
much stronger position now than they were in the
fall of 2008, when Lehman failed, a more severe
and disruptive Euro-area scenario, with a string of
European bank failures for example, would likely
induce a significant downturn in US economic
3. Obviously, this cannot go on for ever. As a matter estimate the fiscal drag amounts to about 1% of
of fact, we do not believe fundamentals support the GDP in both 2012 and 2013 (see chart).
recent strength in consumption. Thus, our model
Substantial fiscal restraint in 2012 and 2013
estimations suggest that the Q3 savings rate is at 1.0 1.0
least 1½% point too low given fundamental factors 0.5
%-points Fiscal policy impact on GDP growth %-points
0.5
like the level of interest rates, net wealth and 0.0 0.0
unemployment (see chart). -0.5 -0.5
Savings rate at its lowest since Q4 2007 -1.0 -1.0
14 % Personal savings rate % 14 -1.5 -1.5
12 Out-of- 12 -2.0 -2.0
Actual sample
10 forecast 10 -2.5 -2.5
Current law Current policy
8 8 -3.0 -3.0
6 6 -3.5 -3.5
2011 2012 2013
4 4
Model forecast and
2 2
Note: The “Current law” scenario is based on the assumption
95% confidence interval
that current legislation determining policy is left unchanged.
0 Note: The model is based on 10Y Treasury yield (+), net financial 0 Specifically, the 2011 payrolls tax cut and the extended
wealth (-), housing wealth (-), unemployment (+) and consumption of unemployment benefits are assumed to expire by end-2011,
-2 -2
nondurables and energy services as share of disposable income (+).
-4 Sample 1960-2006. R² = 0.88 -4
while the 2001 and 2003 Bush tax cuts are assumed to expire by
70 75 80 85 90 95 00 05 10 end-2012. In the “Current policy” scenario all these measures
are assumed extended through 2013. Source: Nordea Markets
Source: Nordea Markets and Reuters Ecowin and Congressional Budget Office.
As a consequence, we expect consumer spending to But there is a risk of an even larger amount of fiscal
slow in H1 2012 as the savings rate adjusts to a restraint. Thus, if the 2011 payroll tax break of 2%
more sustainable level. points and the extended unemployment benefits
More generally, spending growth is expected to period to 99 weeks, both due to expire at year-end,
remain subdued for at least another year or so as are not extended by Congress, the fiscal drag
households continue paying down debt. If debt increases to about 2% of GDP next year.
continues to fall at the rates seen over the past two With the fiscal Super Committee’s failure to reach
years, then the debt-to-GDP ratio will reach the a deficit-cutting agreement there is now a greater
85% threshold by the end of 2012, at which debt risk that these measures expire by the end of this
generally no longer seems to act as a drag on year. In that case the resulting fiscal tightening
economic growth. (For more analysis see our would likely cause a very sharp slowdown already
research note Are we all turning Japanese? released in Q1 next year.
28 September 2011).
However, we still expect (read: hope) that an
Admittedly, the combination of record-low extension of the payroll tax cut and the emergency
mortgage rates and new policies to allow more unemployment benefits will be attached to a year-
households to refinance their mortgages to a lower end spending bill.
rate may help supporting consumer spending.
For 2013, our forecast assumes that the tax cuts
However, this is unlikely to be enough to restore passed under the Bush administration in 2001 and
equilibrium in the housing market anytime soon, 2003, due to expire by end-2012, will also be
because the inability of many households to qualify extended. If not, the fiscal drag increases from
for a mortgage is still holding demand at around 1% to 3% of GDP in 2013.
historically very weak levels.
As a result, we expect home prices to drop another Fed on hold
5% before turning around next year. Against this background the Fed will likely
continue leaving the door open for more easing.
Increasing fiscal restraint We expect the Fed’s next policy move to be in the
Finally, federal fiscal policy will act as a substantial form of strengthening its pledge to keeping rates
drag on growth in 2012 and 2013 as previous low for long. This could happen by including
easing measures are phased out. forecasts of the fed funds rate in the FOMC’s
Under current policy, which in our baseline for the projections and/or by specifying the economic
US economy is assumed to be extended, we conditions that would warrant an exit from the
Fed’s current policy. (Chicago Fed President Evans
4. has already pushed the idea of announcing explicit But pumping out cheap liquidity implies a clear risk
targets for the unemployment rate and inflation rate of new bubbles and high inflation. Therefore it is
as conditions for keeping the Fed funds rate near also our impression that the Fed – also in response
zero). to pressure from other central banks – will adopt
quite an aggressive pace once the economy allows
Not least due to the unprecedented political
gradual monetary policy normalisation.
pressure on the Fed, a return of balance sheet
expansion (QE3) seems like a last resort. We expect the first rate hike in mid-2013, assuming
that the downside risks to the economic outlook do
However, if the economy shows clear signs of a
not materialise. By end-2013 the fed funds rate is
new recession or if European banks were to
seen at 1.75%.
collapse we would expect the Fed to step in and
launch QE3, even if Operation Twist, which is set
to continue until mid-2012, had not been concluded. Johnny Bo Jakobsen
Such a programme would likely focus on mortgage-
johnny.jakobsen@nordea.com +45 3333 6178
backed securities.
USA: Macroeconomic forecast (% annual real changes unless otherwise noted)
2008 (USDbn) 2009 2010 2011E 2012E 2013E
Private consumption 10,035.5 -1.9 2.0 2.2 1.5 2.3
Government consumption and investment 2,878.1 1.7 0.7 -2.0 -1.2 -0.9
Private fixed investment 2,128.7 -18.8 2.6 6.7 6.0 6.9
- residential investment 472.4 -22.2 -4.3 -1.8 2.7 8.1
- equipment and softw are 1,070.0 -16.0 14.6 10.3 6.9 6.8
- non-residential structures 586.3 -21.2 -15.8 4.6 5.6 5.9
Stockbuilding* -41.1 -0.8 1.6 -0.3 -0.2 0.1
Exports 1,846.8 -9.4 11.3 6.7 3.3 6.5
Imports 2,556.5 -13.6 12.5 4.7 1.3 4.7
GDP -3.5 3.0 1.7 1.7 2.6
Nominal GDP (USDbn) 14,291.6 13,938.9 14,526.6 15,056.1 15,595.4 16,310.2
Unemployment rate, % 9.3 9.6 9.0 9.1 8.6
Industrial production, % y/y -11.2 5.3 4.1 2.2 3.6
Consumer prices, % y/y -0.3 1.6 3.2 2.0 1.8
Consumer prices ex. energy and food, % y/y 1.7 1.0 1.6 1.6 1.6
Hourly earnings, % y/y 3.0 2.4 1.8 1.6 1.5
Current account (USDbn) -376.6 -470.9 -451.7 -467.9 -570.9
- % of GDP -2.7 -3.2 -3.0 -3.0 -3.5
Federal budget balance (USDbn) -1,471.3 -1,275.1 -1,290.0 -1,190.0 -840.0
- % of GDP -10.6 -8.8 -8.6 -7.6 -5.2
Gross public debt, % of GDP 86.4 94.5 103.1 110.7 115.8
* Contribution to GDP growth (% points)
Nordea Markets is the name of the Markets departments of Nordea Bank Norge ASA, Nordea Bank AB (publ), Nordea Bank Finland Plc and Nordea Bank Danmark A/S.
The information provided herein is intended for background information only and for the sole use of the intended recipient. The views and other information provided herein are the
current views of Nordea Markets as of the date of this document and are subject to change without notice. This notice is not an exhaustive description of the described product or the
risks related to it, and it should not be relied on as such, nor is it a substitute for the judgement of the recipient.
The information provided herein is not intended to constitute and does not constitute investment advice nor is the information intended as an offer or solicitation for the purchase or
sale of any financial instrument. The information contained herein has no regard to the specific investment objectives, the financial situation or particular needs of any particular
recipient. Relevant and specific professional advice should always be obtained before making any investment or credit decision. It is important to note that past performance is not
indicative of future results. Nordea Markets is not and does not purport to be an adviser as to legal, taxation, accounting or regulatory matters in any jurisdiction.
This document may not be reproduced, distributed or published for any purpose without the prior written consent from Nordea Markets.