Hindustan Unilever Q4FY15: Net sales up 9% y/y to Rs7,555cr; Hold
•
1 like•223 views

Hindustan Unilever continues to trade at rich valuations but there's scope for further growth pick up; Way2wealth recommends Hold

Recommended
More Related Content
What's hot
What's hot (20)
Viewers also liked
Viewers also liked (16)
Similar to Hindustan Unilever Q4FY15: Net sales up 9% y/y to Rs7,555cr; Hold
Similar to Hindustan Unilever Q4FY15: Net sales up 9% y/y to Rs7,555cr; Hold (20)
More from IndiaNotes.com
More from IndiaNotes.com (20)
Recently uploaded
Recently uploaded (20)
Hindustan Unilever Q4FY15: Net sales up 9% y/y to Rs7,555cr; Hold
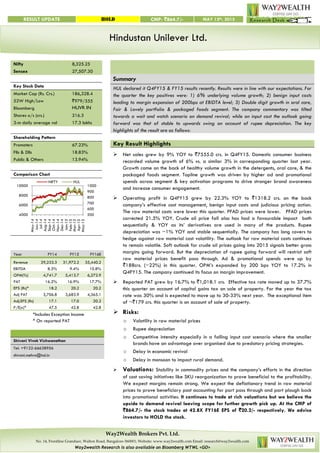
- 1. Way2Wealth Brokers Pvt. Ltd. No. 14, Frontline Granduer, Walton Road, Bangalore-560001; Website: www.way2wealth.com Email: research@way2wealth.com Way2wealth Research is also available on Bloomberg WTWL <GO> Hindustan Unilever Ltd. RESULT UPDATE HOLD CMP: ````864.7/- MAY 12th, 2015 Summary HUL declared it Q4FY15 & FY15 results recently. Results were in line with our expectations. For the quarter the key positives were: 1) 6% underlying volume growth; 2) benign input costs leading to margin expansion of 200bps at EBIDTA level; 3) Double digit growth in oral care, Fair & Lovely portfolio & packaged foods segment. The company commentary was tilted towards a wait and watch scenario on demand revival; while on input cost the outlook going forward was that of stable to upwards swing on account of rupee depreciation. The key highlights of the result are as follows: Key Result Highlights Net sales grew by 9% YOY to `7555.0 crs. in Q4FY15. Domestic consumer business recorded volume growth of 6% vs. a similar 3% in corresponding quarter last year. Growth came on the back of healthy volume growth in the detergents, oral care, & the packaged foods segment. Topline growth was driven by higher ad and promotional spends across segment & key activation programs to drive stronger brand awareness and increase consumer engagement. Operating profit in Q4FY15 grew by 22.3% YOY to `1318.2 crs. on the back company’s effective cost management, benign input costs and judicious pricing action. The raw material costs were lower this quarter. PFAD prices were lower. PFAD prices corrected 21.5% YOY. Crude oil price fall also has had a favourable impact both sequentially & YOY as its’ derivatives are used in many of the products. Rupee depreciation was ~1% YOY and stable sequentially. The company has long covers to hedge against raw material cost volatility. The outlook for raw material costs continues to remain volatile. Soft outlook for crude oil prices going into 2015 signals better gross margins going forward. But the depreciation of rupee going forward will restrict soft raw material prices benefit pass through. Ad & promotional spends were up by `188crs. (~22%) in this quarter. OPM’s expanded by 200 bps YOY to 17.2% in Q4FY15. The company continued its focus on margin improvement. Reported PAT grew by 16.7% to `1,018.1 crs. Effective tax rate moved up to 37.7% this quarter on account of capital gains tax on sale of property. For the year the tax rate was 30% and is expected to move up to 30-33% next year. The exceptional item of ~`179 crs. this quarter is on account of sale of property. Risks: o Volatility in raw material prices o Rupee depreciation o Competitive intensity especially in a falling input cost scenario where the smaller brands have an advantage over organised due to predatory pricing strategies. o Delay in economic revival o Delay in monsoon to impact rural demand. Valuations: Stability in commodity prices and the company’s efforts in the direction of cost saving initiatives like SKU reorganization to prove beneficial to the profitability. We expect margins remain strong. We expect the deflationary trend in raw material prices to prove beneficiary post accounting for part pass through and part plough back into promotional activities. It continues to trade at rich valuations but we believe the upside to demand revival leaving scope for further growth pick up. At the CMP of ````864.7/- the stock trades at 42.8X FY16E EPS of ````20.2/- respectively. We advice investors to HOLD the stock. Nifty 8,325.25 Sensex 27,507.30 Key Stock Data Market Cap (Rs. Crs.) 186,328.4 52W High/Low `979/555 Bloomberg HUVR IN Shares o/s (crs.) 216.3 3-m daily average vol 17.3 lakhs Shareholding Pattern Promoters 67.23% FIIs & DIIs 18.83% Public & Others 13.94% Comparison Chart Year FY14 FY15 FY16E Revenue 29,233.3 31,972.2 35,440.2 EBITDA 8.3% 9.4% 10.8% OPM(%) 4,741.7 5,413.7 6,272.9 PAT 16.2% 16.9% 17.7% EPS (Rs)* 18.2 20.2 20.2 Adj PAT 3,706.8 3,683.9 4,365.1 Adj.EPS (Rs) 17.1 17.0 20.2 P/E(x)^ 47.5 42.8 42.8 *Includes Exception Income ^ On reported PAT Shivani Vivek Vishwanathan Tel: +9122-66638956 shivani.mehra@tssl.in 500 600 700 800 900 1000 4000 6000 8000 10000 May-14 Jun-14 Jul-14 Aug-14 Sep-14 Oct-14 Nov-14 Dec-14 Jan-15 Feb-15 Mar-15 Apr-15 May-15 NIFTY HUL
- 2. Way2Wealth Brokers Pvt. Ltd. No. 14, Frontline Granduer, Walton Road, Bangalore-560001; Website: www.way2wealth.com Email: research@way2wealth.com Way2wealth Research is also available on Bloomberg WTWL <GO>2 | P a g e Hindustan Unilever Ltd. May 12th, 2015 Key Charts Source : Bloomberg, Way2Wealth Research Source : Bloomberg, Way2Wealth Research Source : Bloomberg, Way2Wealth Research Source : Bloomberg, Way2Wealth Research Source : Bloomberg, Way2Wealth Research Source : Bloomberg, Way2Wealth Research Source : Bloomberg, Way2Wealth Research Source : Indexmundi.com, Way2Wealth Research 0 1000 2000 3000 4000 Mar-11 Mar-12 Mar-13 Mar-14 Mar-15 Palm Oil (M$/MT) 0 200 400 600 800 1000 1200 Mar-11 Mar-12 Mar-13 Mar-14 Mar-15 PFAD (US$/MT) 0 50 100 150 Mar-11 Mar-12 Mar-13 Mar-14 Mar-15 Crude Oil (US$/barrel) 0 500 1000 1500 Mar-11 Mar-12 Mar-13 Mar-14 Mar-15 Soda Ash (````/50 Kg) 0 500 1000 1500 2000 2500 Mar-11 Mar-12 Mar-13 Mar-14 Mar-15 Caustic Soda (````/50 Kg) 0 10 20 30 40 50 60 70 Mar-11 Mar-12 Mar-13 Mar-14 Mar-15 USD / INR 0 1000 2000 3000 Mar-11 Mar-12 Mar-13 Mar-14 Mar-15 Coffee Robusta Vietnam - US$/MT 0 200 400 Mar-11 Mar-12 Mar-13 Mar-14 Mar-15 Tea Prices (US cents/Kg) - Kenya
- 3. Way2Wealth Brokers Pvt. Ltd. No. 14, Frontline Granduer, Walton Road, Bangalore-560001; Website: www.way2wealth.com Email: research@way2wealth.com Way2wealth Research is also available on Bloomberg WTWL <GO>3 | P a g e Hindustan Unilever Ltd. May 12th, 2015 Segment-Wise Highlights Soaps and detergents grew by 5% YOY in Q4. It accounts for 47.9% of sales revenue. There has been a phase out of excise duty benefits. The company corrected the inventory pricing in Q3 as the segment witnessed deflationary pressures on the back of correction in input costs. The segment continued to remain competitive with HUL growing ahead of market. Liquids grew faster. Surf continued its growth on the back of double digit volume driven. Rin bars growth back on track. Wheel growth was subdued. This segment also saw price deflation on account of soft raw material prices. Margins expanded YOY to 13.3% from 12.1% in the corresponding quarter. For FY15 the segment recorded a growth of 8.7% driven by a volume growth of 3%. Key milestones for this segment were that lifebuoy crossed the ~`2000 crs. mark & Surf became the largest brand for HUL. All three detergent brands are now greater than `2000 crs. The margins for FY15 were at 13.7% vs. 13.3%. In the personal care segment which accounts for 29.3% of the topline, grew by ~13.4% on account of growth revival in the Fair & Lovely relaunched SKU. Pond’s SKU performed well in the premium skin lightening portfolio. Color cosmetics and face washes and male grooming segment continued their growth trajectory. Hair care grew on double digits led by volumes. Dove, clinic plus and Sunsilk growth led by bottle and TRESemme continued to make good progress. Growth in oral care returned with Close up growing at a healthy double digit. Lakme continued healthy growth trajectory with the launch of 9 to 5 Eyeconic range and the new gloss addict range. Margins in this segment were at 27.8% vs. 25%. For FY15 this segment saw a growth of ~11% with volumes growth in the range of 6%. Key achievement of this segment was revival in growth momentum for Fair & Lovely. Fair & Lovely reached the `2000 crs mark. Except for Oral care all three other segments i.e. hair, skin & cosmetics saw healthy growth. Margins expanded from 25.5% to 26.9%. Beverages which constitute 12.7% of revenues grew by 12.3%. Pricing growth faded. Tea continued to grow at healthy double digits. Mix and activation helped drive growth. Red Label & 3 roses drove volume growth. Margins were lower at 18.6% vs. 18.8%. The green teas drove growth. Coffee portfolio growth stepped up. Coffee grew by double digit on the back of value added premium offerings, Bru Gold. In Fy15 this segment recorded a growth of 9.7%. Volume grow was at 5%. Growth was on the back of premium offerings in coffee and the green tea offering in the tea segment. Margins were lower at 16.9% vs. 17.5%. Packaged foods which constitute 6.2% of revenues grew by 13.1%. Knorr growth was driven was overall with soups doubling. Kissan sustained strong growth momentum. Margins contracted from 5.5% to 5.3%. In FY15 this segment saw growth of 14.8% driven by healthy 10% volume growth. This segment saw various activation programs for furthering consumer engagement with the HUL brands. This segment witnessed a 35% improvement at EBIT level with margins at 4.4% vs. 3.7%. Kwality walls is now an `500 crs+ brand.
- 4. Way2Wealth Brokers Pvt. Ltd. No. 14, Frontline Granduer, Walton Road, Bangalore-560001; Website: www.way2wealth.com Email: research@way2wealth.com Way2wealth Research is also available on Bloomberg WTWL <GO>4 | P a g e Hindustan Unilever Ltd. May 12th, 2015 Risks Volatility in raw material prices Rupee depreciation Competitive intensity especially in a falling input cost scenario where the smaller brands have an advantage over organised due to predatory pricing strategies. Delay in economic revival Delay in monsoon to impact rural demand. Valuation & Outlook Thought long term growth drivers stay intact we believe valuations are stretched for benign growth expectation for the next few quarters. H2FY14 was a period when price growth faded and volume growth constituted 60 to 70% of the overall growth. On this low growth base period FY15 growth should be viewed with a pinch of salt. Price growth faded into FY15 and volume growth remains stable in the lower end of the range at 4 to 5% while consumer sentiment remained weak with rural as well as urban India growth slowed down. Downtrading and growth in smaller SKU’s is privy to consumer hold back. We believe the consumer is still waiting to convert the optimism of the new Govt. till the ground level growth returns. Jobs, coupled with volatile inflation and higher interest rates are still dampening the demand scenario. Stability in commodity prices and the company’s efforts in the direction of cost saving initiatives like SKU reorganization to prove beneficial to the profitability. We expect margins remain strong. We expect the deflationary trend in raw material prices to prove beneficiary post accounting for part pass through and part plough back into promotional activities. It continues to trade at rich valuations but we believe the upside to demand revival leaving scope for further growth pick up. At the CMP of ````864.7/- the stock trades at 42.8x FY16E EPS of ````20.2/- respectively. We advice investors to HOLD the stock.
- 5. Way2Wealth Brokers Pvt. Ltd. No. 14, Frontline Granduer, Walton Road, Bangalore-560001; Website: www.way2wealth.com Email: research@way2wealth.com Way2wealth Research is also available on Bloomberg WTWL <GO>5 | P a g e Hindustan Unilever Ltd. May 12th, 2015 QUARTERLY STANDALONE FINANCIALS (` Cr.) Q4FY15 Q4FY14 YOY [%] Q3FY15 QOQ [%] FY15 FY14 YOY [%] Net Sales 7,555.0 6,935.8 8.9 7,579.2 (0.3) 30,170.5 27,408.3 10.1 Other Operating Income 120.6 158.3 (23.8) 195.1 (38.2) 635.1 610.8 4.0 Other Income 98.4 150.6 (34.7) 120.1 (18.0) 618.4 621.0 (0.4) Total Income 7,774.0 7,244.7 7.3 7,894.4 (1.5) 31,424.0 28,640.2 9.7 Raw Material Consumed 2,929.2 2,910.0 0.7 2,860.6 2.4 11,867.3 11,159.8 6.3 Purchase of stock in trade 914.0 950.7 (3.9) 949.1 (3.7) 3,698.0 3,350.2 10.4 Stock Adjustment (16.2) (129.9) 87.5 38.2 142.4 58.3 (166.4) 135.0 RMC as a %age of sales 49.9% 52.6% 49.5% 50.7% 51.2% Employee Expenses 388.4 378.3 2.7 441.8 (12.1) 1,578.9 1,436.0 10.0 EPC as a %age of sales 5.1% 5.3% 5.7% 5.1% 5.1% Advertisement Expenses 1,027.9 840.3 22.3 977.1 3,874.9 3,613.6 7.2 Advertisement Expenses as a %age of sales 13.4% 11.8% 12.6% 12.6% 12.9% Other Expenses 1,114.2 1,067.1 4.4 1,175.9 (5.2) 4,520.0 4,150.7 8.9 Other Expenses as a %age of sales 14.5% 15.0% 15.1% 14.7% 14.8% Total Expenditure 6,357.5 6,016.6 5.7 6,442.8 (1.3) 25,597.4 23,543.9 8.7 PBIDT 1,318.2 1,077.6 22.3 1,331.5 (1.0) 5,208.2 4,475.3 16.4 OPM% 17.2% 15.2% 17.1% 16.9% 16.0% Interest - 5.3 (100.0) 4.2 (100.0) 16.8 36.0 (53.3) PBDT 1,416.6 1,222.9 15.8 1,447.3 (2.1) 5,809.8 5,060.3 14.8 Depreciation 70.5 65.8 7.2 73.1 (3.5) 286.7 260.6 10.0 PBT before exceptional items 1,346.1 1,157.1 16.3 1,374.3 (2.1) 5,523.1 4,799.7 15.1 Exceptional items 179.4 66.0 396.6 664.3 228.7 PBT 1,525.5 1,223.1 24.7 1,770.8 (13.9) 6,187.4 5,028.4 23.0 Tax 507.4 351.0 44.6 518.7 (2.2) 1,872.2 1,160.9 61.3 Fringe Benefit Tax - - - - - Tax Rate 37.7% 30.3% 37.7% 33.9% 24.2% Reported Profit After Tax 1,018.1 872.1 16.7 1,252.2 (18.7) 4,315.2 3,867.5 11.6 Minority Interest After NP - - - - Net Profit after Minority Interest & P/L Asso.Co. 1,018.1 872.1 16.7 1,252.2 (18.7) 4,315.2 3,867.5 11.6 PATM % 13.3% 12.3% 16.1% 14.0% 13.8% Basic: EPS before Exceptional/Extraordinary items- Basic 4.7 4.0 16.7 5.8 (18.7) 20.0 17.9 11.6 Equity 216.3 216.3 216.3 216.3 216.3 Face Value 1.0 1.0 1.0 1.0 1.0
- 6. Way2Wealth Brokers Pvt. Ltd. No. 14, Frontline Granduer, Walton Road, Bangalore-560001; Website: www.way2wealth.com Email: research@way2wealth.com Way2wealth Research is also available on Bloomberg WTWL <GO>6 | P a g e Hindustan Unilever Ltd. May 12th, 2015 QUARTERLY SEGMENTAL STANDALONE (` Cr.) Q4FY15 Q4FY14 Change % Q3FY15 Change % FY15 FY14 REVENUES Revenue from Operations 7,671.1 7,064.9 8.6 7,747.8 (1.0) 30,719.3 27,920.8 Soaps and Detergents 3,673.7 3,497.1 5.0 3,600.2 2.0 14,876.6 13,683.4 Mix % 47.9% 49.5% 46.5% 48.4% 49.0% Personal Products 2,249.7 1,983.3 13.4 2,454.6 (8.3) 9,006.5 8,120.9 Mix % 29.3% 28.1% 31.7% 29.3% 29.1% Beverages 976.2 869.0 12.3 919.7 6.1 3,631.5 3,311.9 Mix % 12.7% 12.3% 11.9% 11.8% 11.9% Others(includes Exports,Water,Infant Care,etc) 294.7 295.8 (0.4) 353.5 (16.6) 1,312.9 1,156.3 Mix % 3.8% 4.2% 4.6% 4.3% 4.1% Packaged Foods 476.8 419.7 13.6 419.9 13.6 1,891.8 1,648.3 Mix % 6.2% 5.9% 5.4% 6.2% 5.9% Total Segment Revenue 7,671.1 7,064.9 8.6 7,747.8 (1.0) 30,719.3 27,920.8 Net Revenue from Operations 7,671.1 7,064.9 8.6 7,747.8 (1.0) 30,719.3 27,920.8 - PROFIT Profit/Loss Before Interest and Tax 1,312.0 1,078.5 21.6 1,299.3 1.0 5,140.2 4,458.8 Margin % 17.1% 15.3% 16.8% 16.7% 16.0% Soaps and Detergents 488.3 421.7 15.8 502.4 (2.8) 2,033.7 1,785.8 Margin % 13.3% 12.1% 14.0% 13.7% 13.1% Personal Products 624.5 495.8 26.0 680.9 (8.3) 2,424.3 2,068.1 Margin % 27.8% 25.0% 27.7% 26.9% 25.5% Beverages 181.6 163.0 11.4 141.0 28.8 614.6 580.7 Margin % 18.6% 18.8% 15.3% 16.9% 17.5% Others(includes Exports,Water,Infant Care,etc) (7.8) (25.1) (68.7) (3.8) 108.2 (15.5) (37.0) Margin % -2.7% -8.5% -1.1% -1.2% -3.2% Packaged Foods 25.4 23.0 10.6 (21.3) (219.5) 83.2 61.3 Margin % 5.3% 5.5% -5.1% 4.4% 3.7% Less : Interest - 5.3 (100.0) 4.2 (100.0) 16.8 36.0 Add : Other Income 213.5 150.0 42.4 475.8 (55.1) 1,064.0 605.6 Net Profit/Loss Before Tax 1,525.5 1,223.1 24.7 1,770.8 (13.9) 6,187.4 5,028.4
- 7. Way2Wealth Brokers Pvt. Ltd. No. 14, Frontline Granduer, Walton Road, Bangalore-560001; Website: www.way2wealth.com Email: research@way2wealth.com Way2wealth Research is also available on Bloomberg WTWL <GO>7 | P a g e Hindustan Unilever Ltd. May 12th, 2015 CONSOLIDATED FINANCIALS (` Cr.) FY15 FY14 YOY [%] Net Sales 31,199.7 28,539.4 9.3 Other Operating Income 772.5 694.3 11.3 Other Income 566.7 570.1 (0.6) Total Income 32,538.8 29,803.9 9.2 Raw Material Consumed 12,569.2 11,889.7 5.7 Purchase of stock in trade 3,549.8 3,151.6 12.6 Stock Adjustment 57.0 (171.3) 133.3 RMC as a %age of sales 50.6% 50.9% Employee Expenses 1,723.9 1,572.7 9.6 EPC as a %age of sales 5.4% 5.4% Advertisement Expenses 3,943.6 3,674.6 7.3 Advertisement Expenses as a %age of sales 12.3% 12.6% Other Expenses 4,714.9 4,370.7 7.9 Other Expenses as a %age of sales 14.7% 15.0% Total Expenditure 26,558.5 24,488.0 8.5 PBIDT 5,413.7 4,745.8 14.1 OPM% 16.9% 16.2% Interest 17.7 40.7 (56.5) Interest 17.7 40.7 Loss/Gain in Forex - - PBDT 5,962.7 5,275.2 13.0 Depreciation 322.4 295.5 9.1 Minority Interest Before NP - - PBT before exceptional items 5,640.3 4,979.7 13.3 Exceptional items 679.2 235.6 PBT 6,319.5 5,215.3 21.2 Tax 1,944.0 1,259.4 54.4 Fringe Benefit Tax - - - Tax Rate 34.5% 25.3% Reported Profit After Tax 4,375.5 3,955.8 10.6 Minority Interest After NP (12.4) (10.2) Profit/Loss of Associate Company - - Net Profit after Minority Interest & P/L Asso.Co. 4,363.1 3,945.7 10.6 PATM % 13.7% 13.5% Extra-ordinary Items - - Adjusted Profit After Extra-ordinary item 4,363.1 3,945.7 10.6 Basic: EPS after Exceptional/Extraordinary items-Basic 20.2 18.3 10.6 Equity 216.3 216.3 Face Value 1.0 1.0
- 8. Way2Wealth Brokers Pvt. Ltd. No. 14, Frontline Granduer, Walton Road, Bangalore-560001; Website: www.way2wealth.com Email: research@way2wealth.com Way2wealth Research is also available on Bloomberg WTWL <GO>8 | P a g e Hindustan Unilever Ltd. May 12th, 2015 CONSOLIDATED SEGMENTAL (` Cr.) FY15 FY14 Change % REVENUES Revenue from Operations 31,891.6 29,144.2 9.4 Soaps and Detergents 14,876.5 13,683.4 8.7 Mix % 46.6% 47.0% Personal Products 9,100.0 8,194.4 11.1 Mix % 28.5% 28.1% Beverages 3,631.3 3,311.9 9.6 Mix % 11.4% 11.4% Others(includes Exports,Water,Infant Care,etc) 2,392.0 2,306.3 3.7 Mix % 7.5% 7.9% Packaged Foods 1,891.8 1,648.3 14.8 Mix % 5.9% 5.7% Less : Inter Segment Revenues - - #DIV/0! Total Segment Revenue 31,891.6 29,144.2 9.4 Net Revenue from Operations 31,891.6 29,144.2 9.4 PROFIT Profit/Loss Before Interest and Tax 5,382.9 4,706.4 14.4 Margin % 16.9% 16.1% Soaps and Detergents 2,065.5 1,802.3 14.6 Margin % 13.9% 13.2% Personal Products 2,423.5 2,056.8 17.8 Margin % 26.6% 25.1% Beverages 614.6 580.7 5.8 Margin % 16.9% 17.5% Others(includes Exports,Water,Infant Care,etc) 196.1 205.3 (4.5) Margin % 8.2% 8.9% Packaged Foods 83.2 61.3 35.8 Margin % 4.4% 3.7% Less : Interest 17.7 40.7 (56.5) Add : Other Income 954.4 549.5 73.7 Net Profit/Loss Before Tax 6,319.5 5,215.2 21.2
- 9. Way2Wealth Brokers Pvt. Ltd. No. 14, Frontline Granduer, Walton Road, Bangalore-560001; Website: www.way2wealth.com Email: research@way2wealth.com Way2wealth Research is also available on Bloomberg WTWL <GO>9 | P a g e Hindustan Unilever Ltd. May 12th, 2015 Team Analyst Designation Sector Email Telephone Nilesh Doshi President (Research) nilesh.doshi@tssl.in +9122-6633 8950 Mahesh Bendre AVP Capital Goods, Auto, Auto Ancillary maheshbendre@way2wealth.com +9122-6146 8937 Jaysheel Garg AVP Power jaisheelgarg@way2wealth.com +9122-6146 8921 Shivani V. Vishwanathan Sr. Research Analyst FMCG, Auto shivani.mehra@tssl.in +9122-6663 8956 Nisha Harchekar Sr. Research Analyst Chemicals, Textiles nishaharchekar@way2wealth.com +9122-6146 2952 Ronak Morjaria Research Associate ronakd@way2wealth.com +9122-6633 8959 Vijay Gyanchandani Research Associate vijaygyanchandani@way2wealth.com +9122-6633 8272 Institutional Sales Designation Email Telephone Ramanjaneyulu BV Institutional Head – Sales raman@way2wealth.com +9122-6146 2956 Vinod Vijay Birla Senior Manager vinodbirla@way2wealth.com +9122-4019 2998 Bhavika Ravasia Senior Manager bhavikaravasia@way2wealth.com +9122-4019 2995 Institutional Dealing Designation Email Telephone Ajay Prabhudesai Assistant Vice President ajay.prabhudesai@tssl.in +9122-4027 8930 Mitul Doshi Senior Executive mitul.doshi@tssl.in +9122-4027 8932 Gautam Vyas Institutional Sales Trader gautam.vyas@tssl.in +9122-4027 8934
- 10. Way2Wealth Brokers Pvt. Ltd. No. 14, Frontline Granduer, Walton Road, Bangalore-560001; Website: www.way2wealth.com Email: research@way2wealth.com Way2wealth Research is also available on Bloomberg WTWL <GO>10 | P a g e Hindustan Unilever Ltd. May 12th, 2015 Disclaimer Analyst Certification: I, Shivani Vishwanathan, the research analyst and author of this report, hereby certify that the views expressed in this research report accurately reflect our personal views about the subject securities, issuers, products, sectors or industries. It is also certified that no part of the compensation of the analyst(s) was, is, or will be directly or indirectly related to the inclusion of specific recommendations or views in this research. The analyst(s), principally responsible for the preparation of this research report, receives compensation based on overall revenues of the company (Way2Wealth Brokers Private Limited, hereinafter referred to as Way2Wealth) and has taken reasonable care to achieve and maintain independence and objectivity in making any recommendations. It is confirmed that Shivani Vishwanathan, the author of this report has not received any compensation from the companies mentioned in the report in the preceding 12 months. Our research professionals are paid in part based on the profitability of Way2Wealth, which include earnings from other business. Neither Way2Wealth nor its directors, employees, agents or representatives shall be liable for any damages whether direct or indirect, incidental, special or consequential including lost revenue or lost profits that may arise from or in connection with the use of the information contained in this report. This report is for the personal information of the authorized recipient and does not construe to be any investment, legal or taxation advice to you. Way2Wealth is not soliciting any action based upon it. Nothing in this research shall be construed as a solicitation to buy or sell any security or product, or to engage in or refrain from engaging in any such transaction. The contents of this material are general and are neither comprehensive nor appropriate for every individual and are solely for the informational purposes of the readers. This material does not take into account the specific objectives, financial situation or needs of an individual/s or a Corporate/s or any entity/s. This research has been prepared for the general use of the clients of the Way2Wealth and must not be copied, either in whole or in part, or distributed or redistributed to any other person in any form. If you are not the intended recipient you must not use or disclose the information in this research in any way. Though disseminated to all the customers simultaneously, not all customers may receive this report at the same time. Way2Wealth will not treat recipients as customers by virtue of their receiving this report. The distribution of this document in other jurisdictions may be restricted by the law applicable in the relevant jurisdictions and persons into whose possession this document comes should inform themselves about, and observe any such restrictions. The report is based upon information obtained from sources believed to be reliable, but we do not make any representation or warranty that it is accurate, complete or up to date and it should not be relied upon as such. Way2Wealth or any of its affiliates or employees makes no warranties, either express or implied of any kind regarding any matter pertaining to this report, including, but not limited to warranties of suitability, fitness for a particular purpose, accuracy, timeliness, completeness or non-infringement. We accept no obligation to correct or update the information or opinions in it. Way2Wealth or any of its affiliates or employees shall not be in any way responsible for any loss or damage that may arise to any person from any inadvertent error in the information contained in this report. The recipients of this report should rely on their own investigations. In no event shall Way2Wealth be liable for any damages of any kind, including, but not limited to, indirect, special, incidental, consequential, punitive, lost profits, or lost opportunity, whether or not Way2Wealth has advised of the possibility of such damages. This material contains statements that are forward-looking; such statements are based upon the current beliefs and expectations and are subject to significant risks and uncertainties. Actual results may differ from those set forth in the forward-looking statements. These uncertainties include but are not limited to: the risk of adverse movements or volatility in the securities markets or in interest or foreign exchange rates or indices; adverse impact from an economic slowdown; downturn in domestic or foreign securities and trading conditions or markets; increased competition; unfavorable political and diplomatic developments; change in the governmental or regulatory policies; failure of a corporate event and such others. This is not an offer to buy or sell or a solicitation of an offer to buy or sell any security or instrument or to participate in any particular trading strategy. No part of this material may be copied or duplicated in any form by any means or redistributed without the written consent of Way2Wealth. In no event shall any reader publish, retransmit, redistribute or otherwise reproduce any information provided by Way2Wealth in any format to anyone. Way2Wealth and its affiliates, officers, directors and employees including persons involved in the preparation or issuance of this report may from time to time have interest in securities / positions, financial or otherwise in the securities related to the information contained in this report. To enhance transparency, Way2Wealth has incorporated a Disclosure of Interest Statement in this document. This should, however, not be treated as endorsement of the views expressed in the report. Disclosure of Interest Statement in Hindustan Unilever Ltd. as on May 12, 2015 Name of the Security Hindustan Unilever Ltd. Name of the analyst Shivani Vishwanathan Analysts’ ownership of any stock related to the information contained Financial Interest Analyst : Analyst’s Relative : Yes / NO Analyst’s Associate/Firm : Yes/No No No No No Conflict of Interest No Receipt of Compensation No Way2Wealth ownership of any stock related to the information contained NIL Broking relationship with company covered NIL Investment Banking relationship with company covered NIL This information is subject to change without any prior notice. Way2Wealth reserves at its absolute discretion the right to make or refrain from making modifications and alterations to this statement from time to time. Nevertheless, Way2Wealth is committed to providing independent and transparent recommendations to its clients, and would be happy to provide information in response to specific client queries.