
Recommended
More Related Content
Similar to IDirect_Dabur_Q3FY23.pdf
Similar to IDirect_Dabur_Q3FY23.pdf (20)
More from akhileshakm
More from akhileshakm (11)
Recently uploaded
Recently uploaded (20)
IDirect_Dabur_Q3FY23.pdf
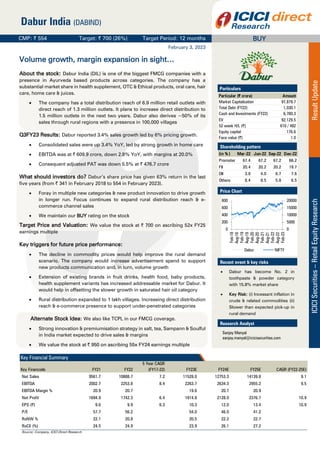
- 1. ICICI Securities – Retail Equity Research Result Update February 3, 2023 CMP: | 554 Target: | 700 (26%) Target Period: 12 months Dabur India (DABIND) BUY Volume growth, margin expansion in sight… About the stock: Dabur India (DIL) is one of the biggest FMCG companies with a presence in Ayurveda based products across categories. The company has a substantial market share in health supplement, OTC & Ethical products, oral care, hair care, home care & juices. The company has a total distribution reach of 6.9 million retail outlets with direct reach of 1.3 million outlets. It plans to increase direct distribution to 1.5 million outlets in the next two years. Dabur also derives ~50% of its sales through rural regions with a presence in 100,000 villages Q3FY23 Results: Dabur reported 3.4% sales growth led by 6% pricing growth. Consolidated sales were up 3.4% YoY, led by strong growth in home care EBITDA was at | 609.9 crore, down 2.8% YoY, with margins at 20.0% Consequent adjusted PAT was down 5.5% at | 476.7 crore What should investors do? Dabur’s share price has given 63% return in the last five years (from | 341 in February 2018 to 554 in February 2023). Foray in multiple new categories & new product innovation to drive growth in longer run. Focus continues to expand rural distribution reach & e- commerce channel sales We maintain our BUY rating on the stock Target Price and Valuation: We value the stock at | 700 on ascribing 52x FY25 earnings multiple Key triggers for future price performance: The decline in commodity prices would help improve the rural demand scenario. The company would increase advertisement spend to support new products communication and, in turn, volume growth Extension of existing brands in fruit drinks, health food, baby products, health supplement variants has increased addressable market for Dabur. It would help in offsetting the slower growth in saturated hair oil category Rural distribution expanded to 1 lakh villages. Increasing direct distribution reach & e-commerce presence to support under-penetrated categories Alternate Stock Idea: We also like TCPL in our FMCG coverage. Strong innovation & premiumisation strategy in salt, tea, Sampann & Soulful in India market expected to drive sales & margins We value the stock at | 950 on ascribing 55x FY24 earnings multiple Key Financials FY21 FY22 5 Year CAGR (FY17-22) FY23E FY24E FY25E CAGR (FY22-25E) Net Sales 9561.7 10888.7 7.2 11528.0 12753.3 14139.8 9.1 EBITDA 2002.7 2253.8 8.4 2263.7 2634.3 2955.2 9.5 EBITDA Margin % 20.9 20.7 19.6 20.7 20.9 Net Profit 1694.9 1742.3 6.4 1814.8 2128.0 2376.7 10.9 EPS (|) 9.6 9.9 6.3 10.3 12.0 13.4 10.9 P/E 57.7 56.2 54.0 46.0 41.2 RoNW % 22.1 20.8 20.5 22.2 22.7 RoCE (%) 24.5 24.9 23.9 26.1 27.2 Particulars Particular (| crore) Amount Market Capitalization 97,879.7 Total Debt (FY22) 1,030.1 Cash and Investments (FY22) 6,780.3 EV 92,129.5 52 week H/L (|) 610 / 482 Equity capital 176.6 Face value (|) 1.0 Shareholding pattern (in % ) Mar-22 Jun-22 Sep-22 Dec-22 Promoter 67.4 67.2 67.2 66.2 FII 20.4 20.2 20.2 19.7 DII 3.8 4.0 6.7 7.6 Others 8.4 8.5 5.8 6.5 Price Chart 0 5000 10000 15000 20000 0 200 400 600 800 Feb-18 Aug-18 Feb-19 Aug-19 Feb-20 Aug-20 Feb-21 Aug-21 Feb-22 Aug-22 Feb-23 Dabur NIFTY Recent event & key risks Dabur has become No. 2 in toothpaste & powder category with 15.8% market share Key Risk: (i) Incessant inflation in crude & related commodities (ii) Slower than expected pick-up in rural demand Research Analyst Sanjay Manyal sanjay.manyal@icicisecurities.com Key Financial Summary Source: Company, ICICI Direct Research
- 2. ICICI Securities | Retail Research 2 ICICI Direct Research Result Update | Dabur India Key takeaways of recent quarter Q3FY23 Results: Volume growth muted on high base of two years Dabur witnessed revenue growth of 3.4% to | 3043.2 crore with strong growth in home care and digestives category. Both these categories have benefited from increased mobility compared to last year India standalone business grew 3.3% whereas international business grew 5.1% during the quarter. Volumes have de-grown by 3% with 6% pricing growth during the quarter Health supplement sales was flat after two years of high growth period during Covid-19. On a three-year CAGR basis, health supplement portfolio (Chyawanprash, Honey) grew 7.5%. The company continues to gain market share in Chyawanprash & Honey category. Chyawanprash, honey sales were impacted due to delay in winters Digestives portfolio grew 11.2% driven by new products ‘LimCola’ & ‘ChatCola’ launched in FY23. The category grew at 7.5% on three-year CAGR basis. The strong growth was led by increased mobility (fully operational schools & offices) compared to last year OTC & Ethical category witnessed growth of 4% with OTC products (Lal Tail, Honitus, & Shilajit) witnessing growth of 17%. However, ex-Covid ethical portfolio grew 7.5% Home care category saw strong growth of 18.2% (three-year CAGR 11.5%) led by robust double-digit growth for Odonil, Odomos & Sanifresh. Odonil recorded 540 bps increase in market share in aerosol & 410 bps uptick in get air fresheners. Odomos saw 200 bps market share gain during the quarter Oral care category grew 2.6% (three-year CAGR of 11.9%) with toothpaste growth of 3.2% driven by Dabur red. The company has become the No. 2 player in toothpaste + toothpowder category with 15.8% value market share. It commands 17% volume market share in the category Shampoos category growth was 3.6% (3-year-CAGR of 16.9%) on a high base of 21%. It gained 40 bps market share in the category Hair oils & skin care category sales declined by 2.4% & 5.6%, respectively. The hair oil category declined by 5% during the quarter. The company gained market share by 70 bps to highest ever of 16.2%. Delayed winter impacted skin care segment sales. Hair oils & Skin care three-year CAGR for the company was muted at 4.9% & 2.1%, respectively Beverage category sales grew at a slower pace of 3.7% (three-year CAGR of 14.3%) mainly due to early festive sales. The company gained market share by 250 bps in juices & nectar category Foods category continued to grow at a stronger pace of 34.5% (three-year CAGR 24.3%). Homemade brands performance was driven by new products expansion E-commerce channel sales grew 40% and are now contributing 9% to the overall sales for the company. The company would continue to focus on expanding direct distribution network with enhancement in rural presence There is a clear trend of down trading in rural India with increasing contribution from low unit packs (LUPs). Dabur generates 25% of its sales from LUPs, which are growing at 20-25% Volume has de-grown by 3% in tonnage but increased 3% in terms of unit pack. LUPs contributing 80-90% of sales for fruit drinks category The company is likely to achieve | 200 crore of sales for fruit drinks category in FY23. It would be commissioning new plant in Indore for fruit drinks category specifically for | 10, | 20 price point packs
- 3. ICICI Securities | Retail Research 3 ICICI Direct Research Result Update | Dabur India In e-commerce channel expansion, fruit drinks, health drinks, baby care products witnessed stronger growth With the softening of commodity prices, gross margins are likely to improve. The company would increase advertisement spends & reduce trade promotions, going forward. It is likely to maintain operating margin ~20% Gross margins contracted 283 bps but remain flat on a sequential basis. The company cut down advertisement spends by 216 (as percentage of sale) but overhead & employee spends were up slightly by 34 bps & 28 bps, respectively Operating profit dipped 2.8% to | 609.0 crore with operating margin of 20%. Net profit de-grew 5.5% to |476.7 crore. The company continues to concentrate on market share gain in all major category & new product launches in healthcare & beverage category Exhibit 1: Peer Comparison CMP TP M Cap (|) (|) Rating (| Cr) FY22E FY23E FY24E FY22E FY23E FY24E FY22E FY23E FY24E FY22E FY23E FY24E FY22E FY23E FY24E Marico (MARLIM) 500 560 Hold 69587 18.2 3.1 9.3 17.7 19.0 19.1 51.4 48.9 44.4 37.5 38.3 41.0 41.2 43.6 46.7 Hindustan Unilever (HINLEV) 2574 2800 Hold 604971 11.3 16.3 9.5 24.8 23.5 24.0 68.6 61.2 55.2 18.1 20.3 22.4 20.2 22.9 25.6 Varun Beverage (VARBEV) 1154 1235 Hold 71889 36.8 45.2 12.9 18.8 21.3 21.4 67.0 49.7 43.1 18.3 29.0 29.4 17.1 30.3 33.5 Dabur India (DABIND) 554 700 Buy 97880 13.9 6.8 10.6 20.7 19.6 20.7 56.3 54.0 46.1 20.8 20.5 22.2 24.9 23.9 26.1 RoCE (% ) Sector / Company Sales growth (% ) EBITDA Margins (% ) P/E(x) RoE (% ) Source: Company, ICICI Direct Research Dabur has seen strong 9% growth on a three-year CAGR basis attributed to high growth during Covid-19 period in healthcare segment. However, health supplement products (Chyawanprash & Honey) have started clocking lower sales over the last one year with subsiding of Covid scare and improved mobility. We believe the company has forayed into multiple new categories in the last two years leveraging its existing brands in under-penetrated categories. Further, Dabur has been able to maintain its operating margin closer to 20% level (long term average). We believe new products would start contributing to the volumes, going forward, which would offset the slower growth in the saturated hair oil category. We also believe the decline in commodity prices would perk up margins in medium term, which would drive profit growth for the company. We remain positive on Dabur from a growth as well as margin expansion perspective. We maintain our BUY recommendation and target price of | 700/ share.
- 4. ICICI Securities | Retail Research 4 ICICI Direct Research Result Update | Dabur India Exhibit 2: Variance Analysis Q3FY23 Q2FY23E Q3FY22 YoY (%) Q2FY23 QoQ (%) Comments Net Sales 3,043.2 3,069.8 2,941.8 3.4 2,986.5 1.9 Net sales witnessed muted 3.3% growth led by 6% price hike. Volume de-grew 3% Raw Material Expenses 1,658.2 1,662.0 1,519.6 9.1 1,631.4 1.6 Gross margin contracted by 283 bps with relatively lower sales of high margin health supplements category Employee Expenses 290.8 293.3 273.0 6.5 287.6 1.1 SG&A Expenses 179.6 224.1 237.1 -24.2 151.8 18.3 The company cut advertisement spend by 216 bps (% to sales) to protect operating margins Other operating Expenses 304.7 301.4 284.6 7.1 315.0 -3.3 EBITDA 609.9 589.0 627.5 -2.8 600.7 1.5 Operating profit dipped by 2.8% given lowers sales & gross margin contraction EBITDA Margin (%) 20.0 19.2 21.3 -129 bps 20.1 -7 bps Operating profit margin contracted by 129 bps Depreciation 70.9 65.2 63.2 12.2 70.5 0.6 Interest 18.9 0.0 11.1 70.7 15.1 25.6 Other Income 100.8 103.2 96.7 4.2 123.3 -18.2 Exceptional items 0.0 0.0 0.0 N.A. 0.0 N.A. PBT 620.9 627.0 650.0 -4.5 638.5 -2.8 Tax Outgo 143.5 147.3 145.5 -1.4 147.3 -2.6 PAT 476.7 479.7 504.4 -5.5 491.2 -3.0 Net profit dipped by 5.5% on account of a dip in operating profit & higher tax rate Adjusted PAT 476.7 479.7 504.4 -5.5 491.2 -3.0 Key Metrics YoY growth (%) Domestiic Volume Growth -3.0 2.0 1.0 Domestic volume de-grew 3% Standalone sales growth 3.3 7.4 6.9 Domestic sales witnesssed growth of 3.3% Subsidiary's sales growth 3.8 9.1 3.1 Source: Company, ICICI Direct Research Exhibit 3: Change in estimates FY25E (| Crore) Old New % change Old New % change New Comments Sales 11,876.0 11528.0 -2.9 13428.4 12753.3 -5.0 14,139.8 We cut FY23E & FY24E sales number given decline in commodity prices would lead to price cuts & sales would be largely driven by volumes. We introduce FY25E numbers EBITDA 2,349.6 2263.7 -3.7 2775.8 2634.3 -5.1 2,955.2 EBITDA Margin (%) 19.8 19.6 -15 bps 20.7 20.7 -2 bps 20.9 We slightly change our margin estimate for FY23 PAT 1,922.0 1814.8 -5.6 2239.9 2128.0 -5.0 2,376.7 EPS (|) 10.9 10.3 -5.5 12.7 12.0 -5.0 13.4 FY23E FY24E Source: ICICI Direct Research Exhibit 4: Assumptions Comments FY20 FY21 FY22 FY23E FY24E FY25E FY23E FY24E Std. Sales (| crore) 6,309.8 7,184.7 8,179.5 8,736.5 9,682.6 10,762.1 9,148.7 10,183.2 Subs. Sales (| crore) 2,393.8 2,376.9 2,709.2 2,791.5 3,070.7 3,377.7 3,006.2 3,336.9 RM exp. To sales % 50.1 50.1 51.8 54.0 51.7 51.9 53.3 51.1 We anticipate gross margin expansion would not be as sharp as expected earlier Adex to sales % 8.0 8.2 7.1 5.9 7.7 7.9 7.6 9.0 We cut our ad spends for FY23 & FY24 in line with current run rate Interest Cost (| crore) 49.5 30.8 38.6 61.5 43.9 43.9 43.9 43.9 We cut our sales estimate for FY23 & FY24 Earlier Current Source: ICICI Direct Research
- 5. ICICI Securities | Retail Research 5 ICICI Direct Research Result Update | Dabur India Key Metrics Exhibit 5: Category wise revenue growth in percentage (YoY) Q3FY20 Q4FY20 Q1FY21 Q2FY21 Q3FY21 Q4FY21 Q1FY22 Q2FY22 Q3FY22 Q4FY22 Q1FY23 Q2FY23 Q3FY23 Hair Oil 0.4* -20.2 -22.9 -2.4 13.7 24.6 38.4 27.9 6.1 2.6 8.1 1.8 -2.4 Oral Care 8.5 -15.8 1.4 24.2 28.0 42.1 21.1 13.3 6.7 1.1 12.5 9.2 2.6 Health Supp. 12.2 -9.5 52.6 70.8 34.7 17.7 24.5 -13.6 -8.3 1.3 -35.5 -12.6 0.4 Digestives 15.9 -9.5 -11.5 2.5 -0.3 20.0 16.2 22.7 12.2 1.2 30.5 0.1 11.2 Skin Care -0.3 -24.2 -12.5 38.1 9.1 37.9 -5.4 -11.9 3.2 -10.6 11.4 -15.0 -5.6 Home Care 2.5 -20.6 -30.5 -10.2 -1.0 24.3 30.6 25.3 18.6 11.0 51.9 20.9 18.2 Foods & Beverages -1.7 -18.4 -34.4 -3.8 4.7 36.1 51.7 45.0 37.6 33.5 51.0 30.0 6.4 OTC 5.5 -20.6 34.4 56.1 34.1 34.0 52.3 1.9 3.6 7.5 -15.4 -0.2 4.0 Ethicals 2.7 -20.6 10.7 26.4 23.2 39.1 50.8 1.9 3.6 7.5 -15.4 -0.2 4.0 Source: Company, ICICI Direct Research * Hair care included Shampoo Exhibit 6: Strong revenue growth momentum to continue 7748.3 8533.1 8703.6 9561.7 10888.711528.0 12753.3 14139.8 0.6 10.1 2.0 9.9 13.9 5.9 10.6 10.9 0.0 2.0 4.0 6.0 8.0 10.0 12.0 14.0 16.0 0.0 2000.0 4000.0 6000.0 8000.0 10000.0 12000.0 14000.0 16000.0 FY18 FY19 FY20 FY21 FY22 FY23E FY24E FY25E Sales (| crore) Sales growth (%) Source: ICICI Direct Research, Company Exhibit 7: EBITDA margin to remain stable 1617.4 1739.6 1792.4 2002.7 2253.8 2263.7 2634.3 2955.2 20.9 20.4 20.6 20.9 20.7 19.6 20.7 20.9 0.0 5.0 10.0 15.0 20.0 25.0 0.0 500.0 1000.0 1500.0 2000.0 2500.0 3000.0 3500.0 FY18 FY19 FY20 FY21 FY22 FY23E FY24E FY25E EBITDA (| crore) EBITDA Margins Source: ICICI Direct Research, Company Exhibit 8: Raw material, ad-ex trend over years 49.6 50.5 50.1 50.1 51.8 54.0 51.7 51.9 7.8 7.1 8.0 8.2 7.1 5.9 7.7 7.9 0.0 10.0 20.0 30.0 40.0 50.0 60.0 FY18 FY19 FY20 FY21 FY22 FY23E FY24E FY25E RM Cost to Sales Adex to Sales Source: Company, ICICI Direct Research Exhibit 9: PAT growth trend 1357.7 1446.3 1447.9 1694.9 1742.3 1814.8 2128.0 2376.7 6.0 6.5 0.1 17.1 2.8 4.2 17.3 11.7 0.0 2.0 4.0 6.0 8.0 10.0 12.0 14.0 16.0 18.0 20.0 0.0 500.0 1000.0 1500.0 2000.0 2500.0 FY18 FY19 FY20 FY21 FY22 FY23E FY24E FY25E PAT (| crore) PAT growth (%) Source: Company, ICICI Direct Research Exhibit 10: Valuation Sales Growth EPS Growth PE EV/EBITDA RoNW RoCE (| cr) (% ) (|) (% ) (x) (x) (% ) (% ) FY22 10888.7 13.9 9.9 2.8 56.2 43.6 20.8 24.9 FY23E 11528.0 5.9 10.3 4.2 54.0 43.5 20.5 23.9 FY24E 12753.3 10.6 12.0 17.3 46.0 37.4 22.2 26.1 FY25E 14139.8 10.9 13.4 11.7 41.2 33.2 22.7 27.2 Source: Company, ICICI Direct Research
- 6. ICICI Securities | Retail Research 6 ICICI Direct Research Result Update | Dabur India Financial Summary Exhibit 11: Profit and loss statement | crore (Year-end March) FY21 FY22 FY23E FY24E FY25E Net Sales 10,888.7 11,528.0 12,753.3 14,139.8 Growth (%) 13.9 5.9 10.6 10.9 Raw Material Expenses 5,639.7 6,226.7 6,599.1 7,338.6 Employee Expenses 1,080.0 1,118.2 1,262.6 1,357.4 Marketing Expenses 777.9 674.4 982.0 1,117.0 Administrative Expenses 0.0 783.9 841.7 890.8 Other expenses 1,137.3 461.1 433.6 480.8 Total Operating Expenditure 8,634.9 9,264.3 10,119.0 11,184.6 EBITDA 2,253.8 2,263.7 2,634.3 2,955.2 Growth (%) 12.5 0.4 16.4 12.2 Depreciation 252.9 283.2 275.2 275.2 Interest 38.6 61.5 43.9 43.9 Other Income 393.2 428.5 450.0 472.5 PBT 2,270.5 2,347.6 2,765.2 3,108.6 Others 85.0 0.0 0.0 0.0 Total Tax 526.4 530.5 636.0 730.5 PAT 1,742.3 1,814.8 2,128.0 2,376.7 Growth (%) 2.8 4.2 17.3 11.7 Adjusted EPS (|) 9.9 10.3 12.0 13.5 Source: Company, ICICI Direct Research Exhibit 12: Cash flow statement | crore (Year-end March) FY22 FY23E FY24E FY25E Profit before Tax 2,268.7 2,347.6 2,765.2 3,108.6 Add: Depreciation 252.9 283.2 275.2 275.2 (Inc)/dec in Current Assets -185.5 -522.3 -561.9 -700.3 Inc/(dec) in CL and Provisions 88.7 15.4 287.6 314.9 Others -622.5 -471.3 -593.3 -688.0 CF from operating activities 1,802.3 1,652.6 2,172.8 2,310.5 (Inc)/dec in Investments -906.3 -350.0 -350.0 -350.0 (Inc)/dec in Fixed Assets -369.2 -270.0 -270.0 -270.0 Others 0.0 0.0 0.0 0.0 CF from investing activities -1,275.5 -620.0 -620.0 -620.0 Issue/(Buy back) of Equity 540.9 0.0 0.0 0.0 Inc/(dec) in loan funds -37.2 -100.0 -100.0 -100.0 Dividend paid & dividend tax -972.3 -1,325.9 -1,414.3 -1,502.7 Others -21.9 -61.5 -43.9 -43.9 CF from financing activities -490.5 -1,487.4 -1,558.2 -1,646.6 Net Cash flow 38.4 -454.8 -5.4 43.8 Opening Cash 188.8 255.9 -198.9 -204.3 Miscellaneous adjustments 343.0 314.2 314.2 314.2 Closing Cash 570.2 115.3 109.9 153.8 Source: Company, ICICI Direct Research Exhibit 13: Balance Sheet | crore (Year-end March) FY21 FY22 FY23E FY24E FY25E Liabilities Equity Capital 176.8 176.8 176.8 176.8 Reserve and Surplus 8,204.5 8,693.4 9,407.1 10,281.0 Total Shareholders funds 8,381.3 8,870.2 9,583.8 10,457.8 Long Term Loans 389.9 339.9 289.9 239.9 Long Term Provisions 86.5 86.5 86.5 86.5 Minority Interest / Others 104.2 104.2 104.2 104.2 Total Liabilities 8,962.0 9,400.9 10,064.5 10,888.5 Assets Gross Block 4,244.8 4,494.8 4,744.8 4,994.8 Less: Acc Depreciation 1,936.9 2,220.0 2,495.2 2,770.4 Net Block 2,307.9 2,274.7 2,249.5 2,224.3 Capital WIP 177.0 197.0 217.0 237.0 Non- Current Investments 5,355.6 5,655.6 5,955.6 6,255.6 LT loans & advances 0.7 50.7 100.7 150.7 Other Non-current Assets 126.6 176.6 226.6 276.6 Current Assets Inventory 1,911.4 2,023.6 2,238.7 2,482.1 Debtors 646.2 684.1 756.8 839.1 Cash & Bank 570.2 115.3 109.9 153.8 ST Loans & Advances 36.2 38.3 42.4 47.0 Other Current Assets 1,152.7 1,522.7 1,792.7 2,162.7 Current Liabilities Creditors 2,018.0 1,953.4 2,161.0 2,395.9 ST Borrowings 640.2 660.2 680.2 700.2 Other CL 664.4 724.4 784.4 844.4 Net Current Assets 994.0 1,046.1 1,314.9 1,744.1 Miscellaneous Expenditure 0.3 0.3 0.3 0.3 Total Assets 8,962.0 9,400.9 10,064.6 10,888.5 Source: Company, ICICI Direct Research Exhibit 14: Key ratios (Year-end March) FY22 FY23E FY24E FY25E Per share data (|) Adjusted EPS 9.9 10.3 12.0 13.5 Cash EPS 11.3 11.9 13.6 15.0 BV 47.4 50.2 54.2 59.2 DPS 5.2 7.5 8.0 8.5 Cash Per Share 3.2 0.7 0.6 0.9 Operating Ratios (% ) PBITDA Margin 20.7 19.6 20.7 20.9 PBT / Total Operating income 18.0 16.6 18.2 18.6 PAT Margin 16.0 15.8 16.7 16.8 Inventory days 63 63 63 63 Debtor days 21 21 21 21 Creditor days 67 61 61 61 Return Ratios (% ) RoE 20.8 20.5 22.2 22.7 RoCE 24.9 23.9 26.1 27.2 RoIC 22.9 20.8 23.4 24.9 Valuation Ratios (x) P/E 56.2 54.0 46.0 41.2 EV / EBITDA 43.6 43.5 37.4 33.2 EV / Net Sales 9.0 8.5 7.7 6.9 Market Cap / Sales 9.0 8.5 7.7 6.9 Price to Book Value 11.7 11.0 10.2 9.4 Solvency Ratios Debt/EBITDA 0.5 0.4 0.4 0.3 Debt / Equity 0.1 0.1 0.1 0.1 Current Ratio 1.4 1.6 1.6 1.7 Quick Ratio 0.7 0.8 0.9 0.9 Source: Company, ICICI Direct Research
- 7. ICICI Securities | Retail Research 7 ICICI Direct Research Result Update | Dabur India Exhibit 15: ICICI Direct coverage universe (FMCG) CMP TP M Cap (|) (|) Rating (| Cr) FY22 FY23E FY24E FY22 FY23E FY24E FY22 FY23E FY24E FY22 FY23E FY24E FY22 FY23E FY24E Colgate (COLPAL) 1,461 1,440 Hold 39,473 39.6 37.7 40.3 36.9 38.7 36.3 7.8 7.6 7.1 77.8 79.3 84.2 62.2 60.4 64.1 Dabur India (DABIND) 554 700 Buy 97,880 9.9 10.3 12.0 56.3 54.0 46.1 9.0 8.5 7.7 24.9 23.9 26.1 20.8 20.5 22.2 Hindustan Unilever (HINLEV) 2,574 2,800 Hold 6,04,971 37.5 42.0 46.7 68.6 61.2 55.2 12.0 10.3 9.4 20.2 22.9 25.6 18.1 20.3 22.4 ITC Limited (ITC) 379 405 Buy 4,29,858 12.4 14.2 16.7 30.5 26.6 22.7 7.3 6.1 5.7 31.4 35.3 38.8 24.5 27.1 29.7 Jyothy Lab (JYOLAB) 208 215 Hold 7,485 4.3 6.7 7.8 48.9 31.2 26.7 3.5 3.1 2.8 18.7 27.5 31.4 16.6 24.2 27.0 Marico (MARLIM) 500 560 Hold 69,587 9.7 10.2 11.2 51.4 48.9 44.4 7.3 7.1 6.5 41.2 43.6 46.7 37.5 38.3 41.0 Nestle (NESIND) 18,955 22,400 Hold 1,90,912 222.4 255.8 301.1 85.2 74.1 62.9 13.0 11.4 10.3 58.7 57.1 63.0 111.3 103.6 110.3 Patanjali Foods (RUCSOY) 959 1,750 Buy 50,721 27.3 30.9 43.5 35.2 31.0 22.1 2.1 1.7 1.5 13.2 15.6 17.3 13.1 11.3 14.2 Tata Consumer Products (TATGLO) 737 950 Buy 70,169 11.0 13.9 17.1 66.9 53.0 43.0 5.6 5.1 4.6 8.4 9.2 10.8 7.0 8.2 9.7 Varun Beverage (VARBEV) 1,154 1,235 Hold 71,889 17.2 23.2 26.8 67.0 49.7 43.1 8.1 5.6 5.0 17.1 30.3 33.5 18.3 29.0 29.4 VST Industries (VSTIND) 2,993 3,300 Hold 4,807 207.4 214.1 229.4 14.4 14.0 13.0 4.1 3.6 3.4 39.2 41.8 49.1 30.0 31.9 36.9 Zydus Wellness (ZYDWEL) 1,410 2,100 Buy 10,308 48.5 56.5 70.3 29.0 24.9 20.1 5.1 4.5 4.1 6.1 7.0 8.3 6.4 7.2 8.6 EPS (|) RoE (% ) RoCE (% ) Price/Sales (x) P/E (x) Source: Bloomberg, ICICI Direct Research
- 8. ICICI Securities | Retail Research 8 ICICI Direct Research Result Update | Dabur India RATING RATIONALE ICICI Direct endeavours to provide objective opinions and recommendations. ICICI Direct assigns ratings to its stocks according -to their notional target price vs. current market price and then categorizes them as Buy, Hold, Reduce and Sell. The performance horizon is two years unless specified and the notional target price is defined as the analysts' valuation for a stock Buy: >15% Hold: -5% to 15%; Reduce: -15% to -5%; Sell: <-15% Pankaj Pandey Head – Research pankaj.pandey@icicisecurities.com ICICI Direct Research Desk, ICICI Securities Limited, 1st Floor, Akruti Trade Centre, Road No 7, MIDC, Andheri (East) Mumbai – 400 093 research@icicidirect.com
- 9. ICICI Securities | Retail Research 9 ICICI Direct Research Result Update | Dabur India ANALYST CERTIFICATION I/We, Sanjay Manyal MBA (FINANCE) Research Analyst, authors and the names subscribed to this report, hereby certify that all of the views expressed in this research report accurately reflect our views about the subject issuer(s) or securities. We also certify that no part of our compensation was, is, or will be directly or indirectly related to the specific recommendation(s) or view(s) in this report. It is also confirmed that above mentioned Analysts of this report have not received any compensation from the companies mentioned in the report in the preceding twelve months and do not serve as an officer, director or employee of the companies mentioned in the report. Terms & conditions and other disclosures: ICICI Securities Limited (ICICI Securities) is a full-service, integrated investment banking and is, inter alia, engaged in the business of stock brokering and distribution of financial products. ICICI Securities is Sebi registered stock broker, merchant banker, investment adviser, portfolio manager and Research Analyst. ICICI Securities is registered with Insurance Regulatory Development Authority of India Limited (IRDAI) as a composite corporate agent and with PFRDA as a Point of Presence. ICICI Securities Limited Research Analyst SEBI Registration Number – INH000000990. ICICI Securities Limited SEBI Registration is INZ000183631 for stock broker. ICICI Securities is a subsidiary of ICICI Bank which is India’s largest private sector bank and has its various subsidiaries engaged in businesses of housing finance, asset management, life insurance, general insurance, venture capital fund management, etc. (“associates”), the details in respect of which are available on www.icicibank.com. ICICI Securities is one of the leading merchant bankers/ underwriters of securities and participate in virtually all securities trading markets in India. We and our associates might have investment banking and other business relationship with a significant percentage of companies covered by our Investment Research Department. ICICI Securities and its analysts, persons reporting to analysts and their relatives are generally prohibited from maintaining a financial interest in the securities or derivatives of any companies that the analysts cover. Recommendation in reports based on technical and derivative analysis centre on studying charts of a stock's price movement, outstanding positions, trading volume etc as opposed to focusing on a company's fundamentals and, as such, may not match with the recommendation in fundamental reports. Investors may visit icicidirect.com to view the Fundamental and Technical Research Reports. Our proprietary trading and investment businesses may make investment decisions that are inconsistent with the recommendations expressed herein. ICICI Securities Limited has two independent equity research groups: Institutional Research and Retail Research. This report has been prepared by the Retail Research. The views and opinions expressed in this document may or may not match or may be contrary with the views, estimates, rating, and target price of the Institutional Research. The information and opinions in this report have been prepared by ICICI Securities and are subject to change without any notice. The report and information contained herein is strictly confidential and meant solely for the selected recipient and may not be altered in any way, transmitted to, copied or distributed, in part or in whole, to any other person or to the media or reproduced in any form, without prior written consent of ICICI Securities. While we would endeavour to update the information herein on a reasonable basis, ICICI Securities is under no obligation to update or keep the information current. Also, there may be regulatory, compliance or other reasons that may prevent ICICI Securities from doing so. Non-rated securities indicate that rating on a particular security has been suspended temporarily and such suspension is in compliance with applicable regulations and/or ICICI Securities policies, in circumstances where ICICI Securities might be acting in an advisory capacity to this company, or in certain other circumstances. This report is based on information obtained from public sources and sources believed to be reliable, but no independent verification has been made nor is its accuracy or completeness guaranteed. This report and information herein is solely for informational purpose and shall not be used or considered as an offer document or solicitation of offer to buy or sell or subscribe for securities or other financial instruments. Though disseminated to all the customers simultaneously, not all customers may receive this report at the same time. ICICI Securities will not treat recipients as customers by virtue of their receiving this report. Nothing in this report constitutes investment, legal, accounting and tax advice or a representation that any investment or strategy is suitable or appropriate to your specific circumstances. The securities discussed and opinions expressed in this report may not be suitable for all investors, who must make their own investment decisions, based on their own investment objectives, financial positions and needs of specific recipient. This may not be taken in substitution for the exercise of independent judgment by any recipient. The recipient should independently evaluate the investment risks. The value and return on investment may vary because of changes in interest rates, foreign exchange rates or any other reason. ICICI Securities accepts no liabilities whatsoever for any loss or damage of any kind arising out of the use of this report. Past performance is not necessarily a guide to future performance. Investors are advised to see Risk Disclosure Document to understand the risks associated before investing in the securities markets. Actual results may differ materially from those set forth in projections. Forward-looking statements are not predictions and may be subject to change without notice. ICICI Securities or its associates might have managed or co-managed public offering of securities for the subject company or might have been mandated by the subject company for any other assignment in the past twelve months. ICICI Securities or its associates might have received any compensation from the companies mentioned in the report during the period preceding twelve months from the date of this report for services in respect of managing or co- managing public offerings, corporate finance, investment banking or merchant banking, brokerage services or other advisory service in a merger or specific transaction. ICICI Securities or its associates might have received any compensation for products or services other than investment banking or merchant banking or brokerage services from the companies mentioned in the report in the past twelve months. ICICI Securities encourages independence in research report preparation and strives to minimize conflict in preparation of research report. ICICI Securities or its associates or its analysts did not receive any compensation or other benefits from the companies mentioned in the report or third party in connection with preparation of the research report. Accordingly, neither ICICI Securities nor Research Analysts and their relatives have any material conflict of interest at the time of publication of this report. Compensation of our Research Analysts is not based on any specific merchant banking, investment banking or brokerage service transactions. ICICI Securities or its subsidiaries collectively or Research Analysts or their relatives do not own 1% or more of the equity securities of the Company mentioned in the report as of the last day of the month preceding the publication of the research report. Since associates of ICICI Securities and ICICI Securities as a entity are engaged in various financial service businesses, they might have financial interests or actual/ beneficial ownership of one percent or more or other material conflict of interest various companies including the subject company/companies mentioned in this report. ICICI Securities may have issued other reports that are inconsistent with and reach different conclusion from the information presented in this report. Neither the Research Analysts nor ICICI Securities have been engaged in market making activity for the companies mentioned in the report. We submit that no material disciplinary action has been taken on ICICI Securities by any Regulatory Authority impacting Equity Research Analysis activities. This report is not directed or intended for distribution to, or use by, any person or entity who is a citizen or resident of or located in any locality, state, country or other jurisdiction, where such distribution, publication, availability or use would be contrary to law, regulation or which would subject ICICI Securities and affiliates to any registration or licensing requirement within such jurisdiction. The securities described herein may or may not be eligible for sale in all jurisdictions or to certain category of investors. Persons in whose possession this document may come are required to inform themselves of and to observe such restriction.