1. University of Edinburgh – Student Research
Consumer Staples, Consumer Products
London Stock Exchange
Reckitt Benckiser
Date: 17/01/2016 Current price: 6310 p (as of 31/12/15) Recommendation: BUY
Ticker: RB/LN Equity (Bloomberg) Headquarter: Slough, UK Target Price: 6621 p (4.94% upside)
Highlights
Growth drivers – The customized and specialized innovation of RB
makes it more competitive in the industry. With project “Supercharge”, RB has
been more effective in terms of cost management, which leads to projected higher
operating margin in the coming years. As RB has been diversifying their business,
the growth of wealth in emerging markets contributes to the growth of sales,
especially in RB's health and hygiene division.
Valuation: The valuation of discounted cash flow model and relative
valuation results in the intrinsic value of £66.21 and £65.74 respectively, which
are higher than the current price, leading to a BUY recommendation.
Main Risks: As 92% of net revenue is derived from countries outside
UK, there exists substantial currency risk for the business. The growth rate of
revenue is constrained by the slowdown in emerging market such as China. The
globalized business gives rise to the regulation and legal risk.
Financial position: The profitability and solvency of RB outperform the
peers in the consumer product industry. While the liquidity is below industry
average, we estimate it will increase in the following years.
Recent News
Reckitt Benckiser Share Repurchase Programme: up to £800 million
(12/30/2015): RB has announced a share repurchase programme. In 2016, RB is
going to repurchase the company’s ordinary shares of ten pence each to a
maximum of £800 million in order to offset the dilutive impact of employee share
schemes.
Reckitt Benckiser’s Strong Q3-2015FY Performance, Target Revenue
Increased (21/10/2015): In Q3 2015, the revenue in European and North
American market grew by 7%, and Emerging market by 10%. Health and
Hygiene brands achieved a +8% growth. RB’s full year like-for-like revenue
growth target has been adjusted to +5%.
Reckitt Benckiser Board Change: Peter Harf left RB board (12/21/2015):
Perter Harf retired RB board after 16 years of service but would continue to be
an investor in RB.
As a result of RB'S focus on high quality carbon emission, it has been
the leader of Carbon Disclosure Project for the seventh year running (11/10/2015).
Source: Bloomberg
Holding period return
End of 2013 23.56%
End of 2014 11.21%
End of 2015 20.56%
Market Profile
Closing Price 6281p
52‐Week Price
Range
5340p ‐ 6450p
Average Daily
Volume
5881.417
Shares outstanding 707.6M
Market Cap 42,513.8M
Dividend Yield 2.15%
P/E 27.7
P/B 6.87
EV/ EBITDA 20.1
Source: Bloomberg
Source: Bloomberg
2.17 2.40 2.51 2.42
4.47
0
1
2
3
4
5
FY 2010 FY 2011 FY 2012 FY 2013 FY 2014
RB Earnings per Share
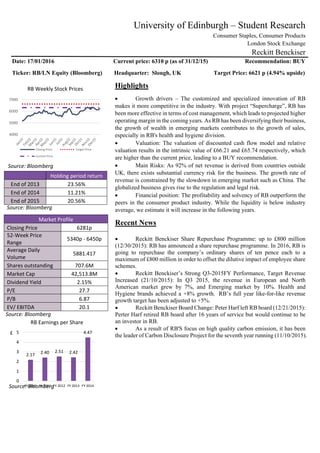
4000
5000
6000
7000
RB Weekly Stock Prices
Closing Price Target Price
Current Price
Source: Bloomberg
Source: Bloomberg
£
2. Business Description
Reckitt Benckiser Group plc (RB), headquartered in Slough, England, was
formed in 1999 by the merger of the UK-based Reckitt & Colman plc and
the Netherlands-based Benckiser NV. RB has operations in around 60
countries and its products are sold in nearly 200 countries.
Categories - Most of RB’s products are categorized into three main areas:
health, hygiene and home, which accounted for 92% of their core net
revenue in 2014. In addition, RB’s other products include food,
pharmaceuticals and portfolio brands.
Segments - Geographically, RB divides its world market into three
categories, Latin America, Asia Pacific region (LAPAC), Europe, North
America region (ENA) and Russia, Middle East and Africa region
(RUMEA) (see Table 1 for detailed explanation). ENA, RB’s mature
market, makes up 58% of the total revenue, which is the most among the
three, has a steady growth rate of 2%. In RUMEA, the emerging market
for RB, the revenue experienced strong double-digit growth of 11%. RB’s
brand penetration and capability make a strong contribution to total net
revenues. LAPAC is the second emerging market for RB. Facing the
slowdown of GDP growth and negative currency effects in this region, RB
still achieved revenue growth of 5%. From 2015, in order to simplify its
organizational structure, RB combined RUMEA and LAPAC to form a
new segment called DVM, which stands for developing markets.
Strategy - RB’s main strategy is to stay innovative, focusing on their
Powerbrands and Powermarkets in order to build their brand and expand
into areas with long-term growth potential.
Organization - RB’s goal is to become a simpler and more agile
organization. “Supercharge” would improve the operating process and
make RB more responsive to consumers and customers need. The growth
in emerging market is assumed to continue at a steady rate, RB is dedicated
to investment within ENA in order to improve their share of emerging
market.
Powerbrands - 80% of RB’s Total Net Revenue are from 19 Powerbrands
in Health, Hygiene and Home categories. Health and Hygiene comprise
75% of core Net Revenue (Figure 2), which shows the importance of these
two categories to RB. RB is going to continue focusing on these three main
product categories and prioritize investment on Health and Hygiene.
Powermarkets - RB sees exceptional potential for growth in 16
Powermarkets, a significant amount of which are in emerging markets.
Emerging markets are now 42% of Core Net Revenue (Figure 3), impacted
by devaluation of certain emerging market currencies. RB will continue to
focus and prioritize investment in the Powermarkets.
7,800
8,000
8,200
8,400
8,600
8,800
9,000
9,200
9,400
9,600
9,800
FY
2010
FY
2011
FY
2012
FY
2013
FY
2014
FY
2015E
FY
2016E
Health,
32%
Hygiene,
43%
Home,
21%
Other,
4%
Health Hygiene Home Other
ENA
58%
RUMEA
15%
LAPAC
27%
ENA RUMEA LAPAC
Source: Company data
Source: Company data
ENA RUMEA LAPAC
North America Russia & CIS North Asia
Central Europe Middle East South East
Northern Europe North Africa Asia
Southern Europe Turkey Australia
Western Europe Sub-Saharan New Zealand
Africa Latin America
Figure 2: RB's Revenue by Categories
Table 1: RB Market Segments
Source: Company data
Figure 3: RB's Revenue by Segments
Source: Company data
Figure 1: RB's Revenue
£ Million
3. Margins - RB incurred a strong adjusted operating margin expansion in
2014 of +160bps, driven by +100bps in gross margin. RB will continue to
pursue a product differentiation strategy (Figure 4). Higher gross profit
will be partially reinvested in brands, capabilities, development and
moderate margin expansion. In order to achieve this, RB will continue to
use its virtuous earnings models and adopt a moderate operating margin
expansion target in the medium term.
Industry Overview and Competitive Positioning
The health, hygiene and home care industry is commonly categorized by
consistent growth in demand, with some deviations due to macro-
economic factors. Emerging markets tend to demonstrate more volatile
demand in response to these said factors. RB remains the leader or close
second in the company’s fast growing categories, largely propelled by
outstanding level of innovation. However, RB’s products are biased
towards developed markets, which has been suffering from sluggish
consumer demand and insubstantial economic recovery.
Future demand drivers
Future demand for consumer products will be driven by longer life
expectancy (Figure 5) and the desire to live healthier and different
lifestyles. The increasing spending power from upwardly mobile middle
and lower classes implies CP companies have to stay innovative in order
to achieve increasingly more active online and interconnecting with one
another through social and media. Technology allow consumers to
customize the buying process, which has become integral factor in
influencing the consumer route to purchase. Consumers now demand
pertinent, personal, and appealing shopping experience, therefore
challenging CP companies to engage with consumers online and
personalizing individual shopping experience.
Emerging markets
General consumer spending remains restrained due to comparatively
unoptimistic economic forecasts. Slow growth in wages and high savings
rate combined with rising wealth inequality suggests consumers are still in
a recessionary attitude. Majority of customers are still cautious in regards
to spending, this is reflected by flat unit sales in the CP industry. Although,
US economy shows signs of recovery, European and emerging markets
are exhibiting signs of slowing growth. CP companies are hopeful that
emerging markets beyond BRIC will drive future growth. RB had above
average growth in its LAPAC and RUMEA region (currently 42% of core
revenue), future strategy focuses on cultivating these two regions so that
it becomes 50% of core Company net revenues by 2016.
New middle-class consumers in emerging markets
24.73% 24.40%
19.86%19.60%
14.49%
9.51%
15.92%
17.68%
0%
5%
10%
15%
20%
25%
30%
69
70
71
72
73
74
75
76
74
76
78
80
82
84
2000 2002 2004 2006 2008 2010 2012
OECD Emerging
0% 50% 100%
RB
PG
UNILEVER
CHURCH&DWI
GHT
CLOROX
Developed Developing
Source: OECD
Source: Bloomberg
Source: Bloomberg
Figure 4: Operating Margin
Figure 5: Life Expectancy
Figure 6: Revenue by Geography
4. In the upcoming years, the growth of emerging markets will continue to
surpass that of the developed by an increasing margin. By 2020, more than
1 billion new consumers will spend between $10 and $100 per day. Many
of RB’s competitors already have an established presence in emerging
markets. By 2020, Unilever expects to derive 70% of its total sales (56%
in 2012) from these markets. P&G aims to add one billion new customers
from emerging markets by 2015 (25% increase from 2012) and emerging
markets will make up 40% of revenue in 2016 (34% in 2010). Innovative
geographic restructuring will be driven by reorganization of investment
and management abilities. Currently, 36% of RB’s management focuses
on 6 billion consumers in emerging markets, as opposed to 64% focused
on the 0.9 billion consumers in developed markets. In emerging markets,
the acquisition of Oriental Medicine Company Ltd, which sells leading
sore throat, licensing deal with BMS for cough reliever and painkillers and
the acquisition of Schiff nutrition will support RB in promoting a new
healthcare orientated platform in the upcoming years.
Competition
RB’s competitors operate in various segments of the industry. They
directly compete with many well-established companies, many of which
are MNCs that have substantial resource to launch and protect own
products, market shares and brands. RB competes in branded segments by
concentrating on its leading positions in higher growth categories (health,
home and hygiene). Consumer health products is the fastest growing
segment of RB (like for like sales increase by 11% compare with 8% dip
in pharmaceuticals), through a combination of consolidation and organic
growth strategies. However, RB objective to expand its healthcare
platform in emerging markets is challenging, since OTC medicine is easier
to sell in developed markets than developing markets. Mergers between
Pfizer and Allergen and a joint venture between GSK and Novartis also
present challenges. RB may be forced to sell slow growth segments and
underperforming brands in the food and home (Figure 8) division (Vanish,
Airwick, French mustard) to divert more resources to consumer healthcare.
Competitive positioning
Leading position in the industry
Shown by the Figure 9, RB has relatively high EBITDA growth rate
compared with companies with similar market capitalization in the
industry. Due to the high quality and customization of products, RB enjoy
great popularity among consumers, especially hygienic product, which
represents RB’s great trademarks. On the other hand, RB’s lack of private
label could be their weakness and threatens Mucinex, RB’s branded
products.
Superior innovation capability
2009
1966 1974
1810
1700
1750
1800
1850
1900
1950
2000
2050
2011 2012 2013 2014
0
100
200
300
400
500
600
700
800
900
1000
0
5000
10000
15000
20000
25000
30000
35000
2011 2012 2013 2014
Disposable Income/Capita
Healthcare spending/ Capita
RB
CHD
P&G
Unilever
Kao
Henkel
Colgate
Clorox
0%
5%
10%
15%
20%
25%
30%
35%
40%
45%
‐8% ‐6% ‐4% ‐2% 0% 2% 4%
Market capitalization share
Source: OECD
Source: Company Data
Source: Team Estimate
Figure 7: Healthcare Spending in China
Figure 8: Home Segment Revenue
Figure 9: EBITDA growth/
Market capitalization share
5. Innovation is one of the significant factor strengthening the power of RB’s
brands, and consolidates their market place continuously. Since RB mainly
focus on the improvement of existing Powerbrands instead of creating new
brand. R&D spending is relatively low compared to peer companies
(Figure 10), representing 8.69% of R&D over net income. Moreover, they
take consumers’ needs into consideration when developing their products,
therefore creating customer orientated products.
Diversified markets
RB’s market spreads among different countries and regions with 56% from
Europe and North American and 26% from Latin American and Asian
(Figure 11). Diversified market gives great potential to increase their sales
from larger consumer groups and be more competitive among their
rivalries. RB’s globally diversified business is due to their strategy of
market expansion strategy of buying other company’s products and
acquisition. For example, in the 20th
century, RB launched into the
American market by buying the US companies’ products, e.g. Airwick,
and acquiring the relevant power brand in the USA, e.g. Lysol. This
strategy also reflects the capacity of management.
Investment Summary
We issue a Buy Recommendation on Reckitt Benckiser (RB) with a target price
of £66.21 using a Discount Cash Flow Analysis (DCF) and a Relative Valuation
Model, Some merits and concerns are taken into consideration:
Merits:
The launch of “Supercharge” project
RB has been able to take advantage of economies of scale to achieve a high
operating margin. RB is the industry leader and is going to maintain its advantage.
In order to maintain their high growth rate and strong margin expansion, RB has
launched the “Supercharge” project (See Table 2 for details).
The project are expected to further increase the revenue and reduce the cost of
RB’s business. Thus, RB is expected to maintain a high growth in revenue and
further expand its operating margin.
The focus on the Powerbrands and Powermarkets
In 2014, the three key sectors of RB, Health, Hygiene and Home has taken up 97%
of the core net revenue, 32%, 43% and 21% separately (Figure 12). The like for
like growth rate is 8%, 3% and 1% separately. RB is going to mainly focus on the
development of Health and Hygiene sectors, it is expected the revenue of these
two sectors are going to take up more of RB’s revenue. Also, Health and Hygiene
are expected to keep a high growth rate because people’s increasing concern
about their health and living standard.
Table 2: Supercharge Project
1
Investing in RB’s brand by mergers and
acquisition in the Health, Hygiene and
Home categories.
2
Taking the opportunities of digital
revolution in terms of both
Advertising and the way how people
3 Simplifying the organization.
8.69%
14.34%
17.04%
20.61%
25.18%
10.47%
0%
5%
10%
15%
20%
25%
30%
55.91%
26.49%
14.02%
3.58%
Europe, North America
Latin America, Asia Pacific
Russia, Middle East and Africa
Food
Source: Bloomberg
Source: Bloomberg
Source: Company Data
Figure 10: R&D/Net income
Figure 11: RB Markets
6. The emerging market has taken up 42% of RB’s core net revenue (Figure 16).
The like for like growth for the two component of emerging market is 11% and
5% separately, which is higher than the 2% growth of the developed market.
Emerging market has become the driving force for RB’s growth. It is expected
that RB is going to further expand their emerging market, thus the revenue is
expected to further grow.
The high operating margin
RB has the highest operating margin among its peers. Expanding operating
margin has become one of RB’s strategy. RB is expected to continue managing
its cost efficiently by launching the Supercharge project. Furthermore, RB’s R&D
expenditure has been very effective, and RB is expected to keep innovating to
suit the consumer’s need. Thus RB’s operating margin is expected to further
increase.
High level of financial flexibility
RB is the least indebted Consumer Product company compared with its peers.
Despite numerous acquisition projects and expansion projects, the current
Debt/Equity ratio is as low as 0.38, compared to a 4.24 peer average, and the ratio
follows a downward trend. RB has the financial flexibility to further invest in
high profit projects and involve in mergers and acquisitions, which will benefit
its revenue and profit growth.
The recovery of the global economy
The world GDP is estimated to grow at a steady rate of 3.5% - 4% from 2016 to
2020 by IMF (Figure 13), and the inflation rate is estimated to fluctuate around
3.5% by IMF. From 2016 to 2020, GDP per capita is estimated to grow at 4% in
Advanced Economies and 5-6% in Emerging and developing economies by IMF
(Figure 14). With a steady growth in wealth and a steady inflation, people
generally are more willing to invest, which is a positive sign for the equity market.
Furthermore, we found that from 2010 to 2014, the ratios of revenue to GDP per
capita were relatively stable in Latin America, Asia Pacific region (LAPAC),
Europe, North America region (ENA) and Russia, Middle East and Africa region
(RUMEA). Thus RB’s revenue is expected to increase.
Concerns:
Future growth constrained by the slowdown in emerging markets.
Emerging markets have been the driving force for world GDP for several years.
However, although the growth rate is still higher than the advanced market, it is
expected to slow down. For example, China has a GDP growth rate of below 7%
compared to a growth rate of 9.3% in 2011. On the other hand, RB is going to
expand emerging markets. There are some concerns on how successfully this
strategy will be executed.
Increase of private label penetration increase the level of competition.
According to Statista, in 2013 the market share of private label in Switzerland
was about 45 percent of total retail sales, which is the top of the list. UK's and
US’s private label market share amounted to 41% and 18% respectively (Figure
32% 29% 22% 24%
43% 43%
38%
43%
21% 22%
21%
24%
4% 6%
19%
9%
0%
20%
40%
60%
80%
100%
2014 2013 2012 2011
Health Hygiene Home Others
0%
1%
2%
3%
4%
5%
6%
7%
8%
World Advanced Emerging
0%
1%
2%
3%
4%
5%
6%
7%
8%
Advanced Emerging
Source: Bloomberg
Source: Team Estimate
Source: OECD
Figure 12: RB’s Change of Revenue
Composition by Categories
Figure 13: GDP growth and
Expected growth
Figure 14: GDP per capita growth
7. 15). RB’s revenue may suffer from the acceleration of private market penetration
since RB is a branded product manufacturer and does not own private labels.
Legal and Regulation concerns
RB is a multinational company, which is subject to tax laws, pricing regulations
and health regulations in different jurisdictions. RB is exposed to the risk of
change of legislations and regulations that will likely to reduce RB’s future
revenue.
Financial Analysis
Overview
The financial situation of RB is highlighted in the chart above, highlighting
our assumption for the company and CP industry going forward. Aging
population and surge in spending on pharmaceuticals present numerous
benefits for RB moving forward. Acquisition of well-known brands
(Schiff Nutrition and K-Y brand) will allow RB to rapidly expand to
industry compared with organic growth. They are capable of sustaining
sales growth despite modest growth in CP industry as a whole due to strong
managerial strategy focusing on profitable operating segment. RB’s return
value to shareholders is indicated by consistent dividend pay-out ratio of
50% and yearly growth in EPS.
DuPont Analysis
In the analysed historical period, RB’s ROE was (2010, 16.9% 2012, 17.4%
2013, 17.7% 2014, 29.3%). Our analysis indicate ROE forecasts (2015E,
32.5% 2016E, 30.4% 2017E, 29.4% 2018E, 30.3% 2019E, 32.5%) mainly
due to stable growth in net income margin. Our evaluation indicates
Year 2010 2011 2012 2013 2014 2015E 2016E 2017E 2018E 2019E
Profitability
EBITDA Margin 30.82% 29.30% 30.00% 27.14% 28.19% 33.40% 33.39% 34.30% 34.15% 34.02%
NOPAT Margin 18.66% 18.25% 18.93% 18.31% 36.26% 37.21% 37.29% 38.35% 38.37% 38.39%
ROA 11.45% 11.86% 11.99% 11.08% 20.70% 21.77% 21.82% 22.66% 22.97% 23.31%
ROE 16.95% 17.45% 17.73% 14.93% 29.38% 32.55% 30.45% 29.49% 30.37% 32.54%
Net profit margin (ROS) 35.33% 34.35% 34.65% 7.68% 31.82% 37.37% 37.42% 38.45% 38.45% 38.45%
Liquidity
Current ratio 0.48 0.55 0.50 0.56 0.64 0.63 0.65 0.67 0.71 0.72
Quick ratio 0.33 0.35 0.34 0.37 0.39 0.41 0.42 0.43 0.45 0.46
Cash ratio 0.11 0.12 0.14 0.15 0.18 0.19 0.20 0.21 0.22 0.22
Activity
Accounts receivable turnover 6.90 7.68 8.14 8.56 8.17 8.04 8.01 8.00 8.00 8.00
Asset turnover 0.61 0.65 0.64 0.61 0.58 0.60 0.61 0.61 0.62 0.63
Inventory turnover 5.76 5.40 5.41 5.02 4.91 4.38 4.15 3.95 3.77 3.59
Financial leverage
Debt to equity 0.52 0.43 0.55 0.44 0.38 0.52 0.45 0.34 0.26 0.40
Financial leverage 0.47 0.49 0.49 0.41 0.44 0.48 0.39 0.30 0.32 0.39
Liabilities‐to‐equity 1.15 1.00 1.12 1.01 0.92 1.30 1.18 0.91 0.72 1.11
Net debt to net capital 0.40 0.32 0.40 0.31 0.24 0.32 0.27 0.19 0.15 0.21
Shareholder ratio
Dividend pay‐out ratio 50% 50% 50% 50% 50% 50% 50% 50% 50% 50%
EPS £2.40 £2.51 £2.42 £4.47 £2.49 £2.60 £2.74 £2.89 £3.04 £3.04
45%
41%
41%
34%
18%
15%
0% 20% 40% 60%
Swizerland
Spain
United Kindom
Germany
United States
Colombia
60% 55% 54% 55% 56%
23% 25% 27% 27% 26%
13% 16% 15% 15% 14%
0%
20%
40%
60%
80%
100%
120%
2010 2011 2012 2013 2014
Europe, North America Latin America,Asia Pacific
Russia, Middle East, Africa Food
Source: Bloomberg
Source: Statisa
Figure 15: Market share of Private
label brands worldwide in 2013
Figure 16: RB growth by Segments
Table 3: Financial Position
Source: Team Estimate
8. expected levels of ROE to be more attractive compared to historical
performance. Overall, we expect growth trends to endure in the future with
more proportion of sales coming from hygiene and healthcare, and less
from deteriorating home department. In the periods analysed, RB’s ROE
is at industry average, however we project it to develop to industry leading
levels by 2019 due to superior net income margin and total assets turnover.
The higher values shows generally positive company operation in terms of
generating income on new investment.
Optimistic Growth
RB’s superior gross margins and like-for-like growth is led by its health
and hygiene division. Its health products have captured a large share of the
market due to high consumer trust and loyalty. From a geographic
perspective, growth was broadly based as shown by Figure 16. Developed
markets delivered like-for-like growth of +2%, a sizeable performance
considering general demand for consumer product remains weak.
Emerging market areas (LAPAC and RUMEA) delivered +7% like-for-
like growth despite slowing market conditions and fierce competition.
Projected mid to long term gross margin will remain at a high level (50%)
arising from cost saving “Supercharge”, which is a three year program that
will generate cost saving benefits of £100 to £150M per year indefinitely.
Financial flexibility
Invested long term capital and debt, comprises a company's capitalization
and acts as a stable form of financing to sustain growth. RB is currently
the least indebted consumer product company compared with its peers. It
has remained financially stable despite numerous acquisition projects and
expansion projects. Current Debt/Equity ratio is 0.38 and is displaying a
downward moving trend. Vice versa, competitor’s average is 4.24. This
conservative leverage position is also apparent in its net debt to capital,
which has consistently been lower than 1 despite mass expansion in
operation in the last few years. Projected future net debt to capital will
continue to decline to 0.15 in 2019E. Estimated debt levels will maintain
at current level, as RB states that they do not plan to issue new debt in the
foreseeable future.
Debt financing for new projects
As illustrated by Figure 18 RB has extra capacity for debt to finance future
growth opportunities, we believe that incurrence of more debt would be
favourable for RB, taking into consideration the cash generation ability
and overall sound financial position, especially in low interest rate
environment. In terms of liquidity measures, RB is currently
underperforming relative to peer groups (Current Ratio 0.64, Peer 1.29
Quick Ratio 0.39, Peer 0.73). However, it is not an accurate reflection of
financial health, as RB is capable of generating sufficient cash flow from
its operations to stave of debt. Furthermore, we project these two figures
2015E FCFF FCFE
Intrinsic Value
Per Share
£66.21 £64.17
Buy Price (20%) £52.97 £51.33
Sell Premium
(15%)
£76.14 £73.79
0%
5%
10%
15%
20%
25%
30%
35%
40%
45%
0
2000
4000
6000
8000
10000
12000
Net Profit/Loss
Sales
EBITDA Margin
Net profit margin (ROS)
0
5000
10000
15000
20000
2010
2011
2012
2013
2014
2015E
2016E
2017E
2018E
2019E
Net assets Net debt
Source: Team Estimate
Source: Team Estimate
Source: Team Estimate
Figure 17: Stable Margins
Figure 18: Net asset and Net debt
Table 4: Valuation Result
9. to grow in the next 5 years as a result of stable debt level and large asset
base growth from acquisitions. The stable liquidity position is
continuously reflected by Moody's strong credit rating of A1.
Valuation
Valuation target price: £66.21 Recommendation: Buy
We mainly used discounted cash flow (DCF) model and relative valuation model
to evaluate the value of RB.
DCF Valuation
The revenue of RB is forecasted under a two-stage growth assumption. The first
stage assumed a high sales growth and high margin of RB forecast until 2020 and
a steady growth rate of 2% after 2020 in the second stage. Based on the detailed
Free cash flow to the firm (FCFF) analysis, the target price of RB is £66.21 (Table
4). Details of the DCF assumptions are shown in appendix C.
Sales
The sales growth of RB is mainly based on (1) the ratio of revenues and GDP per
capita in the three core markets: Latin America, Asia Pacific; Europe, North
America and Russia, Middle East and Africa (2) the corresponding expected GDP
per capita (3) development of innovative products and (4) Merger and acquisition
of competitive brands in different markets (Figure 19). The revenue of RB is
mainly driven by Health and Hygiene sectors in the three core markets.
Terminal growth
As the consumer product industry is expected to grow continuously due to the
higher living standard, wealth and expected inflation, the inflation adjusted
revenue growth is assumed to be 2.00%.
Dividend policy
Started from 2009, the dividend policy was set at the dividend payout ratio
equivalent to 50% of adjusted net income (Table 20). According to the annual
report in 2014, RB intends to maintain the current policy in the coming years.
Capital Expenditure
The expansion in Capital Expenditure (CAPEX) is driven by the increasing sales
from hygiene and health sector. CAPEX is adjusted due to the potential sale of
assets or production line in home sector. As the ratio of CAPES to Sales is
relatively stable, ranging from 1.64% to 1.78%, CAPEX will be increased
steadily when the sales growth stabilized at 2.00% after 2020 (Table 21).
Weighted Average Cost of Capital
CAPM was used to calculate the cost of equity. 10-year US Treasury bond rate
was taken as risk-free rate for long term investment. The world equity premium
is calculated by the weighted GDP times risk premium in the markets over the
world. The 5-year adjusted beta relative to the MSCI world index was 0.628. The
low cost of equity (6.61%) can be explained by the positive surprise which
reflected the low risk business with historical beta of 0.628 and high premium
with consistently positive earnings surprise by RB (Table xx). The cost of debt
1.55%
1.60%
1.65%
1.70%
1.75%
1.80%
£0
£2,000
£4,000
£6,000
£8,000
£10,000
£12,000
Million
Sales
Capital Expenditures
CAPEX/Sales
Source: Bloomberg
Figure 20: Projected total sales
and Sales breakdown
0
2,000
4,000
6,000
8,000
10,000
12,000
2015E 2016E 2017E 2018E 2019E 2020E
Sales (million)
Latin America, Asia Pacific
Europe, North America
Russia, Middle East and Africa
Food
Total Sales
0.00
0.50
1.00
1.50
2.00
2.50
3.00
2009 2010 2011 2012 2013 2014
Value per share
Normalized Net Income per share
Dividend per share
Source: Team Estimate
Figure 19: RB’s dividend per share and
Normalized net income per share
Figure 21: Projected CAPEX, Sales,
CAPES/Sales
Table 5
Source: Team Estimate
10. was calculated by the risk-free rate plus A+ corporate bond spread. After
considering the tax shield effects, weighted average cost of debt after tax was
2.18%. The target capital structure of RB is similar to the current capital structure
of 98% equity and 2% debt (Table 5). Sensitivity analysis was conducted to
reflect the change of WACC on intrinsic value of RB (Table 6).
Sensitivity Analysis
Based on DCF analysis, the intrinsic value of PB is 6621p per share. WACC and
the perpetual growth rate in our DCF model are 6.54% and 2.00% respectively.
The sensitivity to changes in WACC and perpetual growth rate are depicted
below (Table 7 and Table 8).
Relative Valuation
Appropriate peer groups are identified by the nature of business, geography and
market capitalization. Relative valuation used current benchmark P/E, P/BV, and
EV/EBITDA and the forecasted earnings per share, book value per share, cash
flows and EBITDA of RB to evaluate the intrinsic value. P/S was not taken into
consideration as RB has a high margin comparing to the peer companies, ratio of
P/S could not reflect its value to the shareholders. In contrast, P/E had a strong
correlation to long-term returns to shareholders. Expected high sales and high
margin give a high expected future earnings. Thus, this relative valuation gives
an intrinsic value of £65.70 which is 4.12% premium to the current market price.
This is consistent with our DCF model of target price £66.21 and buy
recommendation.
Risks to price target
Downside risks: 1. Competitive environment in the consumer products industry,
especially in health sector 2. Slowing market growth of household categories 3.
Upside risks: 1. Merger and acquisition in the consumer health, strengthening the
market growth 2. Higher efficiency and EBITDA margin than the expectation
after supercharge projects 3. Diverting investments of peers to other categories
that RB has relatively less exposure.
Investment Risk
Legal Risk | Regulatory and law compliance (LR1)
RB is subject to the UK Bribery Act 2010, the US Foreign Corrupt
Practices Act of 1977 and similar laws worldwide. If it is found to be non-
compliant with applicable laws and regulations, RB could be subject to
civil remedies such as fines, injunctions or product recalls, and criminal
sanctions. In particular, health regulatory that typically involves
manufacturing standards, licenses, distribution, laws and product safety
and quality can change and may become more stringent for RB in the
future.
Legal Risk | Tax Legislation (LR2)
RB is subject to tax laws and transfer pricing regulations in multiple
jurisdictions. Affected by changes in the tax laws of the jurisdictions in
which RB operates, its effective tax rate may increase, and may incur
significant costs and unprovisioned cash outflows.
0
5
10
15
20
25
30
P/E P/BV EV/EBITDA
Ratio
RB Adjusted industry average
Source: Bloomberg & Professor A.Damodaran
Table 6
Figure 22: P/E, P/BV and EV/ EBITDA
of RB and Adjusted industry average
in 2014
2015E P/E P/BV
Current Price £63.10 £63.10
Intrinsic Value per share £65.70 £65.79
Premium 4.12% 4.26%
Recommendation Buy Buy
Source: Bloomberg
Source: Team Estimate
Source: Team Estimate
WACC Analysis
Risk Free Rate 2.03%
Market Risk Premium 7.30%
Beta 0.628
Cost of Equity 6.61%
Risk Free Rate 2.03%
Bond Risk Premium
(A+ Corporate Bond)
1.10%
Cost of Debt 3.13%
Tax rate 23.44%
After tax cost of debt 2.40%
Target corporate structure
Equity 98%
Debt 2%
WACC 6.54%
Table 7
Table 8
Source: Team Estimate
Source: Team Estimate
Perpetual
Growth
WACC
1.00% 1.50% 2.00% 2.50% 3.00%
5.54% £68.60 £75.81 £85.05 £97.33 £114.46
6.04% £61.72 £67.39 £74.46 £83.53 £95.58
6.54% £56.09 £60.64 £66.21 £73.15 £82.05
7.04% £51.38 £55.12 £59.59 £65.05 £71.86
7.54% £47.40 £50.50 £54.17 £58.56 £63.92
11. Operational Risk | Business interruption (OR1)
RB faces risks of interruptions of supply chain arising from certain
specialised suppliers, both of raw materials and of third party
manufactured items. When a supplier fails to fulfil contractual obligations,
it requires investment and may take time to replace suppliers, which could
affect their ability to source raw materials and negatively impact their costs.
Operational Risk | Reputational risk (OR2)
Systemic product quality and safety issues would reduce consumer
confidence and have a significant impact on reputation of the brands,
particularly in the growing Health Care portfolio. The risk is related to
areas such as labour standards, health, safety and environmental
performance.
Operational Risk | Competition in household and cosmetics (OR3)
The business in household and cosmetics sector is in a competitive
industry and faces fierce competing from a number of international
companies. This sector is also exposed to competition from private label
products manufacturers and industry consolidation among its mass
retailers, which could impact RB’s income and profitability.
Market Risk | Main Markets’ Slow-down (MR1)
RB could be adversely affected by economic conditions and political
developments of the markets in which it operates. Revenue from
developing markets constitutes around 30% of the group sales. The growth
and profit of group would be affected by the slowdown in GDP growth in
key developing markets such as China. In such periods, governments in
those regions may take actions in fields such as trade restrictions, currency
controls and changes in taxation regimes. In addition, the latest figures
show the lowest rise in consumer prices of Germany since October 2009.
There is a risk the ECB may not fulfil its mandate of 2% inflation also,
which may adversely influence RB’s revenue.
Market risk | Exchange Rate Risk (MR2)
In FY 2014, 92% of RB’s net revenue was derived from markets outside
the United Kingdom. RB is subject to the risk that countries in which it
operates may impose or increase exchange controls or devalue their
currency. It operates in a number of countries, particularly emerging
markets, which impose exchange controls such as Russia, China and India.
Such controls may restrict the company to convert local currency into other
currencies, restrict its ability to repatriate earnings from a country, which
could materially adversely affect its business, liquidity and results of
operations.
Appendix A: Statement of historical and forecasted financial position
In Millions of GBP Historical Balance Sheet Forecasted Balance Sheet
12 Months Ending FY 2010 FY 2011 FY 2012 FY 2013 FY 2014 FY 2015E FY 2016E FY 2017E FY 2018E FY 2019E FY 2020E
ASSETS
2015E EV/ EBITDA
Current EV per £56.93
Intrinsic Value per £59.92
Premium 5.25%
Recommendation Buy
Source: Team Estimate
RB %Surprise
Q4 11 7.60%
Q3 11 1.90%
Q2 11 3.42%
Q1 11 2.91%
Q4 10 ‐5.28%
Q3 10 5.99%
Q2 10 4.38%
Q1 10 2.33%
Average 2.99%
MR2 OR3
MR1
LR2 LR1 OR1
OR2
LOW MEDIUM HIGH
Impact
Probability
LOW MEDIUM HIGH
Table 9
Figure 23: Risk Matrix
Source: Team Estimate
Source: Bloomberg
17. Appendix C: DCF Assumption
Breakdown of Revenues in different markets
Regions Factors 2010 2011 2012 2013 2014 2015E 2016E 2017E 2018E 2019E 2020E
Latin America,
Asia Pacific
GDP per capita 60052.33 62715.49 64437.34 67938.82 71960.62 76248.9054 80981.2 86087.70934 91608.31 97514.65 103854.2
Revenue 1,784.00 2,210.00 2,327.00 2,511.00 2,341.00 2,600.85 2,762.27 2,936.45 3,124.76 3,326.22 3,542.46
Revenue/ GDP per capita 2.97% 3.52% 3.61% 3.70% 3.25%
Average Revenue/ GDP per capita 3.41%
Europe, North
America
GDP per capita 44823.37 45571.06 45996.45 46493.81 47182.02 47578.3573 48211.44 49057.35272 49874.22 50565.13 51180.6
Revenue 4,592.00 4,837.00 4,744.00 5,074.00 4,940.00 5,001.06 5,067.61 5,156.52 5,242.38 5,315.01 5,379.70
Revenue/ GDP per capita 10.24% 10.61% 10.31% 10.91% 10.47%
Average Revenue/ GDP per capita 10.51%
Russia, Middle
East and Africa
GDP per capita 254792.8 265762.8 274376 276937.4 273421.6 261699.836 259375.6 261476.1058 264930.4 268387.1 271869.3
Revenue 1,038.00 1,364.00 1,338.00 1,356.00 1,239.00 1,247.82 1,236.74 1,246.75 1,263.22 1,279.71 1,296.31
Revenue/ GDP per capita 0.41% 0.51% 0.49% 0.49% 0.45%
Average Revenue/ GDP per capita 0.48%
Food Revenue 302 312 321 325 316 319.691472 323.4261 327.2042883 331.0266 334.8937 338.8058
All Total Revenue 7,716.00 8,723.00 8,730.00 9,266.00 8,836.00 9,169.42 9,390.04 9,666.93 9,961.39 10,255.83 10,557.28
GDP per capita for each market is calculated by the weighted average of the GDP of countries in the
region times the GDP per capita. Since revenue of consumer product industry is highly linked to wealth
which is represented by the GDP per capita. From 2010 to 2014, we found that the ratios of revenue to
GDP per capita were relatively stable at 3.41%, 10.51% and 0.48% respectively in Latin America, Asia
Pacific region, Europe, North America region and Russia, Middle East and Africa region. Under the
assumption of the ratio of average revenue to GDP per capita remained stable in the future and based
on the forecasted GDP per capita provided by International Monetary Fund, the projected revenue of
RB from 2015 to 2020 is calculated.
Cost of Goods Sold
In Millions of GBP Historical Balance Sheet Forecaste
12 Months Ending FY2010 FY2011 FY2012 FY2013 FY2014 FY2015E FY2016E FY20
Revenue 8453 9485 9567 9266 8836 9169.422 9390.037 9666
Cost of Goods &
Services (COGS)
3228 4036 4029 4008 3740 3677.221 3762.661 3874.398 3994.291 4114.1008 4238.6434
COGS/Revenue 38.19% 42.55% 42.11% 43.25% 42.33%
Average of
COGS/Revenue
41.69%
From the historical income statements, SG&A accounts for 41.69% of total revenue on average. Since
the COGS are mainly variable costs and RB has a moderate bargaining powers relative to the suppliers,
we predict that the ratio of average COGS to Revenue would maintain at similar level in the coming
Source: IMF Data Statistics and Team
Source: IMF Data Statistics and Team
18. years. With the increase in forecasted revenue, the COGS also increased in proportion from 2016 to
2020.
Selling General & Administrative Expenses (SG&A)
In Millions of GBP except
Per Share
FY 2010 FY 2011 FY 2012 FY 2013 FY 2014 FY 2015E FY 2016E FY 2017E FY 2018E FY 2019E FY 2020E
12 Months Ending 12/31/2010 12/31/2011 12/31/2012 12/31/2013 12/31/2014 12/31/2015 12/31/2016 12/31/2017 12/31/2018 12/31/2019 12/31/2020
Revenue 8453 9485 9567 9266 8836 9169.422 9390.037 9666.93 9961.393 10255.83 10557.28
Selling, General & Admin
(SG&A)
2769 2897 2828 2968 2779 2867.14 2936.123 2922.703 3014.778 3106.844 3201.103
SG&A/Revenue 32.76% 30.54% 29.56% 32.03% 31.45%
Average of SG&A/Revenue 31.27%
Based on the historical income statements, we found that the SG&A accounts for 31.27% of total
revenue. According to RB’s annual report in 2014, over 50% of the marketing activities are focused on
digital media. It is foreseeable that RB would put more resources on digital media to expand their
markets and with the forecasted increase in revenue, the SG&A would also increase in proportion with
revenue from 2015 to 2020.
Depreciation and amortization
The growth of depreciation is mainly driven by the merger and acquisition of new brands and properties
which outweigh the potential disposal of business line and thus the depreciation to the total revenue
would increase slightly until RB reached the terminal growth.
Source: IMF Data Statistics and Team Estimate
19. Appendix D: Macroeconomics
Growth of GDP (constant prices) in different regions
Region 2010 2011 2012 2013 2014 2015 2016E 2017E
World 5.43% 4.23% 3.43% 3.31% 3.43% 3.12% 3.56% 3.81%
Advanced 3.09% 1.70% 1.19% 1.14% 1.83% 1.98% 2.23% 2.23%
Euro Area 2.05% 1.64% ‐0.81% ‐0.28% 0.87% 1.48% 1.64% 1.67%
Emerging 7.45% 6.32% 5.21% 4.98% 4.63% 3.97% 4.52% 4.91%
Commonwealth 4.65% 4.85% 3.45% 2.16% 0.97% ‐2.68% 0.45% 1.97%
Source: IMF Data and Statistics
Source: IMF Data and Statistics
GDP per capita and GDP per capita growth, developing & advanced economies
Regions Indexes 2010 2011 2012 2013 2014 2015 2016E 2017E
Advanced
GDP per capita 40,003.49 41,338.52 42,388.61 43,363.59 44,629.69 45,724.06 47,081.33 48,757.76
Growth 3.34% 2.54% 2.30% 2.92% 2.45% 2.97% 3.56%
Emerging GDP per capita 8,230.32 8,798.24 9,266.65 9,758.95 10,225.31 10,583.11 11,043.92 11,634.52
Growth 6.90% 5.32% 5.31% 4.78% 3.50% 4.35% 5.35%
Source: IMF Data and Statistics
‐4%
‐2%
0%
2%
4%
6%
8%
2010 2011 2012 2013 2014 2015 2016E 2017E 2018E 2019E 2020E
GDP growth and Expected Growth
World Advanced Euro Area Emerging Commonwealth
20.
Source: IMF Data and Statistics
Source: IMF Data and Statistics
Other Economics Descriptor
Subject 2010 2011 2012 2013 2014 2015 2016E 2017E
Inflation (%) 3.79 5.15 4.18 3.86 3.45 3.31 3.42 3.56
CPI* 152.09 191.89 185.65 182.88 171.47 112.33 107.83 113.09
Core CPI** 161.25 190.04 170.99 168.99 162.28 134.89 127.97 128.36
Libor 3 month 0.30 0.56 0.31 0.24 0.25 0.54
* Commodity Price Index includes both Fuel and Non‐Fuel Price Indices
** Commodity Non‐Fuel Price Index includes Food and Beverages and Industrial Inputs Price Indices
Source: IMF Data and Statistics
0
10,000
20,000
30,000
40,000
50,000
60,000
2010 2011 2012 2013 2014 2015 2016E 2017E 2018E 2019E 2020E
GDP per capita ‐ Advanced and Emerging Market
Advanced Emerging
0%
1%
2%
3%
4%
5%
6%
7%
8%
2011 2012 2013 2014 2015 2016E 2017E 2018E 2019E 2020E
GDP per capita growth
Advanced Emerging
21.
Source: IMF Data and Statistics
Source: IMF Data and Statistics
Source: IMF Data and Statistics
Because of the financial crisis, the interest has been at a very low rate for several years. It is expected
to recover to the normal level soon. On the other hand, the growth rate of world GDP is expected to
increase. The relative low interest rate and the improvement of economic conditions are favourable
conditions for equities. What’s more, the CPI (both including fuel and excluding fuel) is decreasing,
and the inflation is forecasted be steady at 3.5%, which are good signs for equity market.
0
1
2
3
4
5
6
2010 2011 2012 2013 2014 2015 2016E 2017E 2018E 2019E 2020E
Inflation (%) ‐ Historical and Expectation
0
50
100
150
200
250
2010 2011 2012 2013 2014 2015 2016E 2017E 2018E 2019E 2020E
CPI and Core CPI
CPI* Core CPI**
0.00
0.10
0.20
0.30
0.40
0.50
0.60
2010 2011 2012 2013 2014 2015
Libor 3 month
22. APPENDIX E: Competitive Positioning – Porter’s five analysis
1. Bargaining power of Consumers
As the customers are small and fragmented, they have little influence on the prices of products. Since the
brand loyalty is high – it takes much time and money for customers to change their consumption habits if they
are used to consume certain brand products, customers are prices takers. Besides, companies mainly sells
their products on supermarkets, which therefore gives little bargain power to consumers. Moving forward, it
is possible that companies e.g. RB will develop the e-commerce for the extending business markets which
could enhance the customers’ bargain power. In addition, when there are excess supply even for innovative
products, consumers have larger bargain.
2. Intensity of competitive rivalry – Moderate
There exists great potential for companies in the industry to develop their markets. Taking the largest business
of RB- hygiene (41%) as an example, one of the main products are dishwashing products, e.g. Finish Quantum.
As the penetration of dishwasher in the emerging markets (e.g. China and India) is less than 1% (source:
energy technology network), these markets exist great potential and there is small probability of price war.
Therefore, the competition is moderate on the hygiene business. Moving forward, since the penetration of
private label has been increasing recently, the competitiveness will be more intense in the consumer goods
industry.
3. Bargaining power of suppliers– Moderate
The suppliers are of significance on the continuous business, especially for the Powerbrand products. As the
majority of companies in this industry have more than 10 suppliers, the bargain power of suppliers is relatively
low. Moving forward, with the growing importance of Powerbrand products or private label products, the
bargain power of relevant suppliers will be enhanced.
LEGEND
0 No threat to RB
1 Insignificant threat to RB
2 Low threat to RB
3 Moderate threat to RB
4 Significant threat to RB
5 High Threat to RB
0
1
2
3
4
5
Bargaining power of
customers
Intensity of
competitive rivalry
Bargaining power of
suppliers
Threat of substitutes
Barriers to entry
Source: Team Estimate
23.
4. Threat of substitutes – High
There are various substitutes for hygiene, health and home relevant products, e.g. Fairy washer tablets (P&G)
has the same function with PowerBall Tabs (RB), although RB is prone to focus on differentiating their
products from competitors’. In addition, there appear innovative products which threat the revenue of products.
Taking the Woolite (the Laundry detergent of RB) as an example, as the development of technology on
waterless washing machine (Xeros) that can decrease the usage of detergent, there will be less sales of laundry
detergent. On the other hand, the innovative products have no substitutes in the preliminary stage. Moving
forward, there will appear similar function products leading to threat on existing innovative products.
5. Barriers to entry - High
This industry needs high investment in research and development continuously, and high technology. In
addition, the existing players have economies of scale and are easier to raise capital needed. Therefore, the
new entrants have little advantage in competing with larger players.
As a whole, the competition in the consumer products industry is relatively high among the existing rivalries.
However, it is hard for new entrants to compete against the existing players. Companies e.g. RB can maintain
their competitiveness by consolidating the innovative capacity and build up private labels.
66
2
92
285
11
79
26
13
0
50
100
150
200
250
300
RB CHD US P&G Unilever Kao Henkel Colgate Clorox
Number of suppliers
Source: Bloomberg
24. APPENDIX F: SWOT Analysis
This SWOT Analysis helps to establish a better understanding of RB’s relative market position. It is
built around a series of categories within in each section, which are ranked according to their likelihood,
threat level, or strength, etc. The external factors includes Opportunities and Threats, which are factors
that tends to affect the future. The internal factors are Strength and Weakness, which is largely factors
that affects the present. The results are presented in the form of this matrix.
Strength Weakness
1. Prestigious. Won many product of year award 1. Fierce competition in consumer healthcare sector
2. Pricing power and stable infrastructure system 2. Expansion is slow and exhaust company resources
3. Promotion through advertising 3. Deteriorating Home segment
4. Experienced management
5. Worldwide operations (180 countries)
Opportunity Threats
1. Fast growth through M&A 1. Purchasing power decrease
2. Differentiated products 2. Currency exchange risk
3. Low cost substitute products
4. Slower penetration in emerging markets
vvv
5
3
2
4 0
1
2
3
4
5
Strength
Weakness
Opportunity
Threats
SWOT
Source: Team Estimate
25. APPENDIX G: Exchange rate risk
As mentioned in the table 1 in Business Description section, there are 27% and 15% of core net revenue
in emerging market RUMEA and LAPAC respectively. Since RB would continue to develop the
emerging market, RB is expected to bear a higher foreign exchange rate risk than current situation. The
volatility of exchange rate in the emerging market may affect the consolidated revenue of RB. In order
to realize the effects of exchange rate risk, the forecast of exchange rate of Russian Ruble, Turkish Lira,
South African Rand, South Korean Won, Malaysian Ringgit, Chinese Renminbi, New Zealand Dollar,
Colombian Peso against British Pound (ie. 1. RUB/USD 2. TRY/USD 3. ZAR/USD 4. KRW/USD 5.
MYR/USD 6. CNY/USD 7. NZD/USD 8. COP/USD 9. USD/GBP) is obtained from Bloomberg as
shown in table below. Noted that only the forecast of foreign currency against United States Dollar is
available in Bloomberg.
Year RUB/USD TRY/USD ZAR/USD KRW/USD MYR/USD CNY/USD NZD/USD COP/USD USD/GBP
2015 79.05 3.03 16.75 1210 4.4 6.56 1.55 3301 1.43
2016E 86.59 3.1 16 1210 4.4 6.7 1.59 3201 1.45
2017E 94.17 3.05 15 1188 4.32 6.6 1.52 3008 1.44
2018E 104.84 2.98 13.84 1100 3.7 6.54 1.43 2500 1.5
Source: Bloomberg
Therefore, by using the United States Dollar against British Pound as reference, the Russian Ruble,
Turkish Lira, South African Rand, South Korean Won, Malaysian Ringgit, Chinese Renminbi, New
Zealand Dollar, Colombian Peso against British Pound (ie. 1. RUB/GBP 2. TRY/GBP 3. ZAR/GBP 4.
KRW/GBP 5. MYR/GBP 6. CNY/GBP 7. NZD/GBP 8. COP/GBP 9. USD/GBP) is calculated.
Year RUB/GBP TRY/GBP ZAR/GBP KRW/GBP MYR/GBP CNY/GBP NZD/GBP COP/GBP USD/GBP
2015 113.0415 4.3329 23.9525 1730.3 6.292 9.3808 2.2165 4720.43 1.43
2016E 123.8237 4.433 22.88 1730.3 6.292 9.581 2.2737 4577.43 1.45
2017E 134.6631 4.3615 21.45 1698.84 6.1776 9.438 2.1736 4301.44 1.44
2018E 149.9212 4.2614 19.7912 1573 5.291 9.3522 2.0449 3575 1.5
Source: Bloomberg and Team Estimate
Based on the above table, the following graph of percentage change in Emerging Market Currencies
against GBP from 2015 to 2018 is constructed to reflect the forecasted exchange rate risk in the coming
years. From the graph, the positive sign represents the foreign currency is depreciated against British
Pounds. As RB is operating their business in the emerging markets, the depreciation of domestic
currency in the emerging market represents that the floating exchange rate would have a negative impact
on the consolidated revenues and reported profit of RB. As we can see from the graph, RB has a higher
foreign exchange risk in the projected year 2016 as 7 currencies out of 9 currencies in the sample are
projected to be depreciated against British Pound. Regarding the exposure of the markets, Russia is
expected to have the highest exchange rate risk as the average of projected Russian against British
Pound from 2015 to 2018 is 9.87%.
27. APPENDIX H: Research and Development
“The availability of effective self-medication is a critical part of the growing socio-economic need to
help people manage their health. Our intention is to drive positive change consumer health. It not only
shows the importance we place on innovation, but also underlines our faith in the UK as a place to
invest in technical expertise and in consumer health R&D.” Source: Company website
Historically, RB report an R&D intensity of merely 1 per cent, nonetheless RB enjoys a reputation for
innovation and for relatively high margins of its global products. “There is no significant relationship
between the percentage of net revenue spent on R&D and the innovative capabilities of an organisation
- none," Bart Becht, former CEO of Reckitt Benckiser said. Reckitt Benckiser is strong at focusing
resources on marketing its brands to consumers. Combined with decent product innovation, this leads
to brand loyalty growth and net profit margin growth. R&D productivity, not R&D investment is the
greatest challenge for global product innovation. Productivity is in fact not measured in patents granted,
but in terms of new customers won and existing customers retained. Growing global consumer health
business is at the heart of RB’s vision to provide innovative solutions for healthier lives and happier
homes.
Research and development generally involves significant cost and demands time. R&D required to
develop health products takes a significant period of time, from planning to product launch, given the
limited duration of patents, the longer it take to develop and launch a product, the less time they can
recoup development costs and attain profit. Potential risks include failure to successfully complete
clinical trials and obtain applicable regulatory approvals in a timely manner, or at all, and may fail to
gain market approval for products. If any of the products that are being developed, fail to achieve
commercial success at expected levels. RB will incur substantial losses. Furthermore, if they fail to
develop or upgrade equipment, technology and manufacturing processes at least in line with
competition, the company may be unable to compete effectively and lose market share. Source: 2014
Financial Report
RB’s excellence in fast moving consumer products means they start from complete assessment of
consumers and relates those intuitions to science in order to improve products that works in the market.
Their R&D is driven by innovation that constructs and expands consumer base and meets needs.
Swiftness is precarious for innovation. RB focus on improvements that come to life in months, not years.
Therefore, the company is structured in the way that there is minimal bureaucracy and gives
shareholders ownership of their part of the business. Source: 2014 Financial Report
RB’s R&D process
Source: Company Data
28. RB’s R&D focus on driving consumer health product innovation at two levels:
•Core – New and existing product development which continually refresh current portfolio of brands
•Adjacent- New product developments which expands reach of products.
RB is a brand with a drive, sustained by applicable medical facts and scientific based evidence.
The company develops medicines, consumer health aids and supplements that both maintain and
improve health and general wellbeing. This includes systems to help diagnose and monitor health. RB
is a highly agile FMCG consumer-focused business with swiftness to market and develop products.
RB’s capabilities in research, regulatory and medical sciences are comparable to top competitors in
OTC medicinal industry.
Source: Company Data
29. APPENDIX I: Corporate governance
Levels of transparency, accountability, board oversight, and respect for the rights of shareholders and
role of key stakeholders is part of the foundation of a well-functioning corporate governance system.
Measuring overall condition of corporate governance for RB we incorporated Principles of Corporate
Governance invented by OECD. The following diagram illustrates our estimates.
Source: Team estimates
Board structure
RB adopts a board structure similar to that of its key international competitor companies, most of
whom are US-based. The current Board comprises fifteen directors, thirteen of whom are non-
executive. The current Chairman of the Board Adrian Bellamy, has served more than nine years on
the Board. Kenneth Hydon and Judith Sprieser have both served for nine years each and are currently
the Chairs of the Audit and Remuneration Committee. The Board retains strong relevant knowledge
and experience to provide continuity and consistency in the development and application of strategic
objectives
Conflicts of interest
RB has procedures in place to deal with conflicts of interest. The Nomination Committee under its terms
of reference is responsible for the Company’s procedures for dealing with Directors’ conflicts of interest
and these procedures have operated effectively during the year. A register of Directors’ conflicts is
maintained by the Company Secretary and reviewed by the Board at least annually. The Board is aware
of the other commitments of its Directors and any changes to these commitments are reported to the
Board.
Key management remuneration
The 2014 performance compared to the performance ranges, as set out above, generates a multiplier for
each performance measure such that when combined the outcome for the 2014 bonus is 2.58 x target.
The threshold target for awards was growth of 6% p.a., with awards vesting in full for growth of 9%
p.a. Despite exceptional 2014 net income growth of 14% p.a. at constant exchange rates, adverse FX
on translation reduced this performance by 10% in 2014. Earnings per share growth over the period
2011–2014 measured on actual currency basis was 6.1% p.a. This resulted in threshold performance
being achieved and the LTIP award made in December 2011, following Rakesh Kapoor’s appointment
as CEO may vest to the following extent on 7 May 2015 for performance over the completed three-year
period.
17%
16%
18%
18%
16%
15% Applying foundation for an effective
corporate governance framework
Shareholder’s rights
Equitable treatment of shareholders
Role of stakeholders
Disclosure and transparency
Responsibilities of the Board
30. Position Salary x Target Bonus x2 Performance Multiplier = 2014 Bonus
CEO £865,000 x 120% x 2.58 = £2,678,040
CFO £561,000 x 90% x 2.58 = £1,302,642
Source: Company Website
31. APPENDIX J: Corporate social responsibility
RB is governed by a complete corporate responsibility framework, which comprises of vision and
values, code of conduct, core group policies, control arrangements and reporting. The Board has overall
responsibility for sustainability and corporate responsibility and undertakes a formal review of
environmental, social and governance matters annually. The CEO has specific responsibility for
sustainability policies and performance. The sustainability programme on a day-to-day basis considers
RB’s significant economic, environmental or social impacts. RB has also been awarded numerous
prestigious awards recognizing its achievement as a social and environmentally conscious organization.
By 2020 RB’s reach will exceed 200 million, improving people’s health and hygiene. They are
making good progress on project “Save a Child Every Minute” through partnership with Save
the Children to stop diarrhoeal deaths in children under five.
RB will reduce the environmental footprint of its products by embedding innovate sustainability,
and by 2020 one-third of net revenue will come from more sustainable products. By end 2014,
50% of our pipeline was from more sustainable innovations.
RB plans to reduce carbon footprint and water impact. Since 2012, they have decrease
manufacturing water use by 25% and energy use by 13% per unit of production. In 2014, all
manufacturing sites in ENA and LATAM sent zero waste to landfill and reduce waste per unit
of production by 7% since 2012.
Dow Jones Sustainability Index (DJSI)
The DJSI is one of the most important sustainability rankings in the world, it is based on corporate economic,
environmental and social performance with a strong focus on long-term shareholder value.
Corporate Knights Global 100 Most Sustainable Corporations in the World (Global 100) Index
RB is ranked 7th in the Corporate Knights Global 100 Most Sustainable Corporations in the World Index. RB is
also ranked highest amongst the 11 UK companies selected this year. This is RB’s first time on the Global 100,
one of the world's leading sustainability indices for global equity investors. RB performed particularly well against
its peers in the household products industry on energy, carbon, water and waste productivity.
FTSE4Good Index
RB's corporate social responsibility performance has led to a continued inclusion in the FTSE4Good Index
Series. The index recognises companies who work to improve environmental and social practices, including
human and labour rights, climate change and environmental management.
Green Business Awards
The Green Business Awards award excellence in green practice, strategy and products. RB has been shortlisted
in recognition of our Carbon20 initiative to reduce our products' Total Carbon Footprint by 20%.
The original goal was to achieve this reduction by 2020, but RB has reached its target eight years prior.
32. APPENDIX K: Executive personnel
Name Position Experience
Rakesh Kapoor
CEO
In 1999, he was appointed Global Category
Director, Pest Control. Following the merger, he
assumed the role of, Senior Vice President,
Home Care.
He was appointed SVP, Regional Director,
Northern Europe in 2001 and in July 2006,
He was promoted to EVP, Category
Development. Rakesh became CEO in
September 2011.
Amedeo Fasano
Vice President, Supply
Amedeo joined in 1997 as Supply Director
Italy. After the Reckitt & Colman and
Benckiser merger, he was appointed
Manufacturing Director for Central, South
Western and Southern Europe Regions.
In 2007 he took over the role of SVP Supply
Developing Markets and in March 2009
Amedeo was appointed as EVP Supply.
Roberto Funari
Vice President, Category
Marketing
Roberto re-joined RB in February 2013
following two years at Imperial Tobacco where
he was Group Marketing Director and
Executive Committee member.
His last role was as global category officer for
fabric and home care.
Rob de Groot
Area Executive Vice
President, ENA
Rob joined RB in 1988. After international roles
in marketing and sales he became General
Manager, Regional Director Eastern Europe and
was appointed Global Category Officer before
being appointed EVP North America &
Australia.
As part of RB's new strategy for continued
outperformance, in January 2012 Rob became
EVP of the newly created ENA area.
Adrian Hennah
Chief Financial Officer
Adrian joined the Company in January 2013 as
Chief Financial Officer Designate, and was
appointed as CFO in February 2013.
Frederic Larmuseau
Area Executive Vice
President, Developing
Markets
Frederic Larmuseau joined the company in
2001 as Marketing Director for Malaysia-
Singapore. In 2003, he was promoted to
Regional Marketing Director for East Asia.
Darrell Stein
Senior Vice President,
Information Services
Darrell joined RB in August 2014 from Marks
& Spencer plc, the UK-ssssssssheadquartered
international clothes and food retailer.
Importantly, Darrell also has experience of
successfully delivering global ERP and supply
chain systems, including SAP.
Deborah Yates
Senior Vice President, HR
Deb joined RB in 2004 in the Australian
business. She has worked in Australia, the USA,
the UK and the Netherlands since joining RB.
Source: Company data