1. $60
$65
$70
$75
$80
$85
$90
$95
4-Feb 4-May 4-Aug 4-Nov 4-Feb
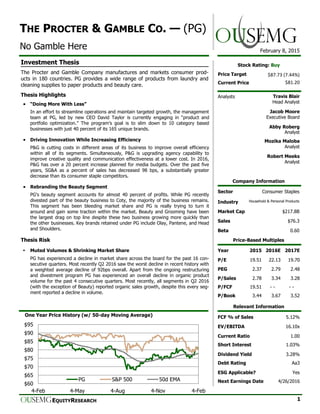
One Year Price History (w/ 50-day Moving Average)
PG S&P 500 50d EMA
Year 2015 2016E 2017E
P/E 19.51 22.13 19.70
PEG 2.37 2.79 2.48
P/Sales 2.78 3.34 3.28
P/FCF 19.51 - - - -
P/Book 3.44 3.67 3.52
February 8, 2015
THE PROCTER & GAMBLE CO. — (PG)
No Gamble Here
OUSEMGEQUITYRESEARCH 1
Stock Rating: Buy
Price Target
Current Price
$87.73 (7.44%)
$81.20
Analysts Travis Blair
Head Analyst
Jacob Moore
Executive Board
Abby Roberg
Analyst
Mozika Maloba
Analyst
Robert Meeks
Analyst
Company Information
Sector Consumer Staples
Industry Household & Personal Products
Market Cap $217.8B
Sales $76.3
Beta 0.60
Price-Based Multiples
Investment Thesis
The Procter and Gamble Company manufactures and markets consumer prod-
ucts in 180 countries. PG provides a wide range of products from laundry and
cleaning supplies to paper products and beauty care.
Thesis Highlights
“Doing More With Less”
In an effort to streamline operations and maintain targeted growth, the management
team at PG, led by new CEO David Taylor is currently engaging in “product and
portfolio optimization.” The program’s goal is to slim down to 10 category based
businesses with just 40 percent of its 165 unique brands.
Driving Innovation While Increasing Efficiency
P&G is cutting costs in different areas of its business to improve overall efficiency
within all of its segments. Simultaneously, P&G is upgrading agency capability to
improve creative quality and communication effectiveness at a lower cost. In 2016,
P&G has over a 20 percent increase planned for media budgets. Over the past five
years, SG&A as a percent of sales has decreased 98 bps, a substantially greater
decrease than its consumer staple competitors.
Rebranding the Beauty Segment
PG's beauty segment accounts for almost 40 percent of profits. While PG recently
divested part of the beauty business to Coty, the majority of the business remains.
This segment has been bleeding market share and PG is really trying to turn it
around and gain some traction within the market. Beauty and Grooming have been
the largest drag on top line despite these two business growing more quickly than
the other businesses. Key brands retained under PG include Olay, Pantene, and Head
and Shoulders.
Thesis Risk
▪ Muted Volumes & Shrinking Market Share
PG has experienced a decline in market share across the board for the past 16 con-
secutive quarters. Most recently Q2 2016 saw the worst decline in recent history with
a weighted average decline of 92bps overall. Apart from the ongoing restructuring
and divestment program PG has experienced an overall decline in organic product
volume for the past 4 consecutive quarters. Most recently, all segments in Q2 2016
(with the exception of Beauty) reported organic sales growth, despite this every seg-
ment reported a decline in volume.
Relevant Information
FCF % of Sales 5.12%
EV/EBITDA 16.10x
Current Ratio 1.00
Short Interest 1.03%
Dividend Yield 3.28%
Debt Rating Aa3
ESG Applicable? Yes
Next Earnings Date 4/26/2016
2. OUSEMGEQUITYRESEARCH 2
FEBRUARY 8, 2016 | THE PROCTER & GAMBLE COMPANY (PG)
“Doing More With Less”
Restructuring the Products, Manufacturing the Bottom Line
In an effort to streamline operations and maintain targeted growth, the management
team at PG, led by new CEO David Taylor is currently engaging in “product and
portfolio optimization.” The program’s goal is to slim down to 10 category based
businesses with just 40 percent of its 165 unique brands (Table 1). Focusing on these
businesses will help drive margin growth and increased profitability despite a healthy
knock to sales. The products that will be salvaged typically have margins 100 BPs
higher than the legacy portfolio and grow at about 100 BPs. Ideally, by 3Q16 the
largest and most profitable brands will account for 85 percent of sales and 95 percent
of pretax profit.
With specific attention paid to the Baby, Fabric, Hair, and Grooming businesses, PG
will aim to have 60 percent of enterprise value, sales, and profits come from brands in
these categories. The company is currently in the process of divesting both the
Duracell and Beauty brands. The overall target of this massive overhaul is to achieve
sustained growth that can be targeted by management. Specifically in the US and
China, PG will be able to better deploy strategic marketing and product innovation
schemes.
Before After
Finally, the streamlining of the company’s distribution and supply chain will help
create more predictable and agile networks that can respond to changes much more
quickly. Days inventory outstanding has decreased from 60.82 to 57.33 and the
company’s cash conversion cycle has dropped a dramatic 77 percent from 13.06 to
3.03 in 2015. Management will outline long term growth strategies at the CAGNY
conference on February 15-19th.
Before After
Thesis Point 1:
▪ Streamlining the Business
▪ Simplifying Distribution
3. OUSEMGEQUITYRESEARCH 3
FEBRUARY 8, 2016 | THE PROCTER & GAMBLE COMPANY (PG)
Thesis Point 2:
▪ Consolidation Driving
Margin Expansion
▪ Reinvesting Cost Savings
Driving Innovation While Increasing Efficiency
Cutting Agency Costs With Consolidation
P&G is cutting costs in different areas of its business to improve overall efficiency
within all of its segments. Many different fees and production costs for agencies used
in advertising, media public relations, package design and in-store material
development are in the process of being cut. This is being achieved through the
simplification and reduction of the number of agency relationships. Simultaneously,
P&G is upgrading agency capability to improve creative quality and communication
effectiveness at a lower cost. In Brazil, P&G consolidated agencies and delivered a 50
percent reduction in spending. In P&G’s United States Hair Care segment, it reduced
the number of consumer marketing agencies by a third and lowered total agency
spending by 20 percent and in another beauty category, it consolidated to a single
global agency for digital marketing, reducing spending for those services by 75
percent. By the end of FY 2015, P&G reduced the number of agencies by 40 percent
and cut agency spending by 15 percent YoY.
P&G expects to deliver solid operating margin expansion driven by another year of
strong productivity-driven savings in cost of goods sold, overhead, and non-working
marketing & agency costs. In 2016, P&G has over a 20 percent increase planned for
media budgets. Over the past five years, SG&A as a percent of sales has decreased
98 bps, a substantially greater decrease than its consumer staple competitors. P&G
plans on continuing to tighten down on cutting costs over the next fiscal year to
improve margins and reinvesting in R&D to ultimately increase product innovation.
Investment in Supply Chain and Product Innovation
On a constant currency basis, P&G’s core operating margin was up 130 basis points
and productivity savings contributed approximately 330 basis points to core operating
margin expansion for FY 2015. Also during FY 2015, core gross margin, including
foreign exchange, grew 30 basis points and on a constant currency basis, core gross
margin was up 80 basis points. P&G delivered this margin and progress while making
investments in the supply chain and productivity of the company.
P&G is investing in the upstream innovation pipeline and recent launches as well.
PODS, beads, Pampers Pants, Gillette FlexBall and Venus Swirl, launches will create
and build markets. New shampoo and conditioner product innovations built on unique
and proprietary technologies will reach the market this summer and continue to
expand around the world over the next two years on Pantene, Head & Shoulders, and
on the local and regional brands in the portfolio such as Herbal and Vidal. P&G also
narrowed its boutique and product line focus to Regenerist and Total Effects and new
products consumers like, such as Luminous, which has attracted new consumers and
has been growing sales and market share. In FY 2015, P&G also invested in a new
business through which it plans to expand its market entry into the adult incontinence
category. While investing in its newly developed products, P&G is also investing in the
supply chain, including the start-up of six new US mixing and distribution centers. Its
investments in product innovation and its supply chain have given them growth in
both revenue and market share and will allow revenue and market share growth to
continue on into 2016 and many years to follow.
0%
5%
10%
15%
20%
25%
30%
35%
40%
2011 2012 2013 2014 2015
SG&A as a Percent of Sales
KMB CLX CHD PG CL
4. OUSEMGEQUITYRESEARCH 4
FEBRUARY 8, 2016 | THE PROCTER & GAMBLE COMPANY (PG)
Thesis Point 3:
▪ Beauty Segment
Profitability
▪ Sentiment Towards
Premium Brands
Rebranding the Beauty Segment
Rebranding the Beauty Segment
PG's beauty segment accounts for almost 40 percent of profits. While PG recently
divested part of the beauty business to Coty, the majority of the business remains.
This segment has been bleeding market share and PG is really trying to turn it around
and gain some traction within the market. Beauty and Grooming have been the
largest drag on top line despite these two business growing more quickly than the
other businesses. Key brands retained under PG include Olay, Pantene, and Head and
Shoulders.
Many of the brands sold to Coty were a part of Prestige, P&G’s luxury channel.
Consumer sentiment toward luxury beauty products has been increasingly negative.
High end brands ranked in the bottom of a brand passion report on beauty and skin
care. The study examined net sentiment, overall direction of consumer feelings, and
how strongly those emotions are felt. We see getting rid of the high end brands as an
important first step in P&G’s rebranding. If PG can deliver strong performance from its
remaining beauty brands, we expect better top line results moving forward.
Olay: Olay is the top facial skincare brand in the world, with over 8 percent market
share. The brand is a strong conversation driver for two of the five most important
attributes identified by the study (anti-aging and moisture). Brand passion and net
sentiment surrounding the brand have been on the rise. If the brand can continue to
drive sales by focusing on the moisturization and anti-aging properties of its products,
we expect the brand to lead the turnaround story for PG’s beauty segment.
Pantene/ Head and Shoulders: These two brands make PG the global leader in the
retail hair care and color market with 20 percent market share. In early 2015,
Tresemme surpassed Pantene in retail shampoo sales. PG has reaffirmed its
commitment to innovation, specifically within the Pantene brand. Last year, the
company was the first to find a solution to water damage, a major hair care concern
for women in certain countries, including Pakistan, where the product was released.
Pantene Hair Research Institute experts are continuously researching solutions to hair
care concerns, and we expect new products to drive market share back up in 2016
and 2017.
5. OUSEMGEQUITYRESEARCH 5
FEBRUARY 8, 2016 | THE PROCTER & GAMBLE COMPANY (PG)
Thesis Risk 1:
▪ Declining Market Share
▪ Lower Volumes’
▪ Currency Headwinds
Loss of Market Share
Hemorrhaging Market Share
PG has experienced a decline in market share across the board for the past 16
consecutive quarters. Most recently Q2 2016 saw the worst decline in recent history
with a weighted average decline of 92bps overall. On a per segment basis PG saw
market share declines in Q2 of 140bps in Baby, Feminine & Family Care, Grooming
down 140bps, Beauty Care down 110 bps, Health care down 100 bps, and Fabric and
Home Care down 20bps.
Decreased Product Volume
Apart from the ongoing restructuring and divestment program PG has experienced an
overall decline in organic product volume for the past 4 consecutive quarters. Most
recently, all segments in Q2 2016 (with the exception of Beauty) reported organic
sales growth, despite this every segment reported a decline in volume. The biggest
underperformers by volume were Beauty, Healthcare, and Baby Feminine and Family
Care which declined 3 percent.
PG blames both market share loss and decreasing volumes mainly on the premium
status of PG brands and the increasing popularity of generic brands as a result of
overall consumer spending trends in the industry. Recently retailers have also taken
steps to stock inventory more efficiently, which has weighed on volume.
Currency Headwinds
Geographically a total of 37 percent of PG’s net sales come from the US. Foreign
exchange has had a negative impact on net sales in recent history. In FY15 currency
headwinds attributed to a $4.8 billion impact to net sales. More recently in Q216
currency headwinds caused a negative 8 percent impact on topline. In the recent Q2
earnings report management adjusted its FY16 guidance on foreign exchange impact
from 3 percent to 10 percent of net sales.
Weighted Average Market Loss (bps)
6. OUSEMGEQUITYRESEARCH 6
FEBRUARY 8, 2016 | THE PROCTER & GAMBLE COMPANY (PG)
Appendix A: Low Volatility Around Earnings
Price change on earnings for the last eight reports were collected and averaged for each security. The graph above
compares each company the group holds and compares it to Procter and Gamble. P&G has the second lowest absolute
average change on earnings. P&G is accompanied by only three other companies relatively close to its average absolute
change (AWK, GILD, and MPC).
2.86%
4.08%
3.67%
3.21%
0.67%
4.19%
1.91%
4.75%
3.27%
5.79%
3.97%
8.64%
1.44%
7.63%
4.07%
4.27%
4.93%
2.93%
5.79%
1.53%
4.18%
0.00%
1.00%
2.00%
3.00%
4.00%
5.00%
6.00%
7.00%
8.00%
9.00%
10.00%
ACN AMGN AMP AWK BA BLK DIS DOV FFIV GILD HBI HCA HOG LAZ MPC PAY SBUX TEN WCN WYN
Standard Deviation of Price Change on Earnings
PG, -0.04%
ACN, 0.27%
AMGN, 1.09%
AMP, 0.77%
AWK, -0.05%
BA, -0.83%
BLK, -0.25%
DIS, 0.33%
DOV, 1.32%
FFIV, -0.79%
GILD, -0.03%
HBI, -1.97%
HCA, -0.67%
HOG, -0.36%
LAZ, 0.75%
MPC, 0.06%
PAY, 2.82%
SBUX, 1.16%
TEN, 1.90%
WCN, 2.73%
WYN, -2.82%-3.00%
-2.00%
-1.00%
0.00%
1.00%
2.00%
3.00%
ACN AMGN AMP AWK BA BLK DIS DOV FFIV GILD HBI HCA HOG LAZ MPC PAY SBUX TEN WCN WYN
Average Price Change For Last Eight Earnings
64%
177%
96%
88%
-6%
173%
45% 76% 65%
243%
102%
248%
47%
241%
66%
108%
149%
190%
169%
132%
-10%
20%
50%
80%
110%
140%
170%
200%
230%
260%
290%
320%
350%
ACN AMGN AMP AWK BA BLK DIS DOV FFIV GILD HBI HCA HOG LAZ MPC PAY SBUX TEN WCN WYN
Average Percent Above 100D Volume on Earnings
The above chart illustrates the standard deviation of price changes over the last eight earnings for each security in both
portfolios relative to Procter and Gamble. Similar to the average change, P&G is among a small group of companies with
such a low deviation. The average deviation of the portfolio is 4.05 percent versus P&G’s deviation of just 2.86 percent.
7. OUSEMGEQUITYRESEARCH 7
FEBRUARY 8, 2016 | THE PROCTER & GAMBLE COMPANY (PG)
Appendix A: Low Volatility Around Earnings
0.27%
1.09%
0.77%
-0.05%
-0.83%
-0.25%
0.33%
1.32%
-0.79%
-0.03%
-1.97%
-0.67%
-0.36%
0.75%
0.06%
2.82%
1.16%
1.90%
2.73%
-2.82%
PG, 2.86%
ACN, 4.08%
AMGN, 3.67%
AMP, 3.21%
AWK, 0.67%
BA, 4.19%
BLK, 1.91%
DIS, 4.75%
DOV, 3.27%
FFIV, 5.79%
GILD, 3.97%
HBI, 8.64%
HCA, 1.44%
HOG, 7.63%
LAZ, 4.07%
MPC, 4.27%
PAY, 4.93%
SBUX, 2.93%
TEN, 5.79%
WCN, 1.53%
WYN, 4.18%
0.00%
1.00%
2.00%
3.00%
4.00%
5.00%
6.00%
7.00%
8.00%
9.00%
10.00%
-3.00%
-2.00%
-1.00%
0.00%
1.00%
2.00%
3.00%
ACN AMGN AMP AWK BA BLK DIS DOV FFIV GILD HBI HCA HOG LAZ MPC PAY SBUX TEN WCN WYN
Average Price Change & Price Change Deviation For Last Eight Earnings
PG Avg Price Change Avg. Price Change PG Price Change Deviation Price Change Deviation
The above chart is a combined view of each company’s average price change and deviation on the last eight earnings
versus Procter and Gamble.