- The document provides an overview of Clorox's Q1 FY17 investor deck, including highlights from various business segments.
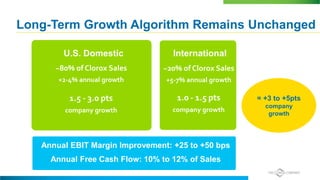
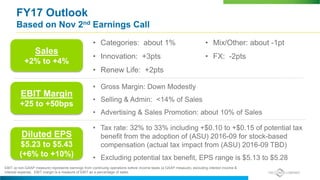
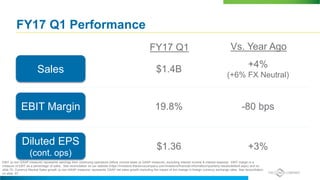
- Key metrics discussed are sales growth of 2-4% expected for FY17, EBIT margin growth of 25-50 bps, and diluted EPS growth of 6-10% excluding potential tax benefits.
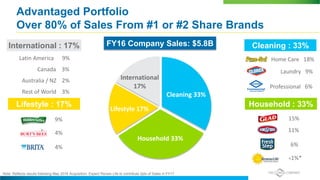
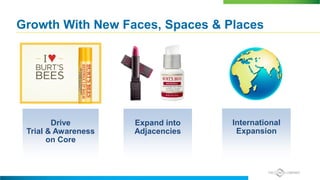
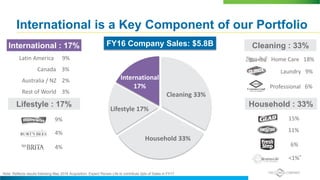
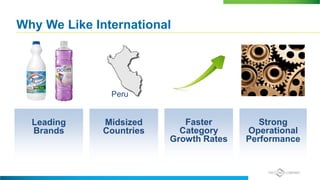
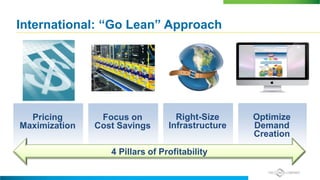
- International represents 17% of sales and is a key component of the portfolio, with strategies to optimize profitability across international markets.