The document describes the Karnaugh map method for minimizing Boolean functions with various numbers of variables. It includes:
- Introduction to K-maps and their use for simplifying logic functions
- Construction of 2, 3, and 4 variable K-maps and the relationship between variable assignments and map cells
- Examples of simplifying 2-variable and 3-variable logic functions using K-maps
- Rules for grouping cells in K-maps to minimize logic functions
Overview of K-map method for minimizing Boolean functions, its pictorial representation, and historical context.
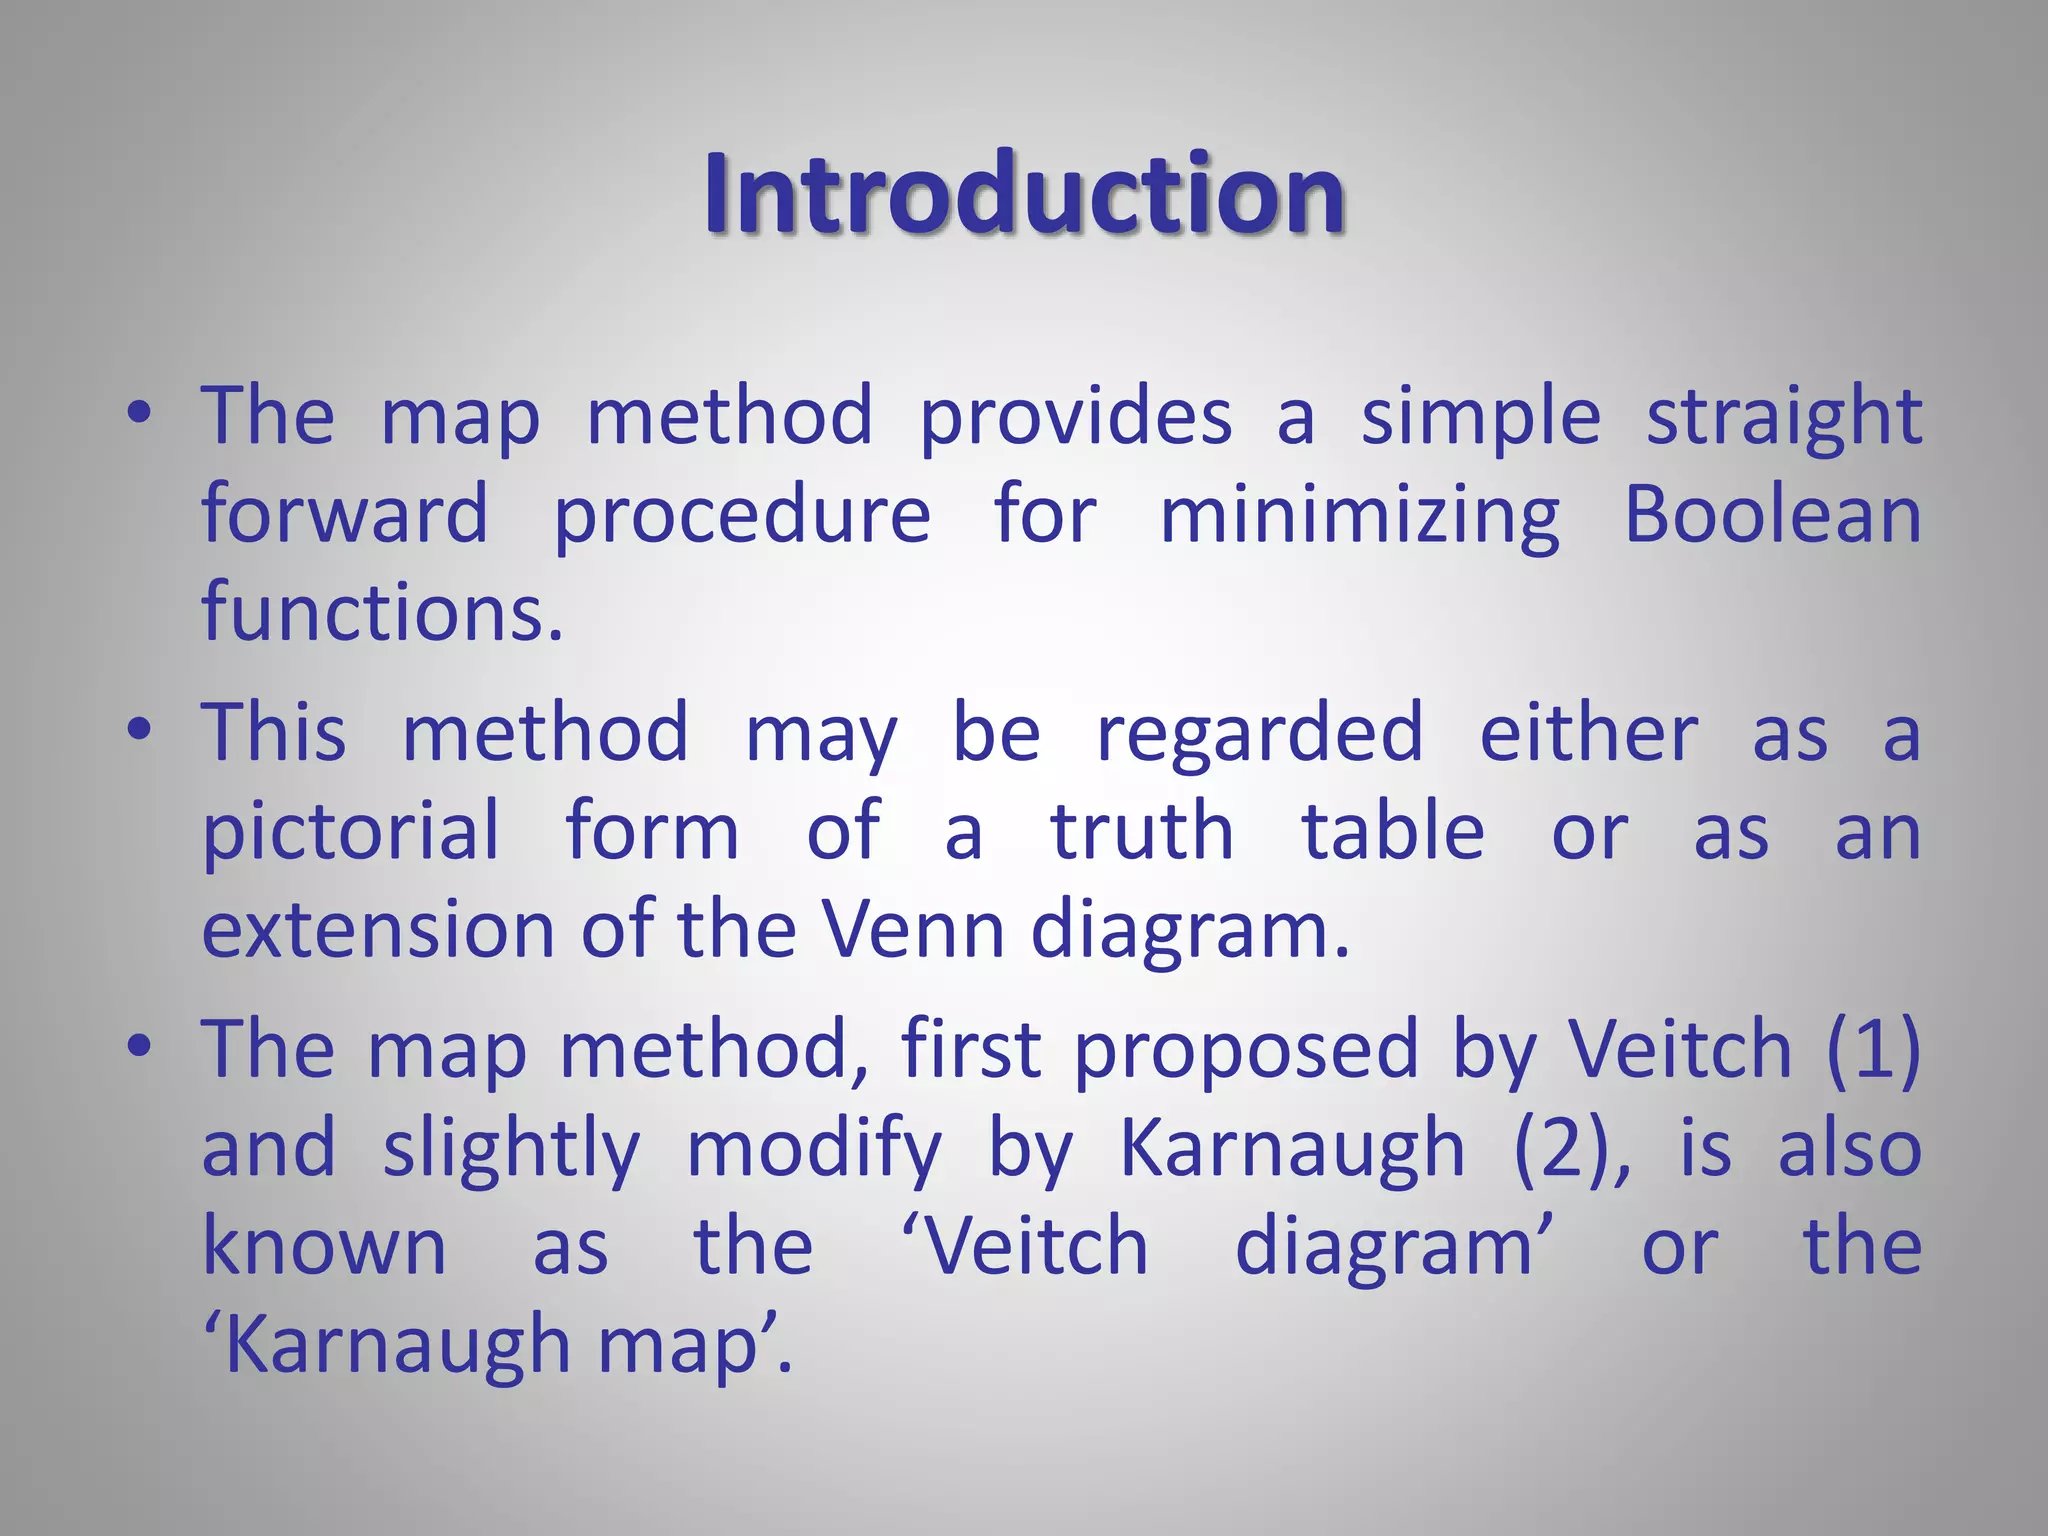
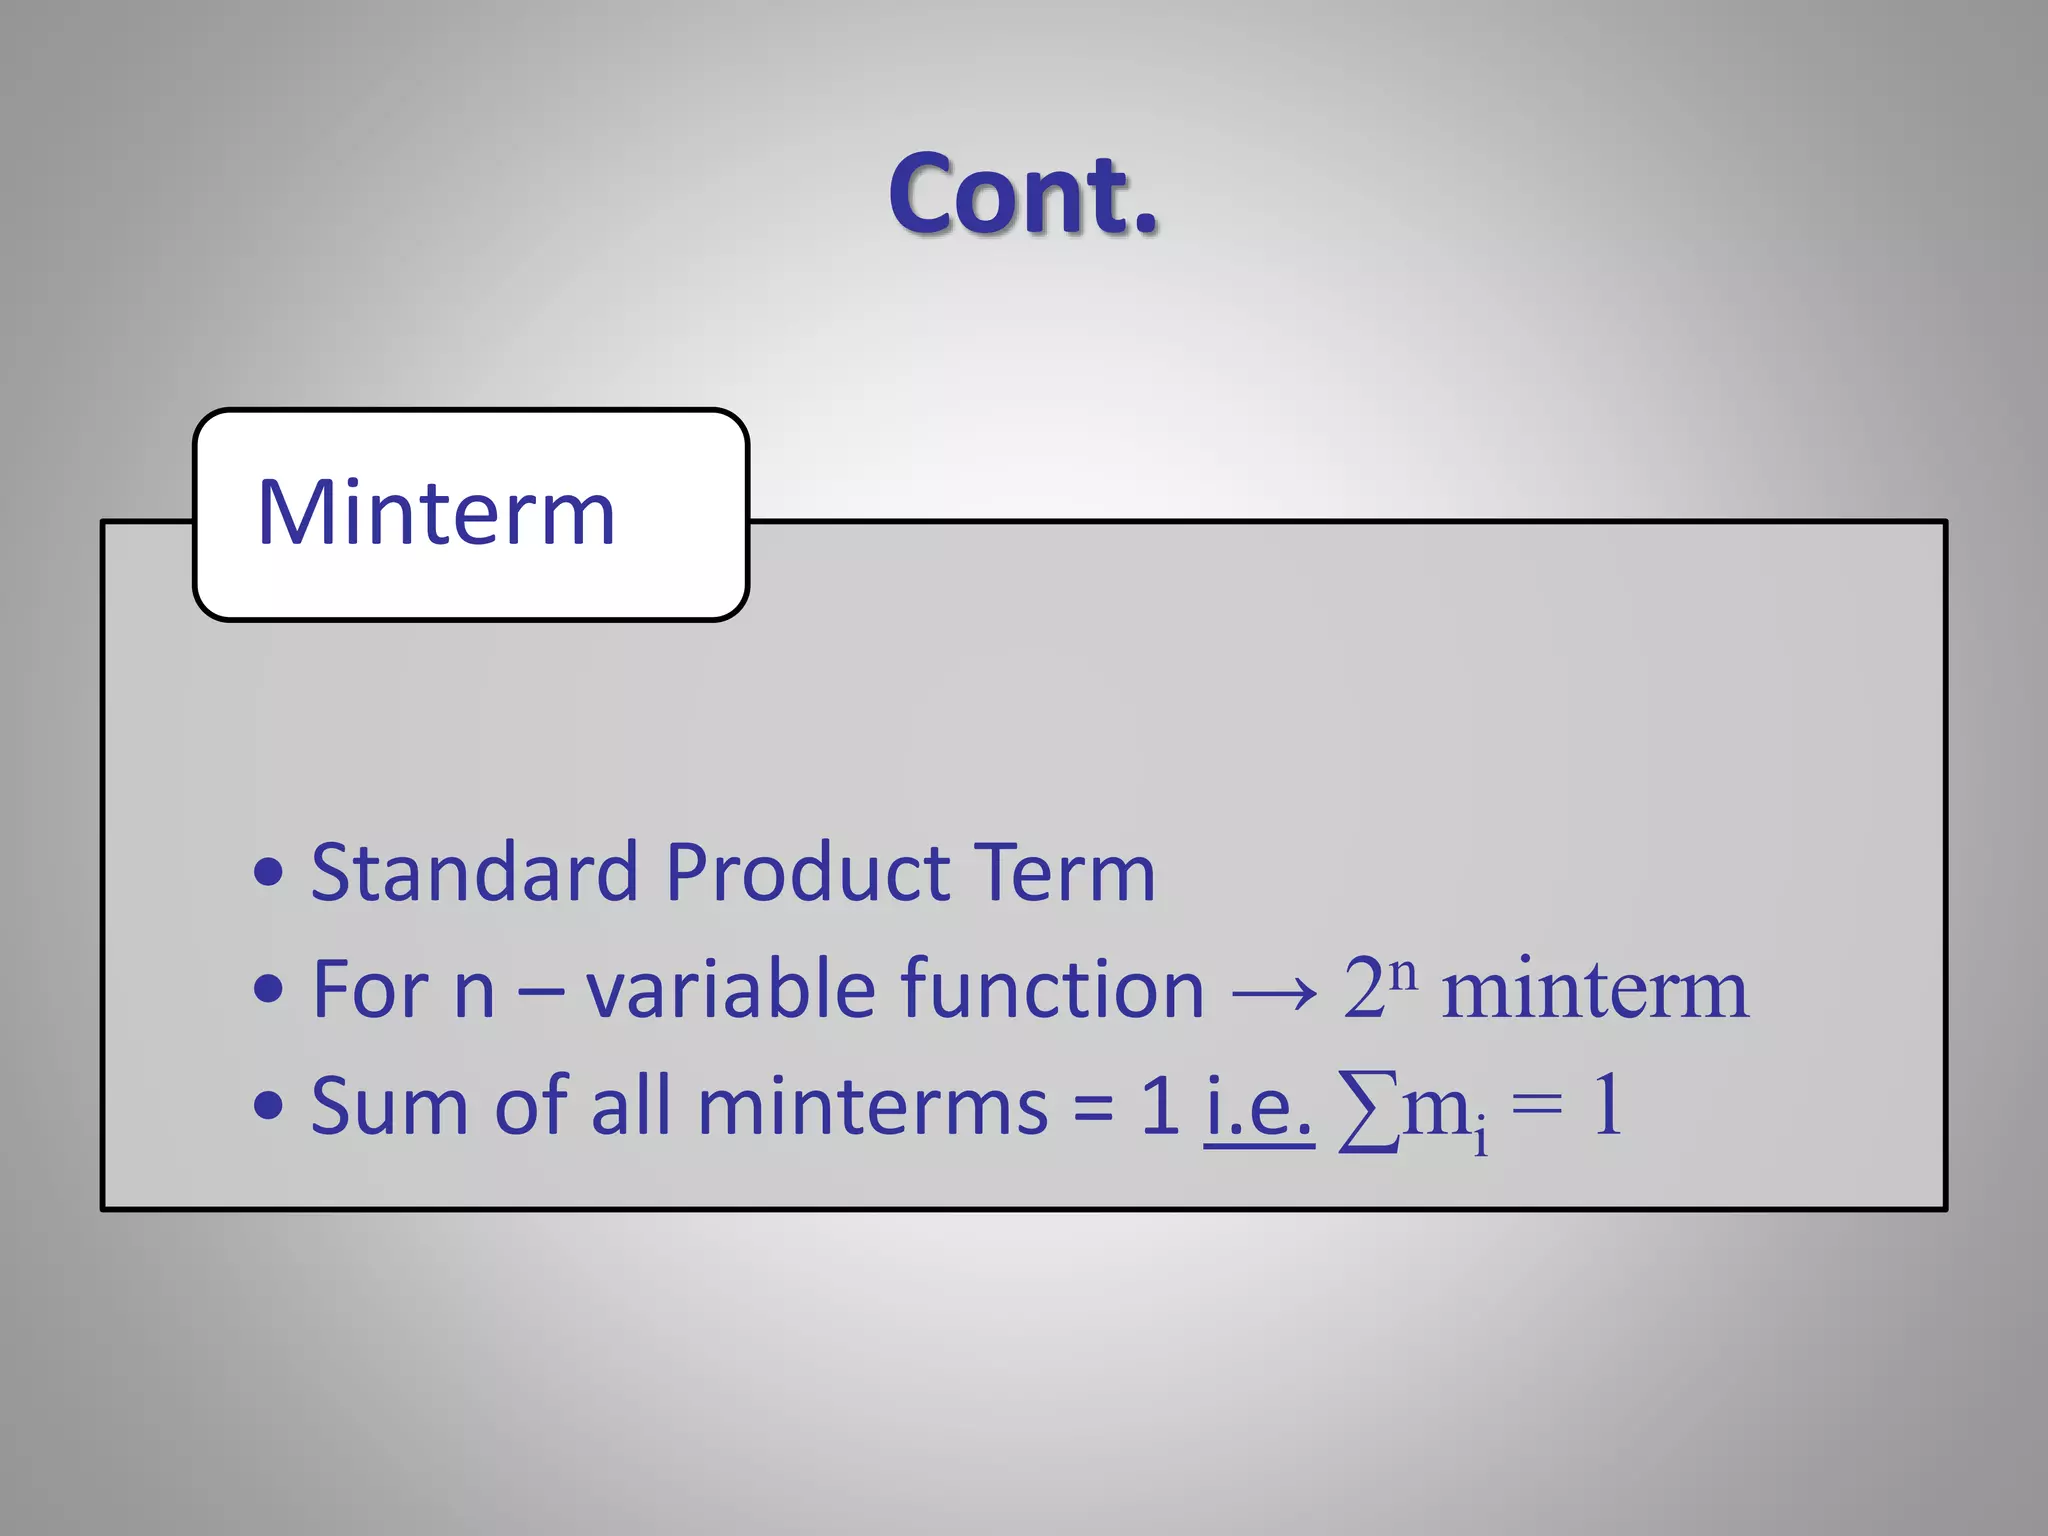
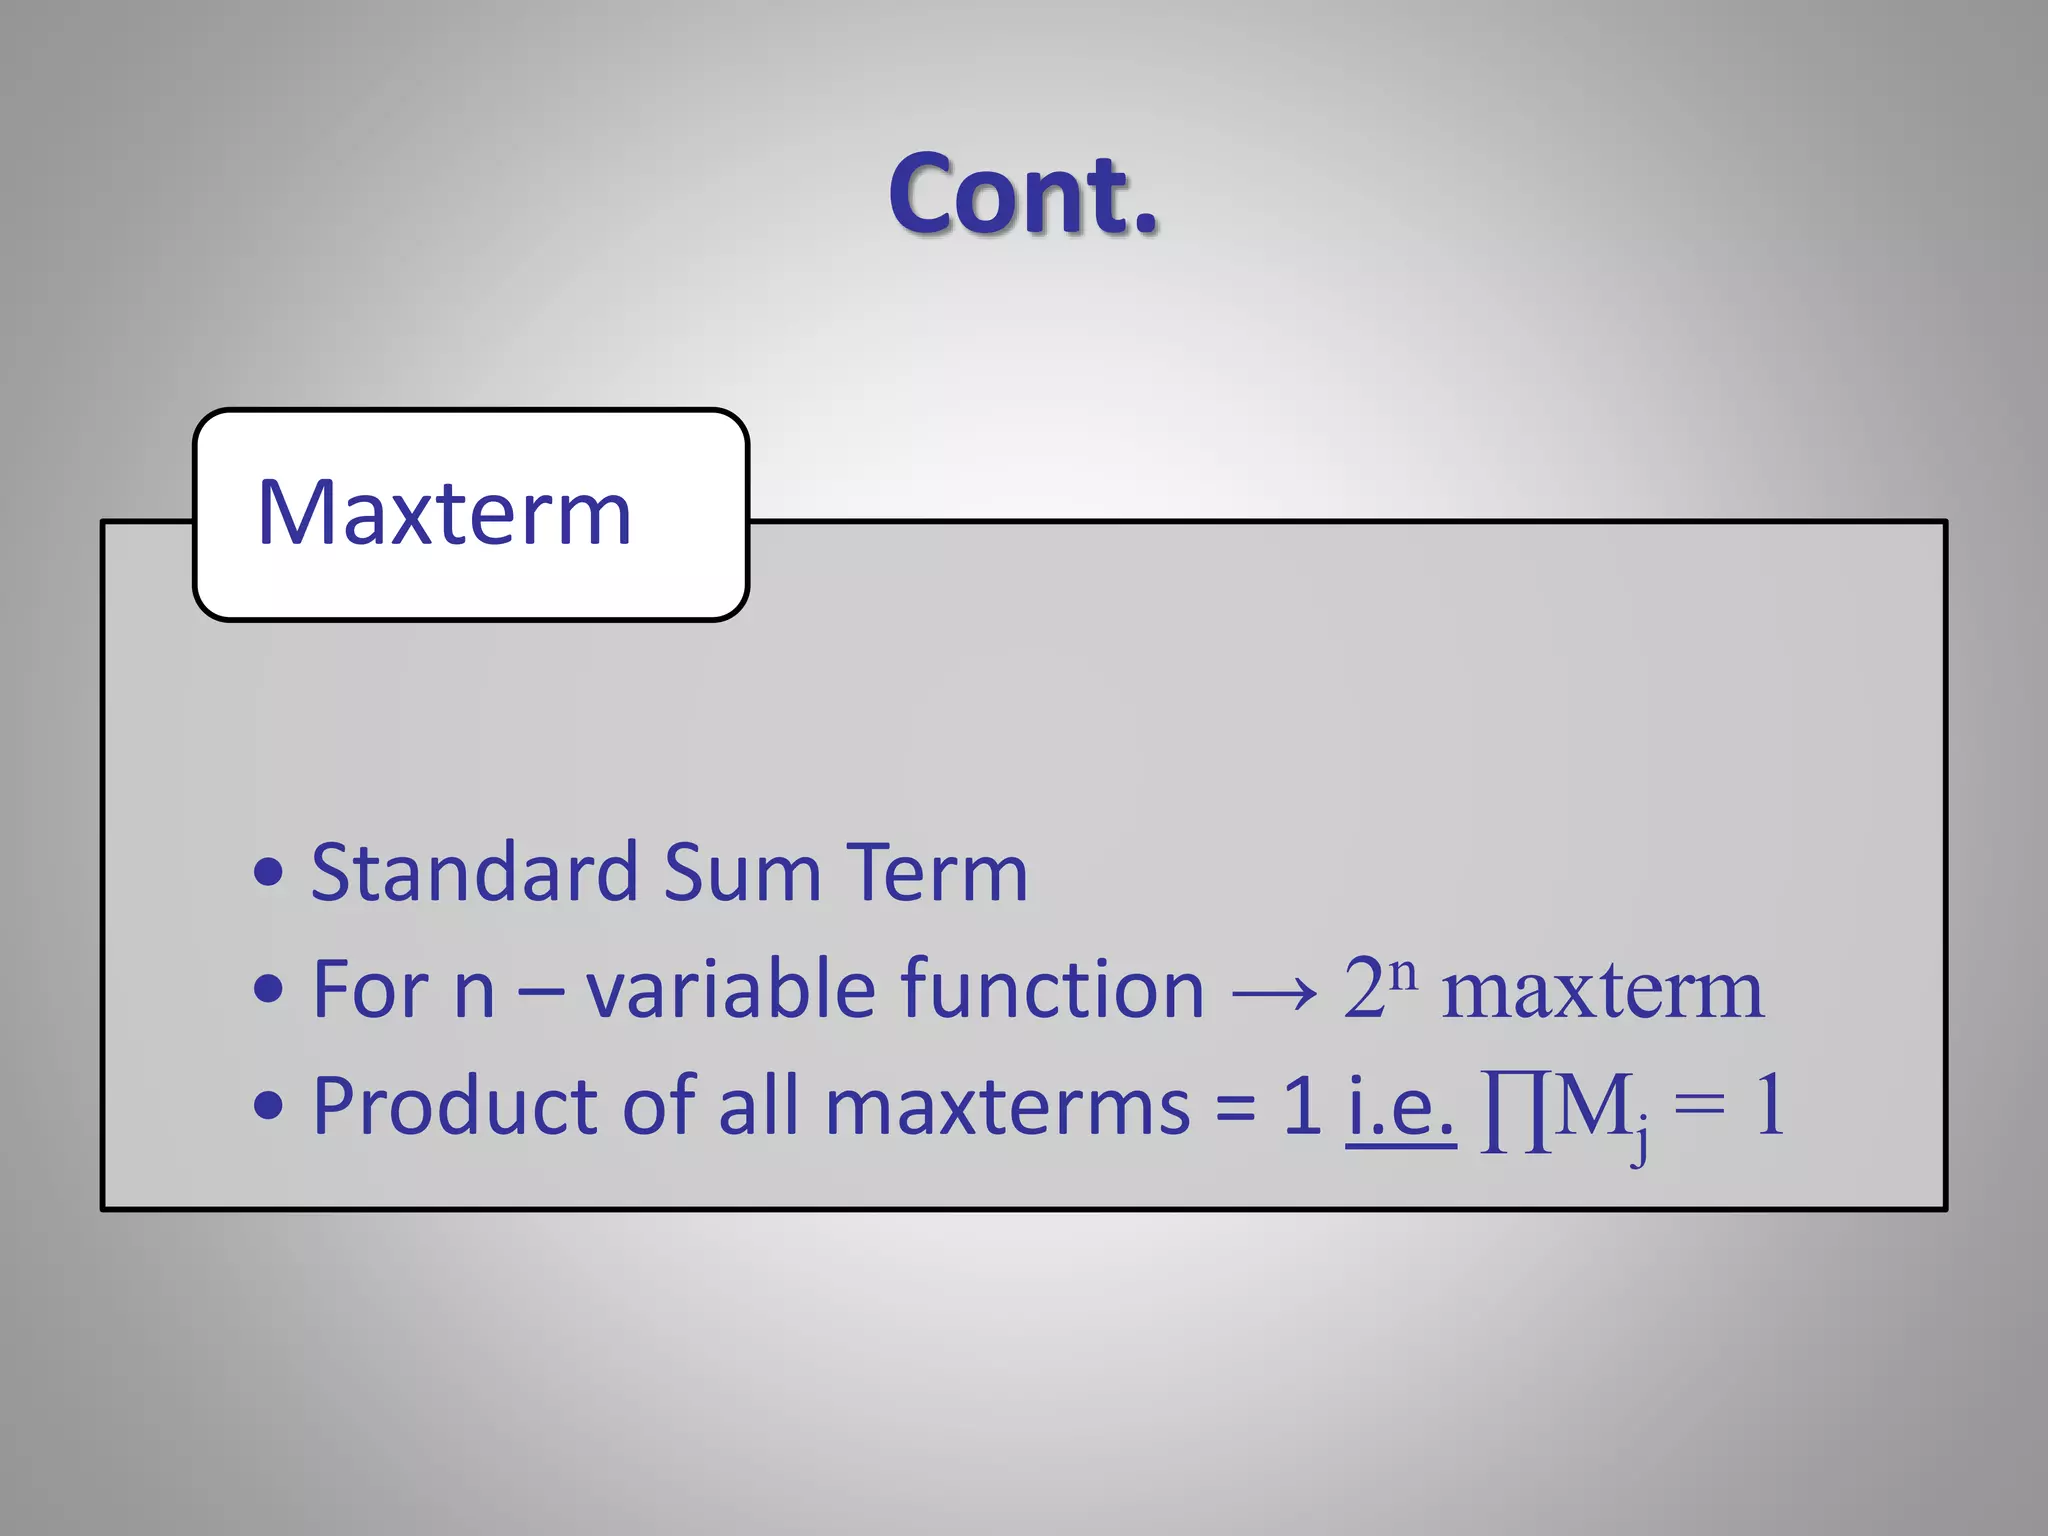
Introduction to minterms and maxterms in Boolean functions, detailing their definitions and calculations.
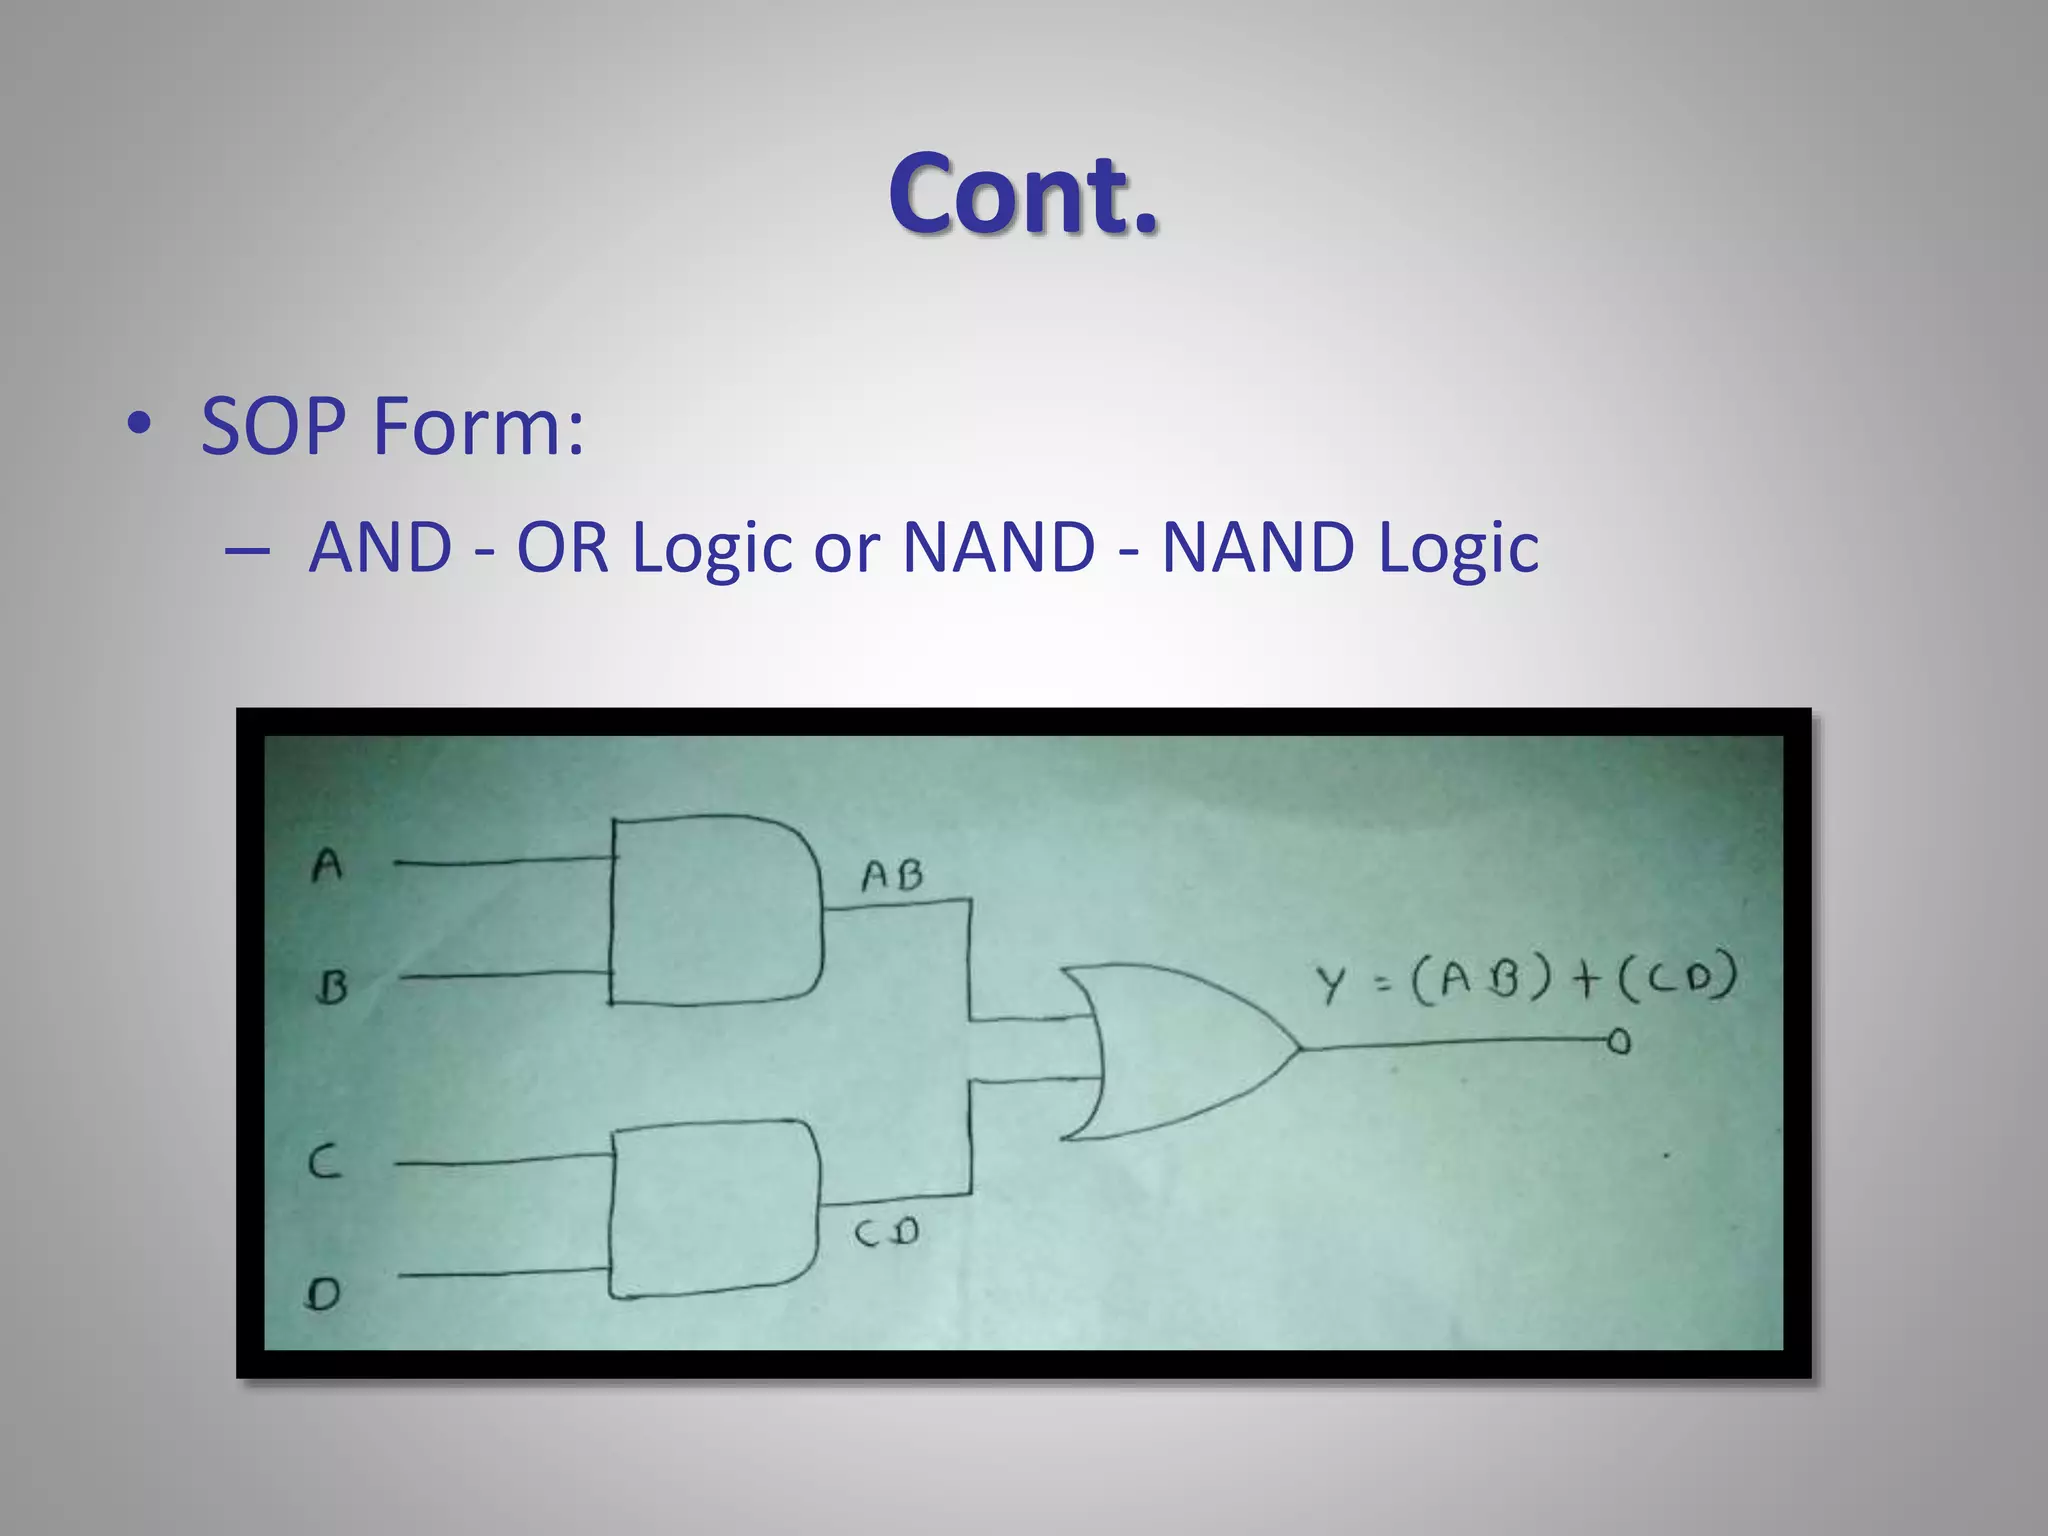
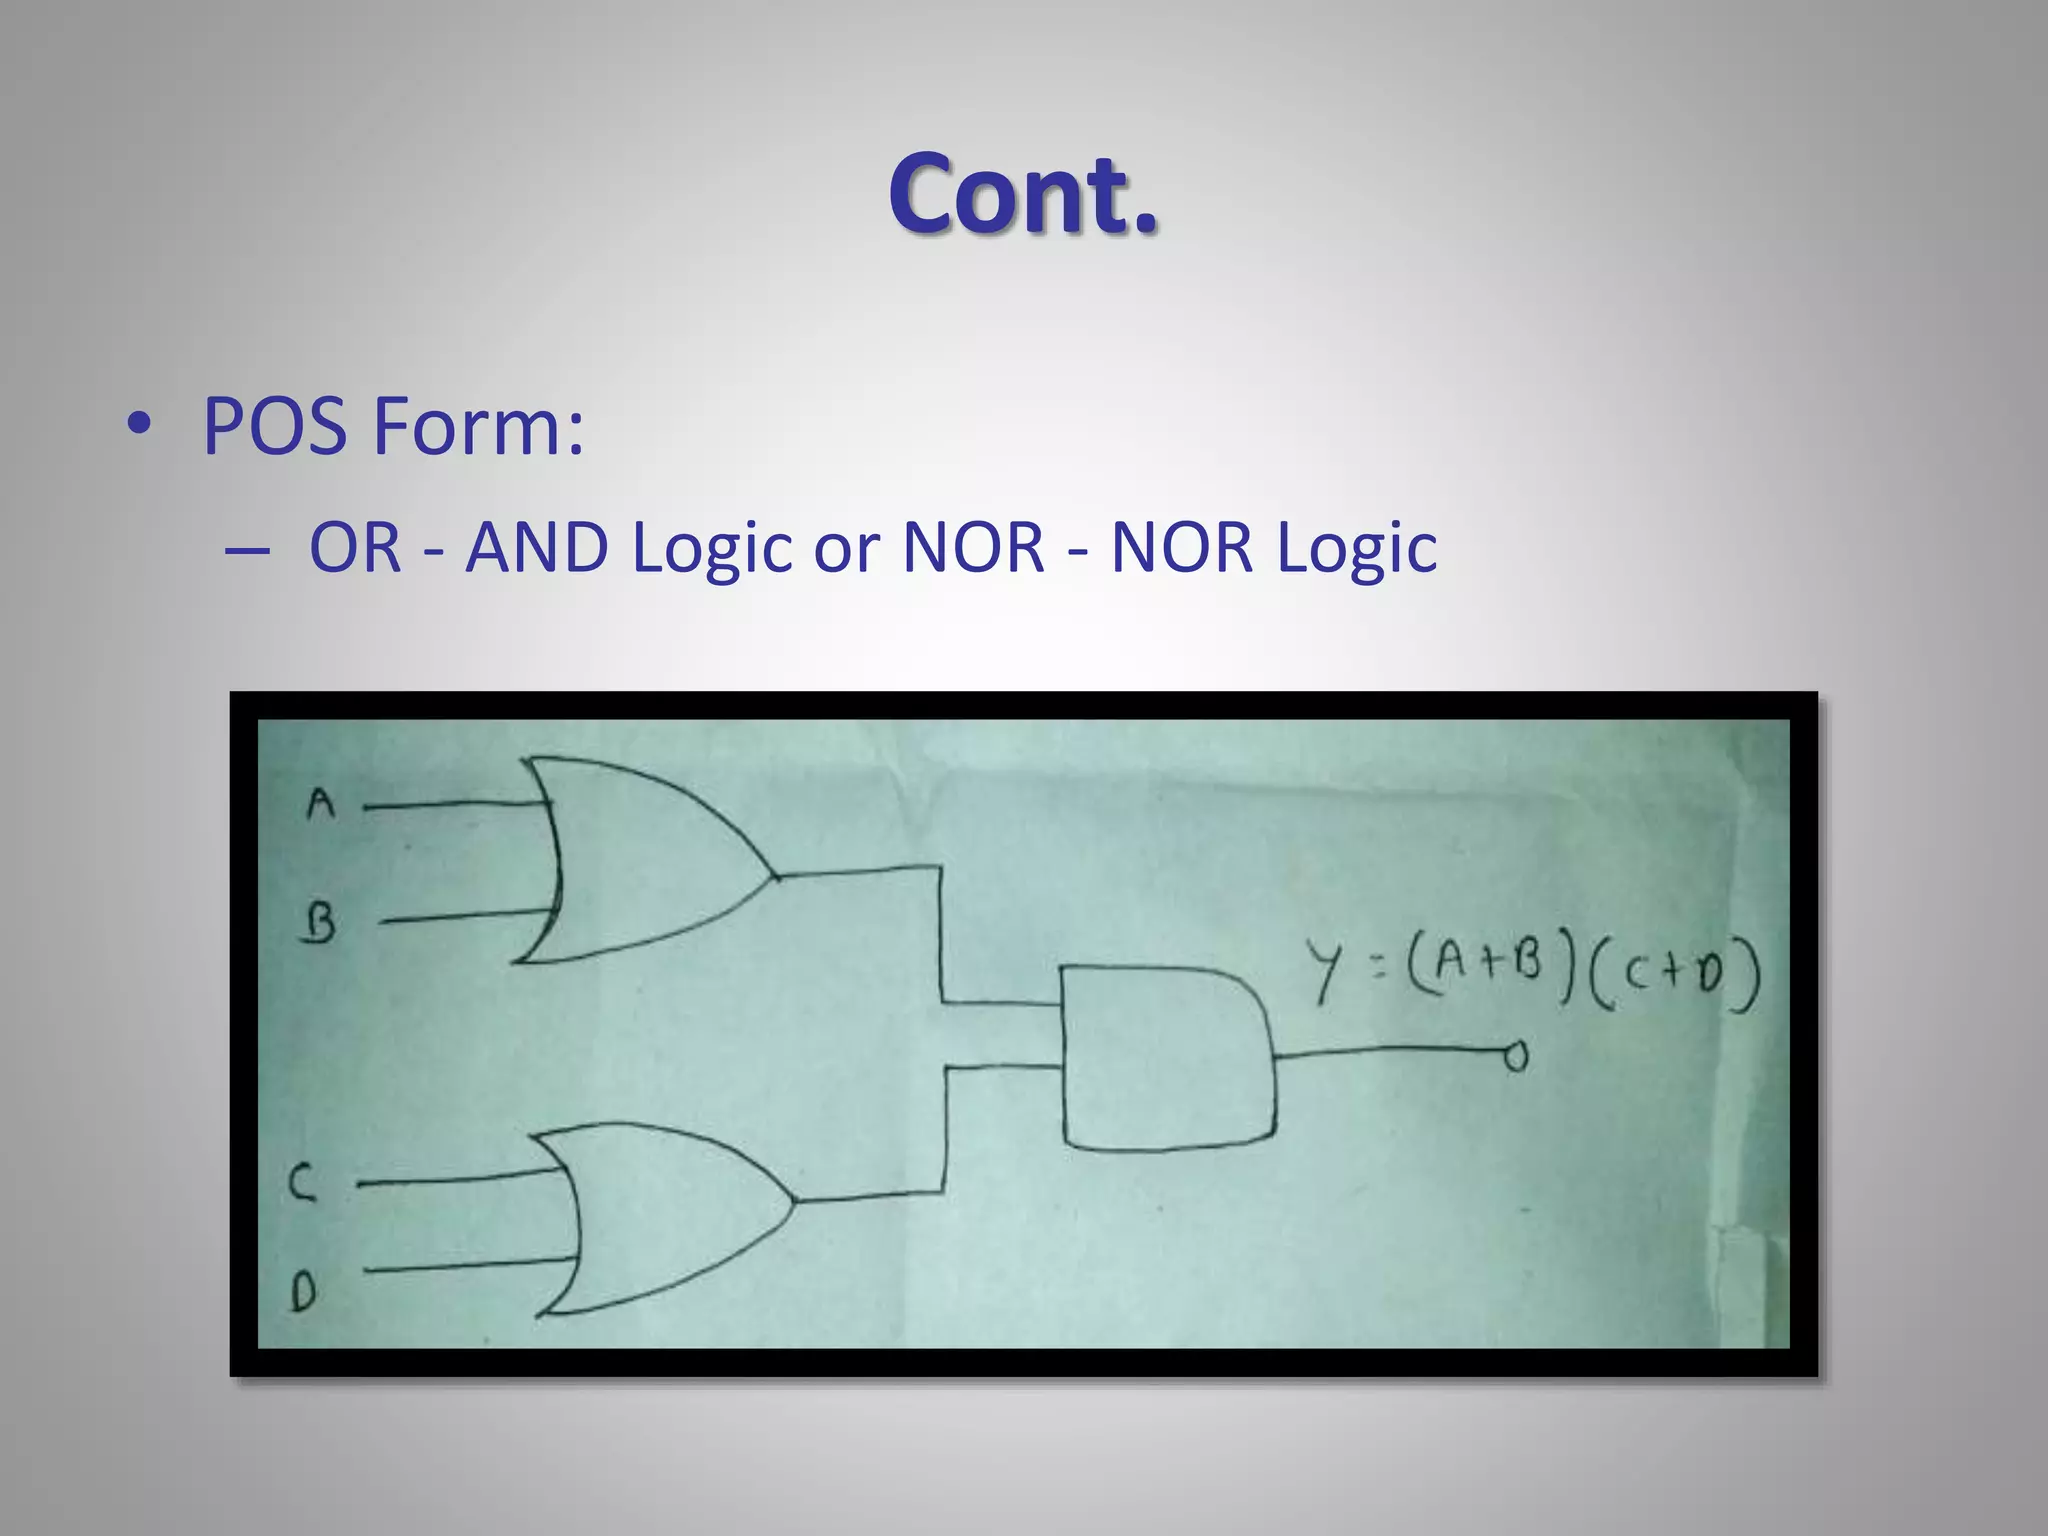
Explanation of Sum of Products (SOP) and Product of Sums (POS) forms, highlighting logical operations involved.
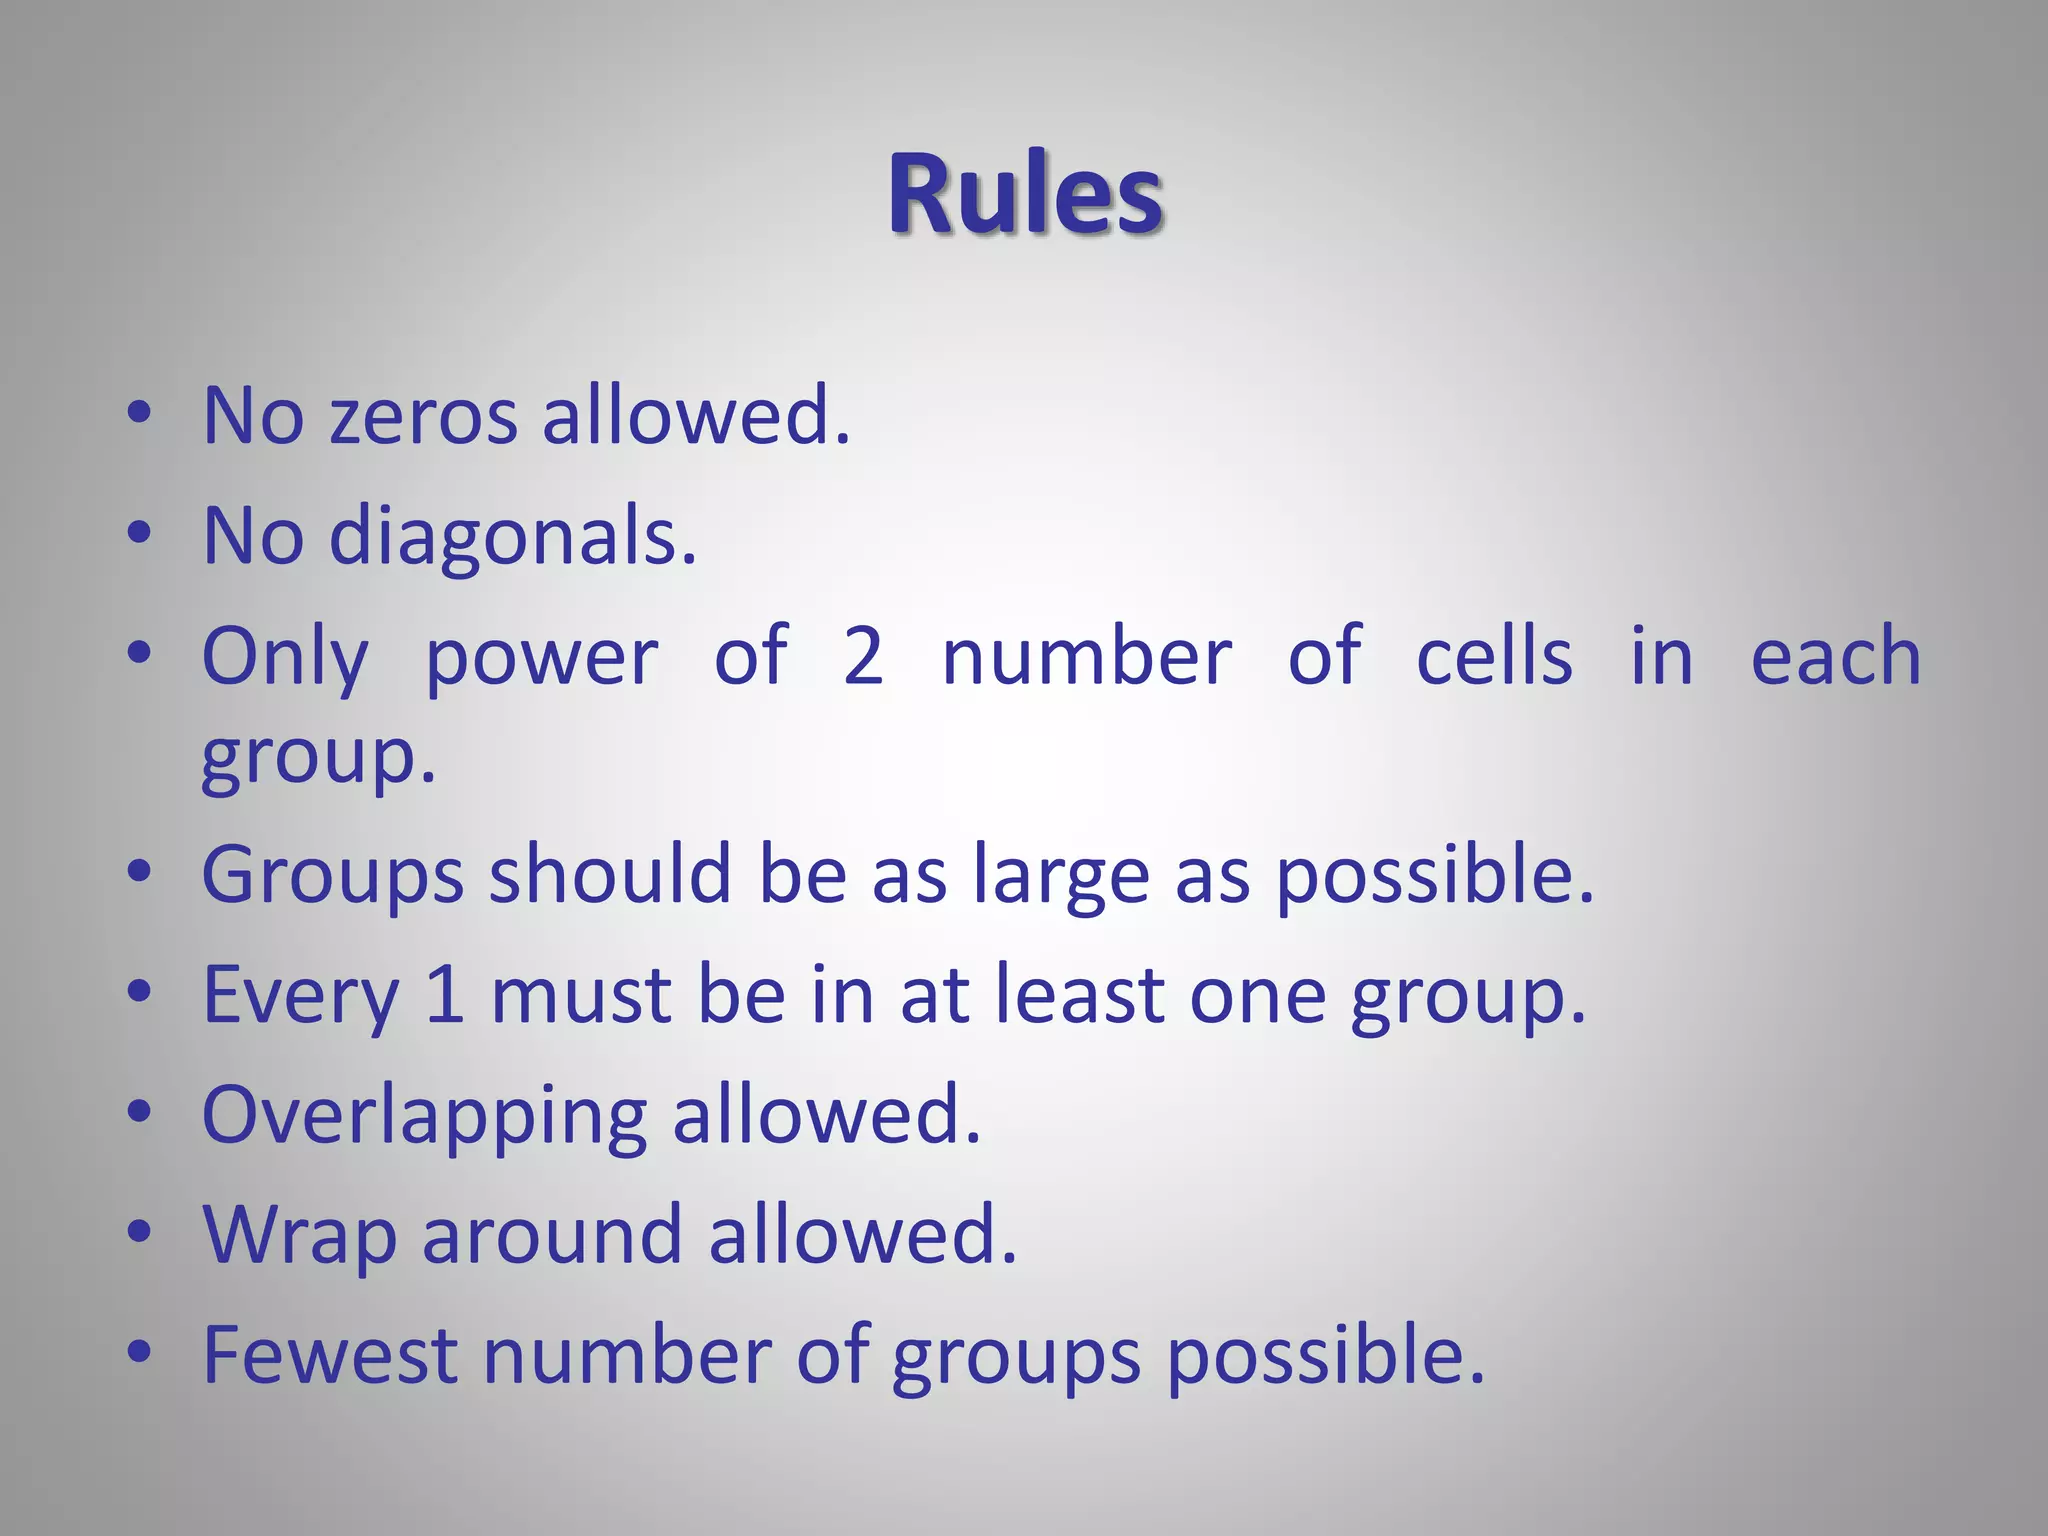
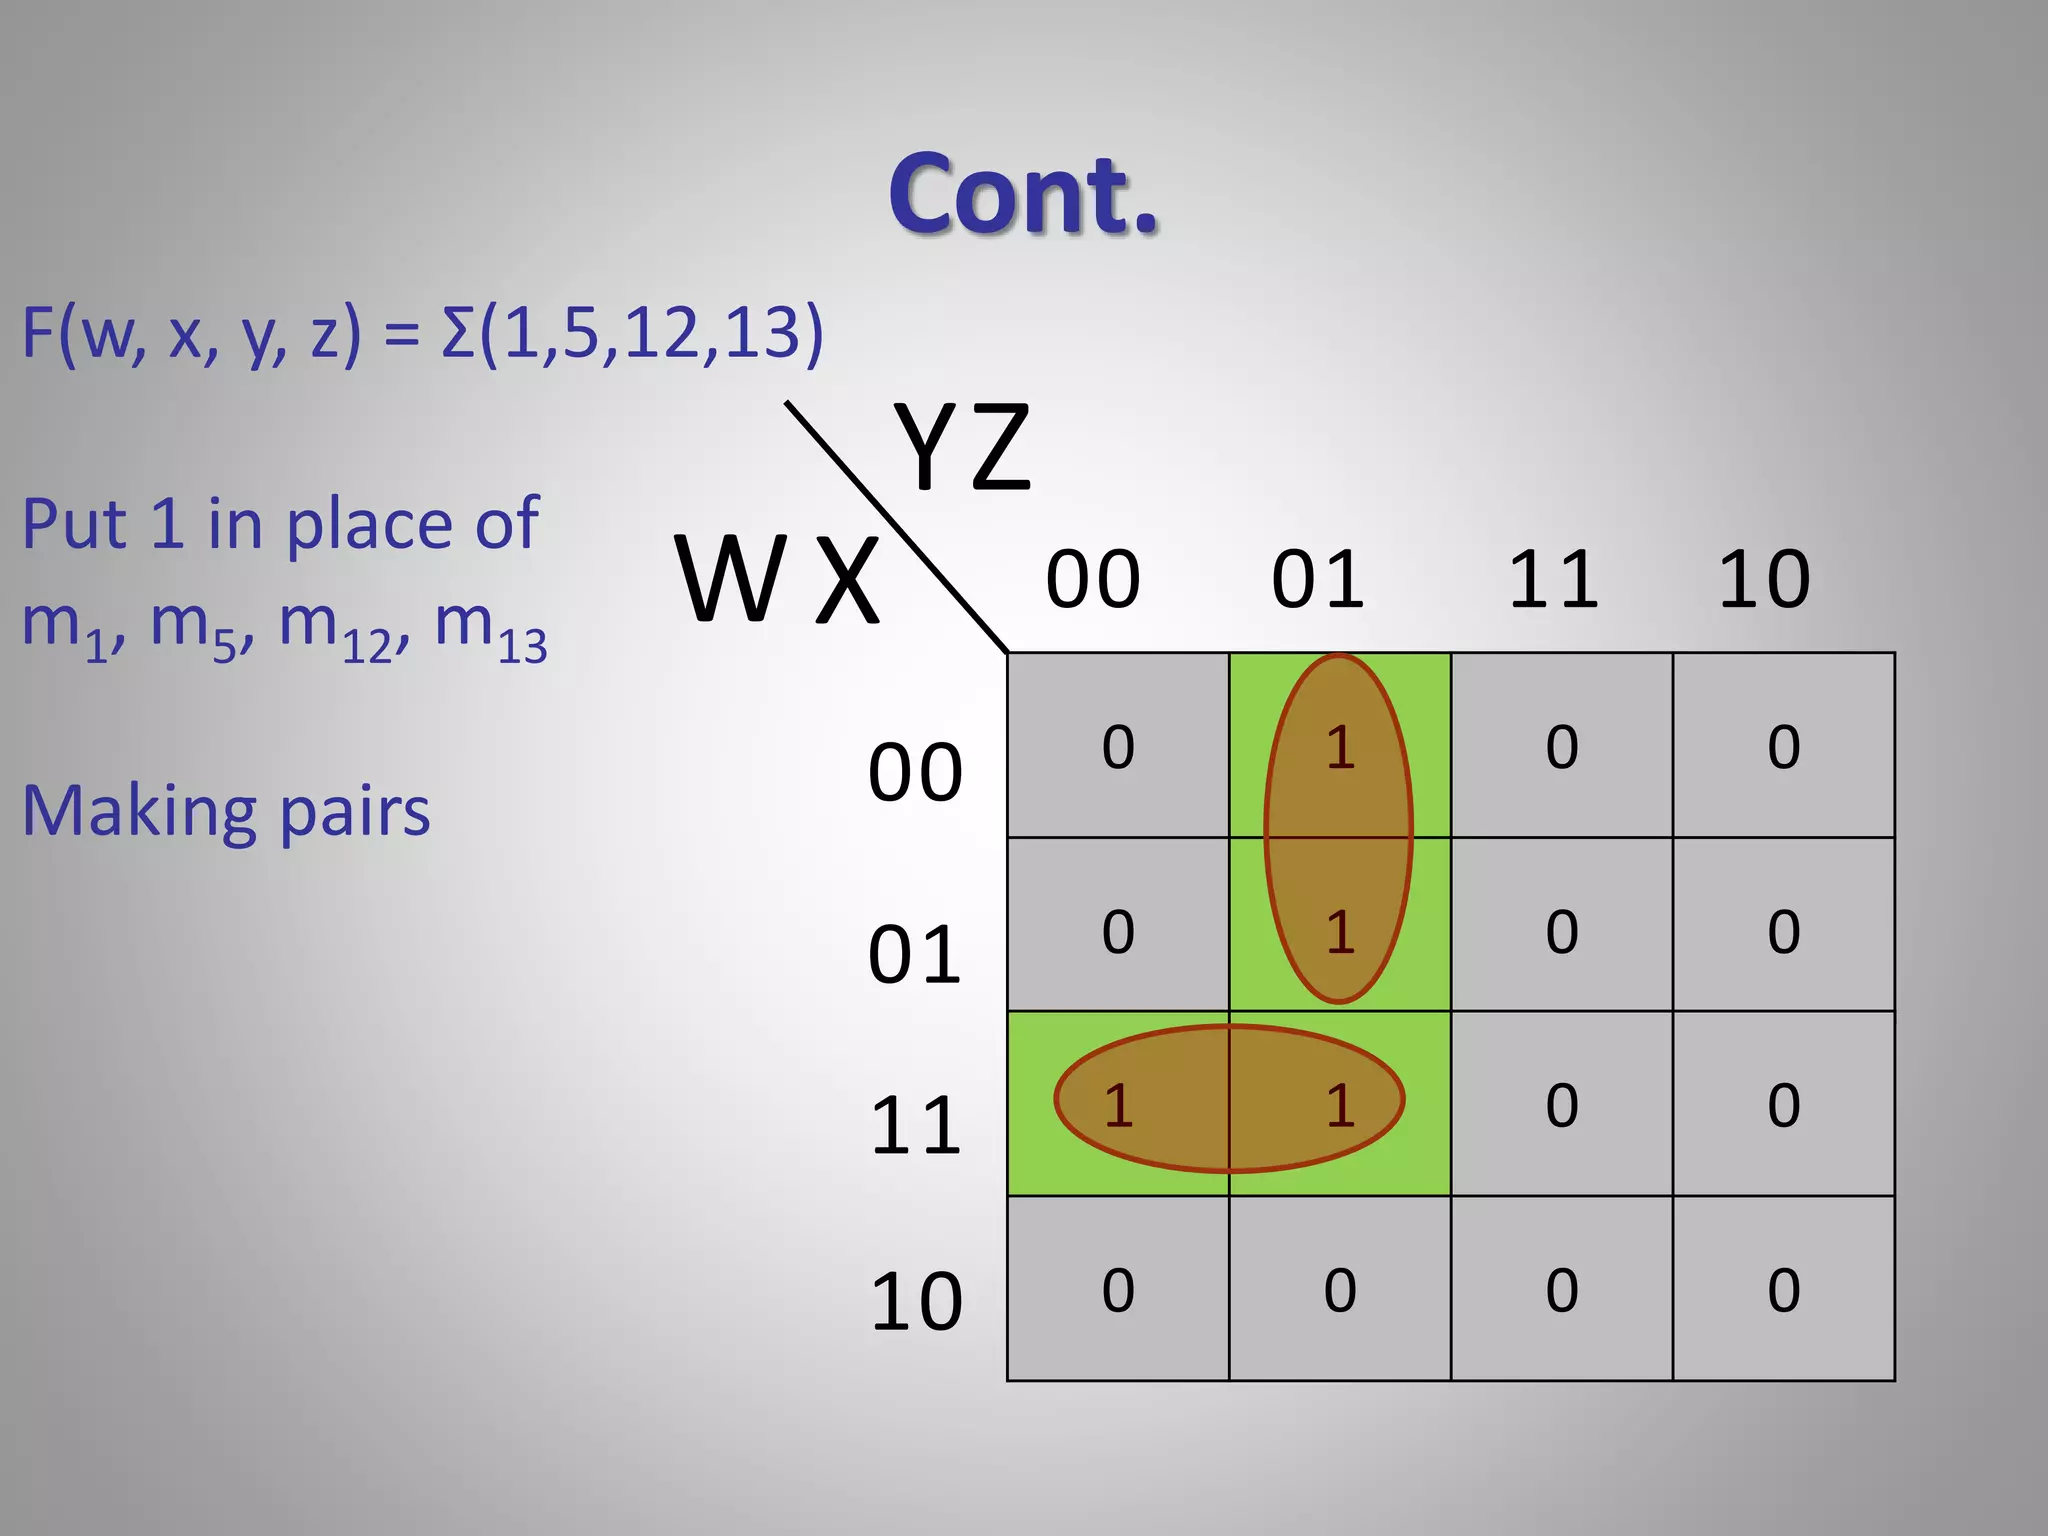
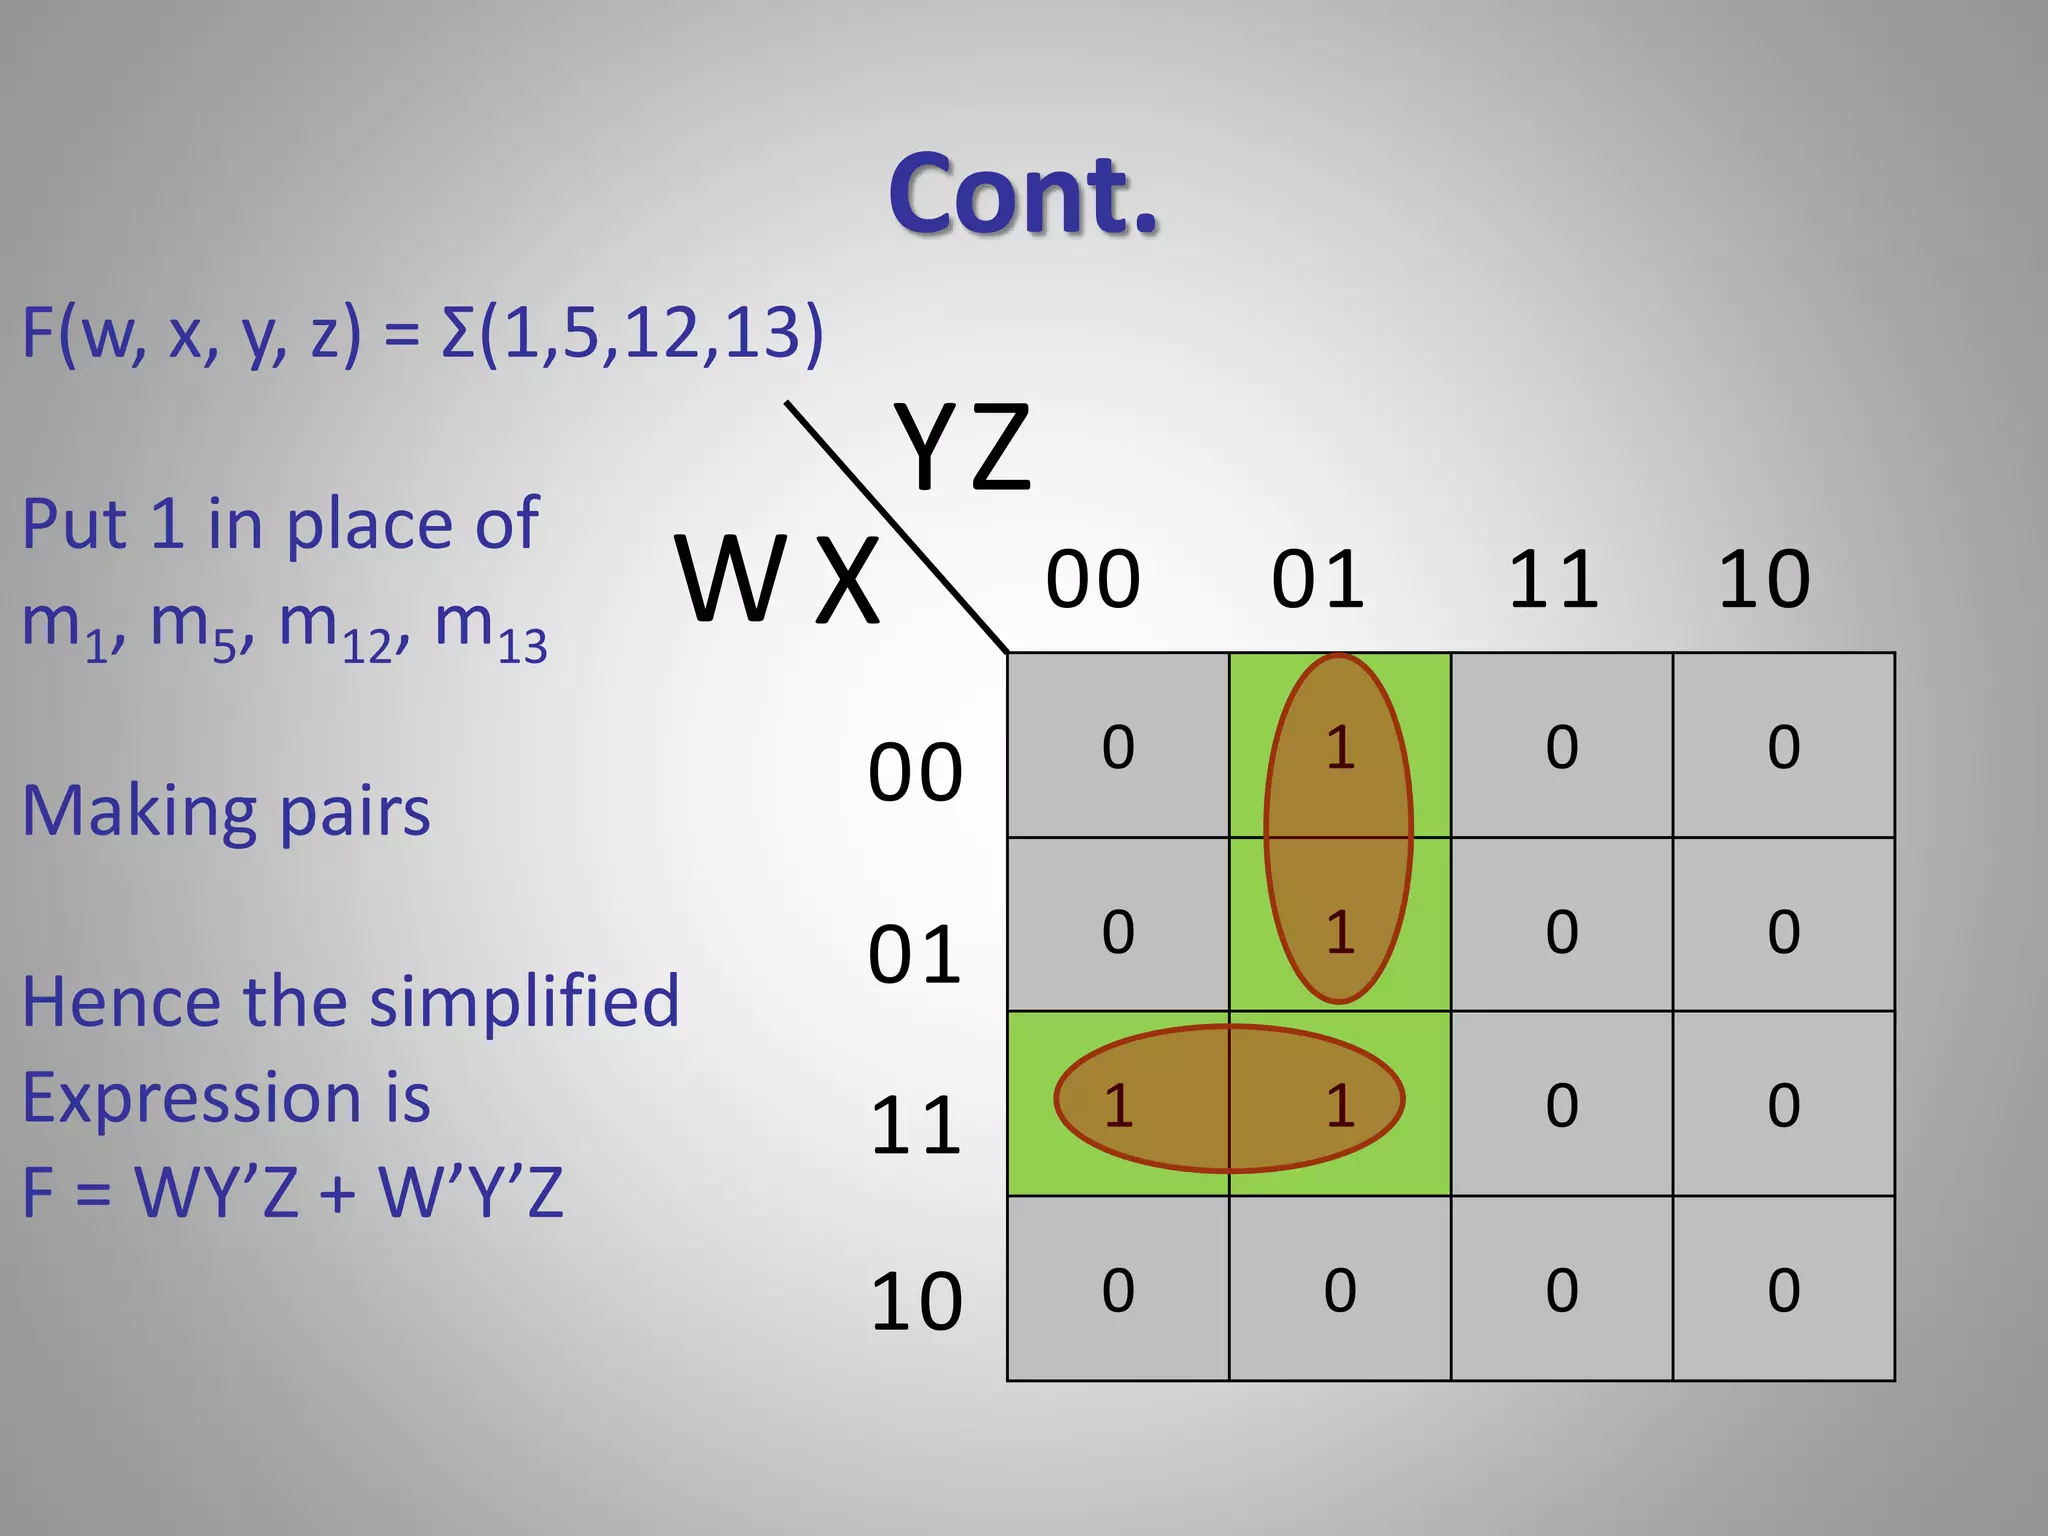
Rules for grouping in K-map minimization, emphasizing cell grouping strategies and overlaps.
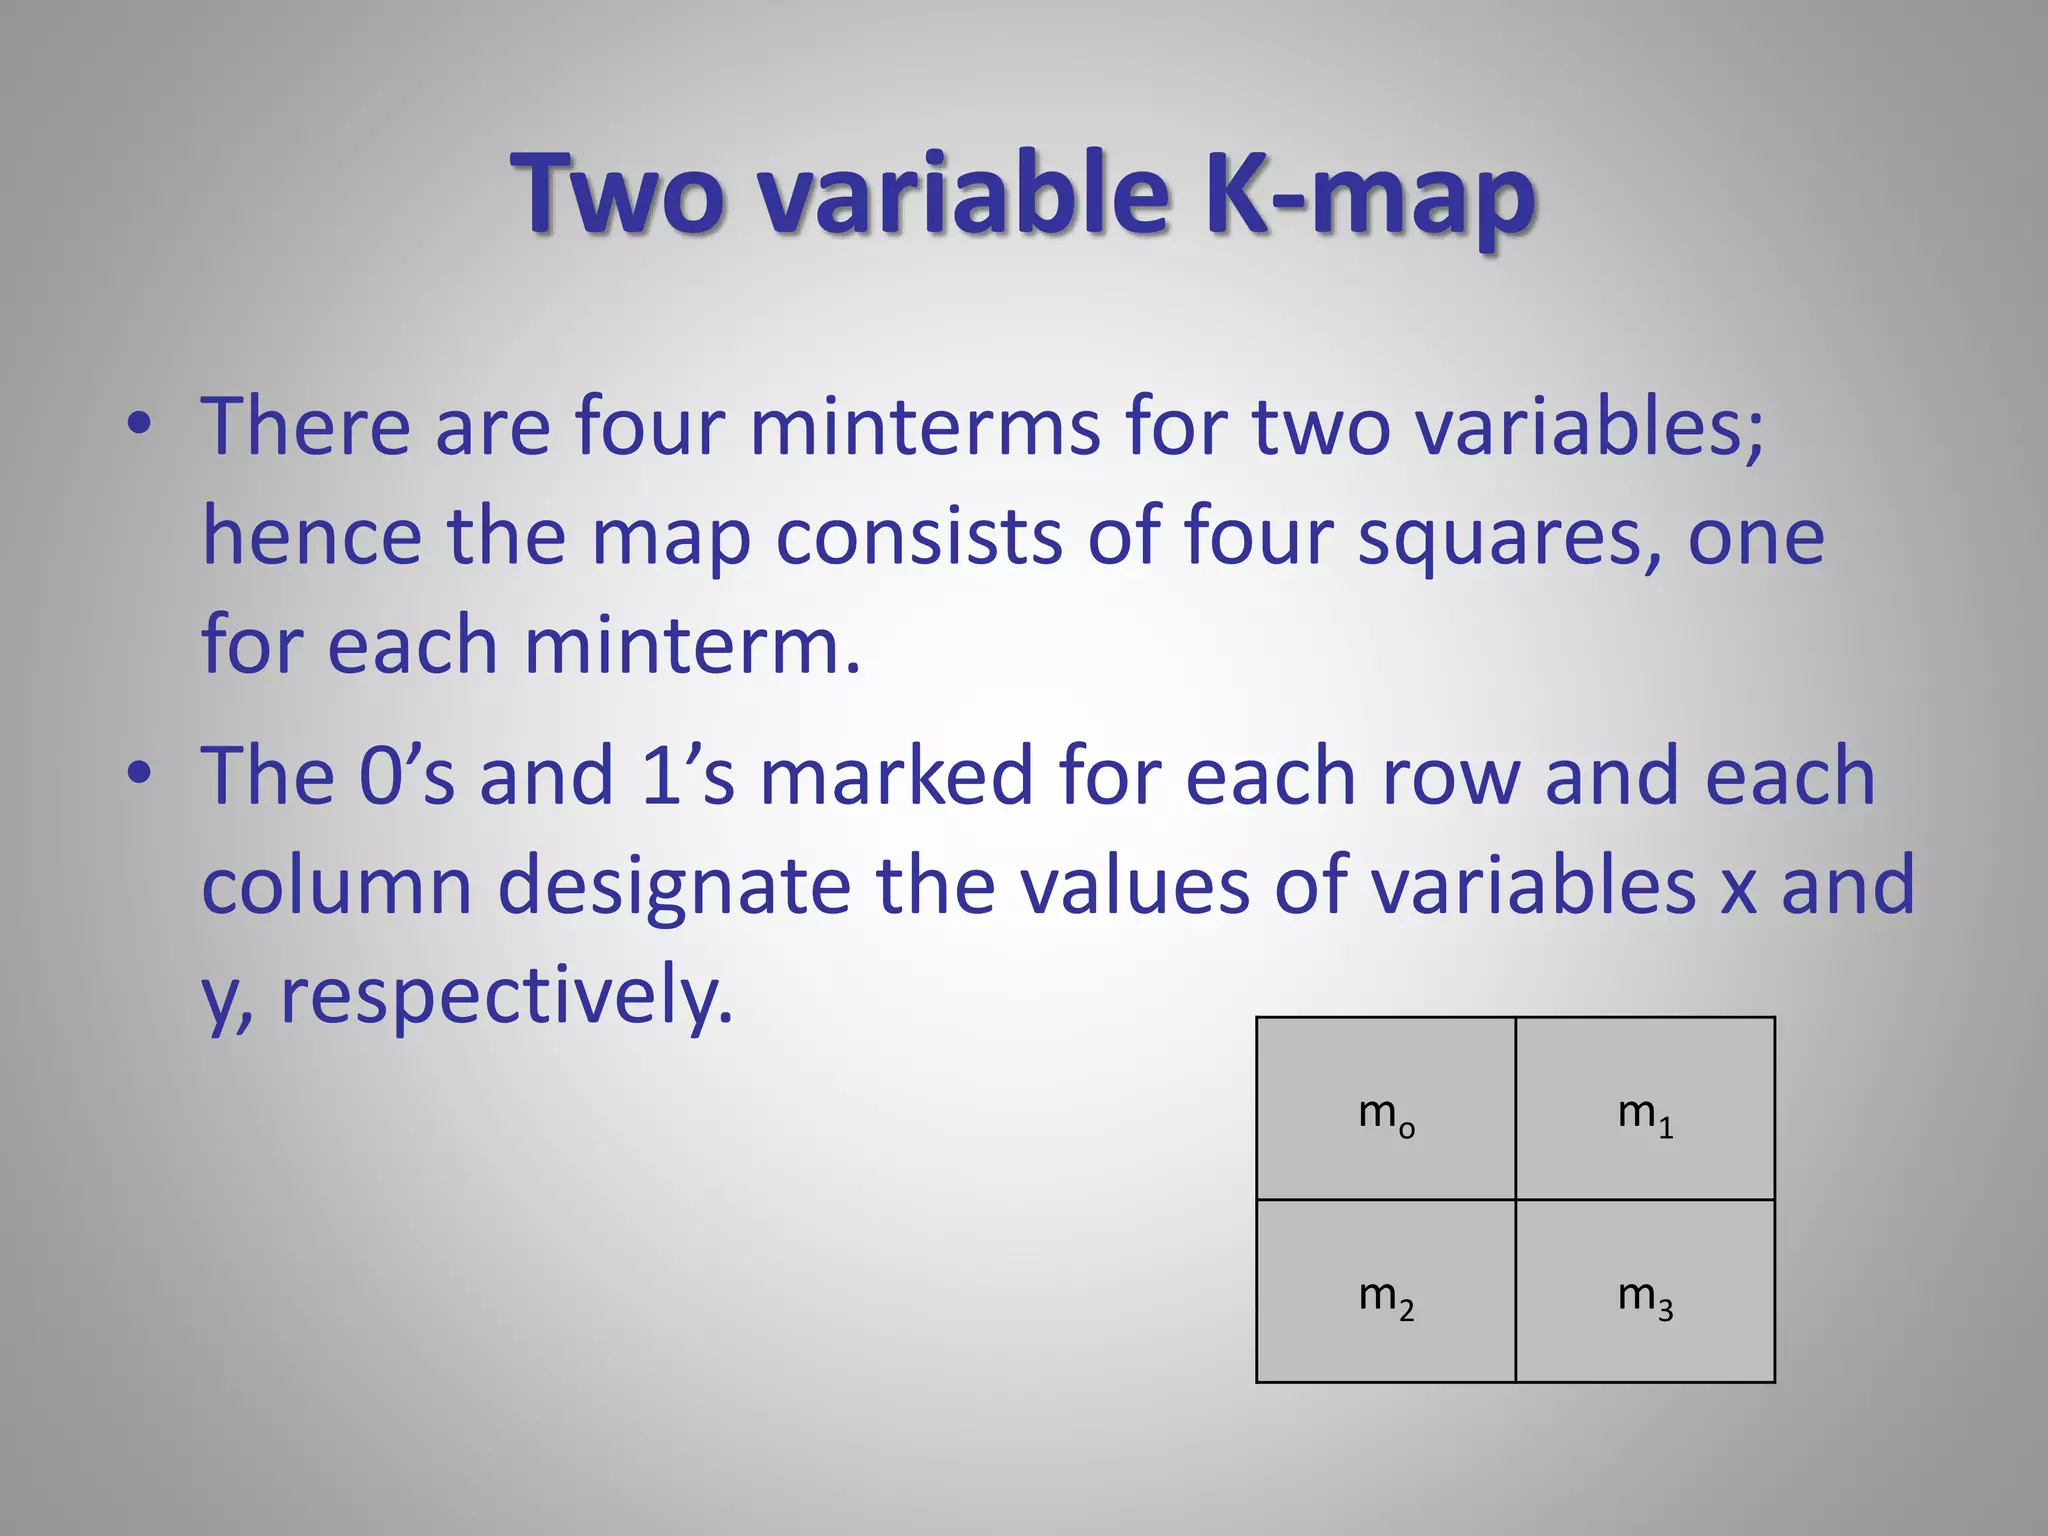
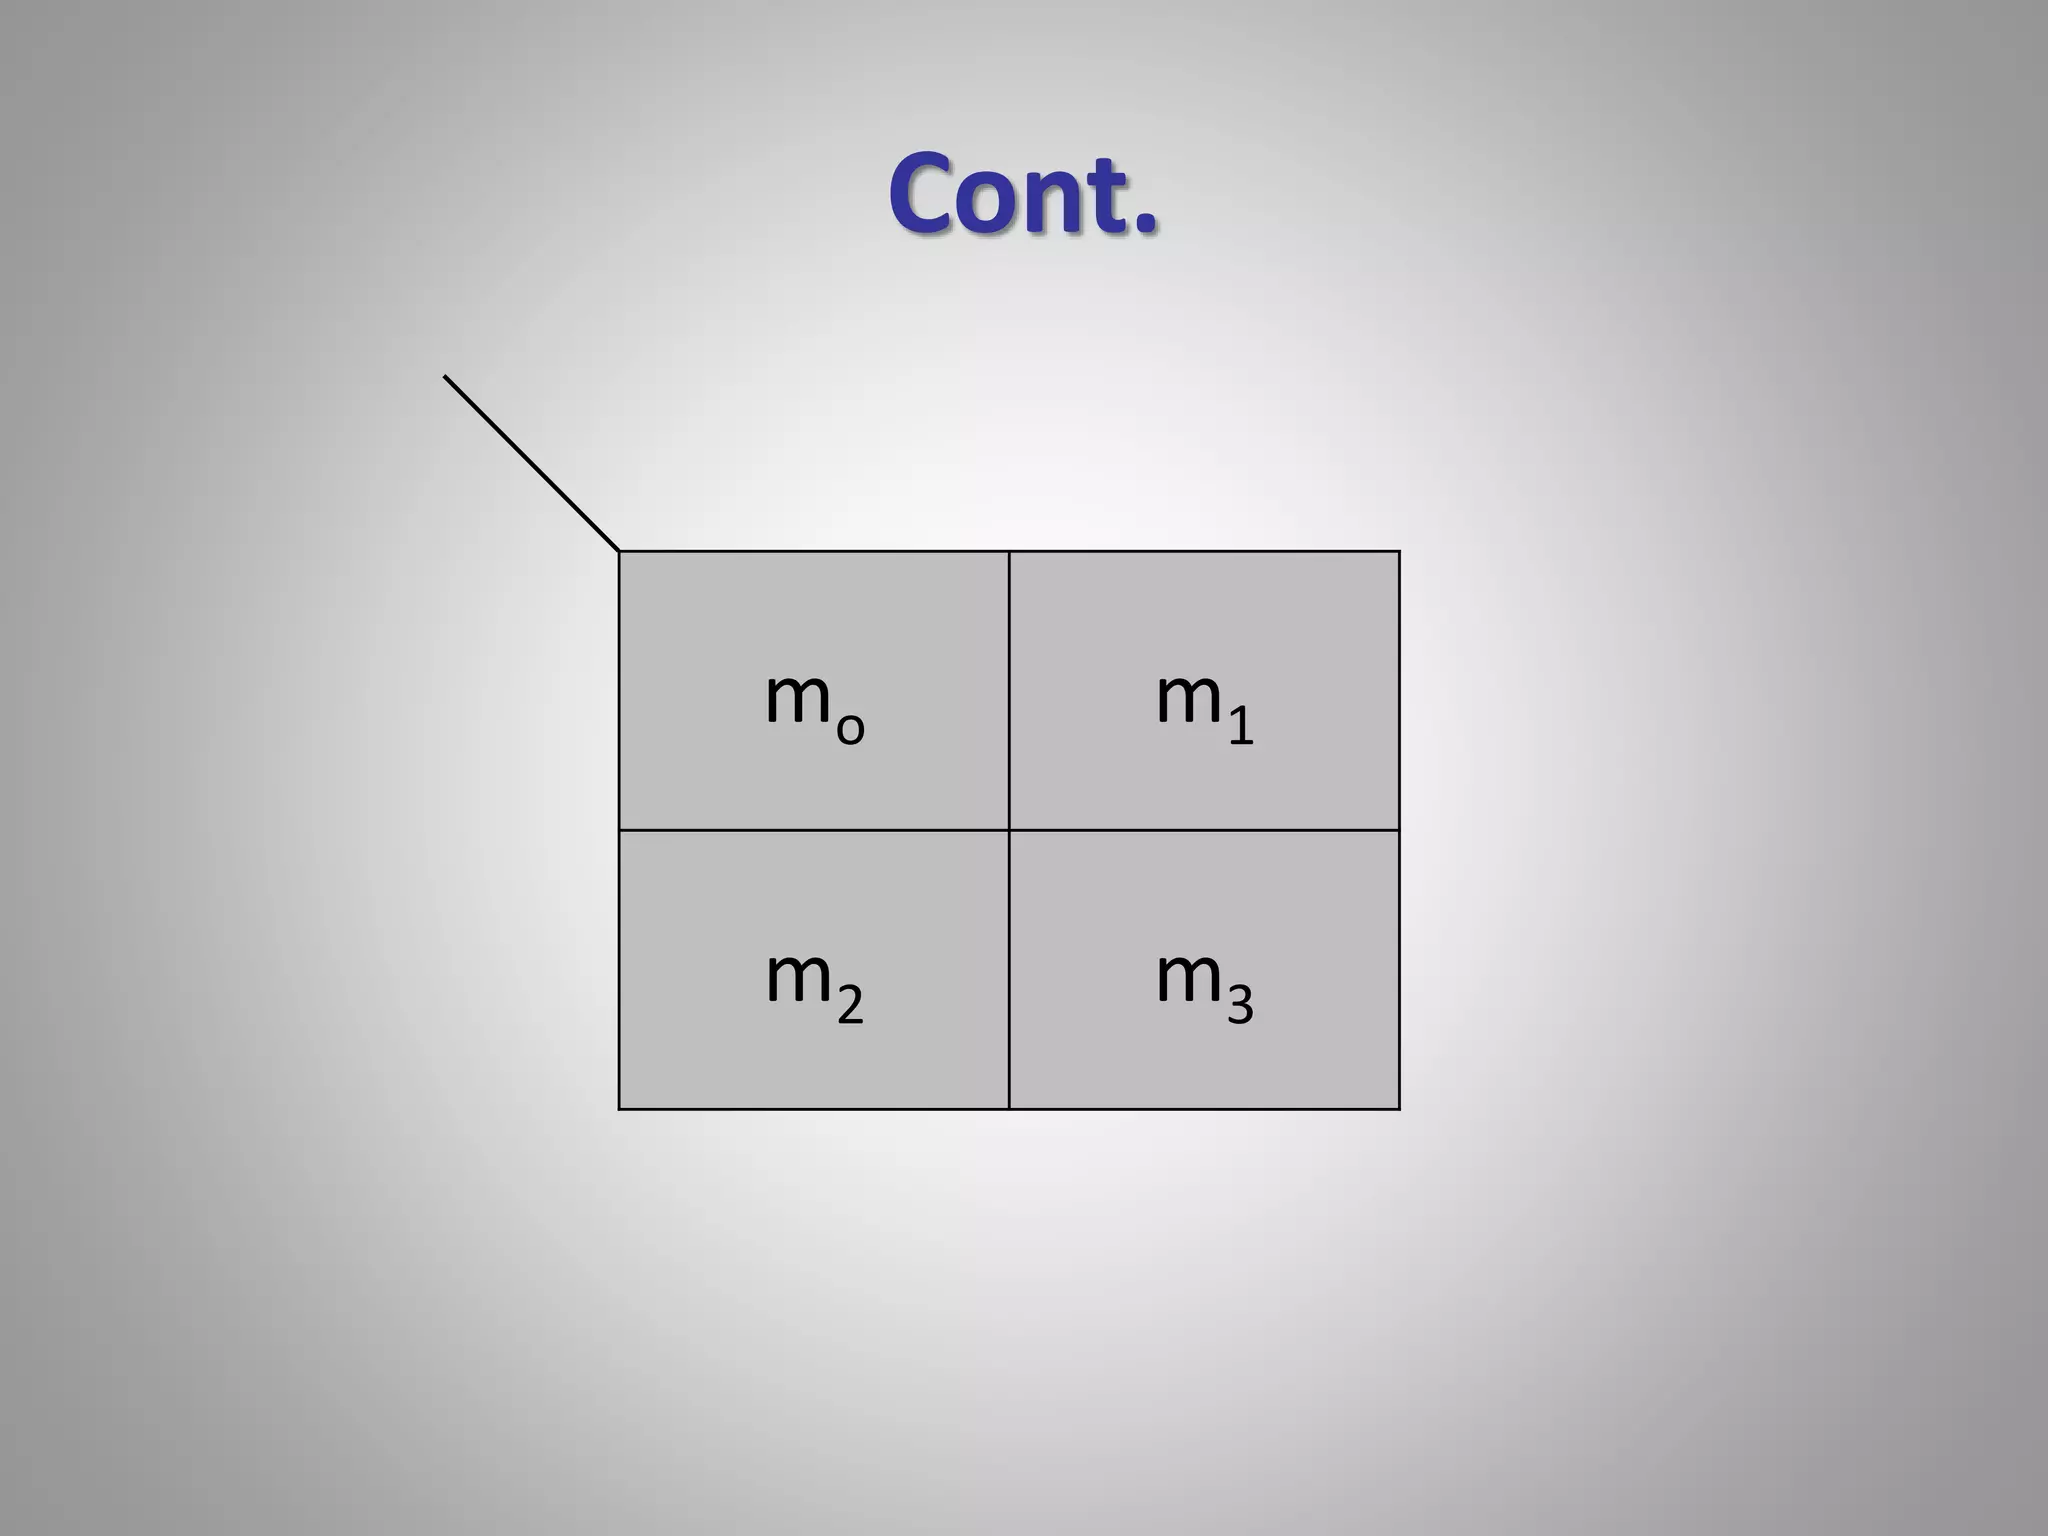
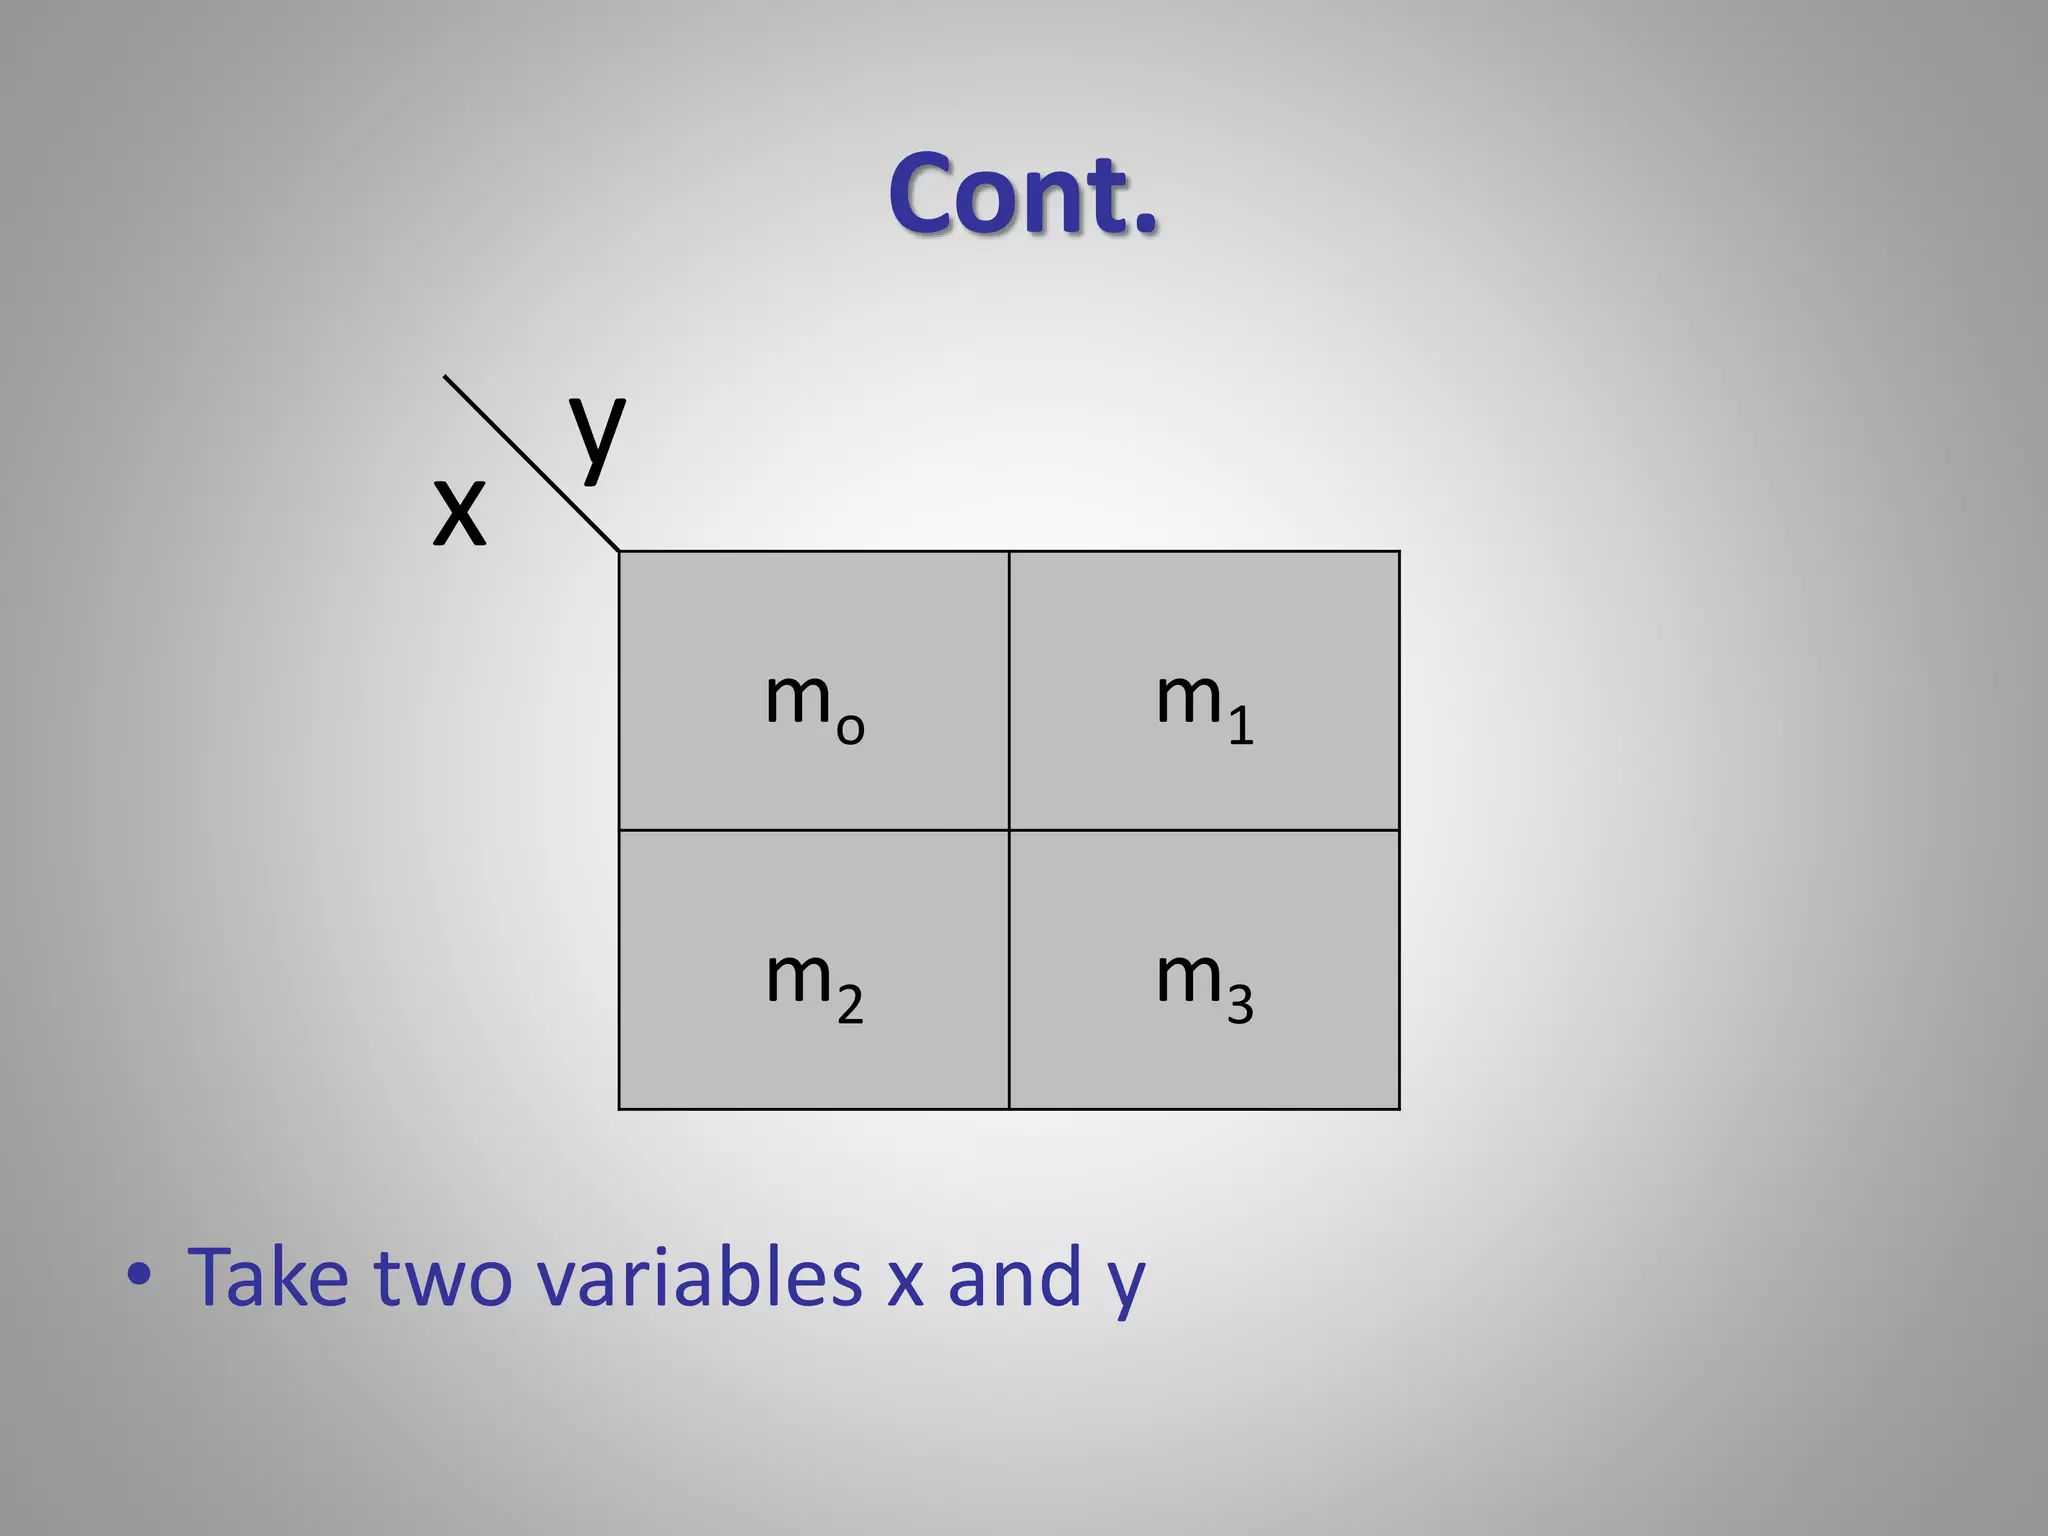
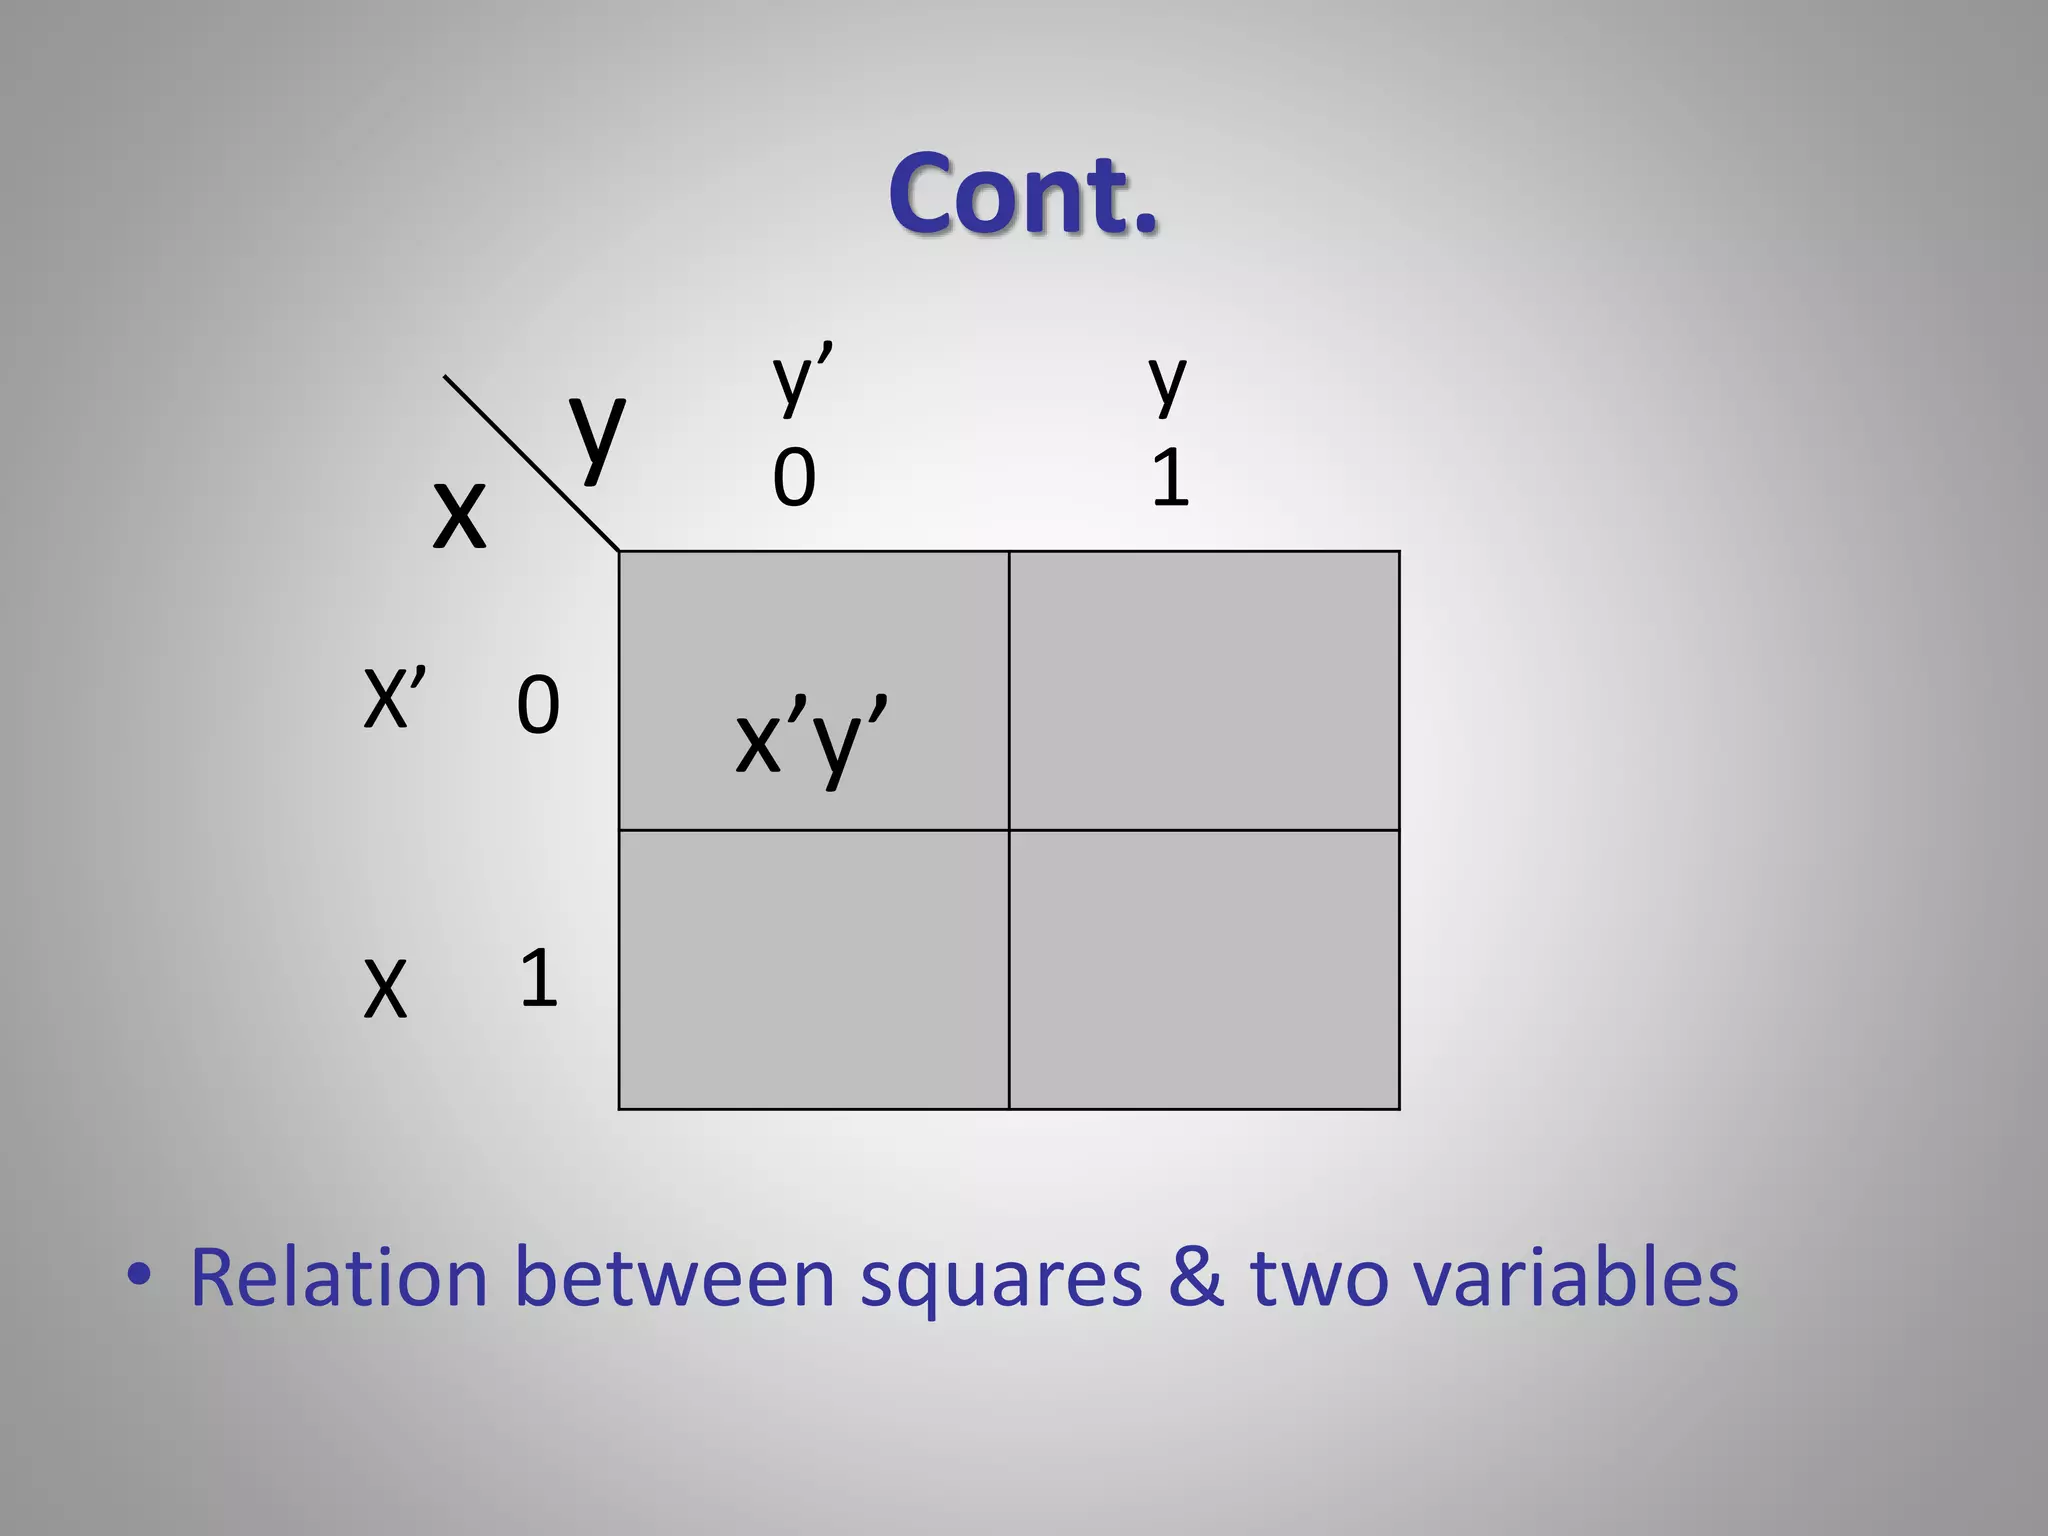
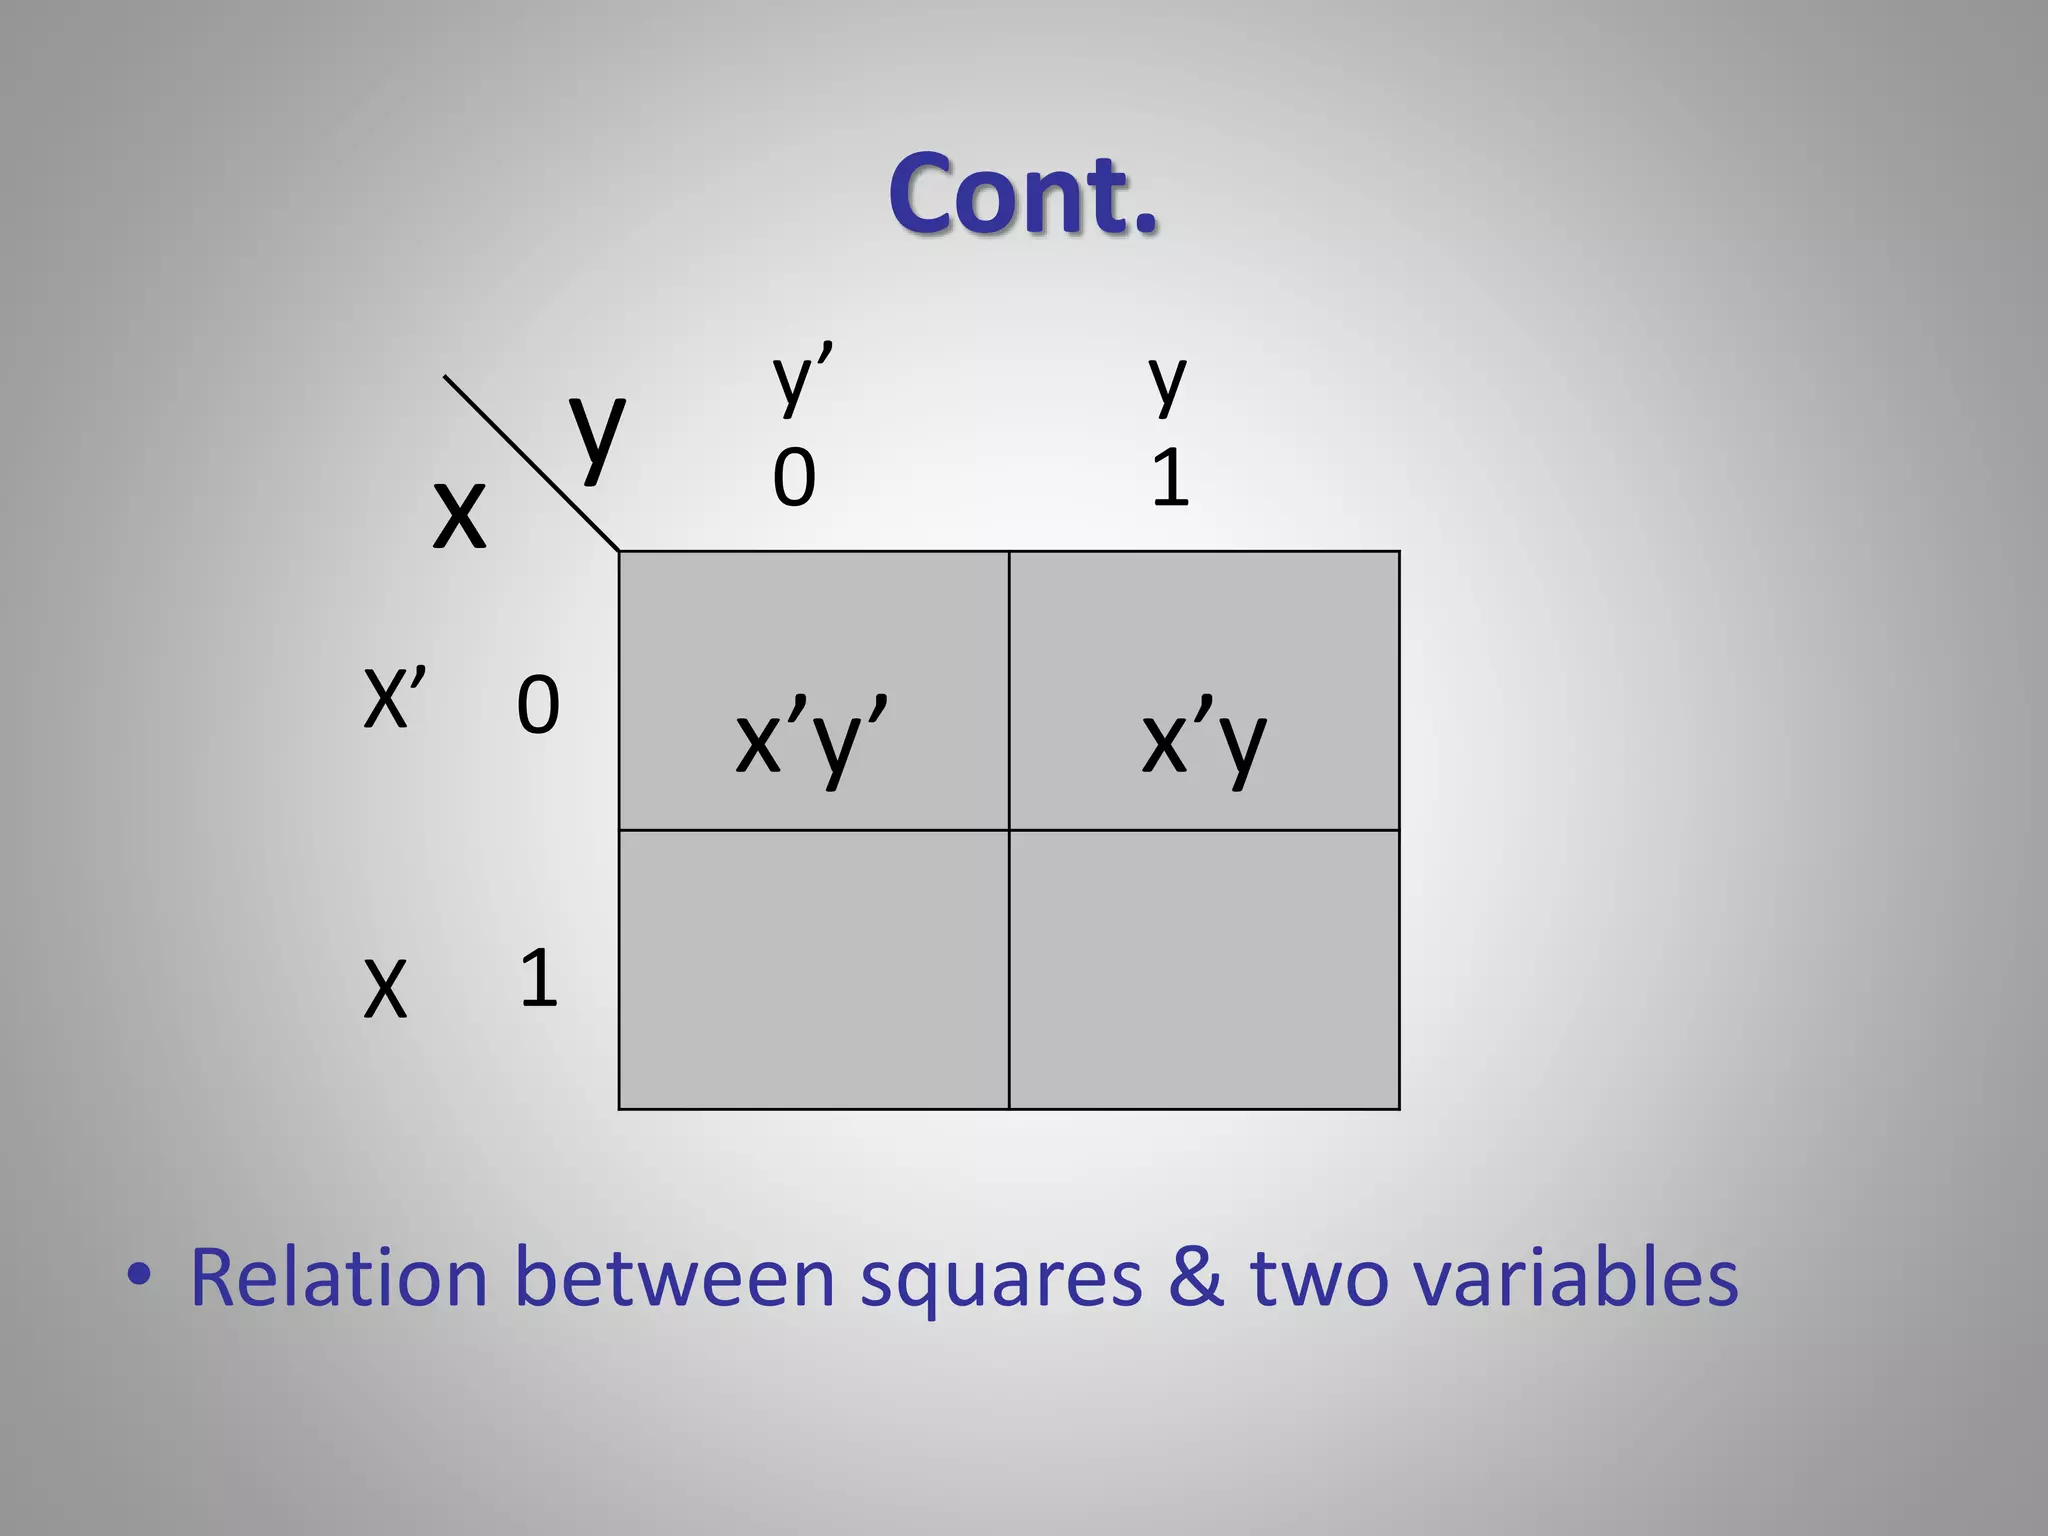
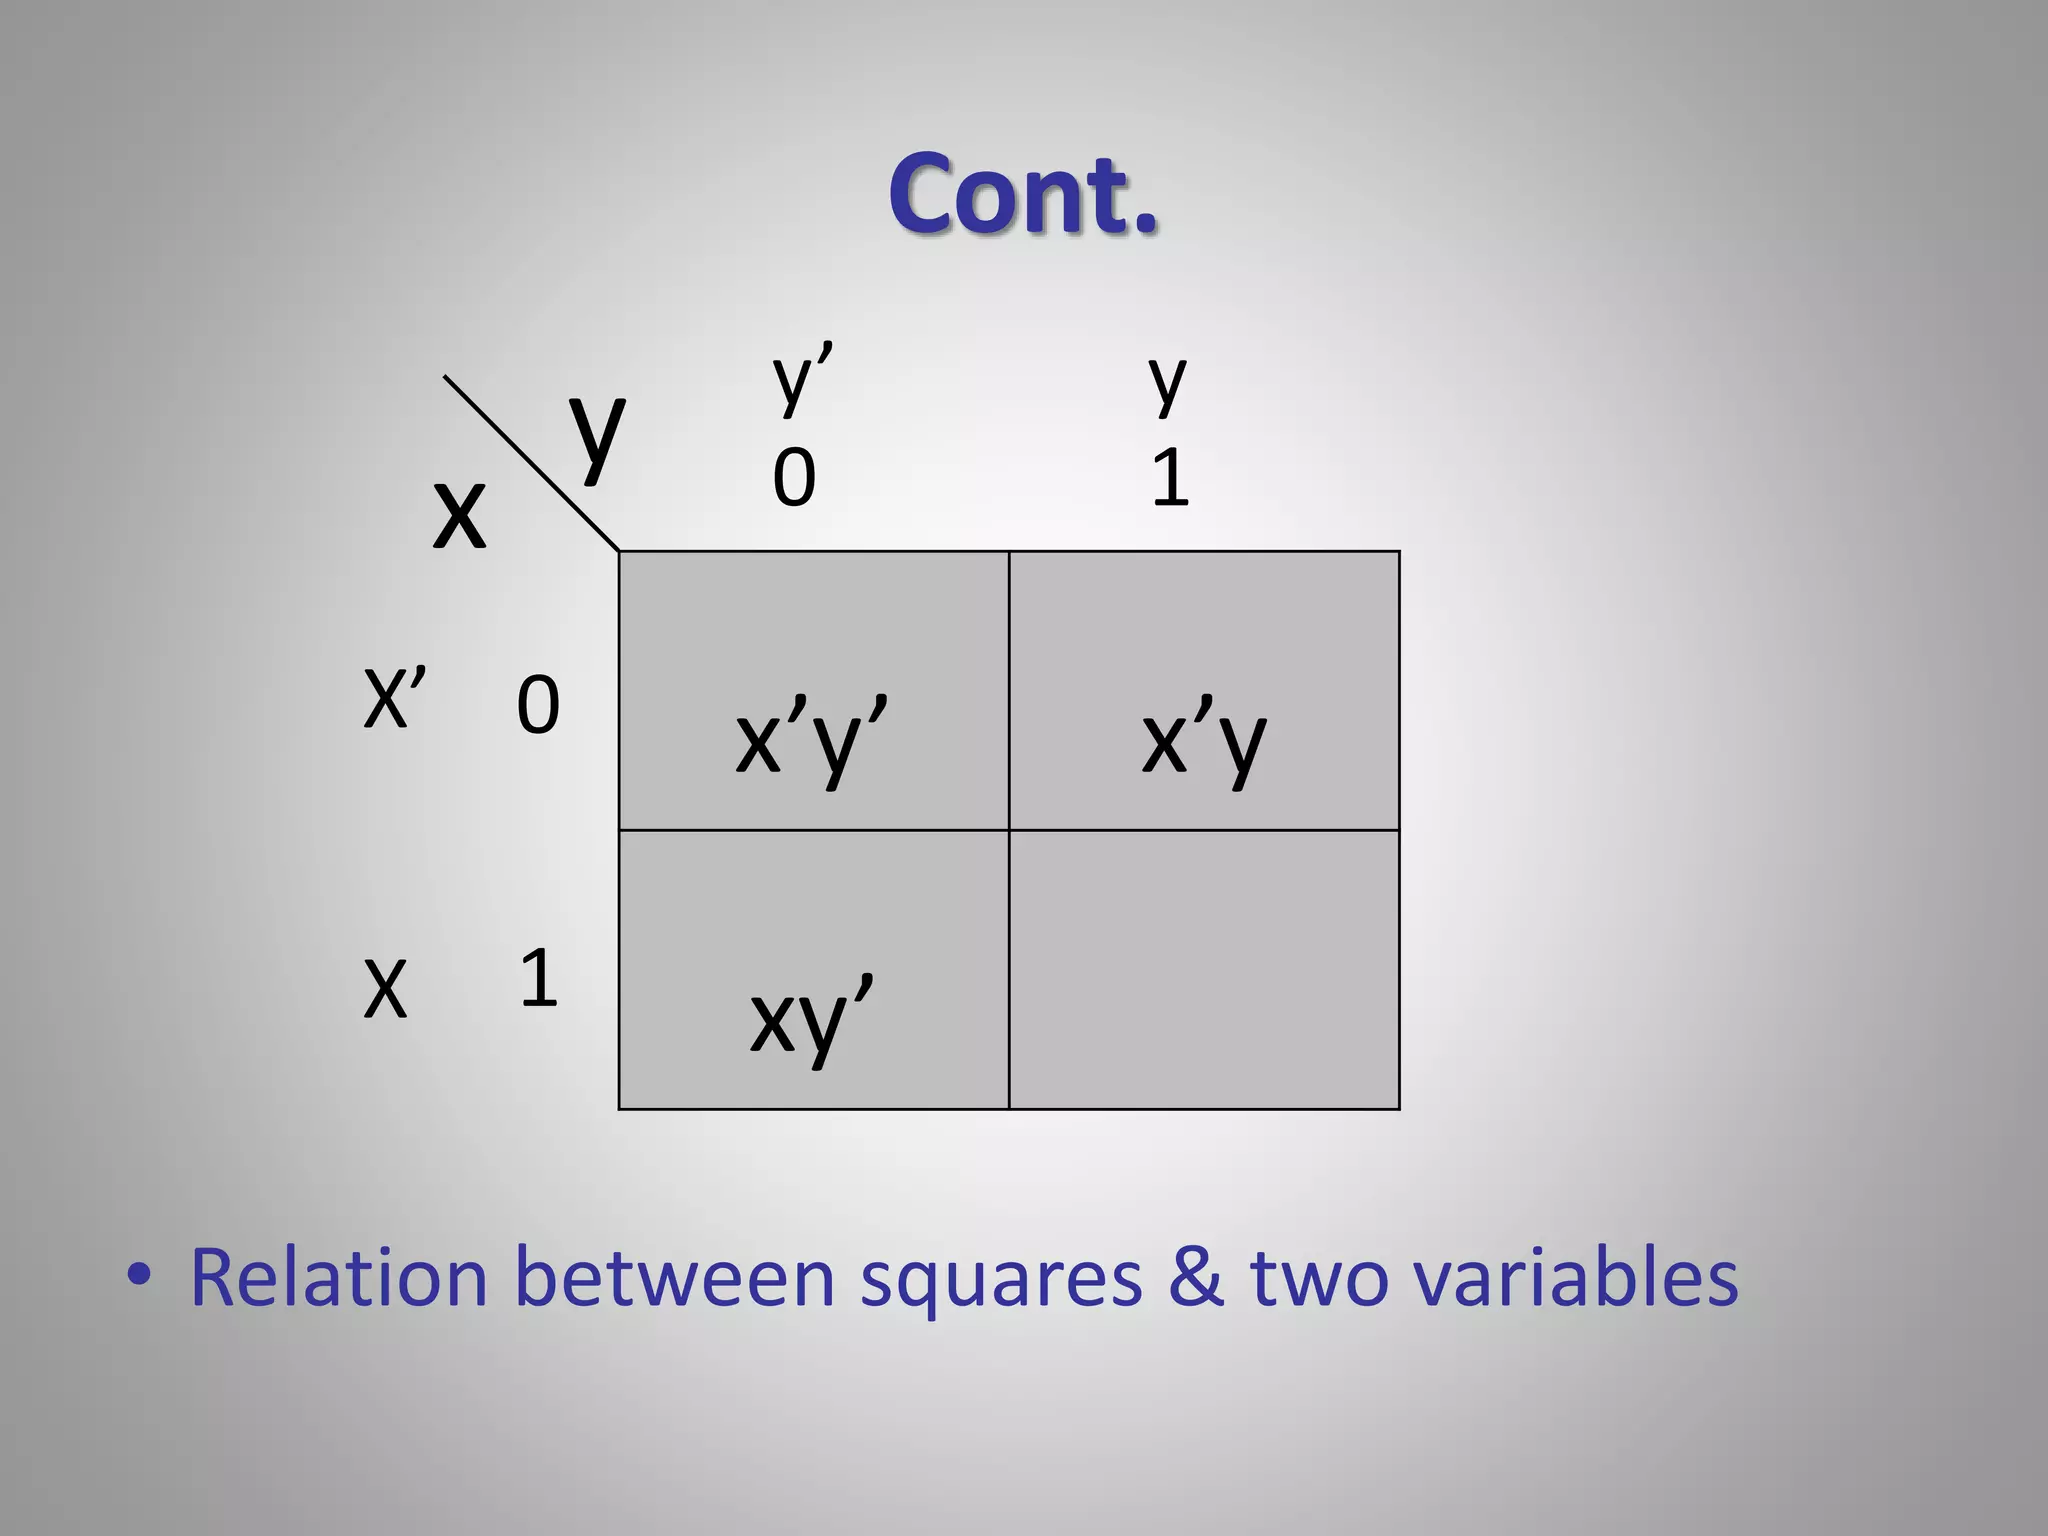
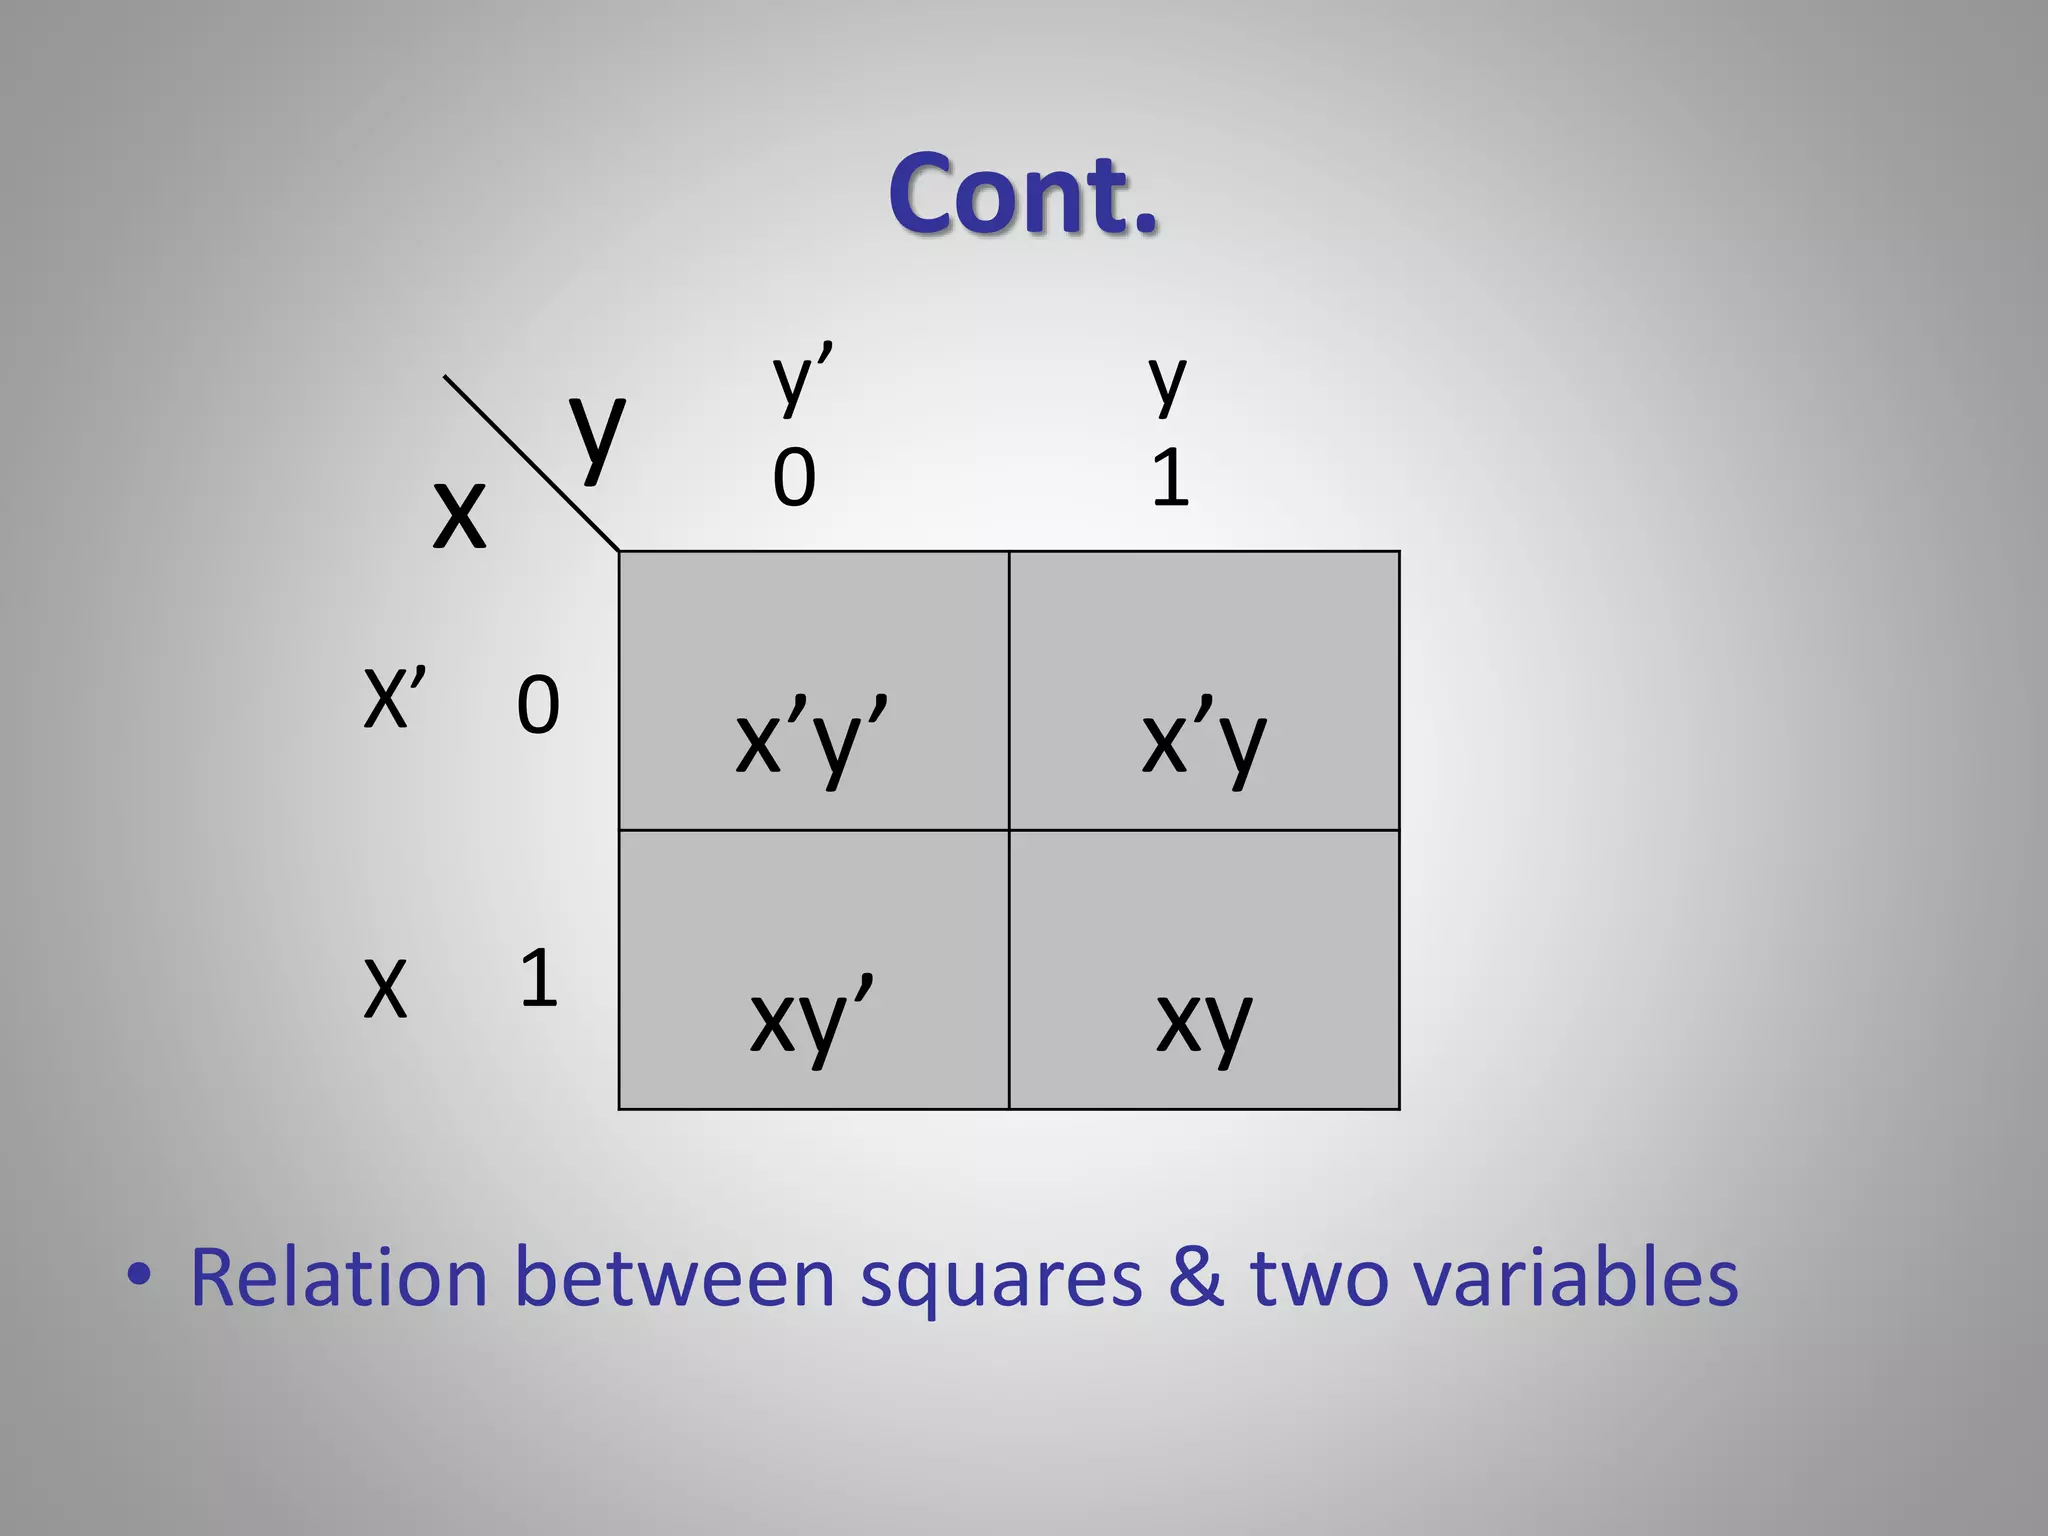
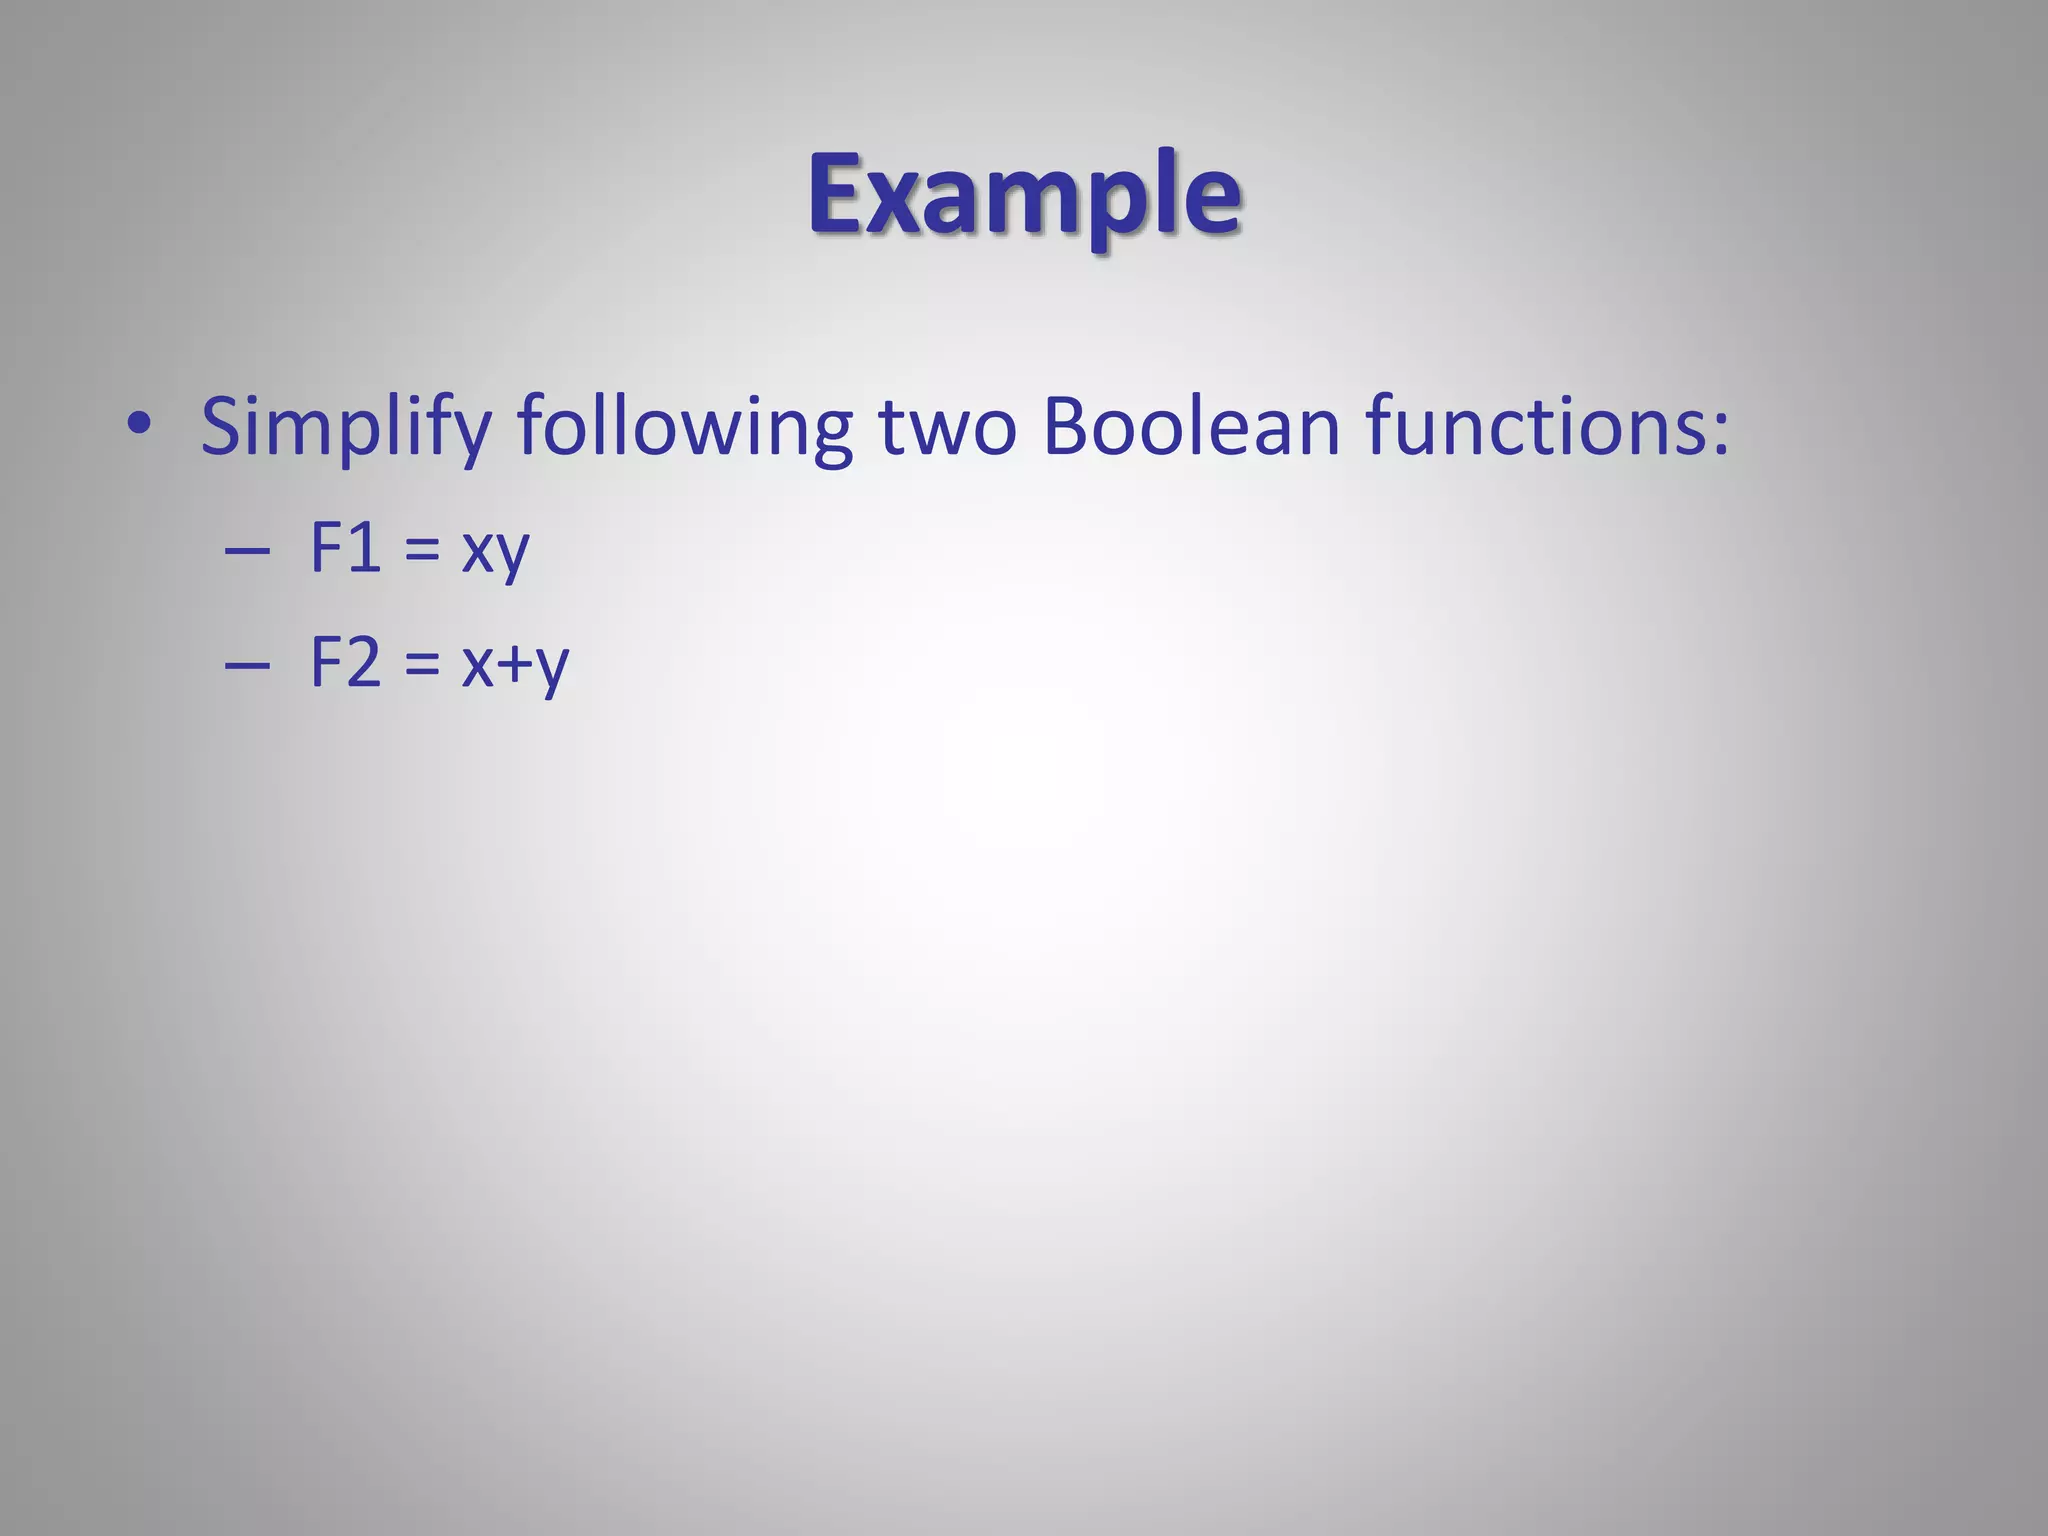
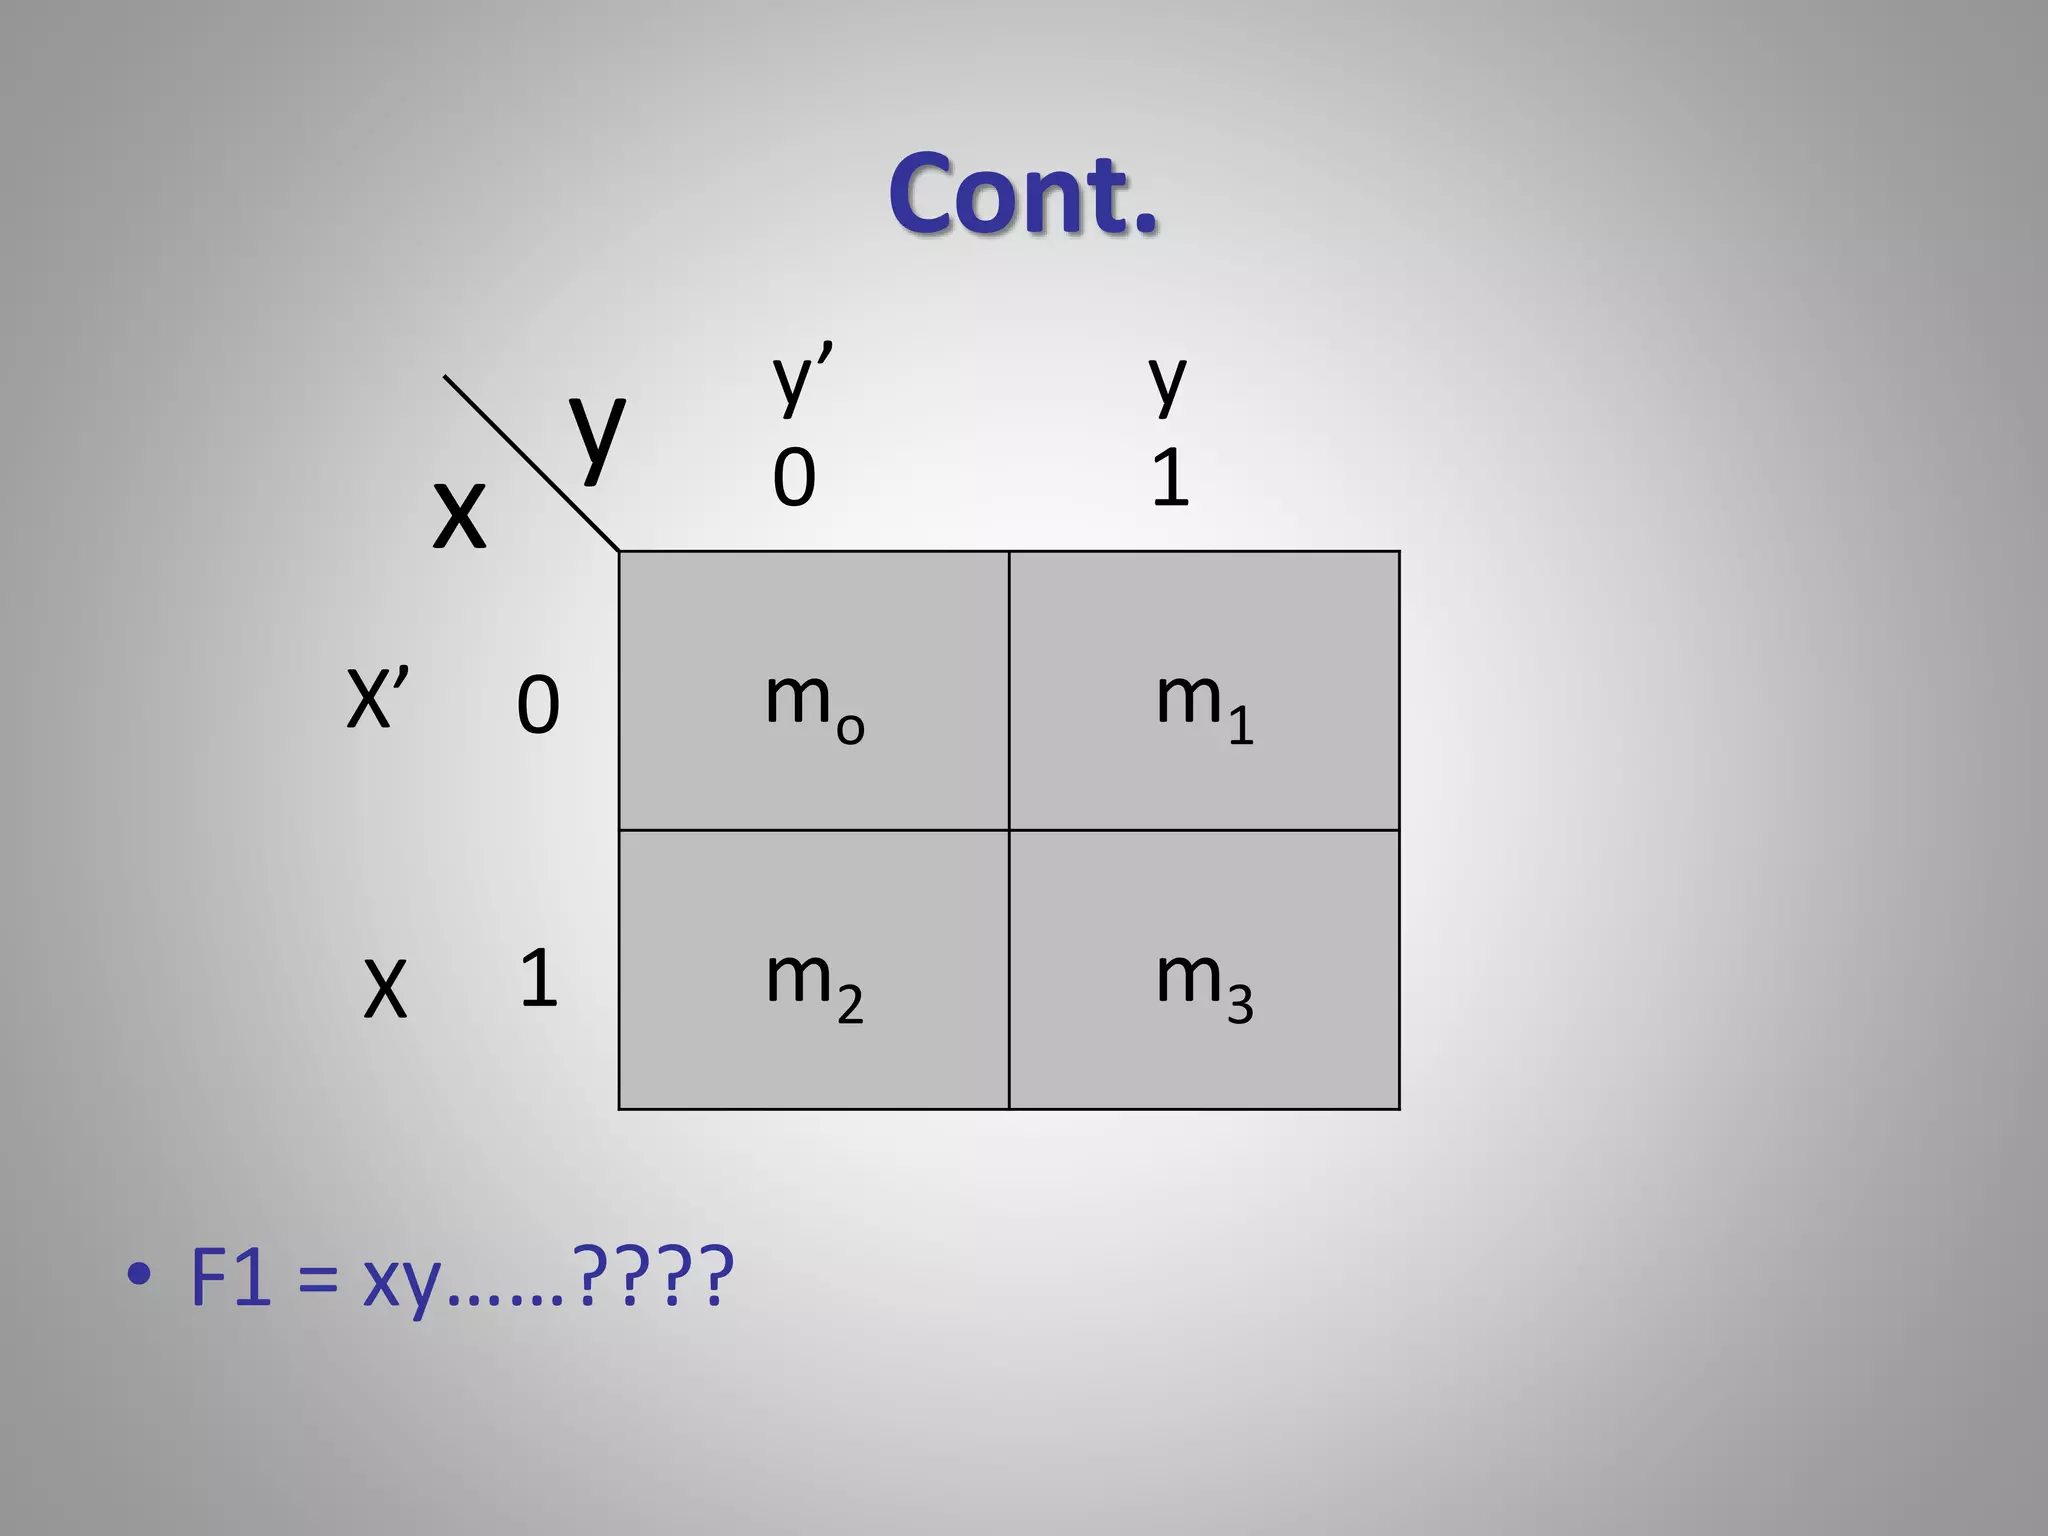
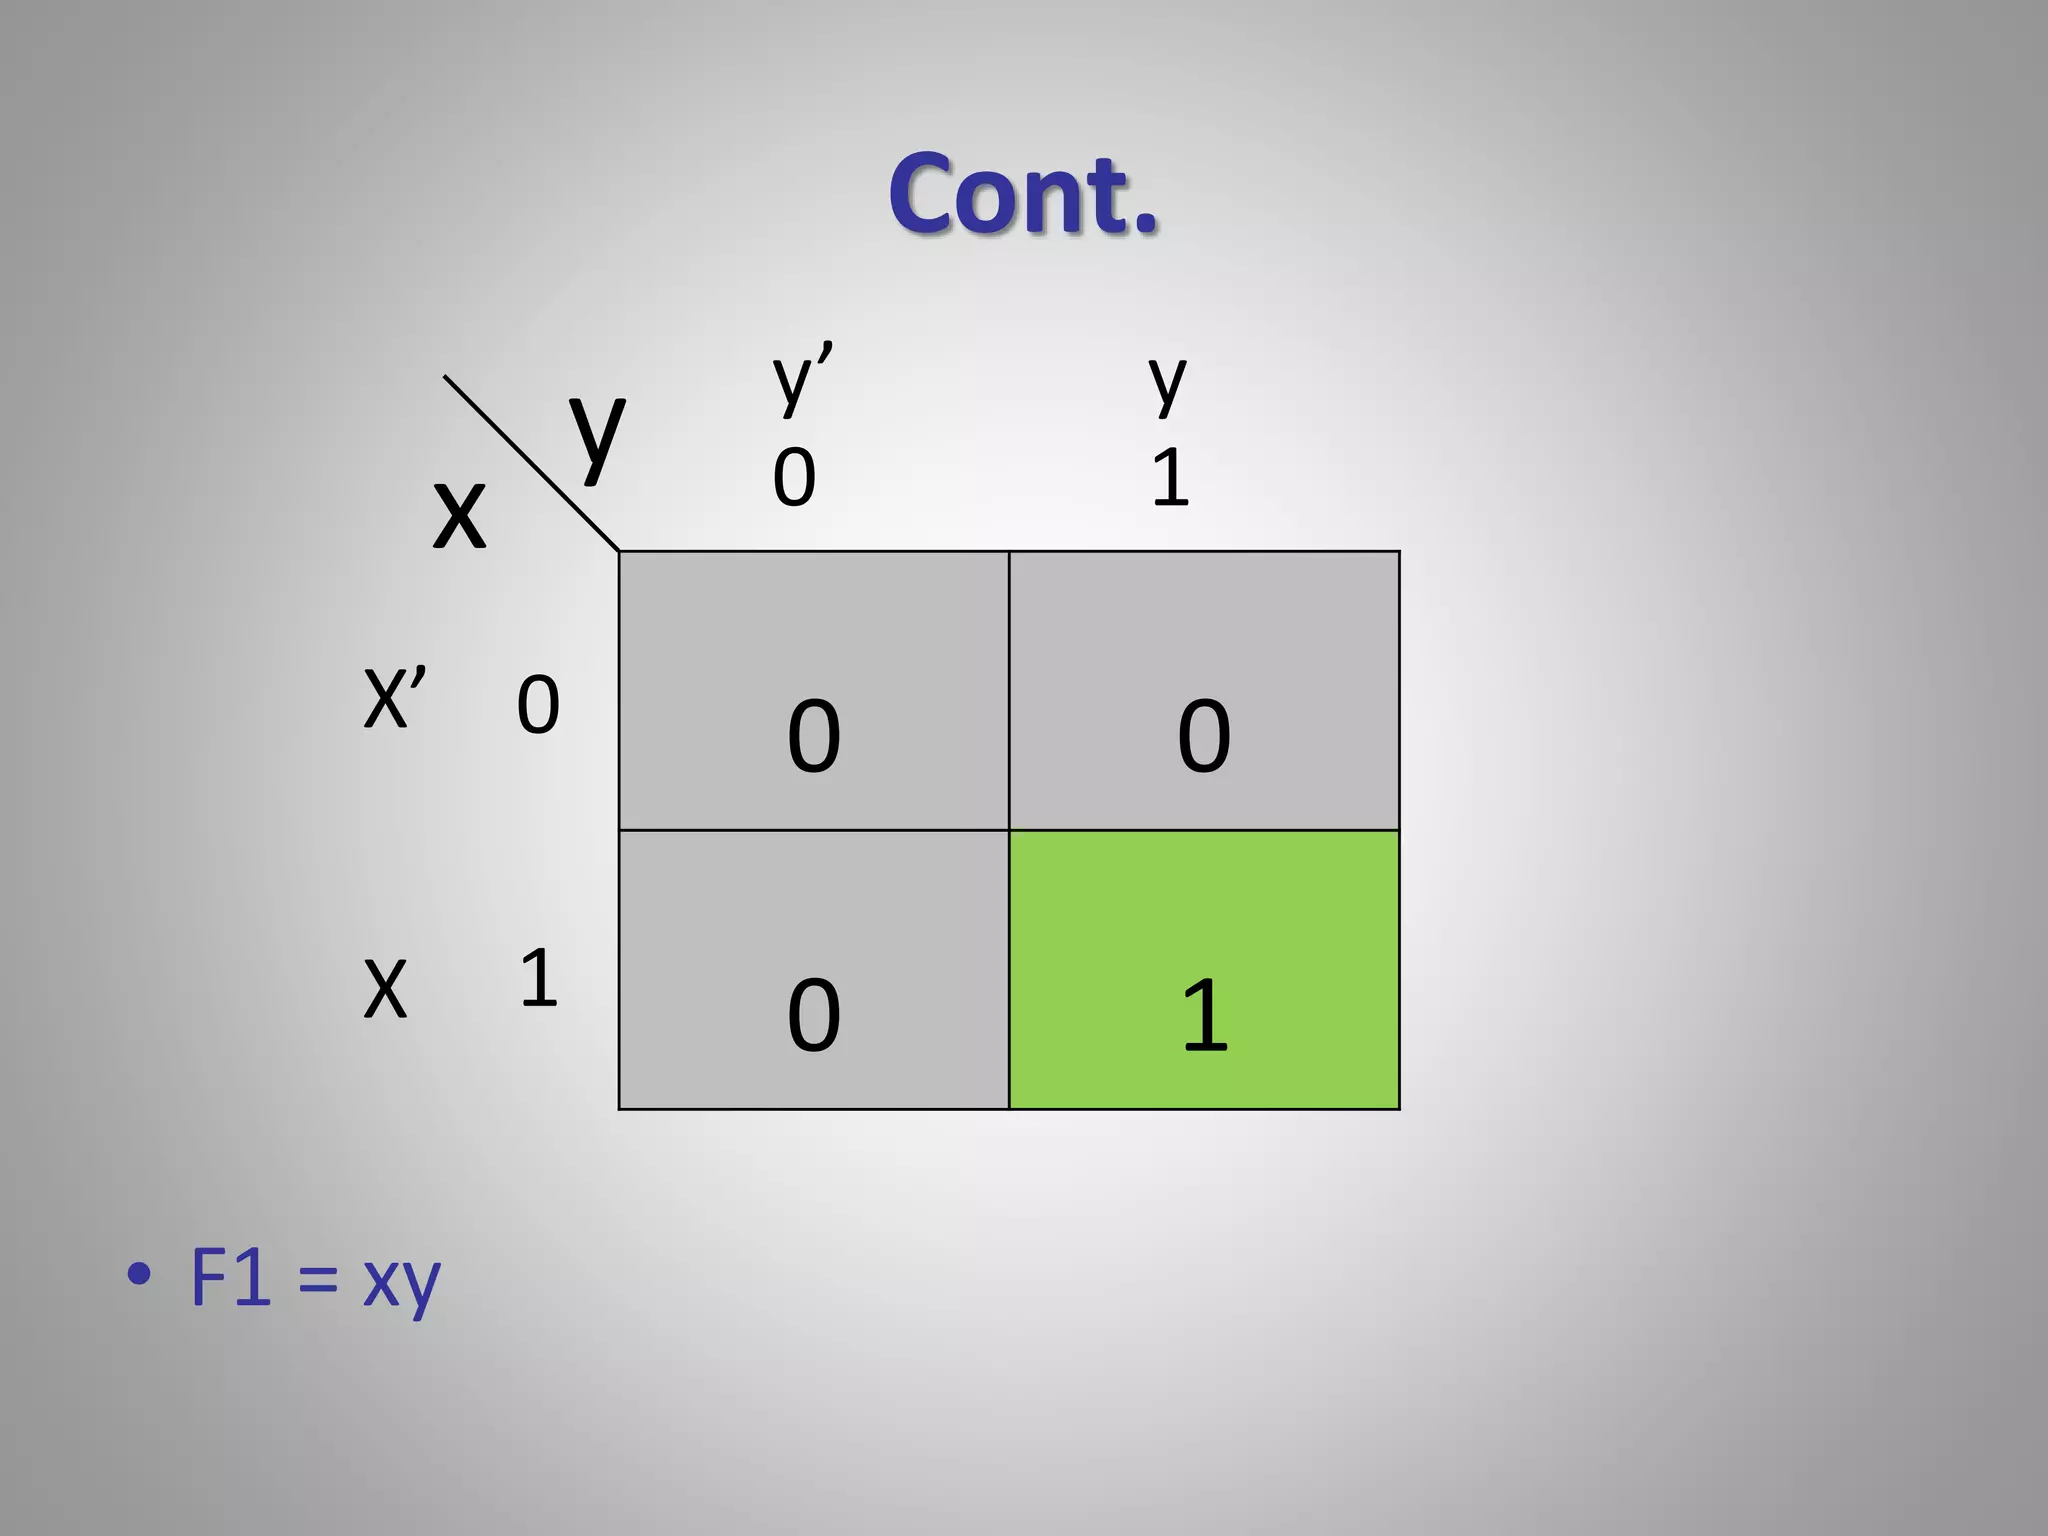
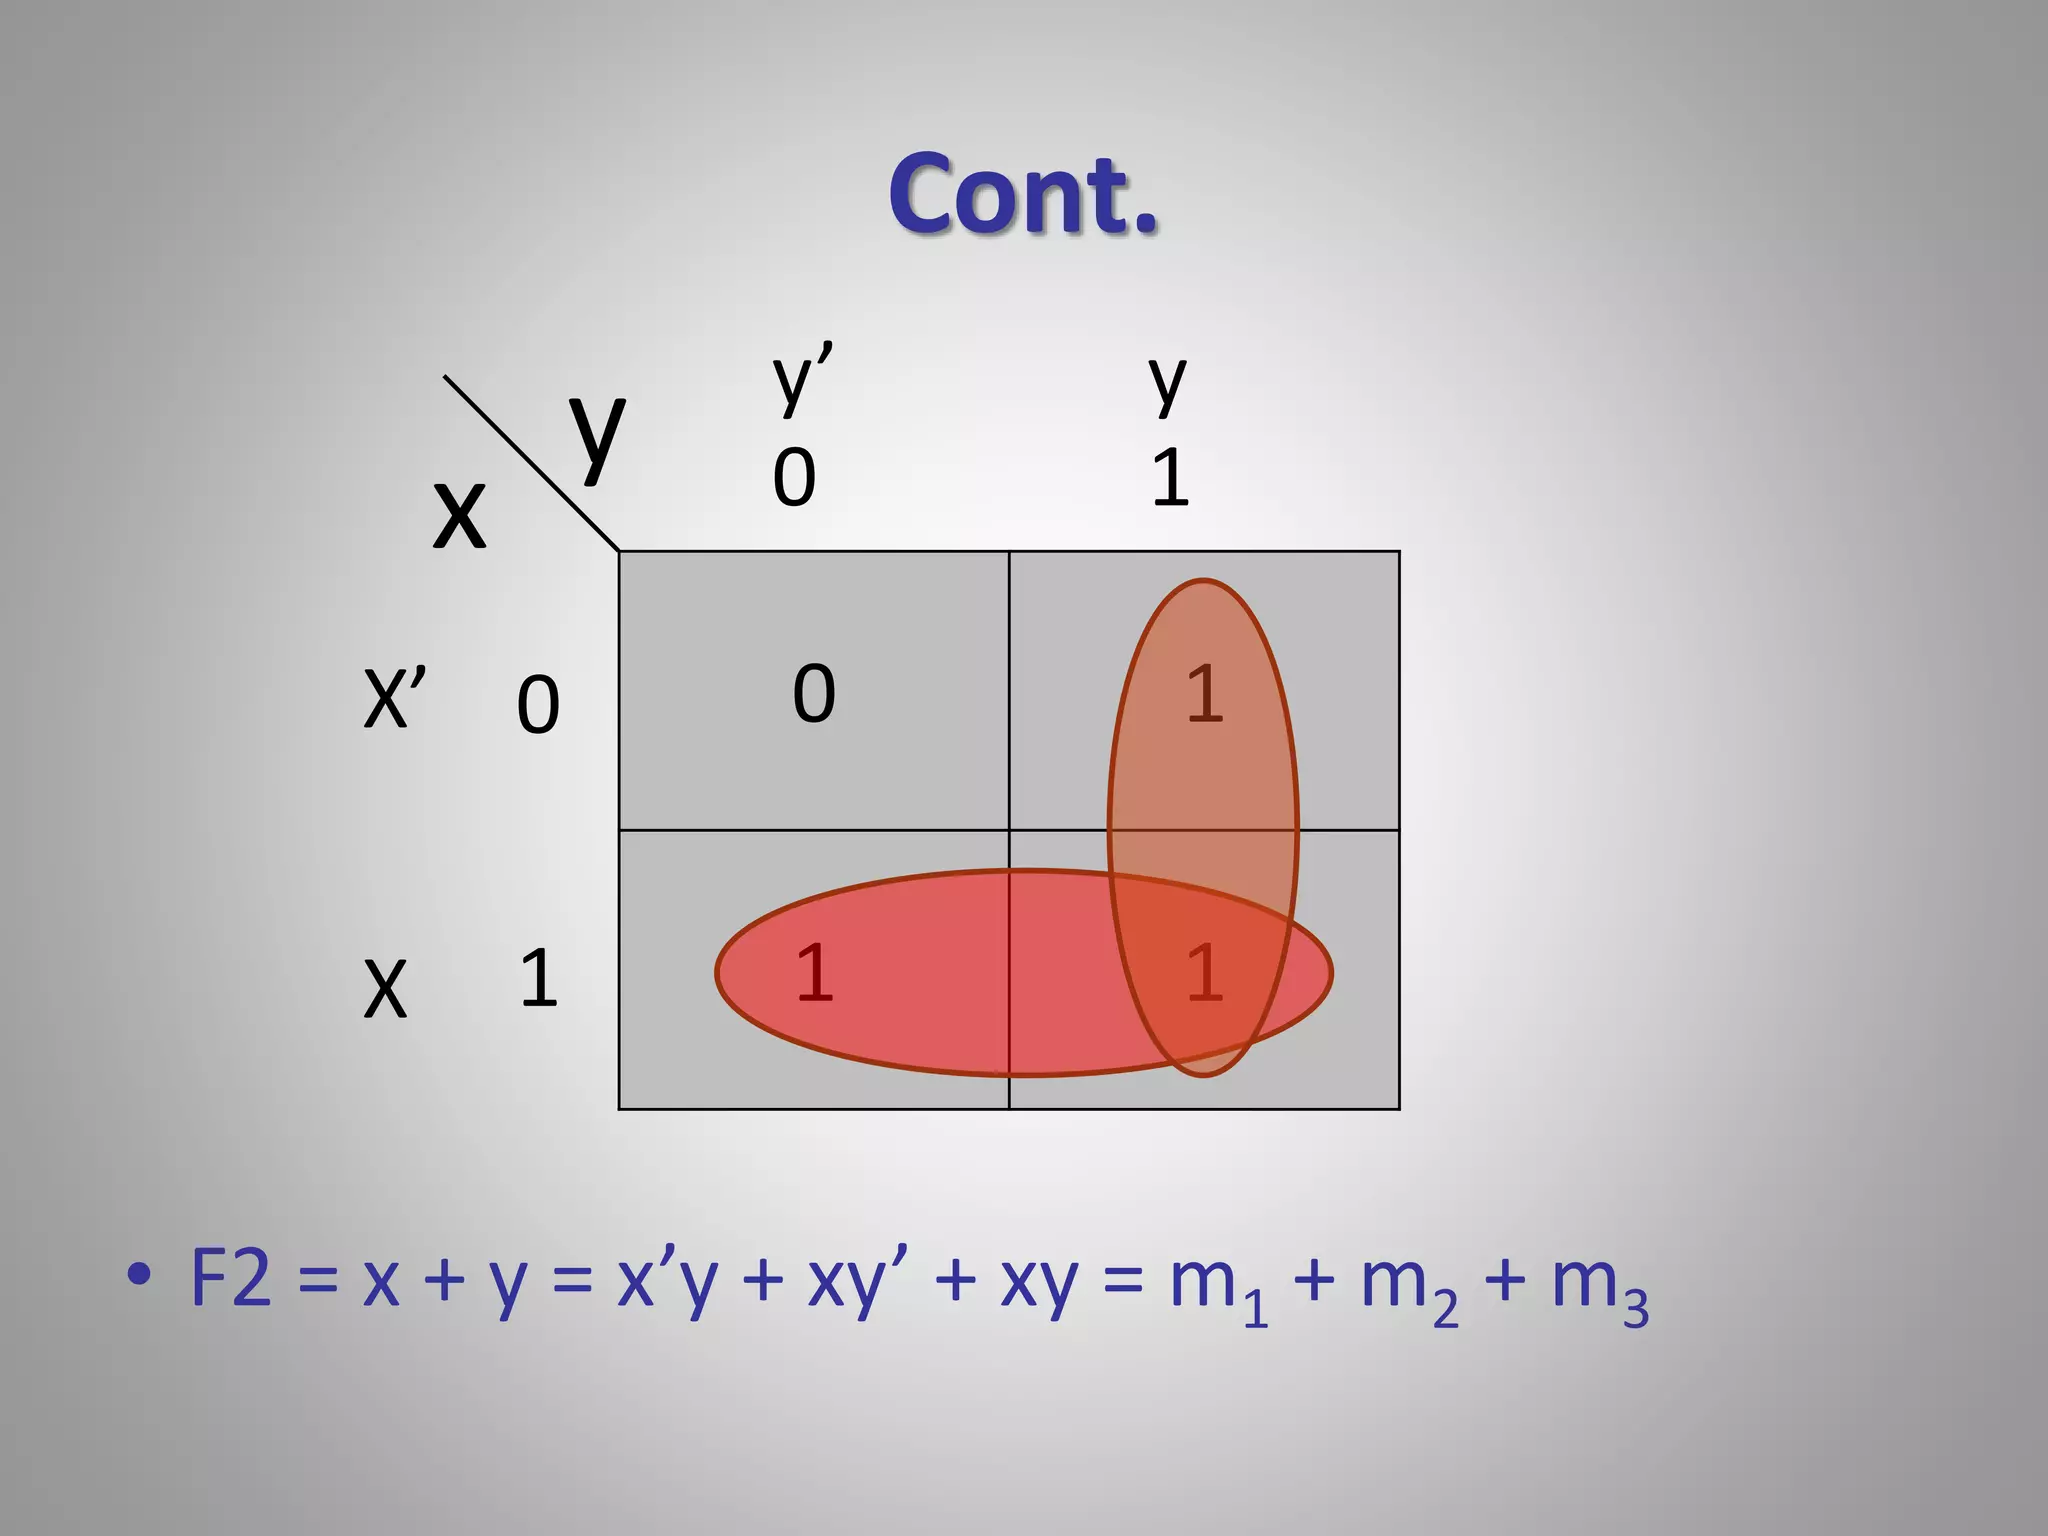
Description and construction of K-maps for two variables, including placing 0's and 1's, and solving sample Boolean functions.
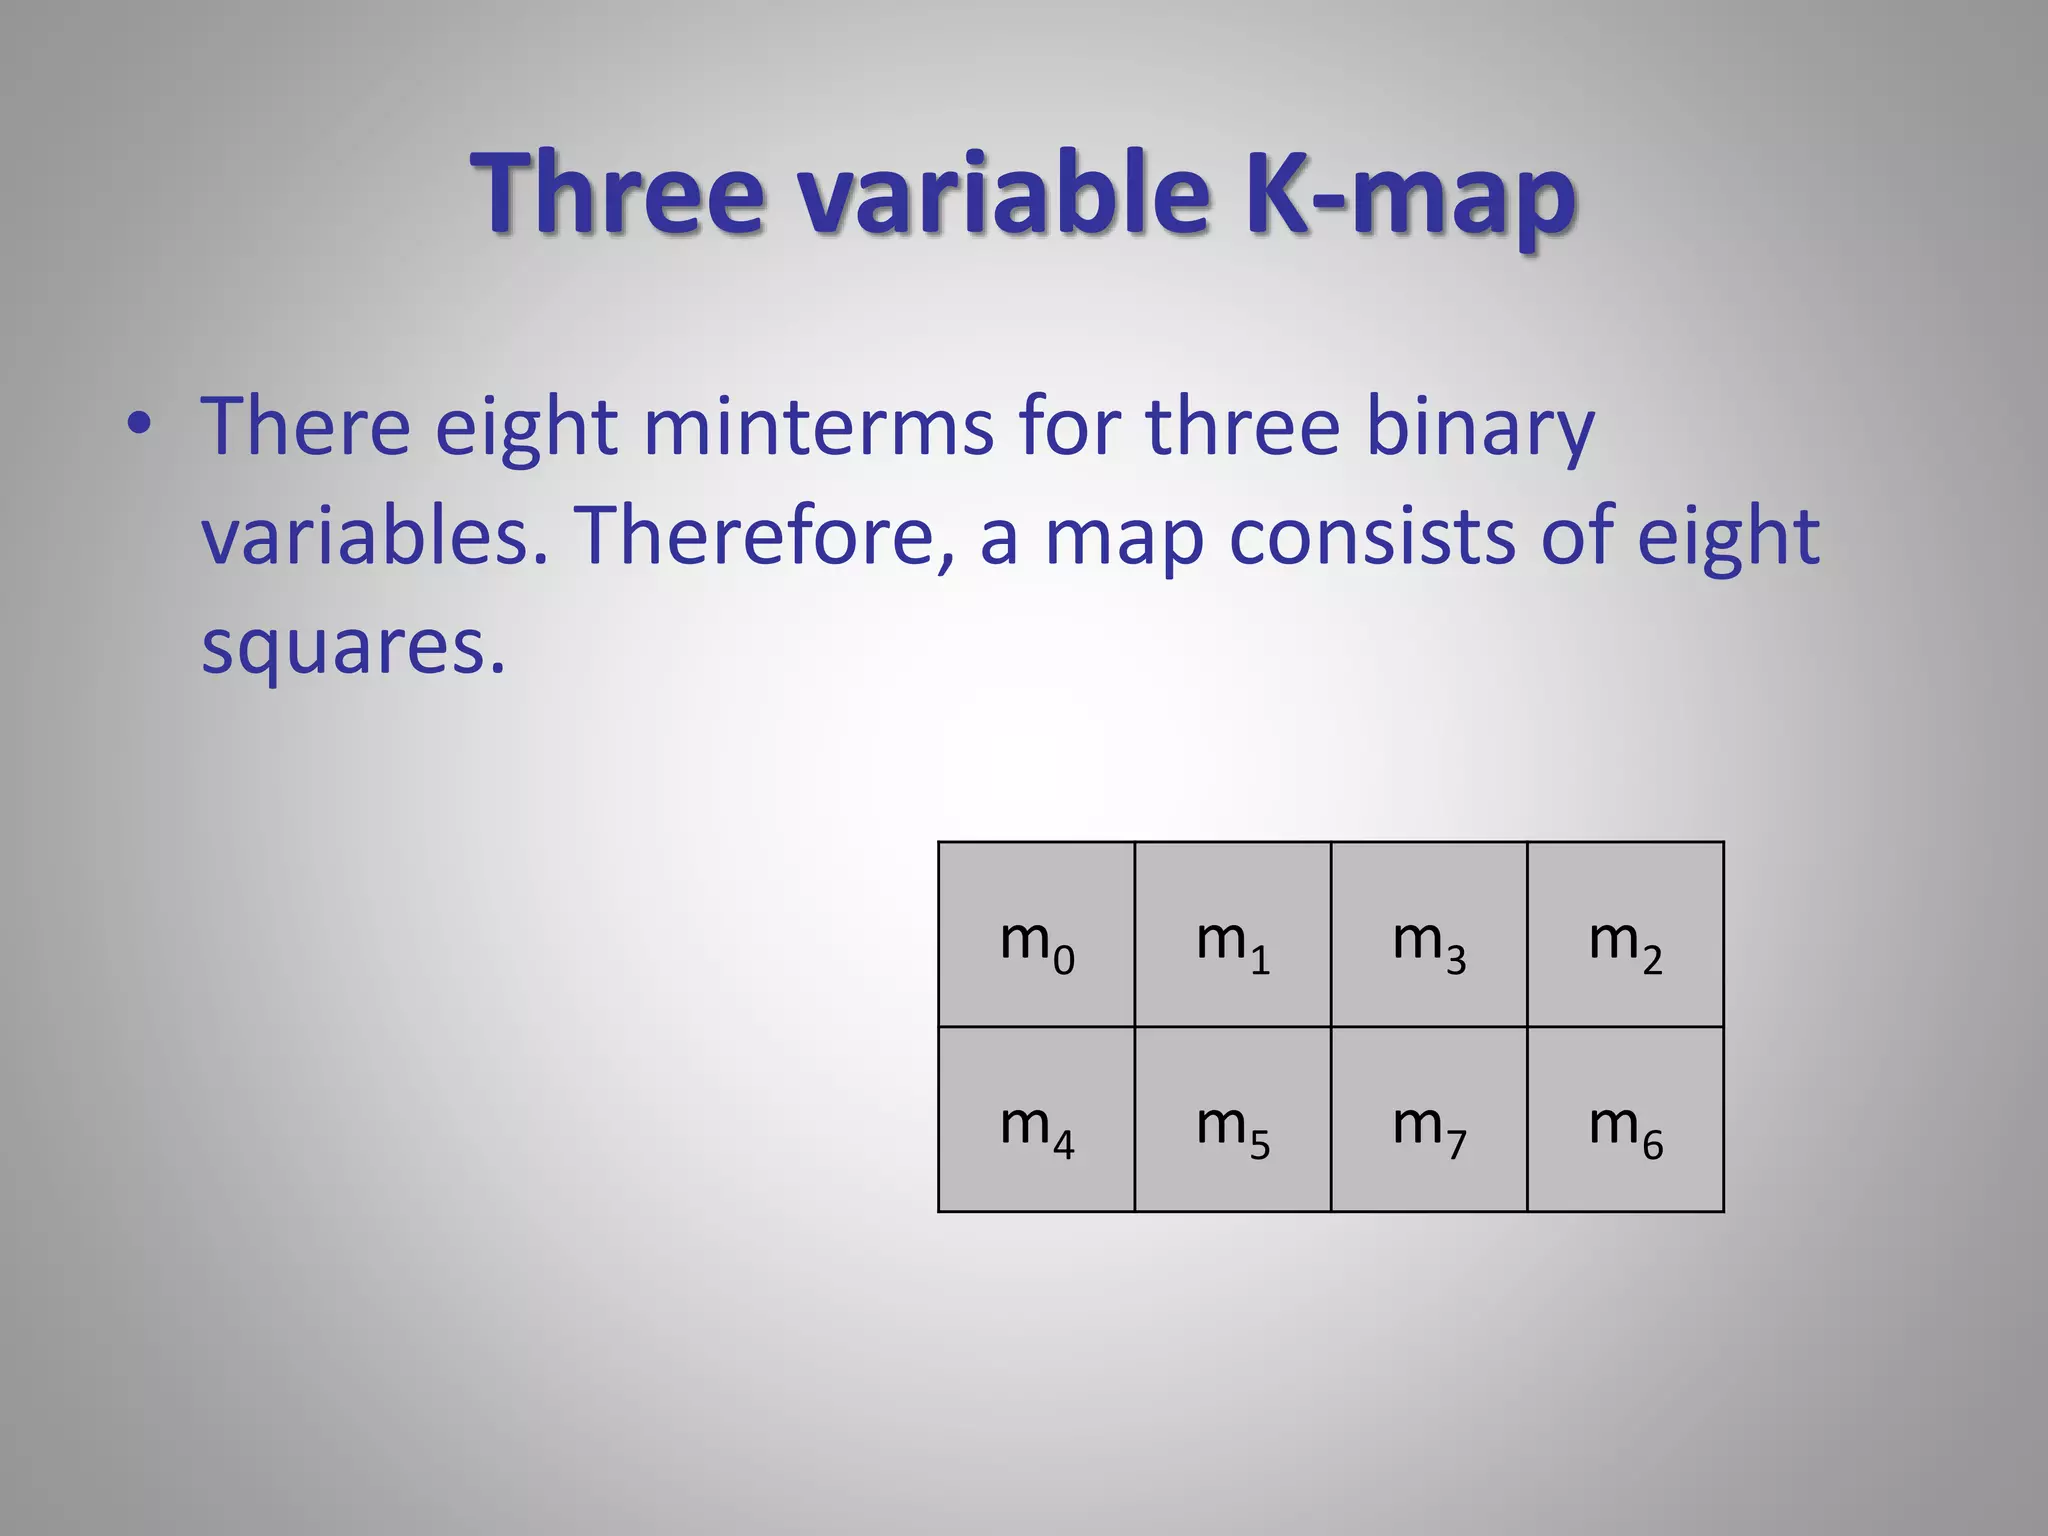
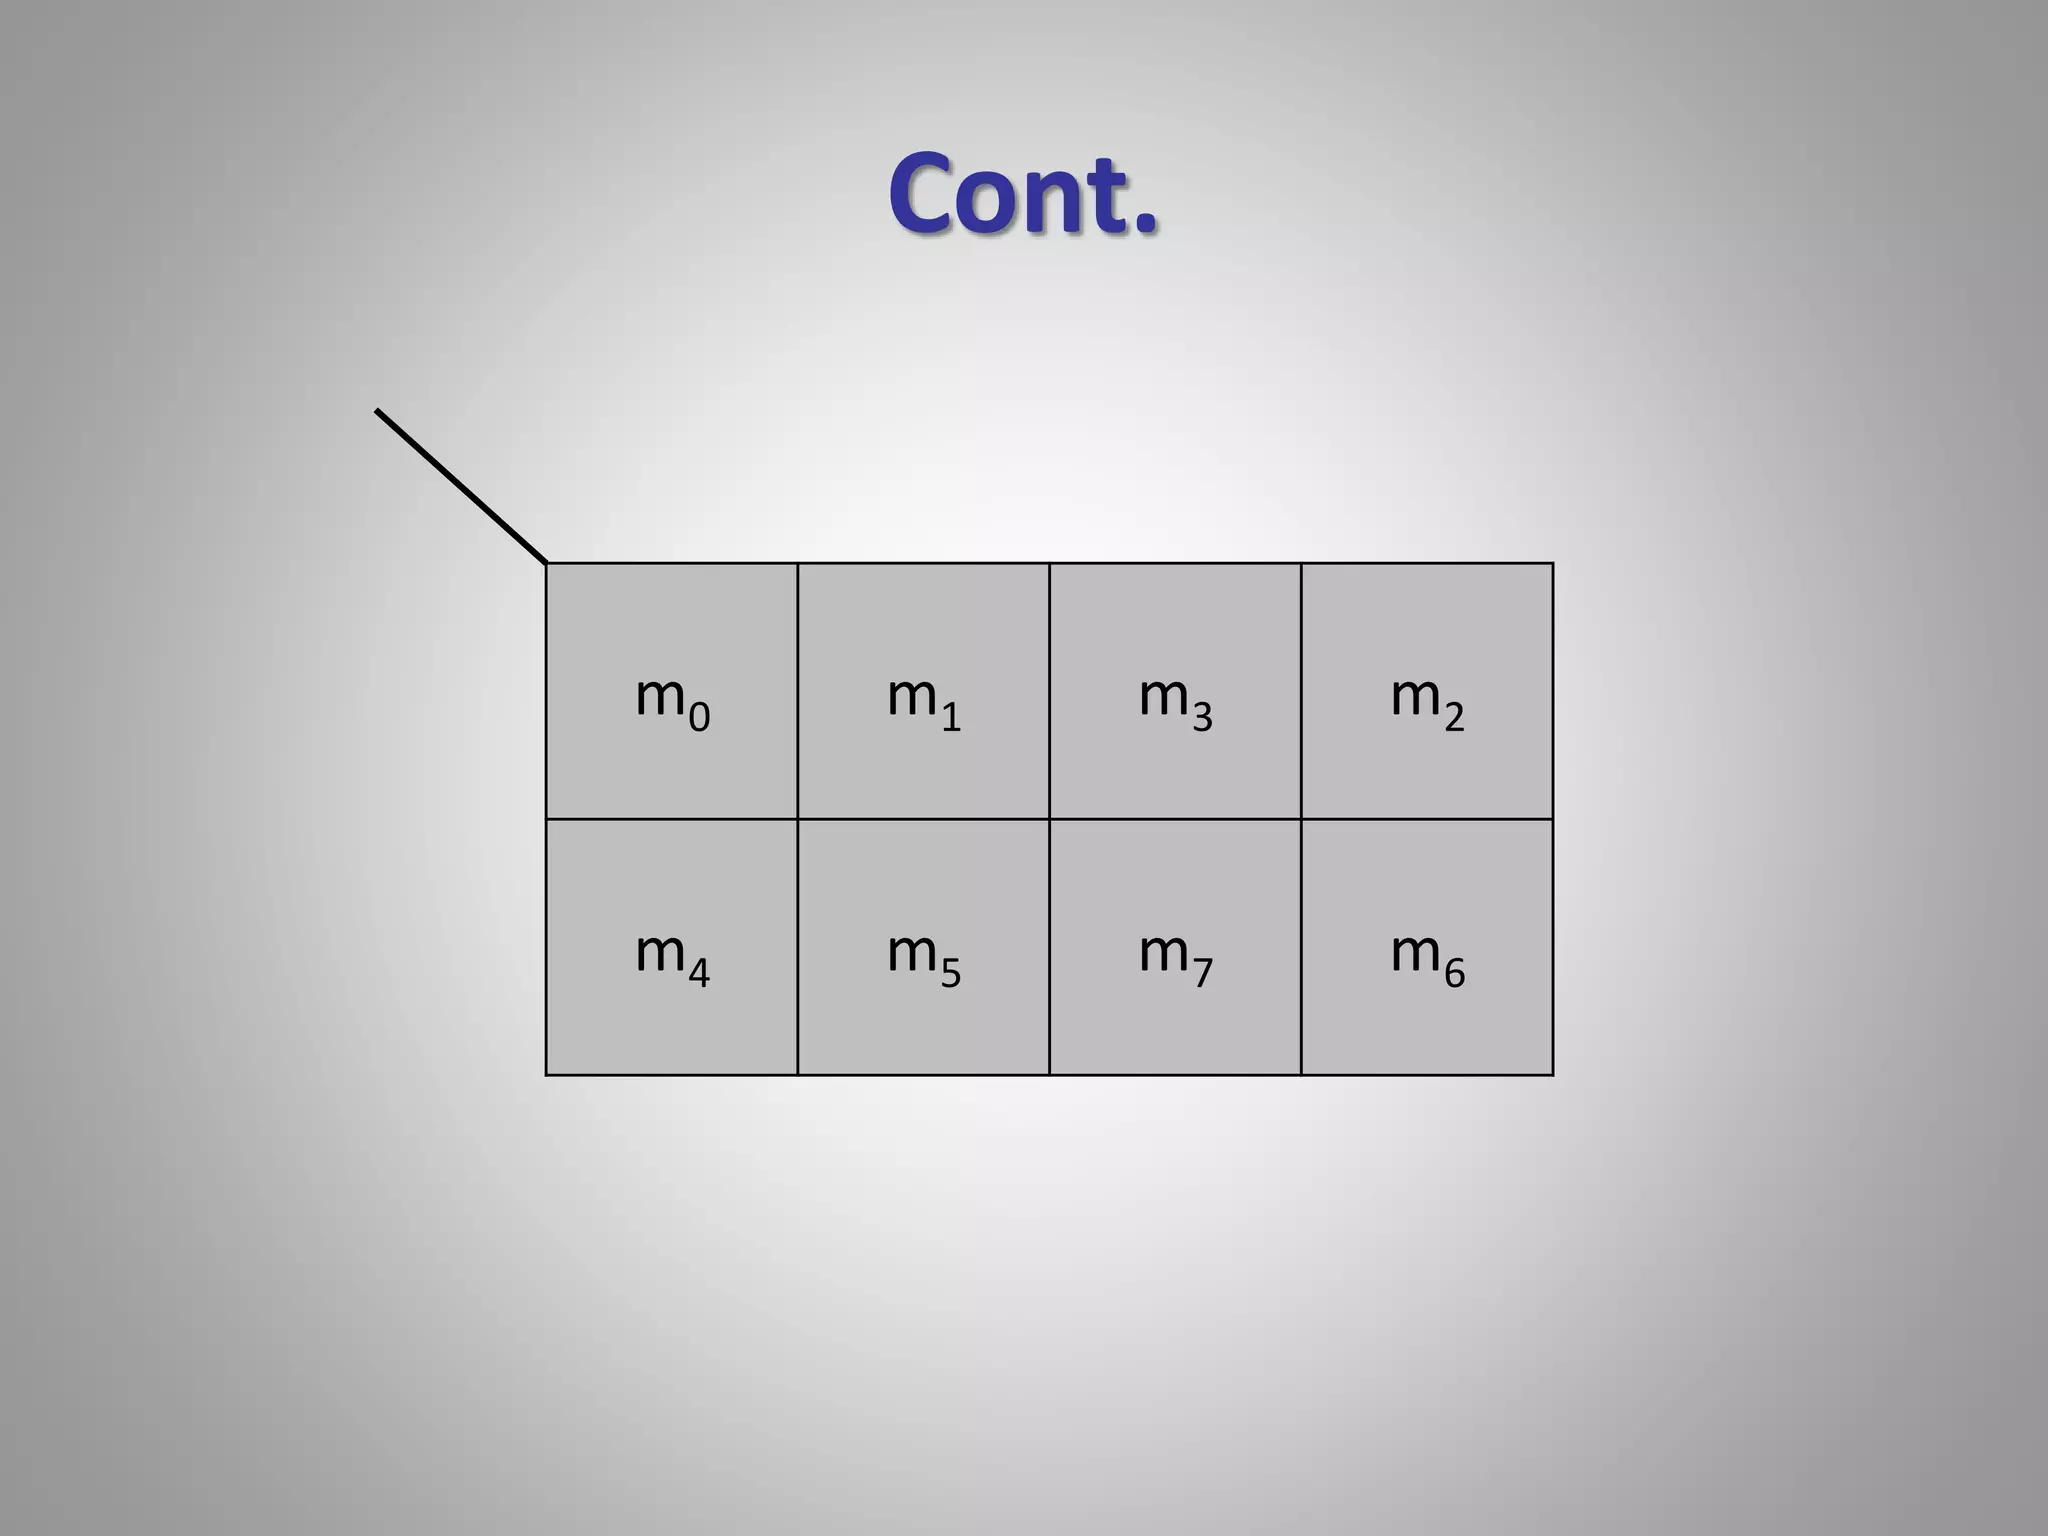
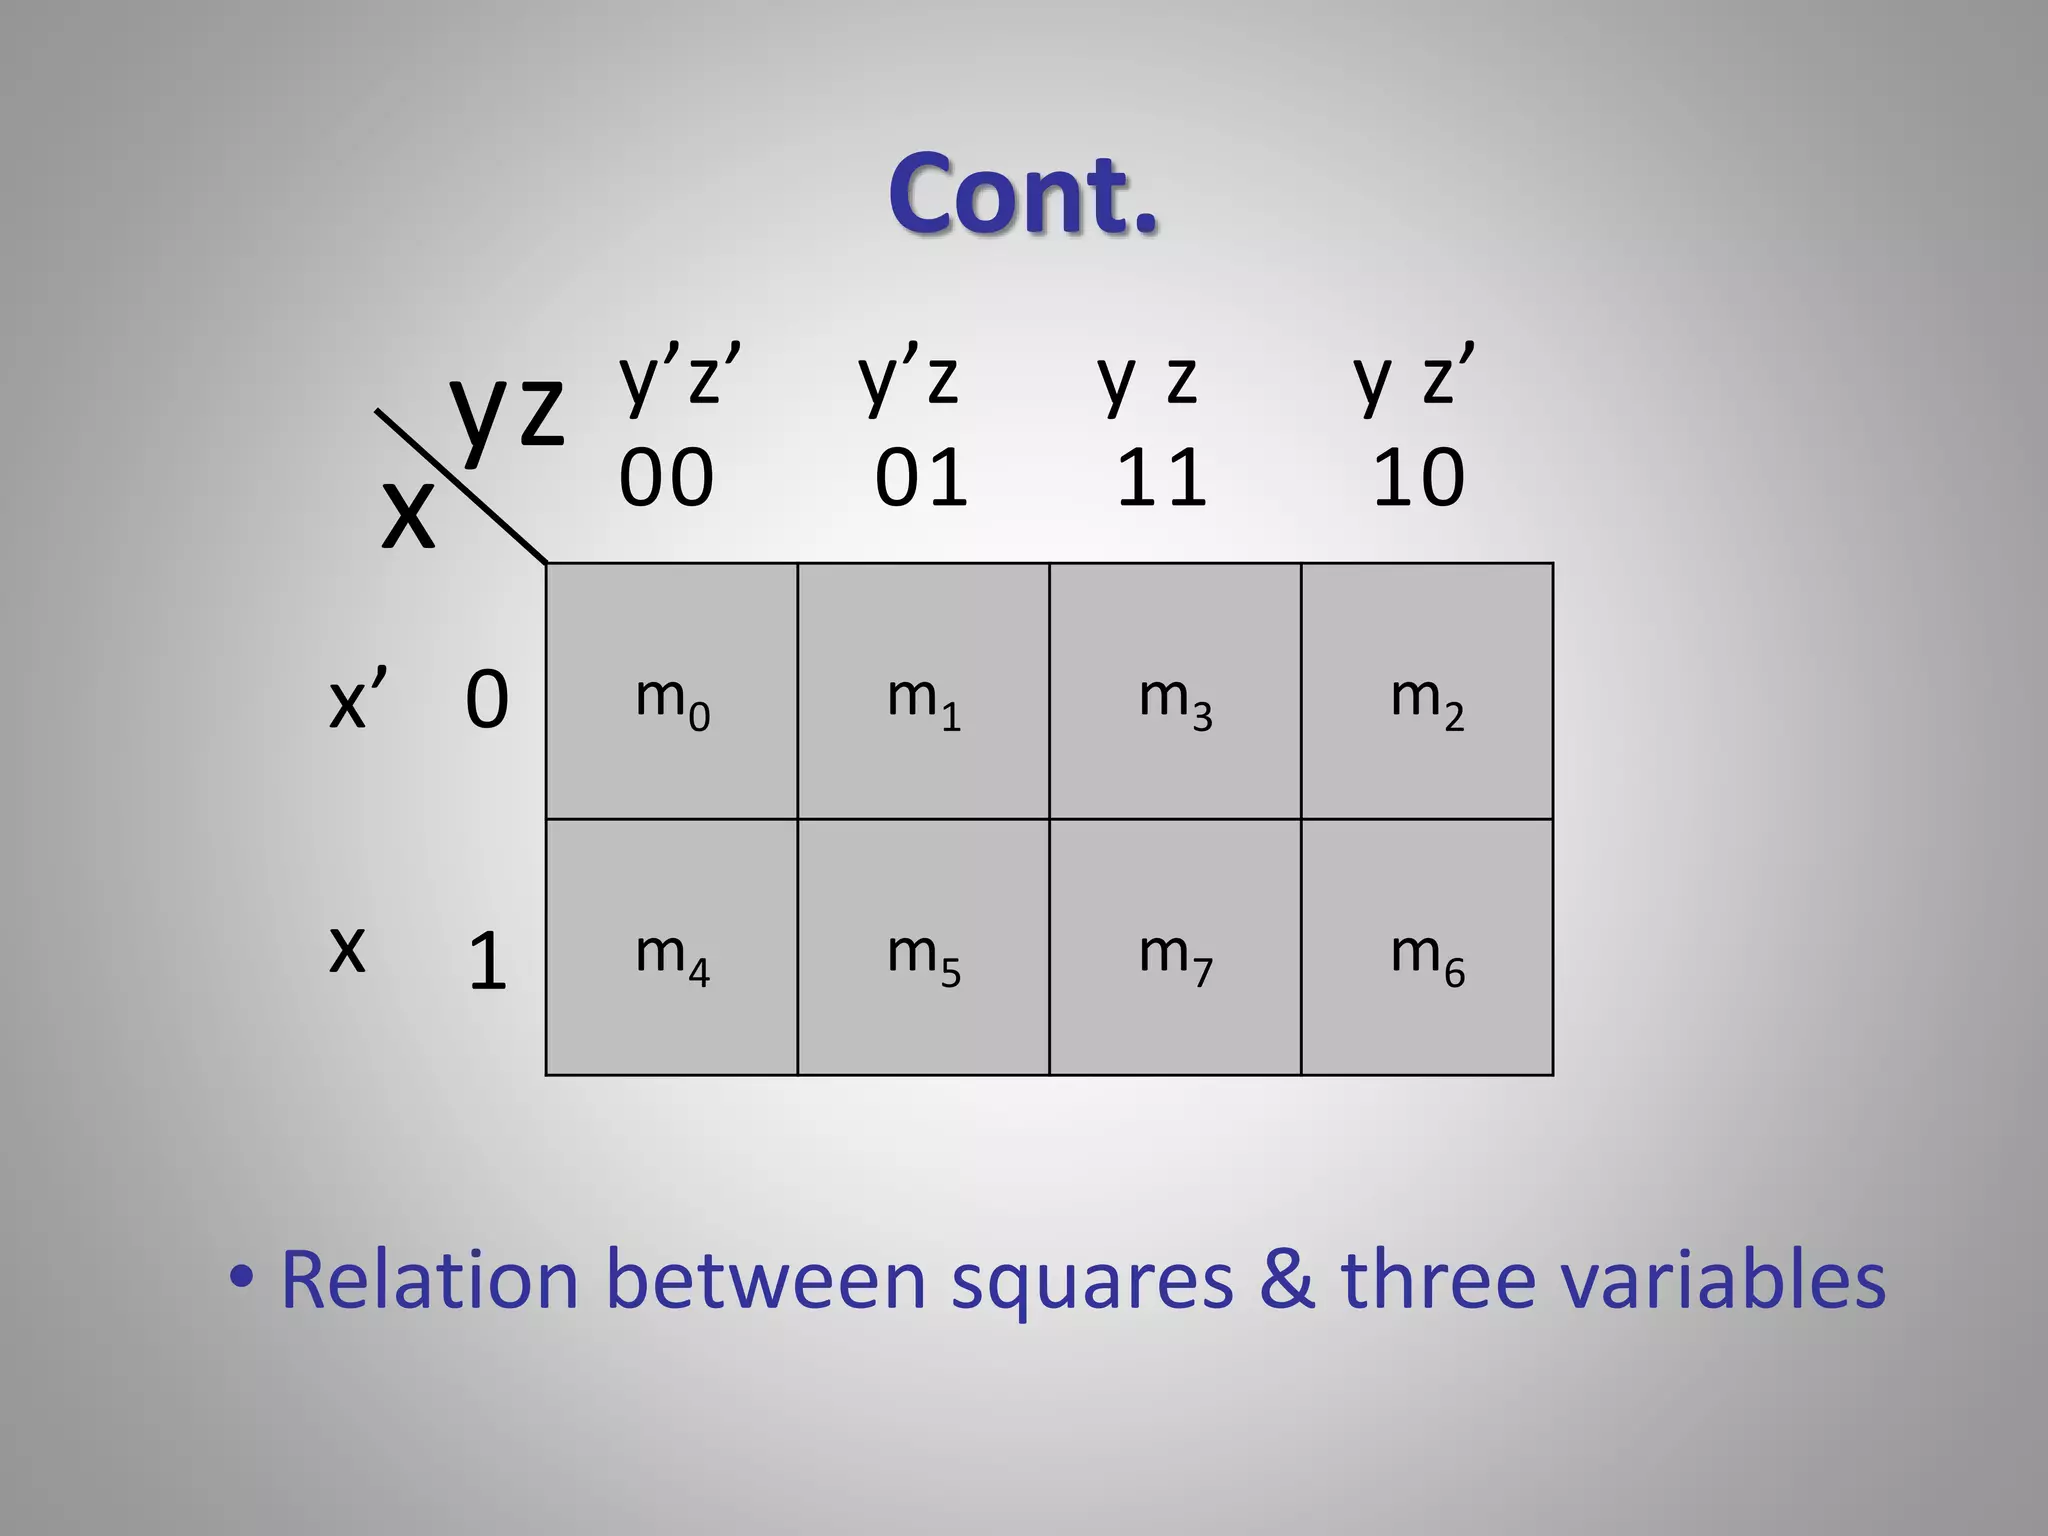
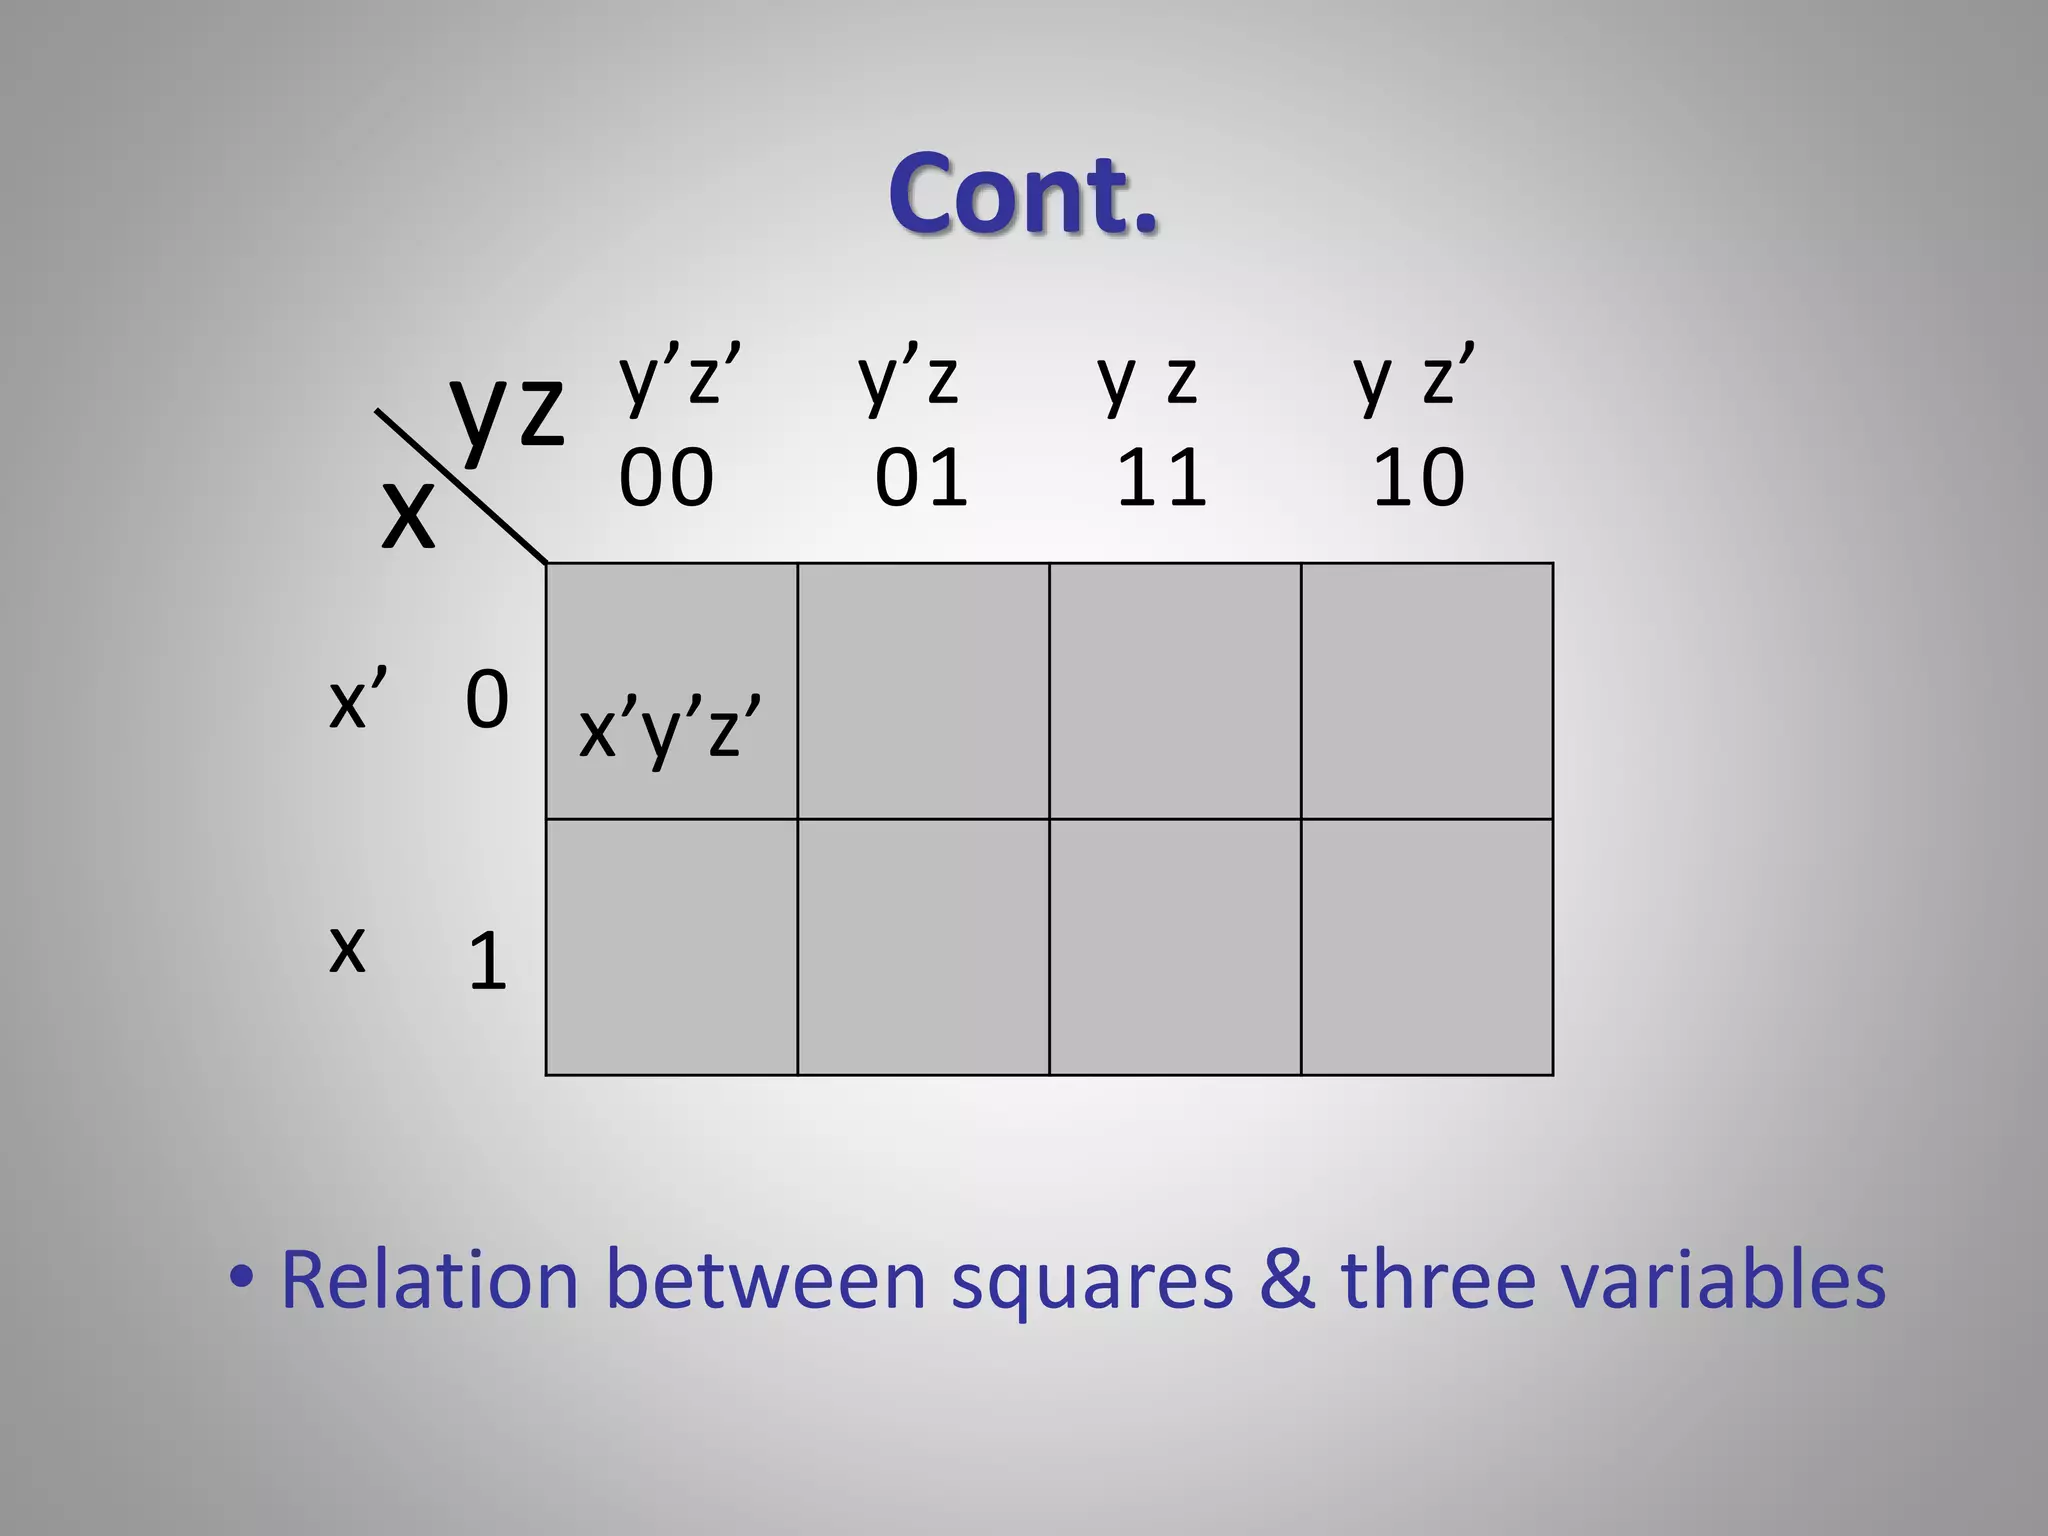
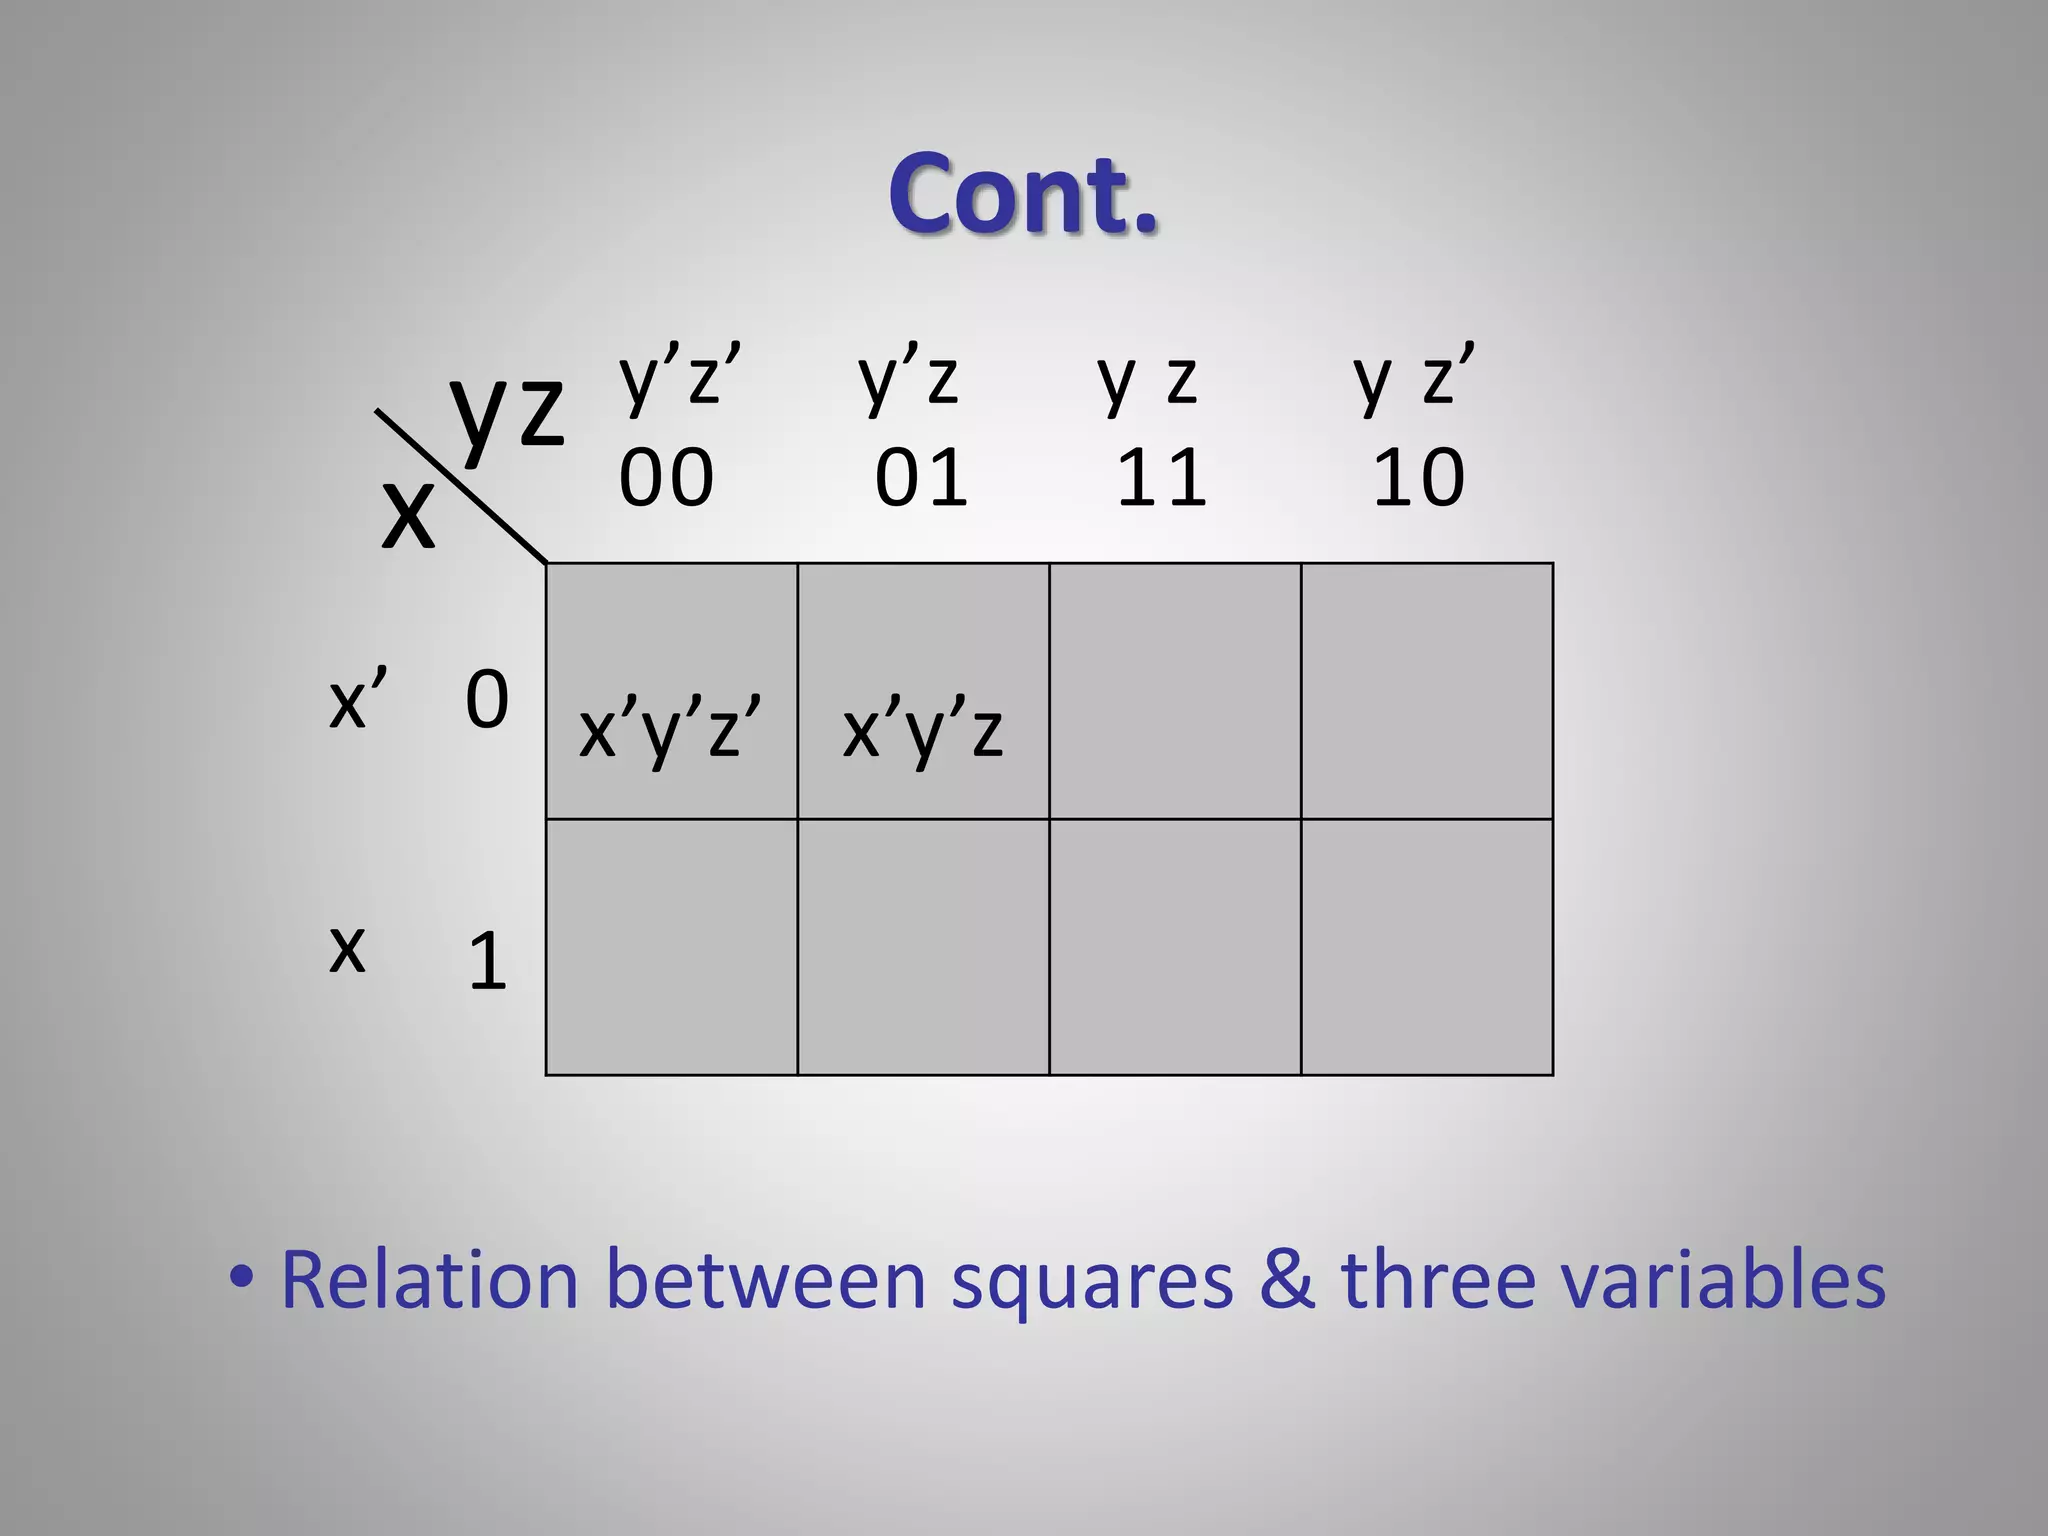
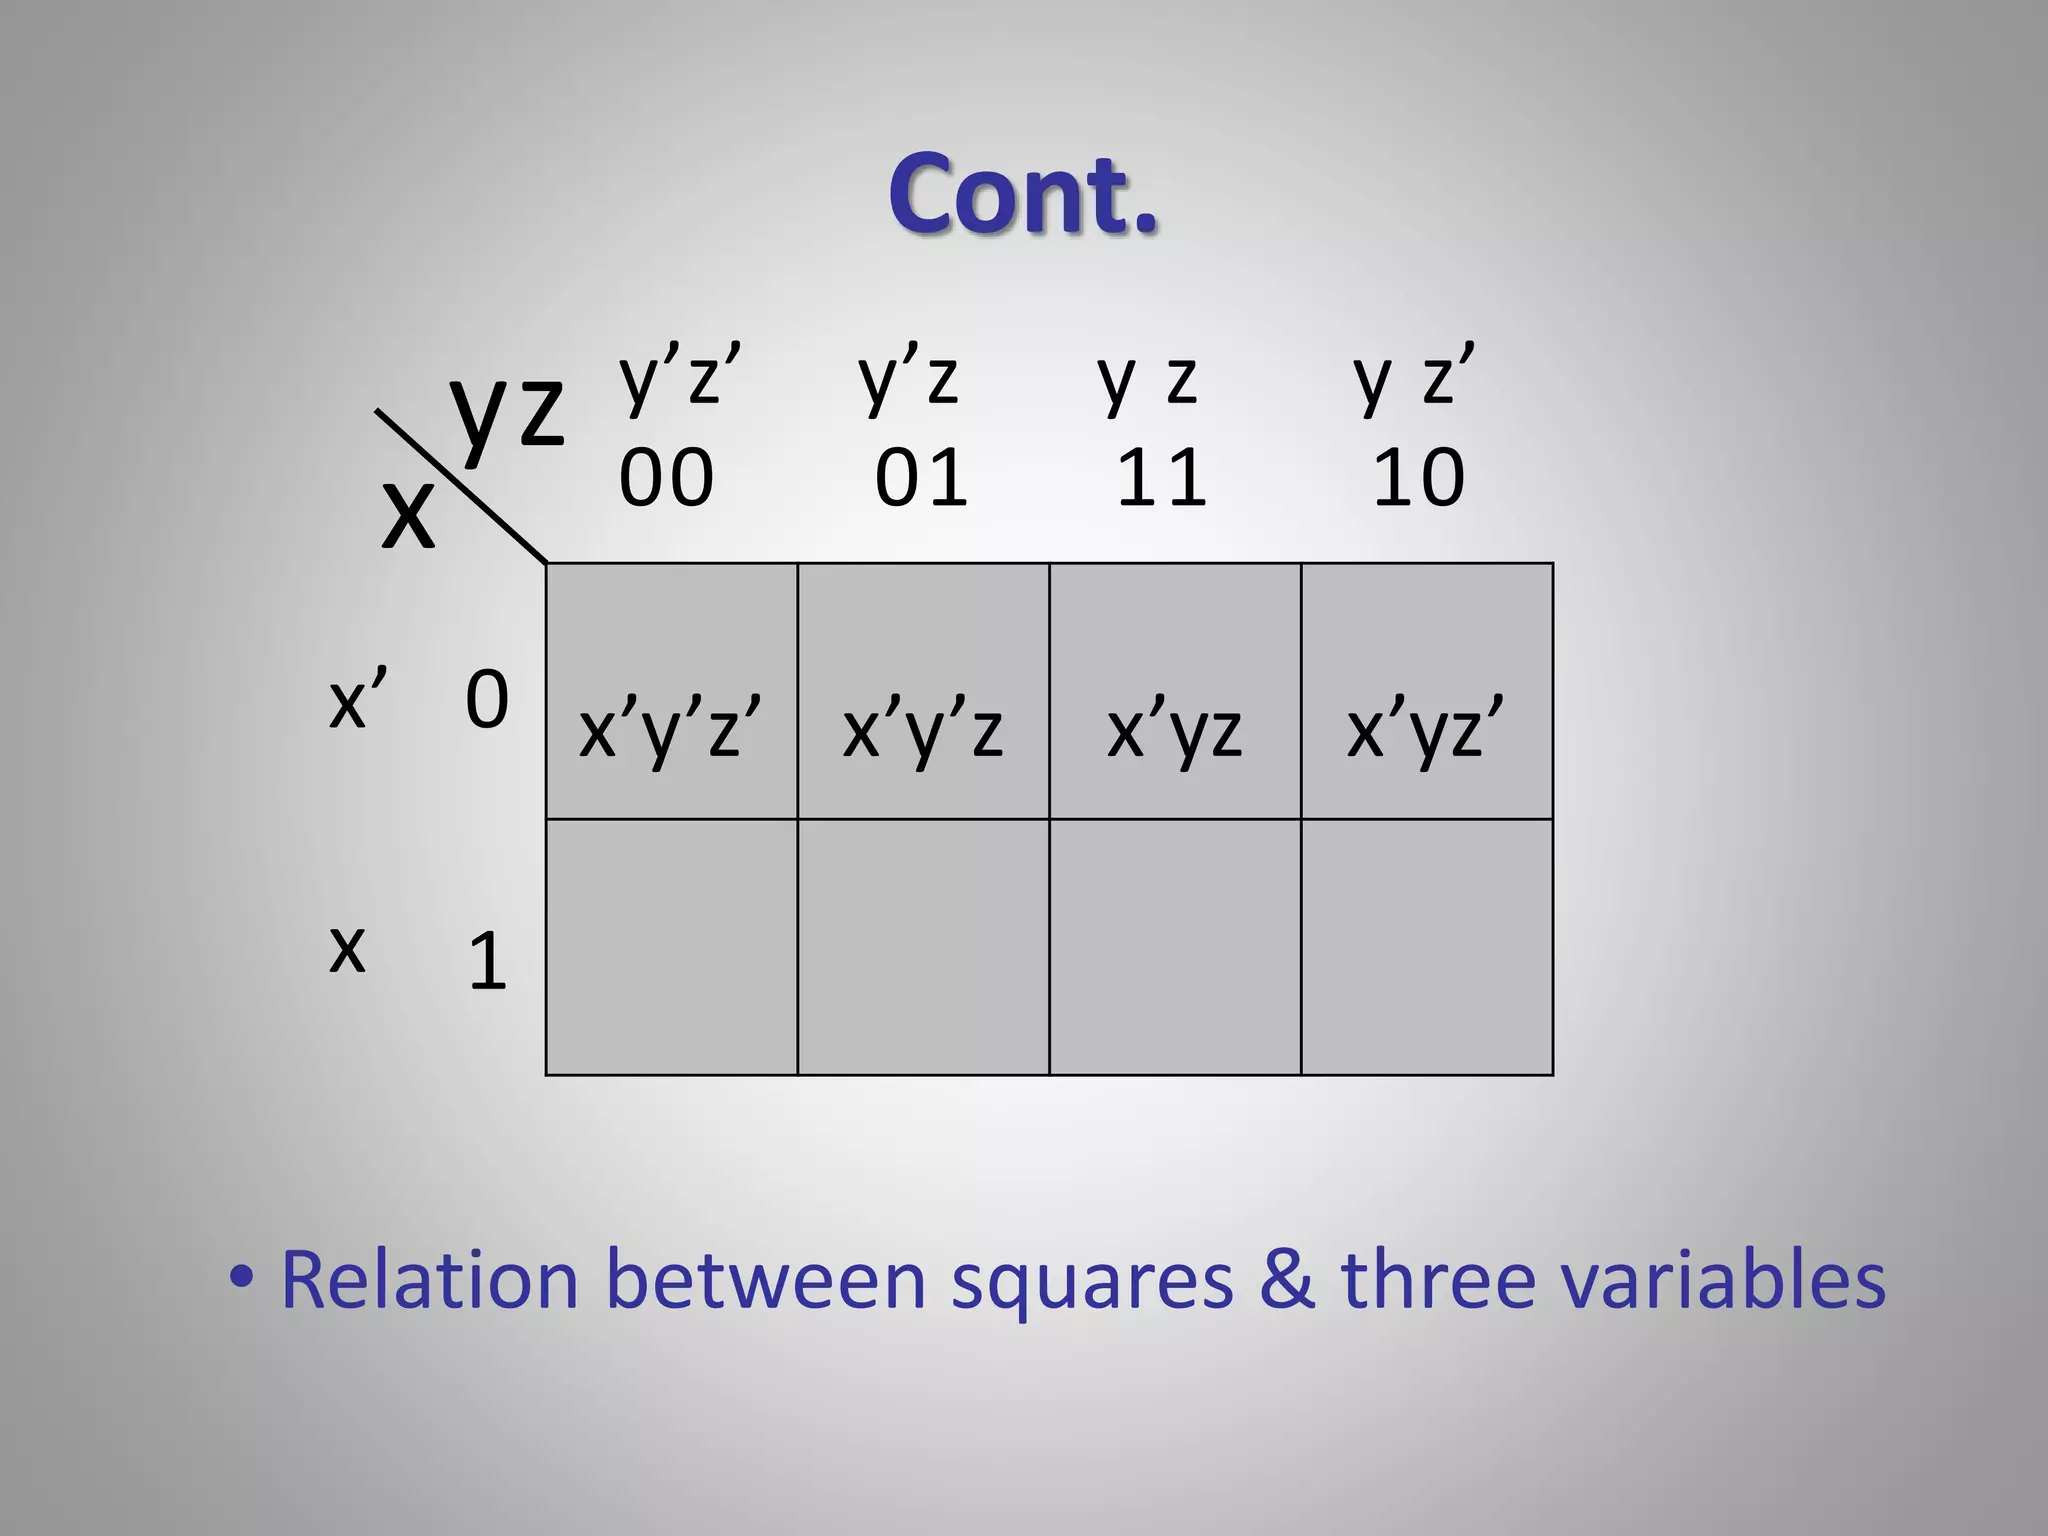
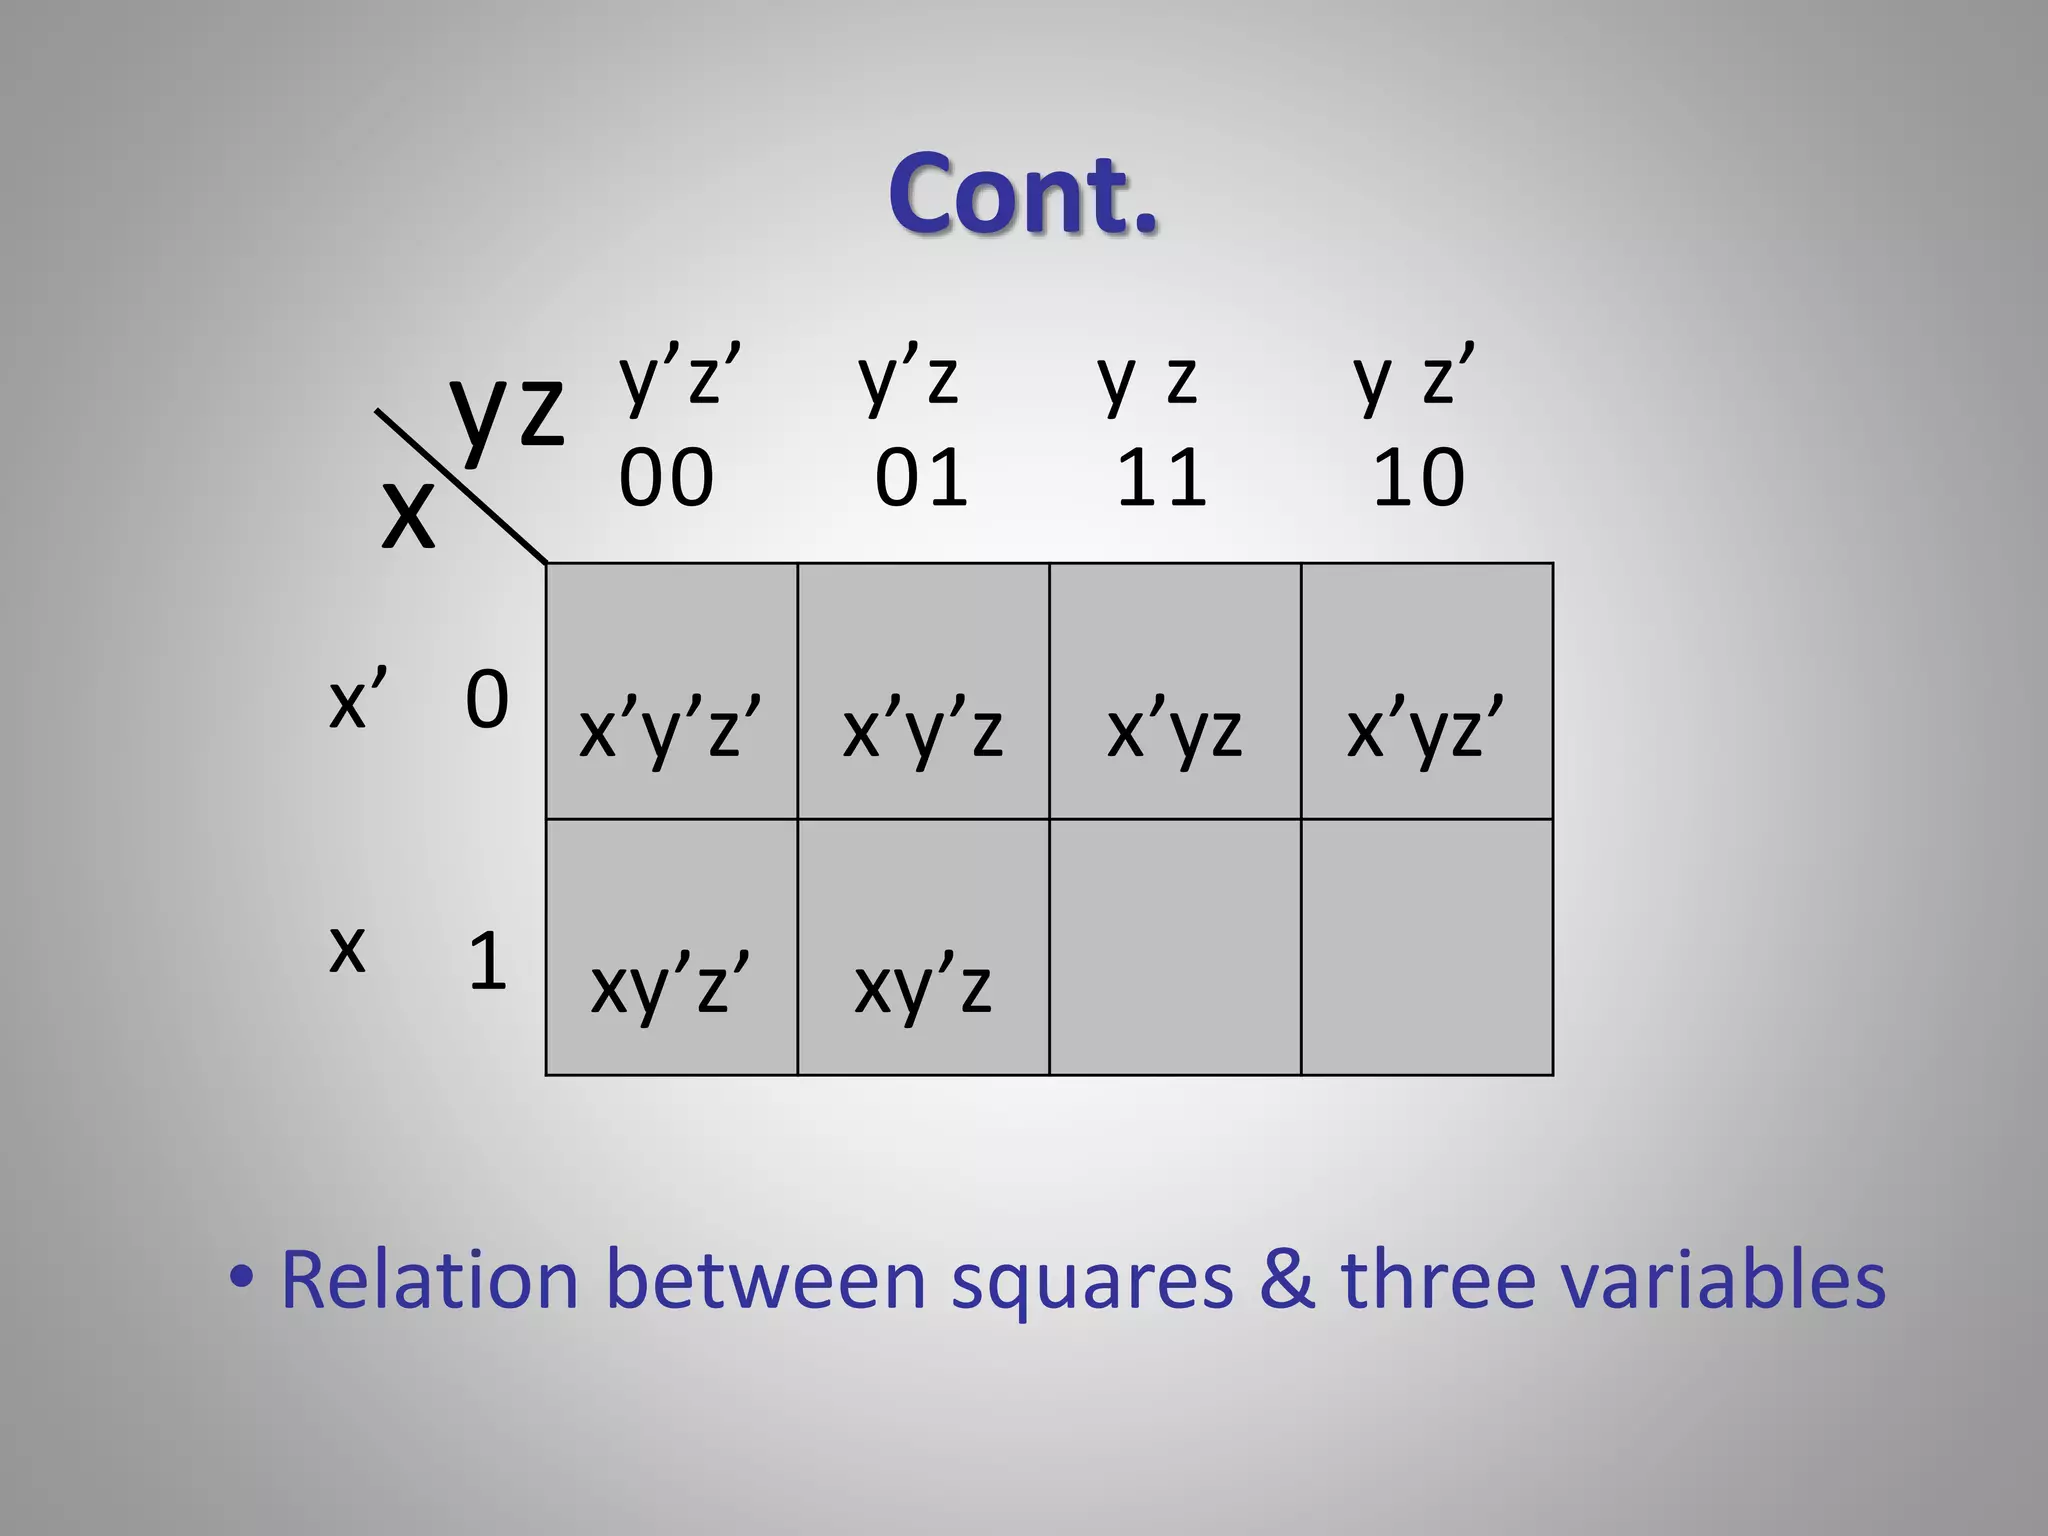
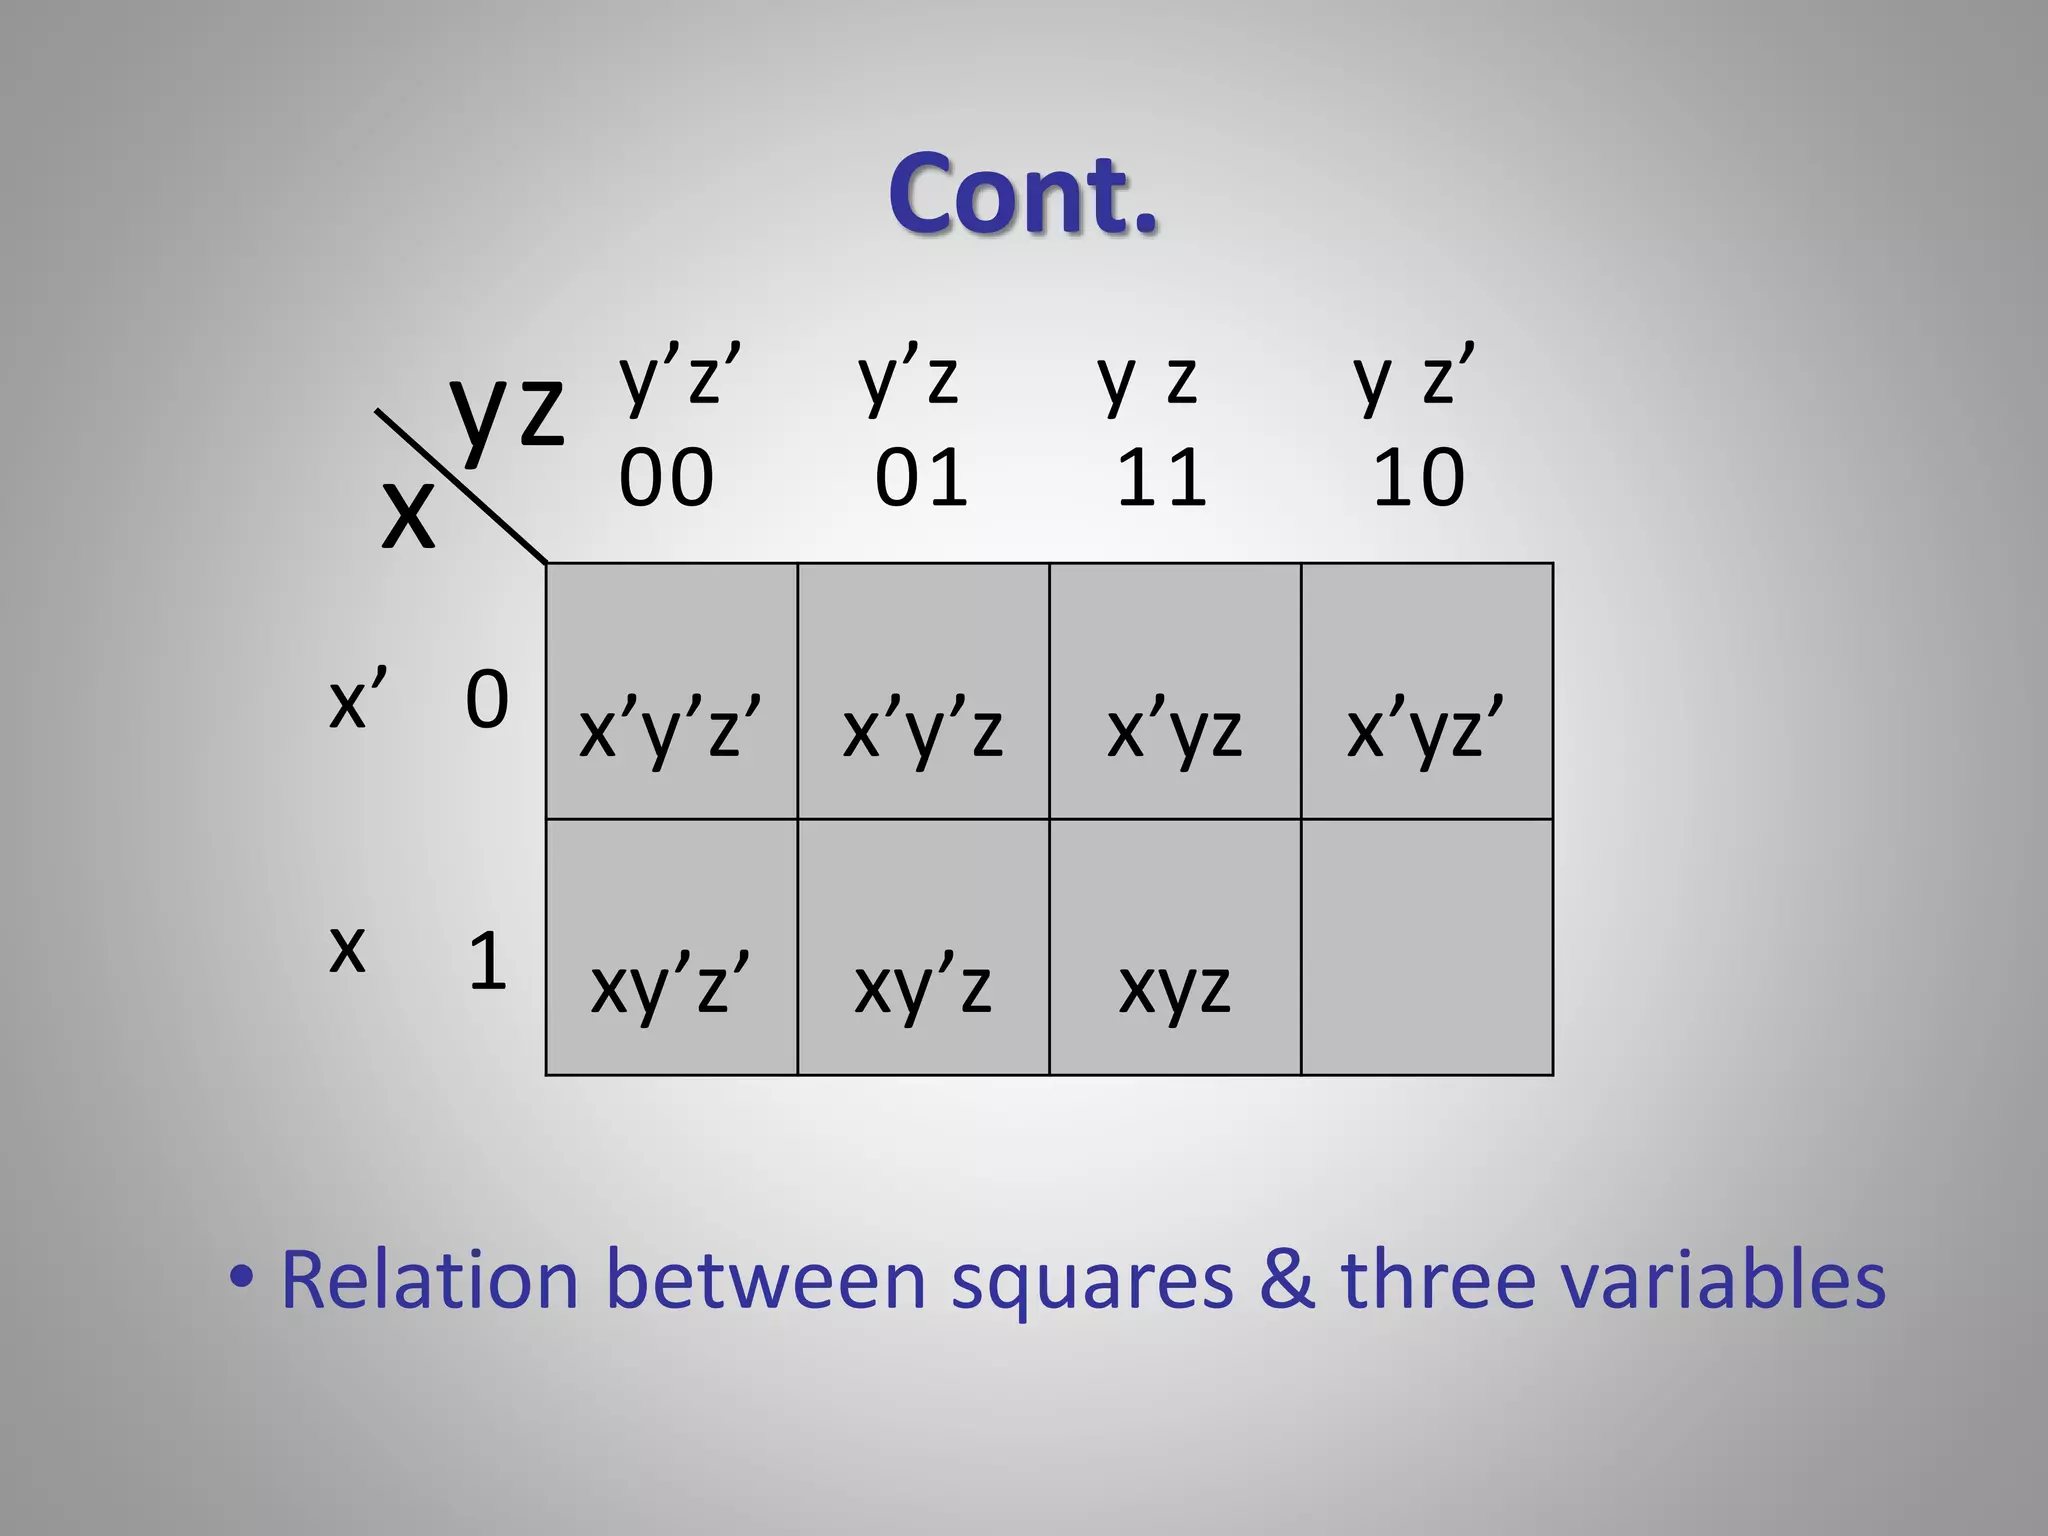
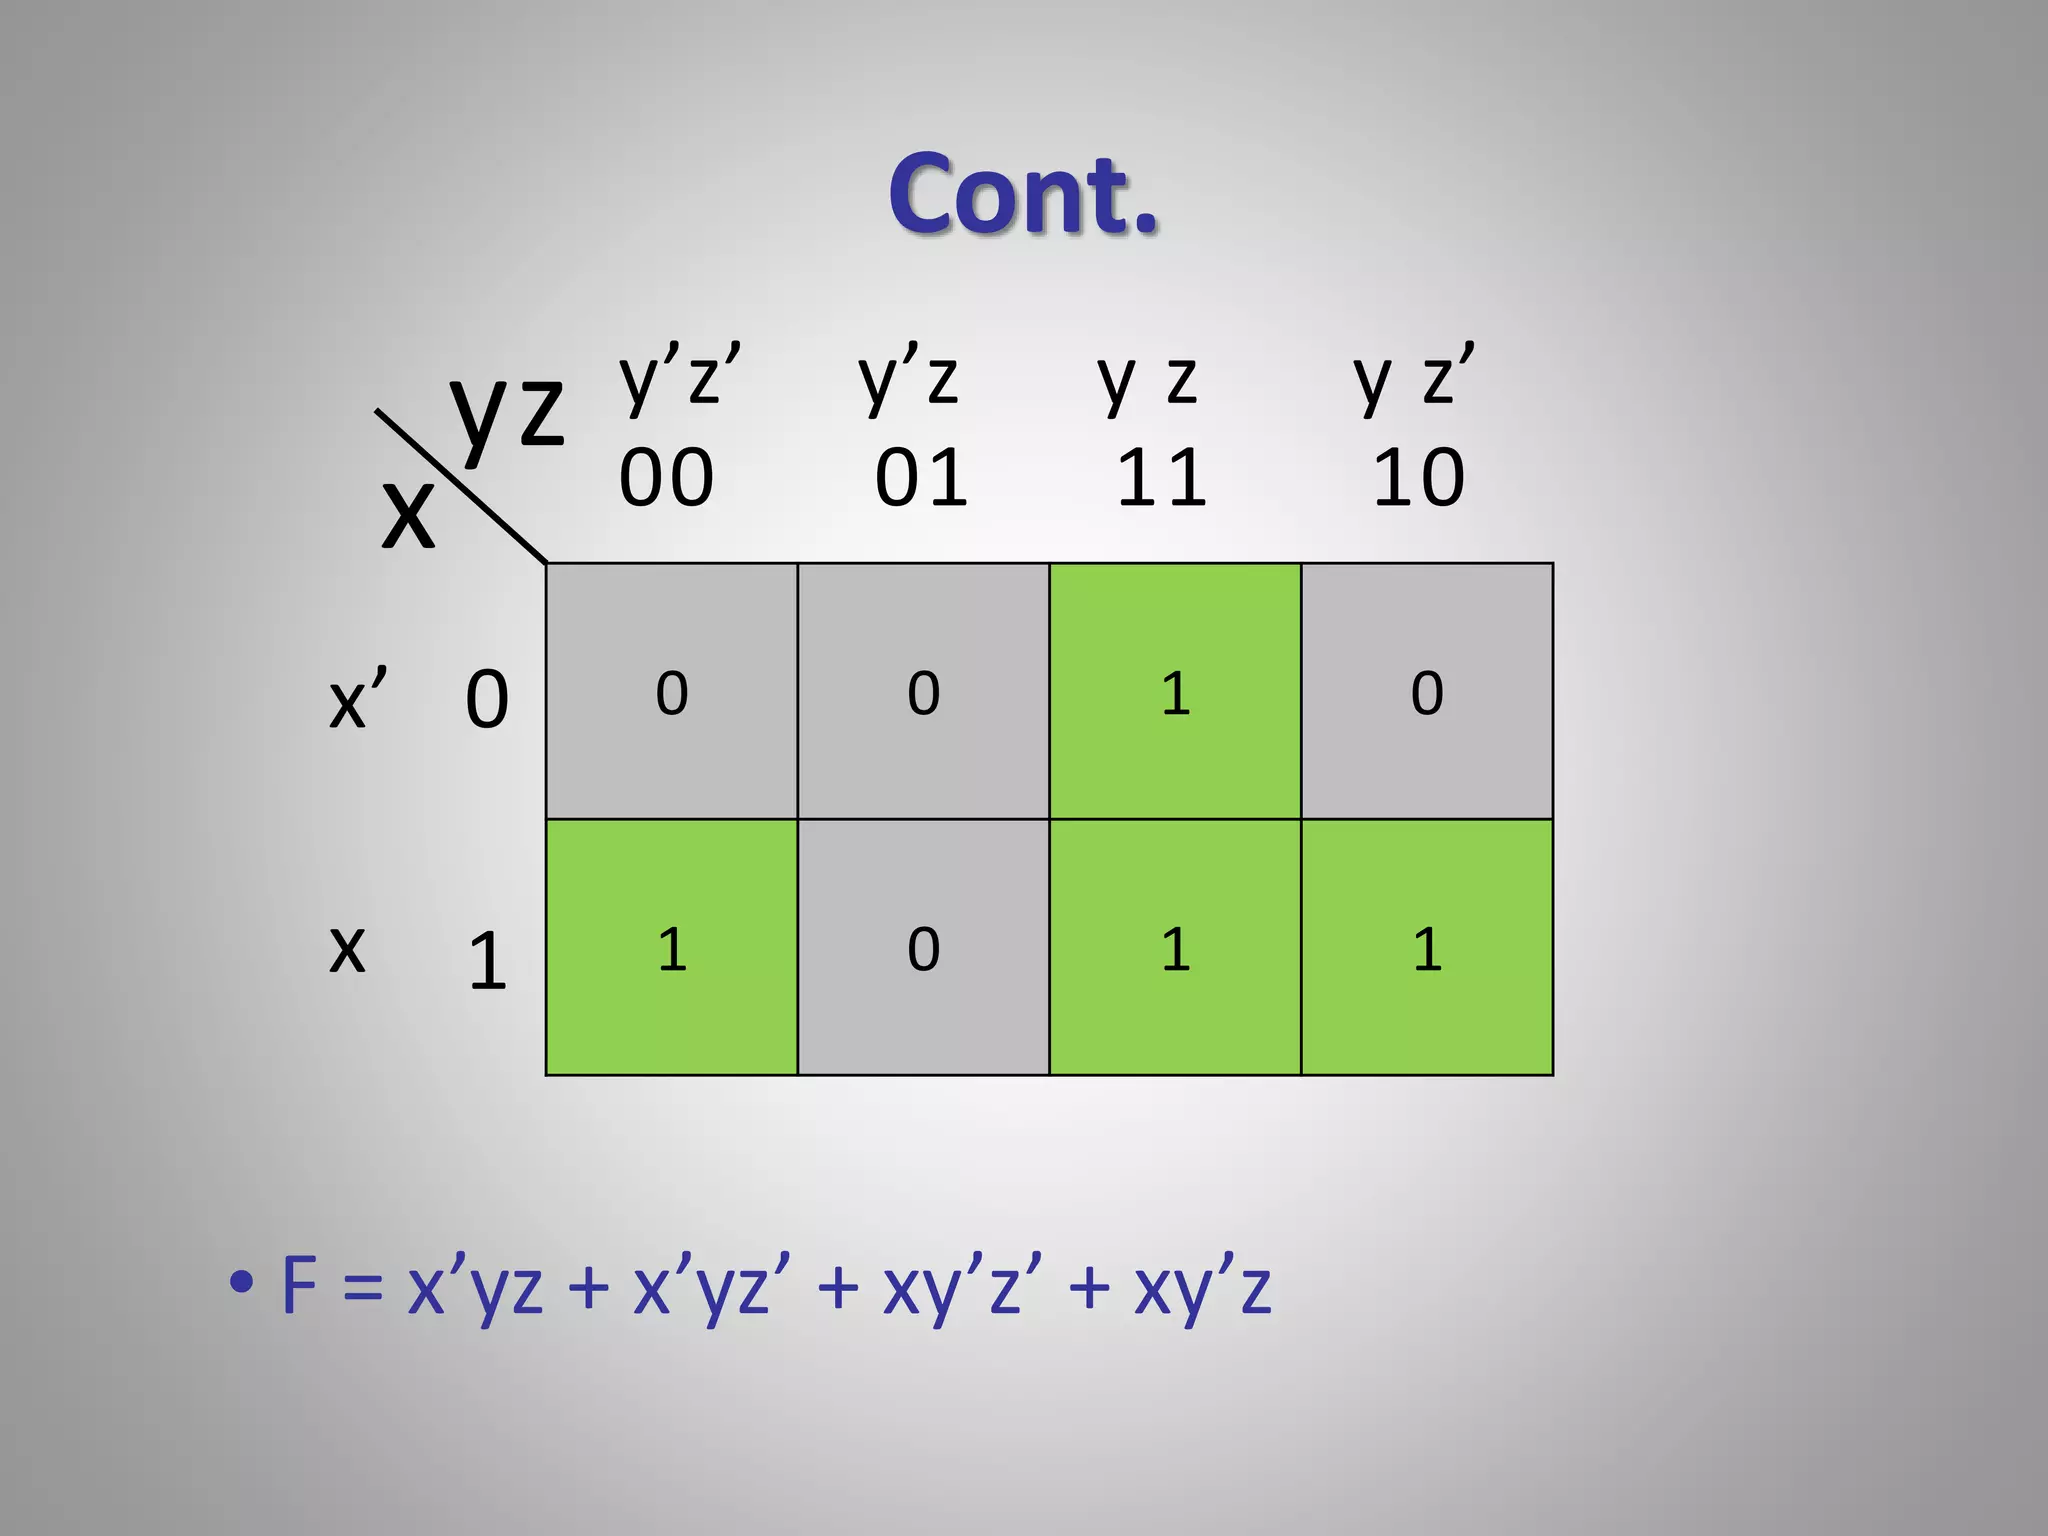
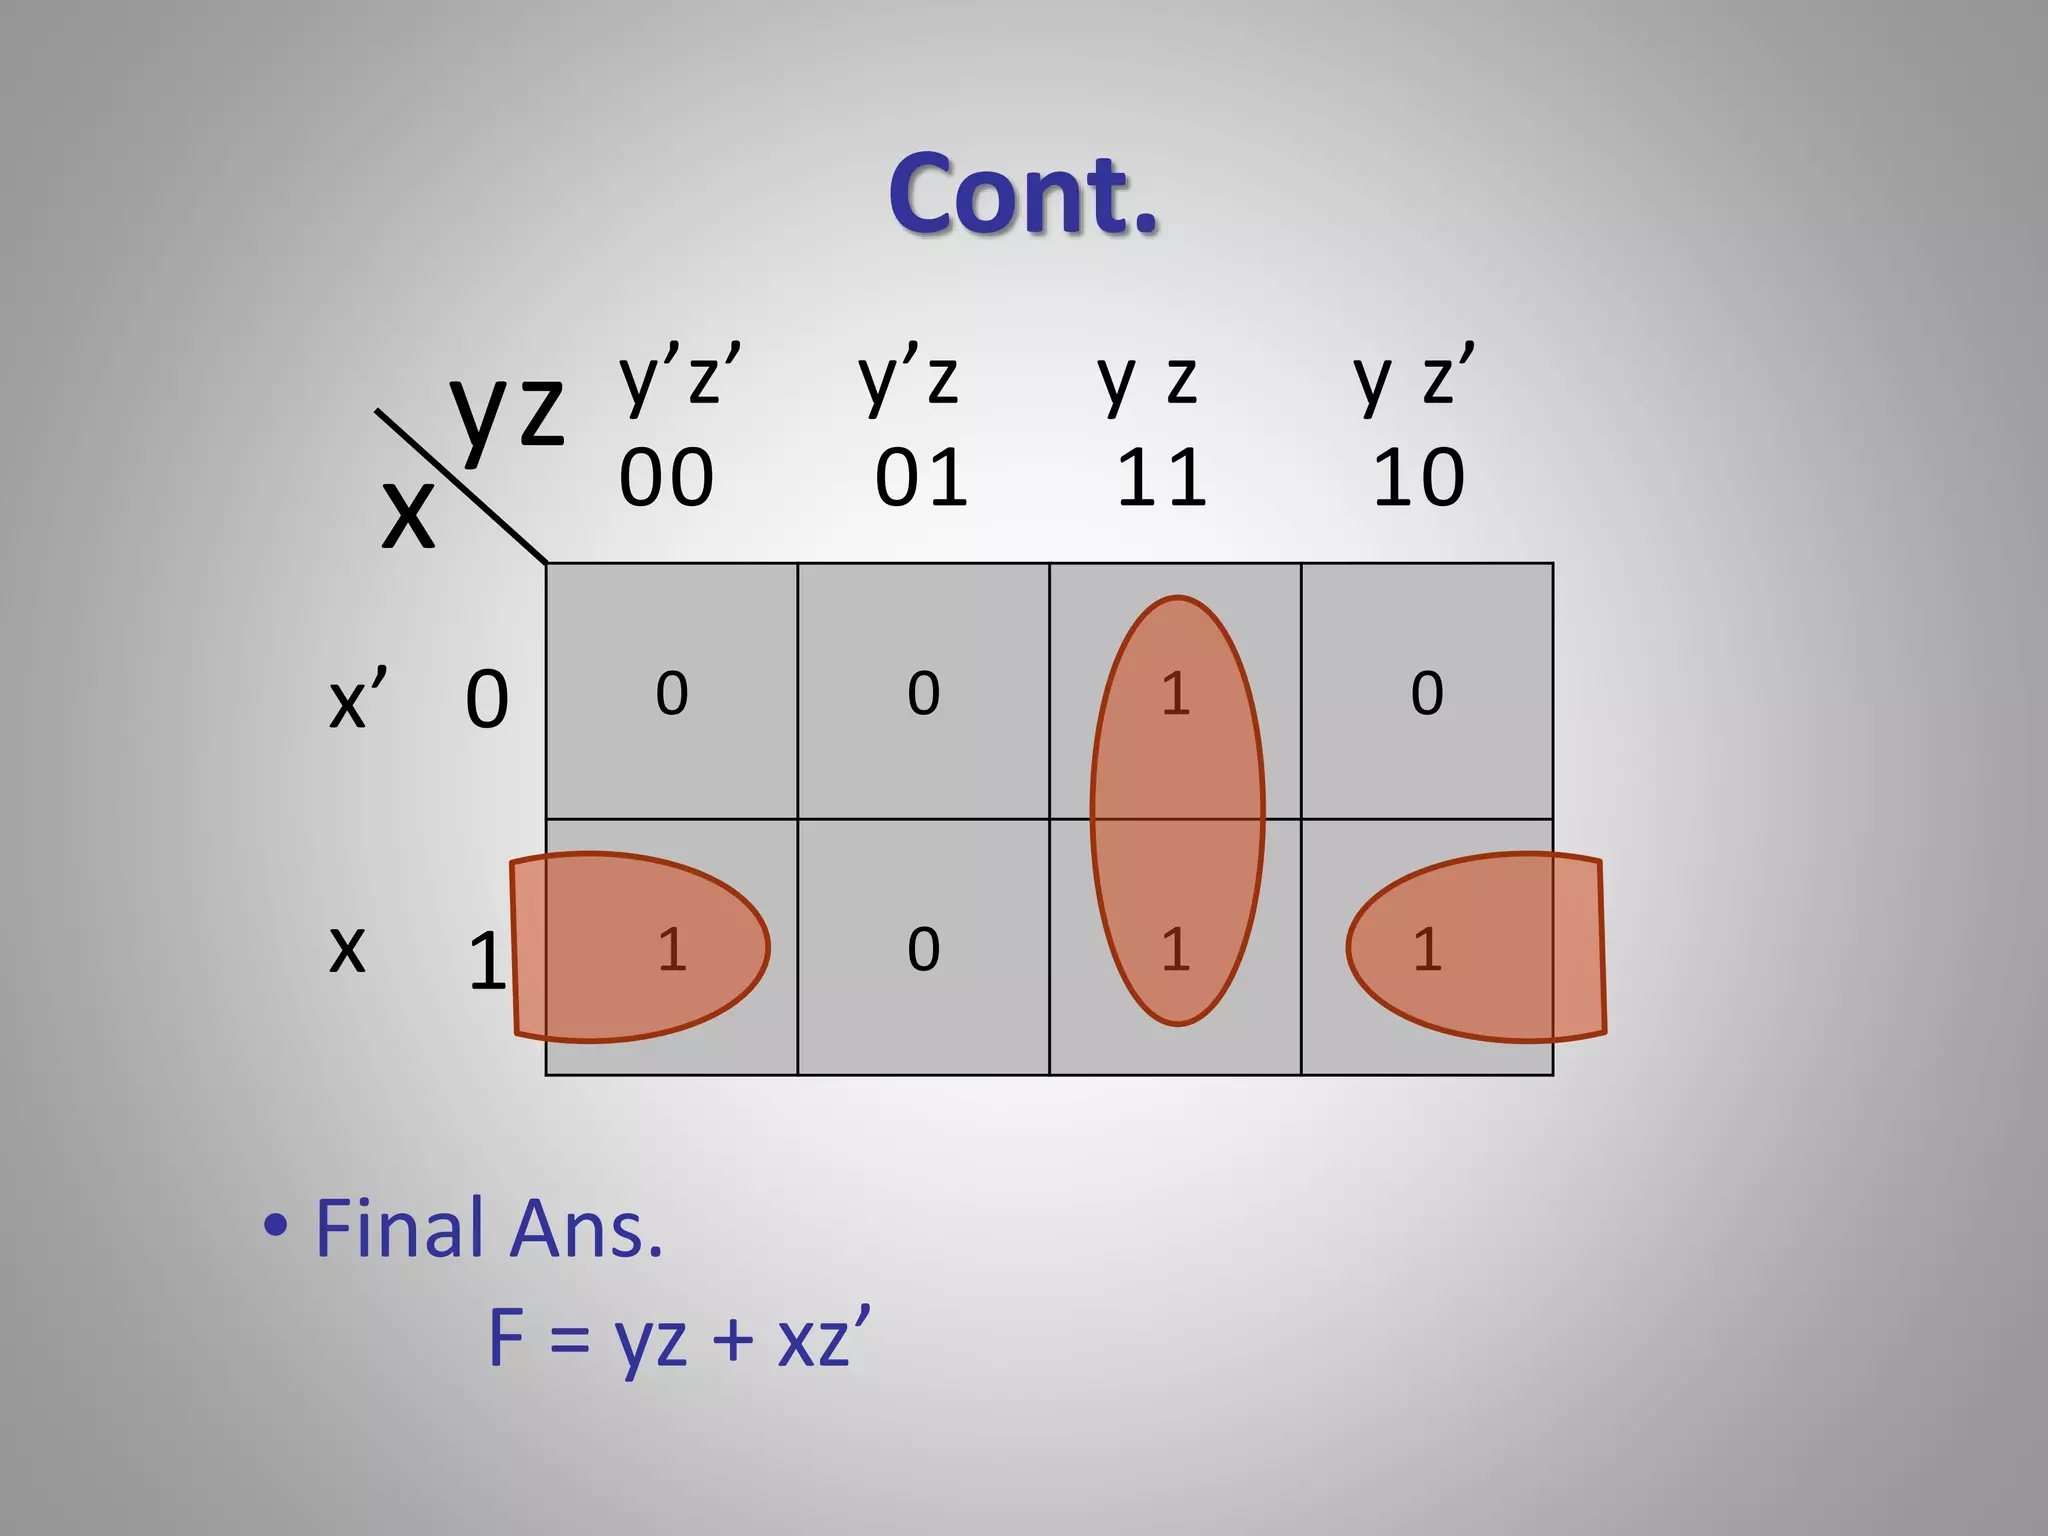
Explication of K-maps for three variables, detailing mapping squares, variables, and simplifying Boolean functions through examples.
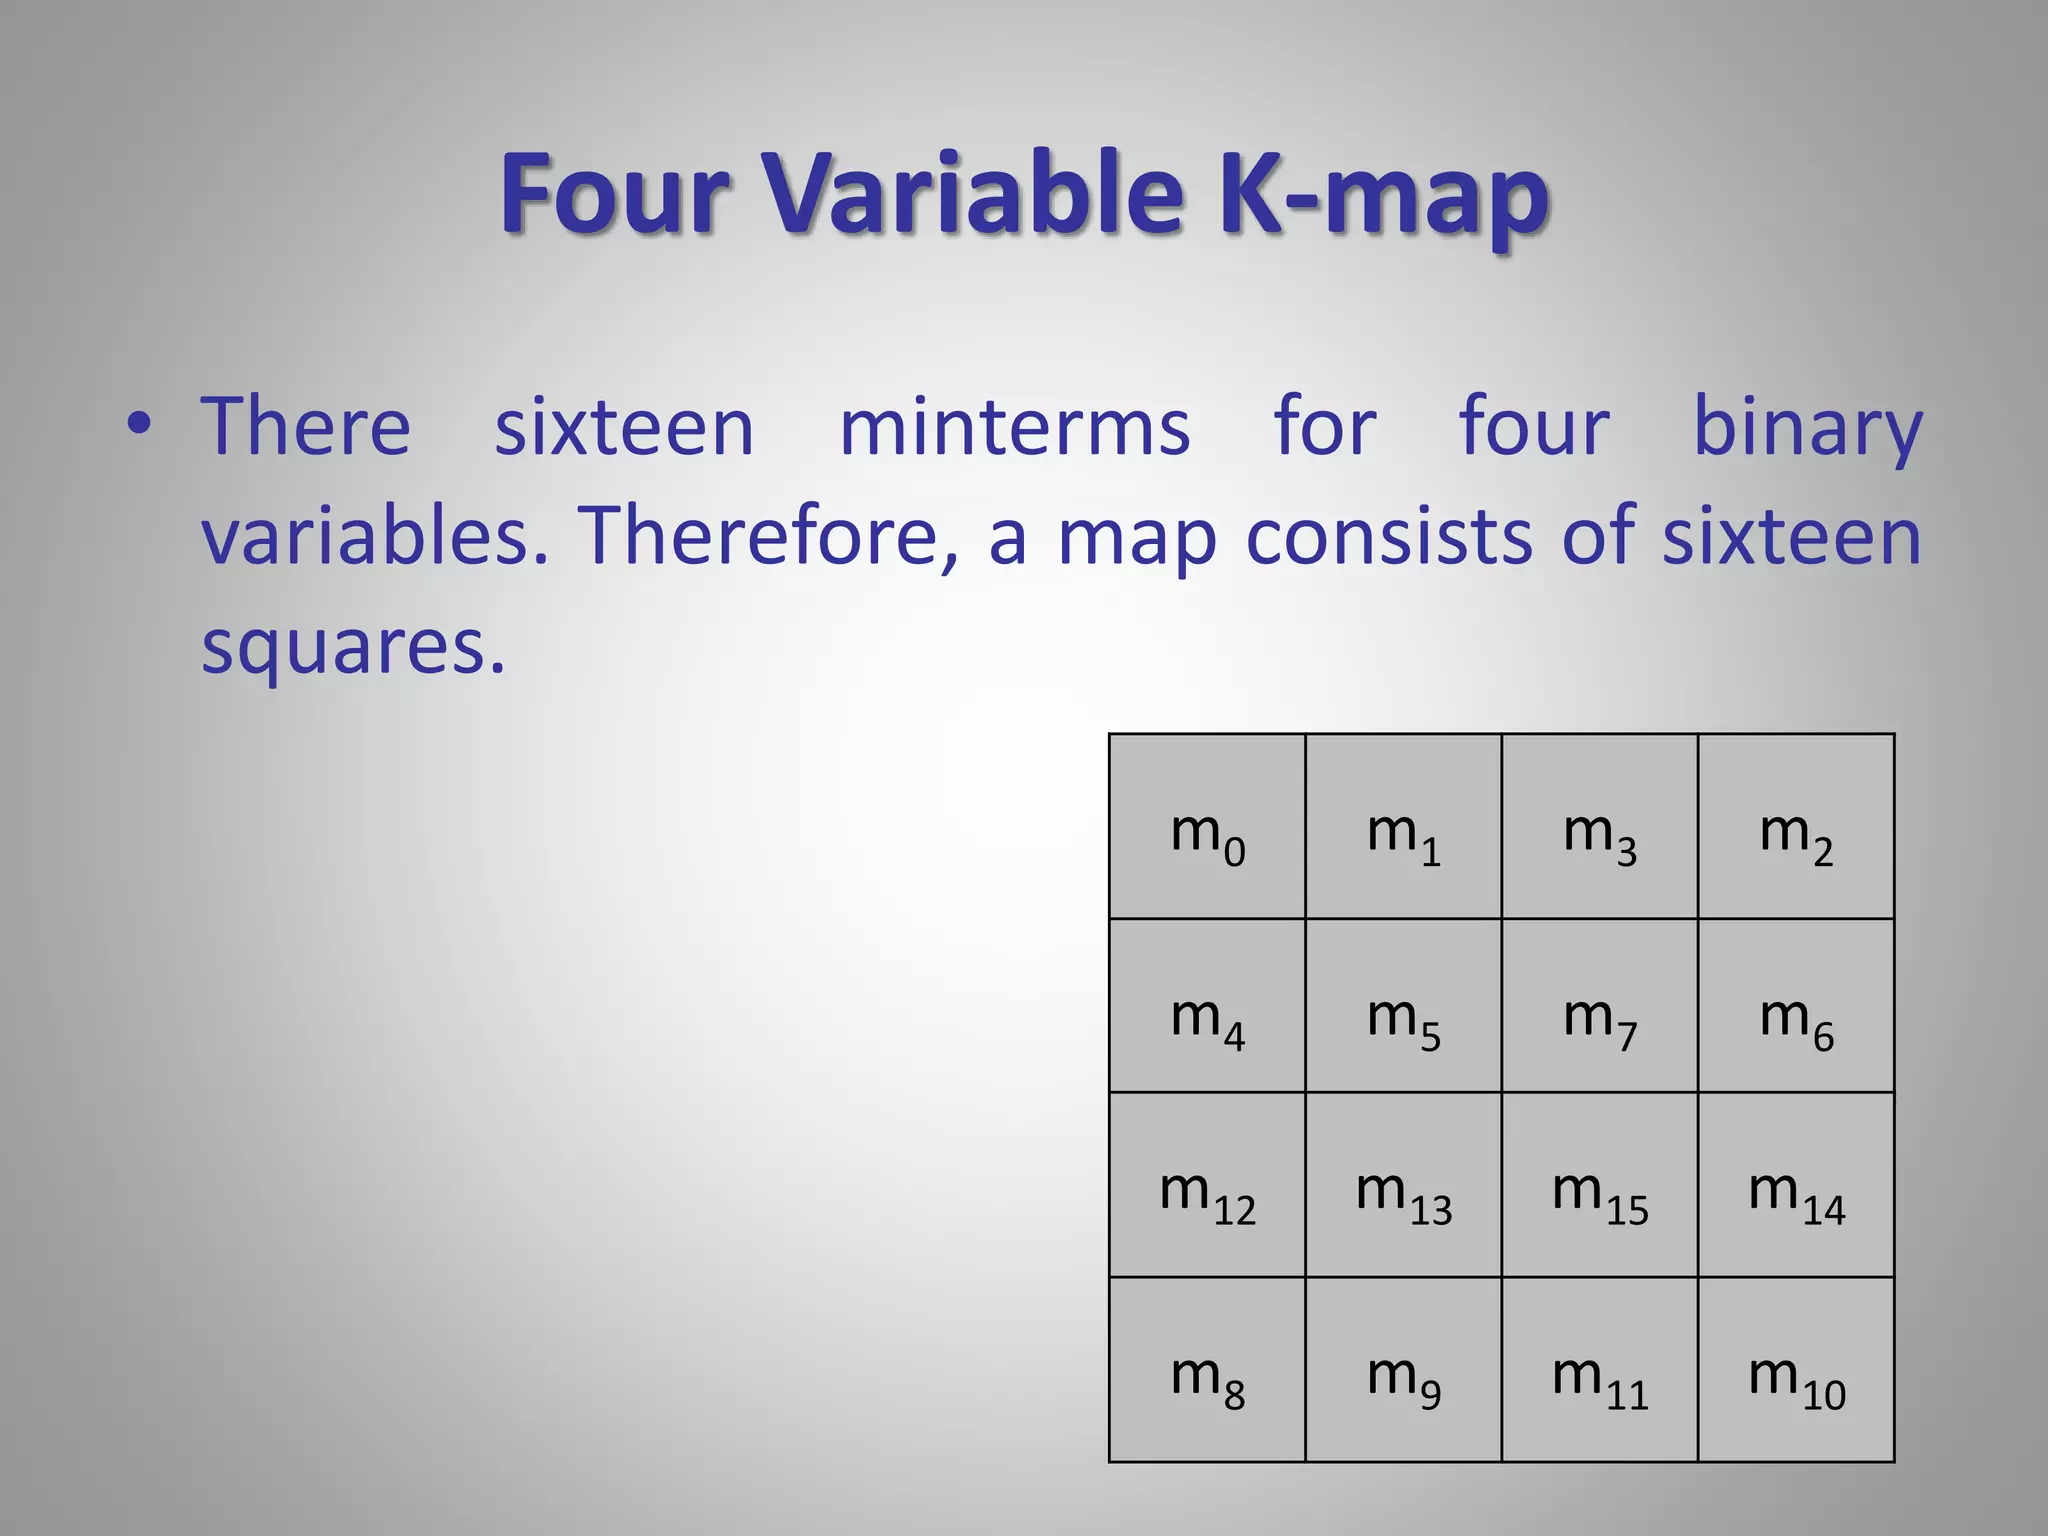
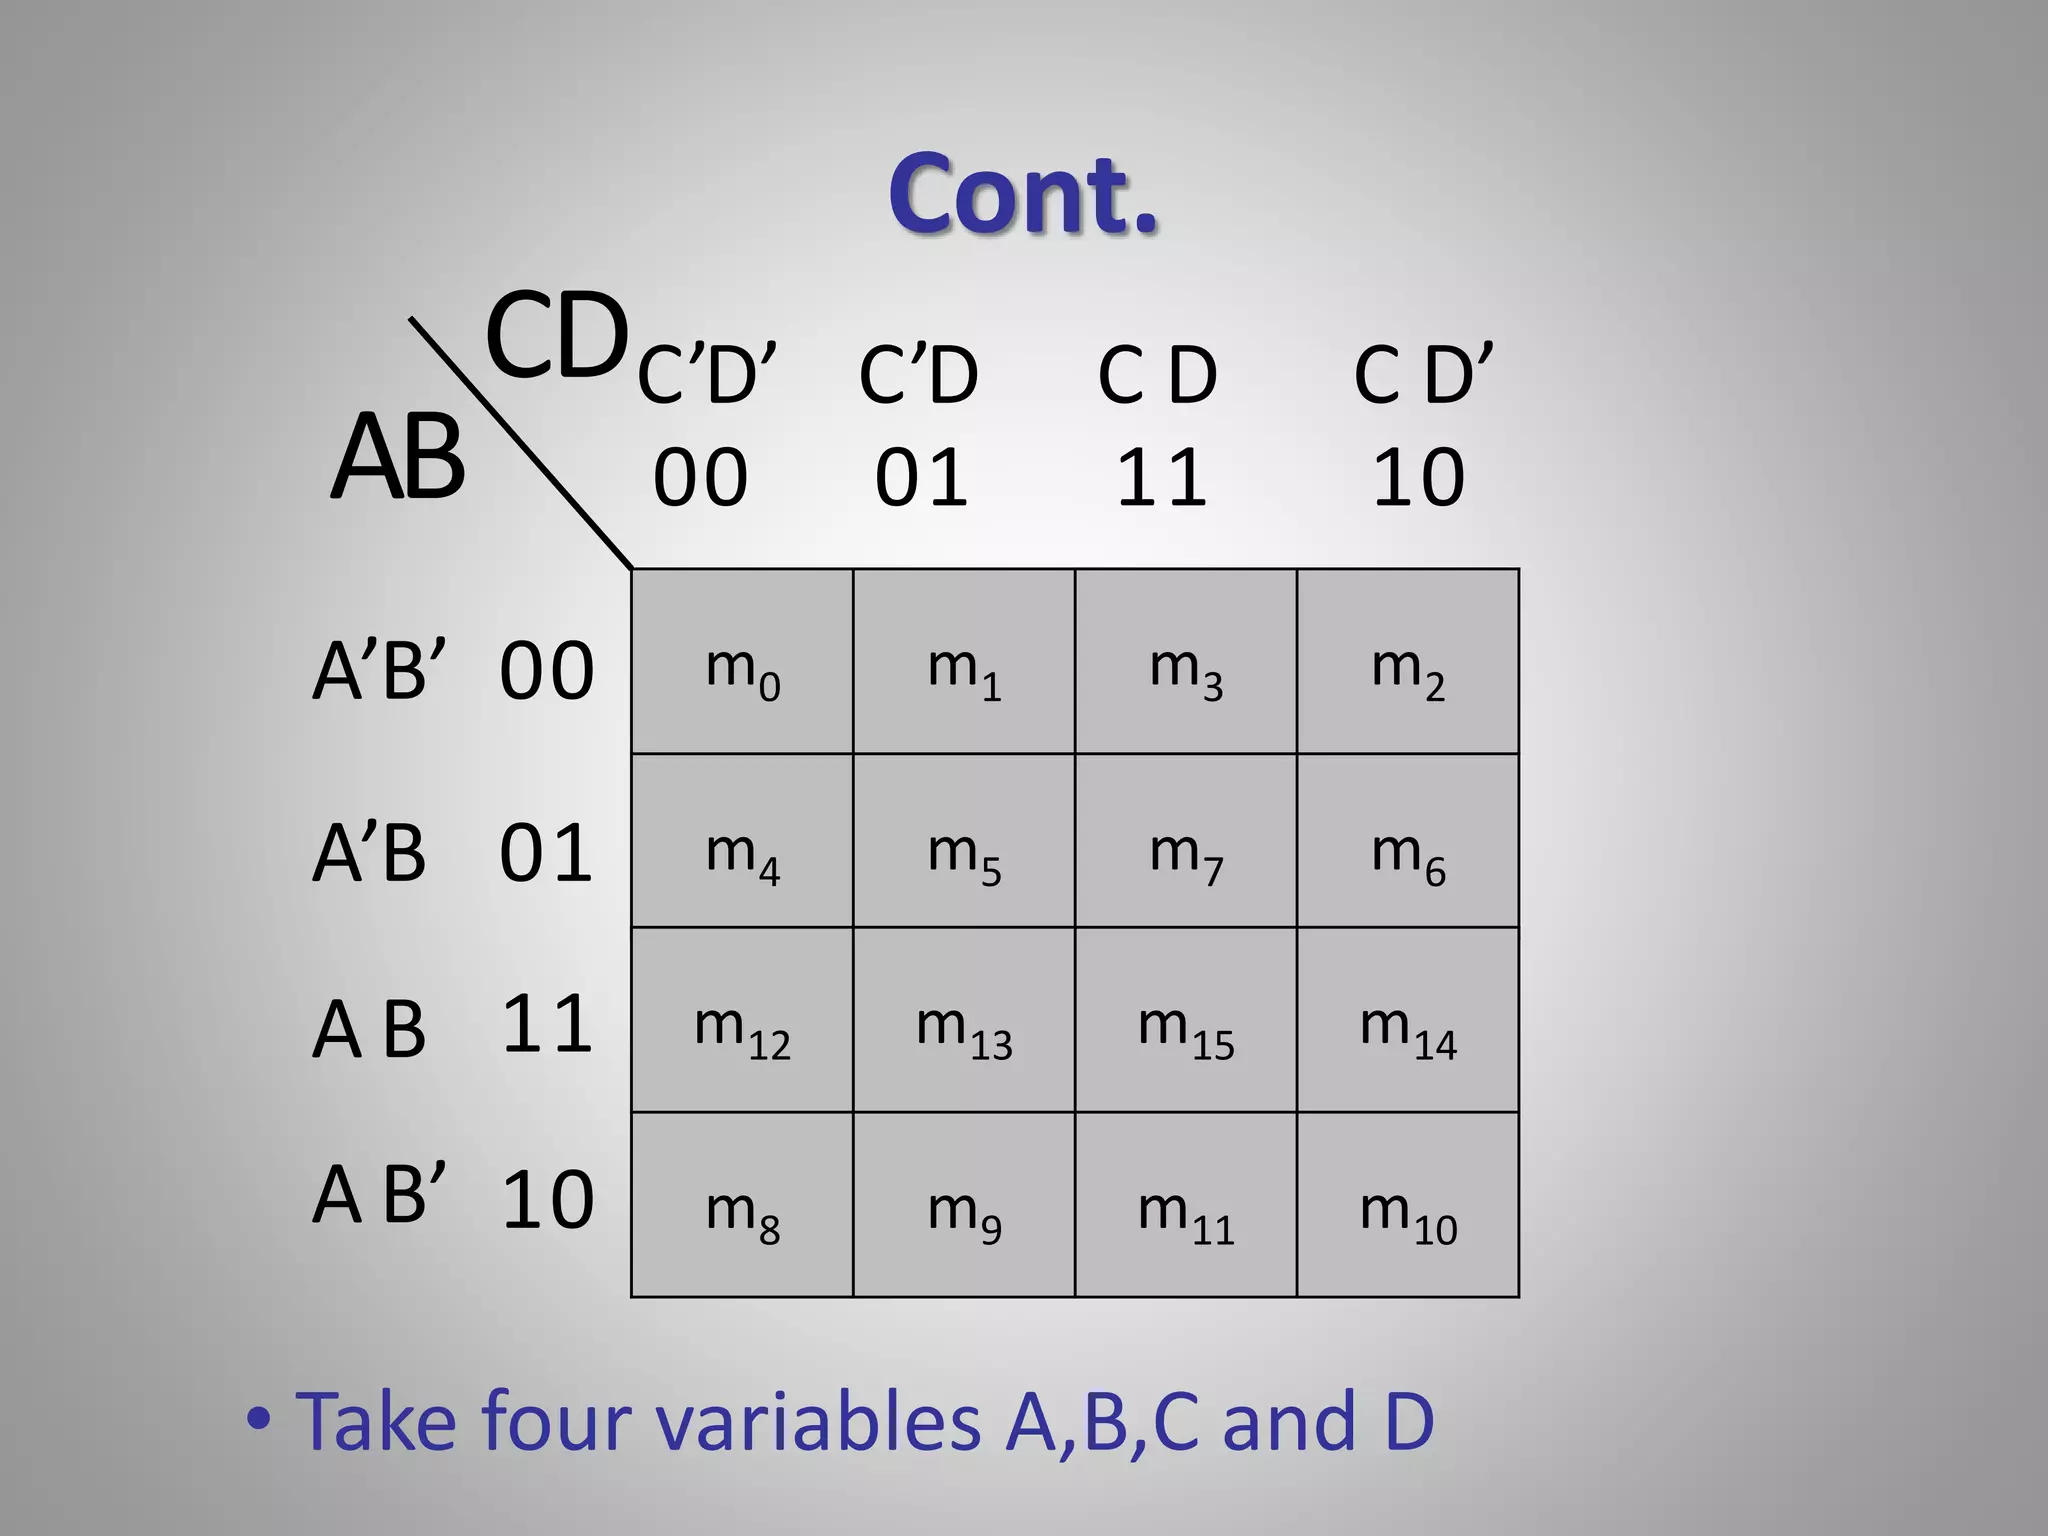
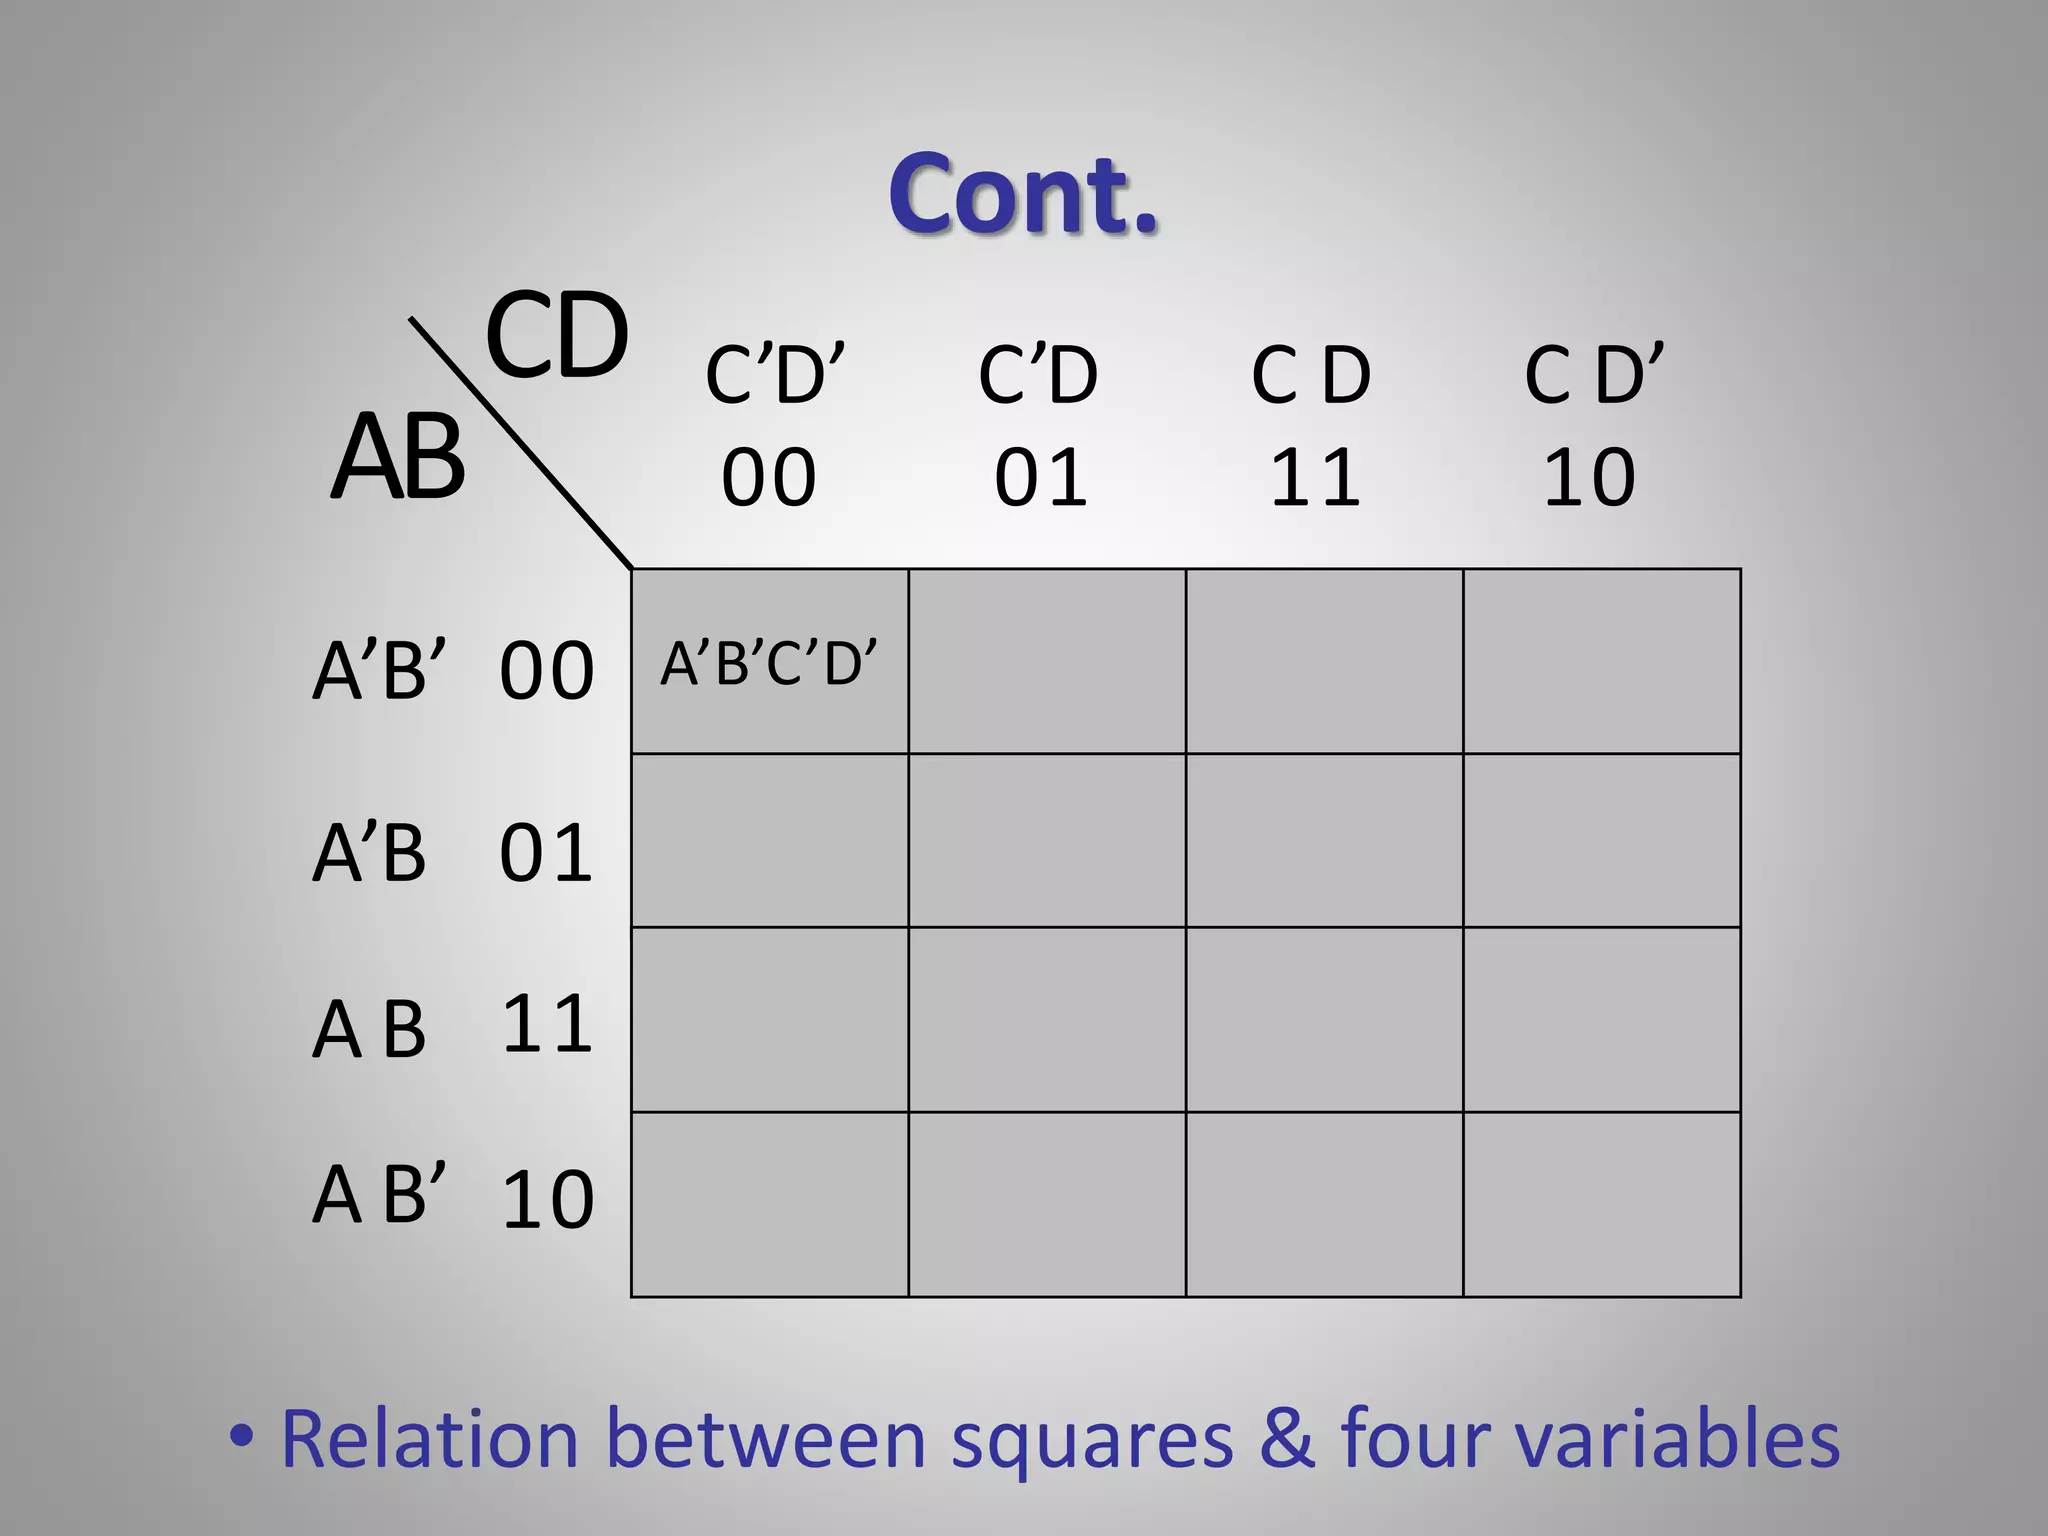
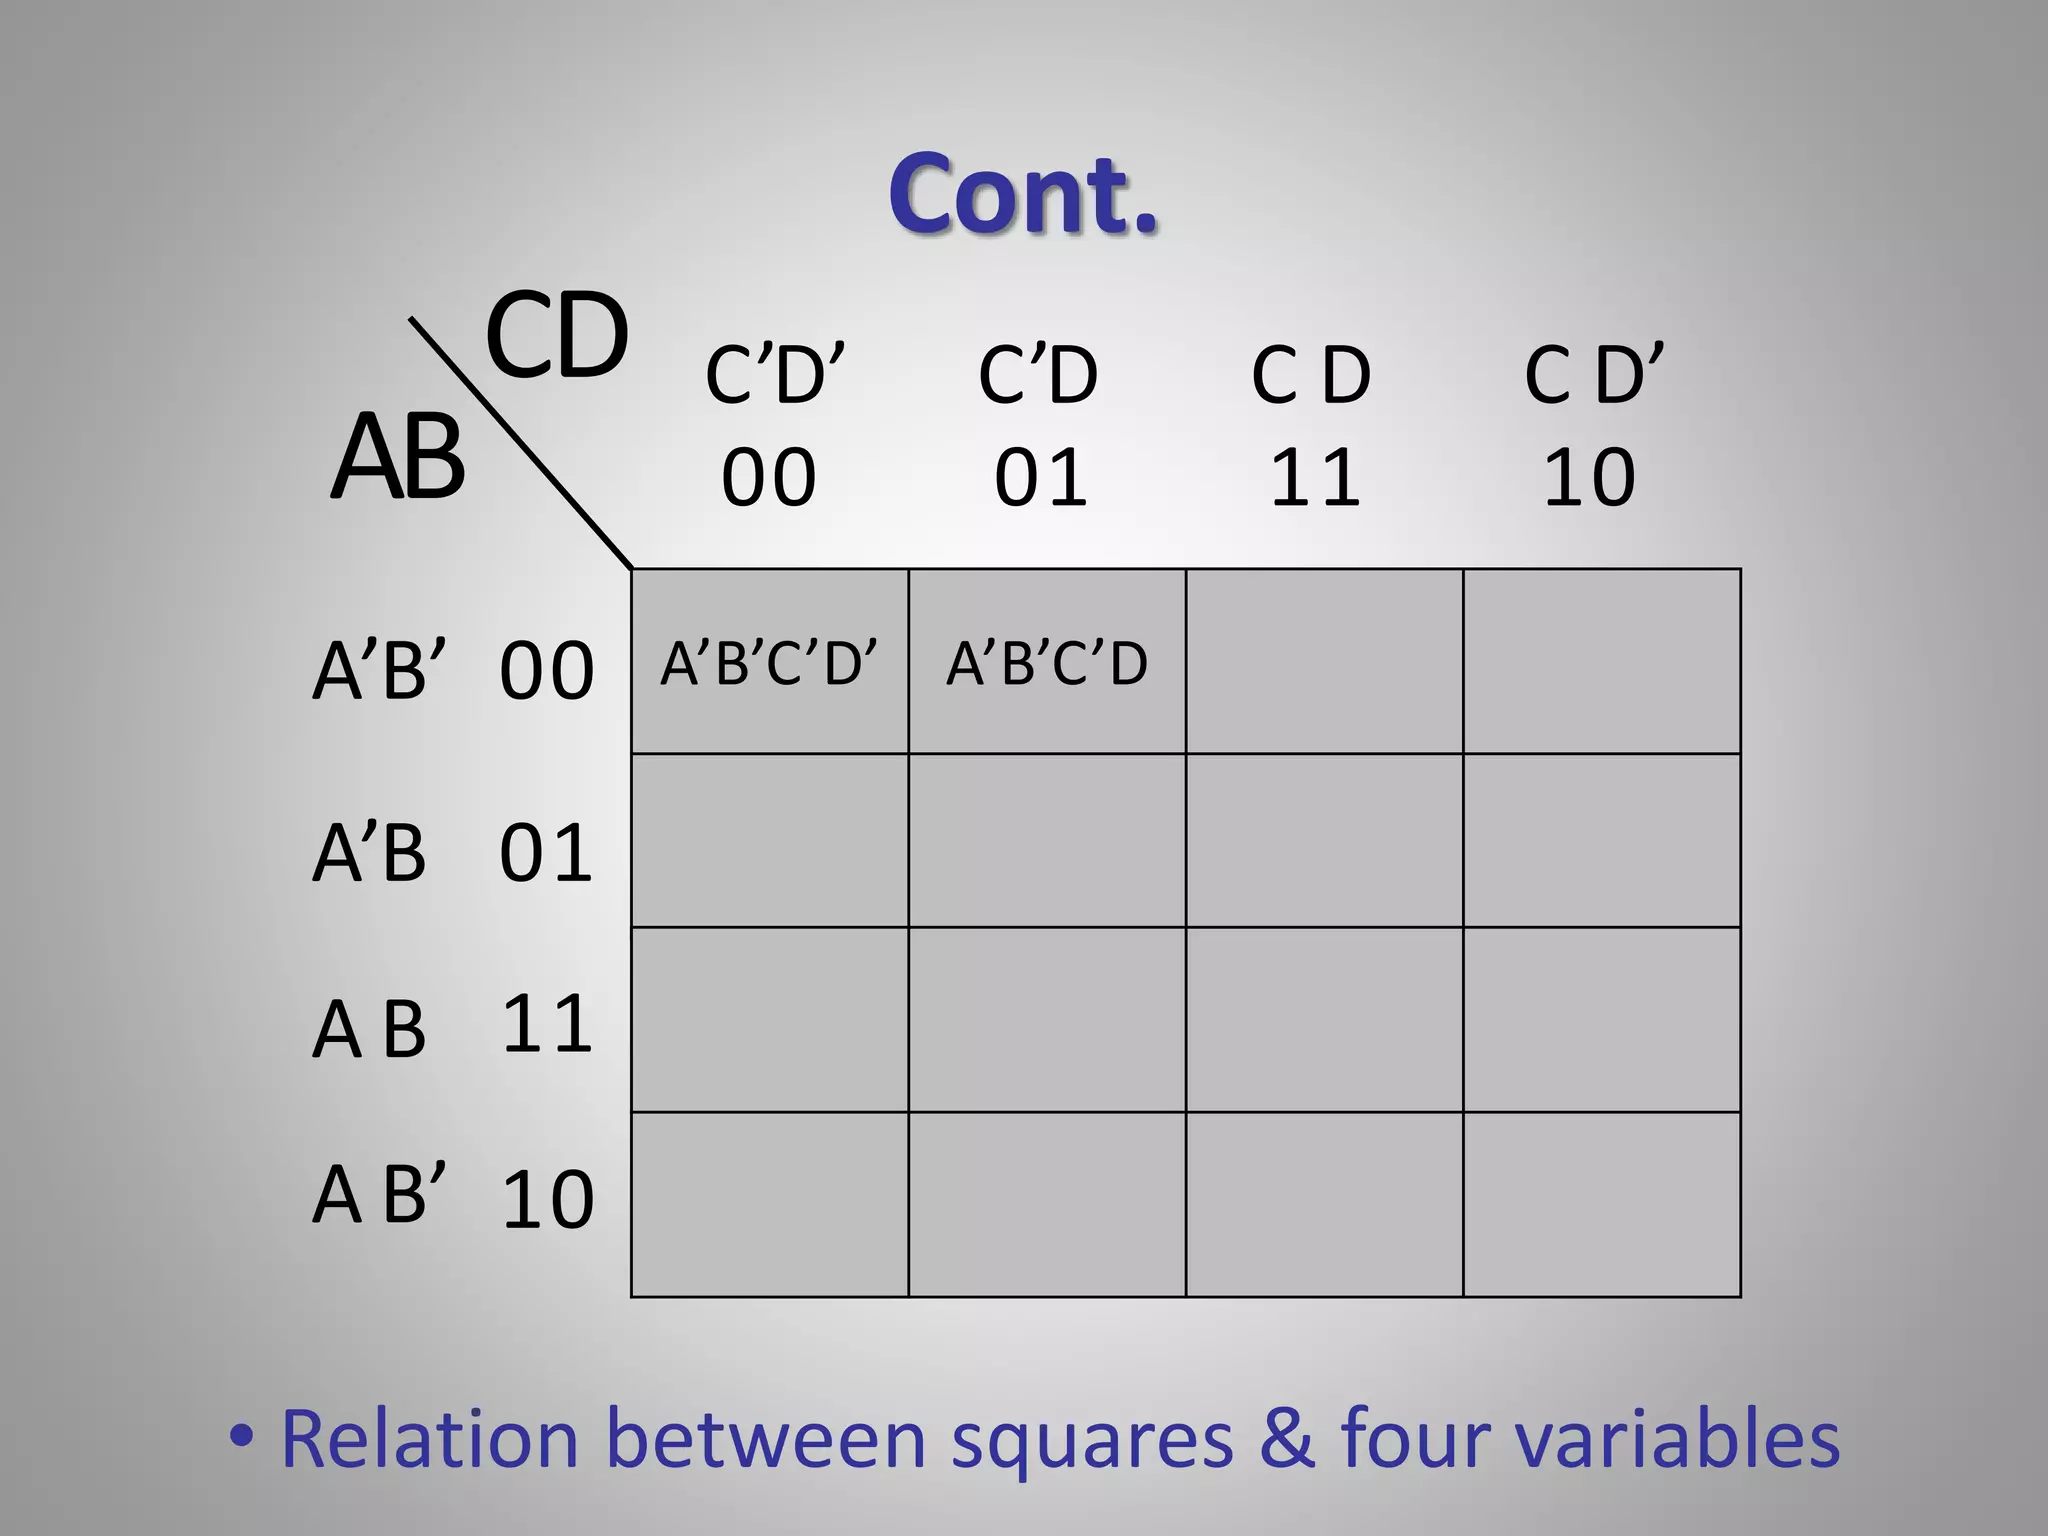
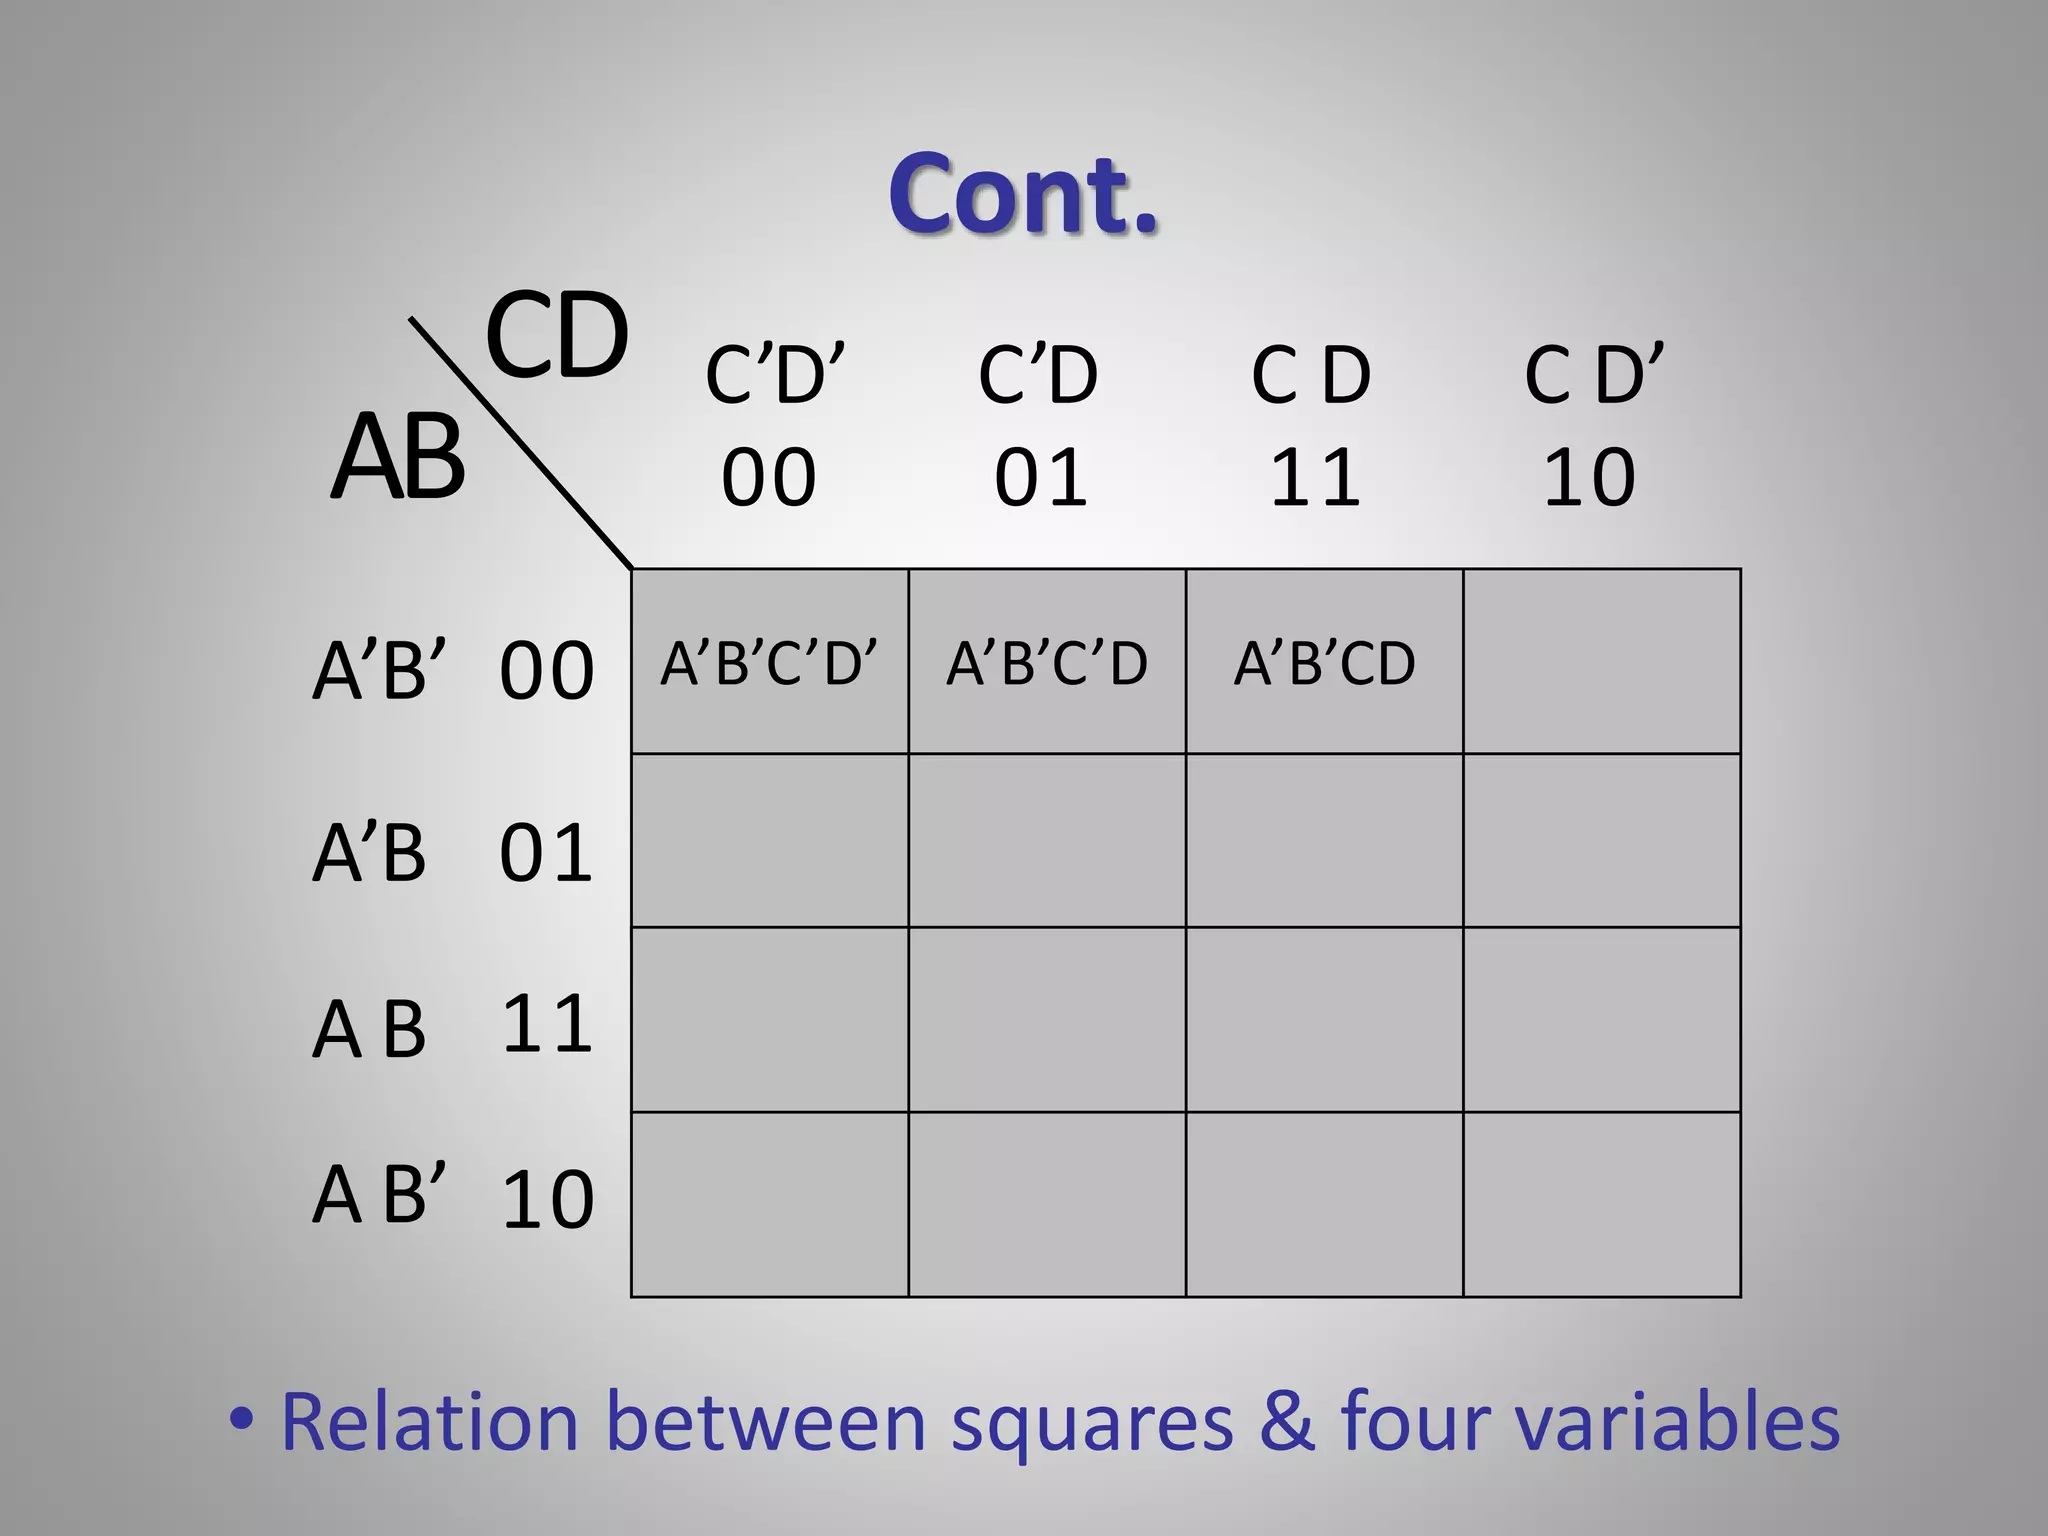
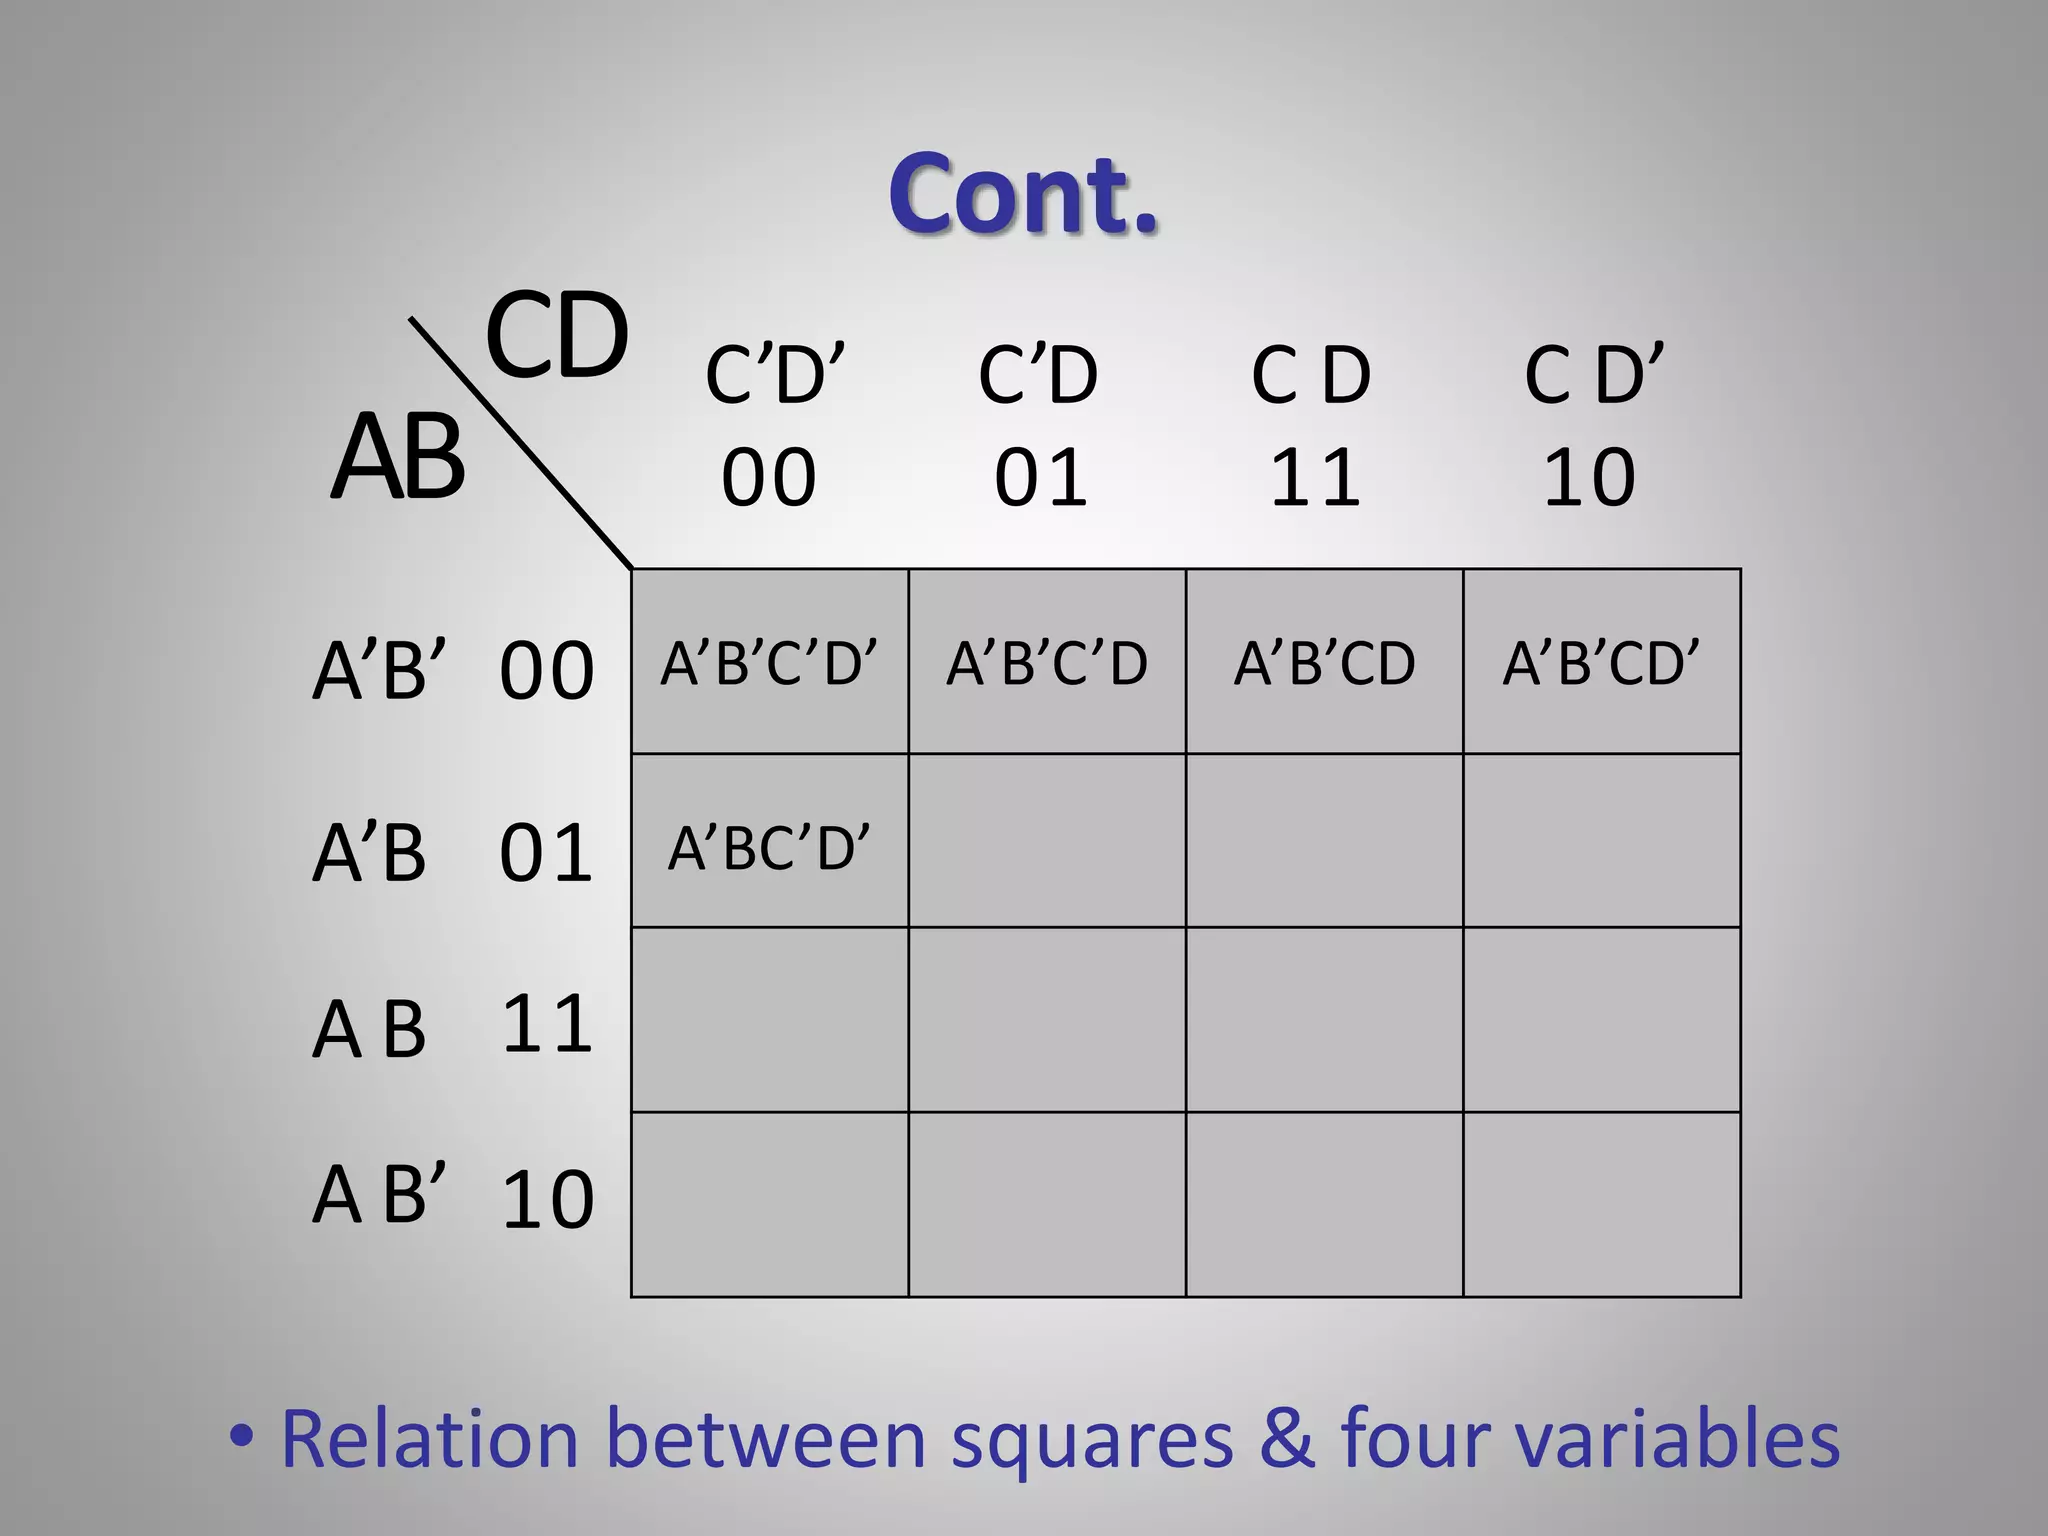
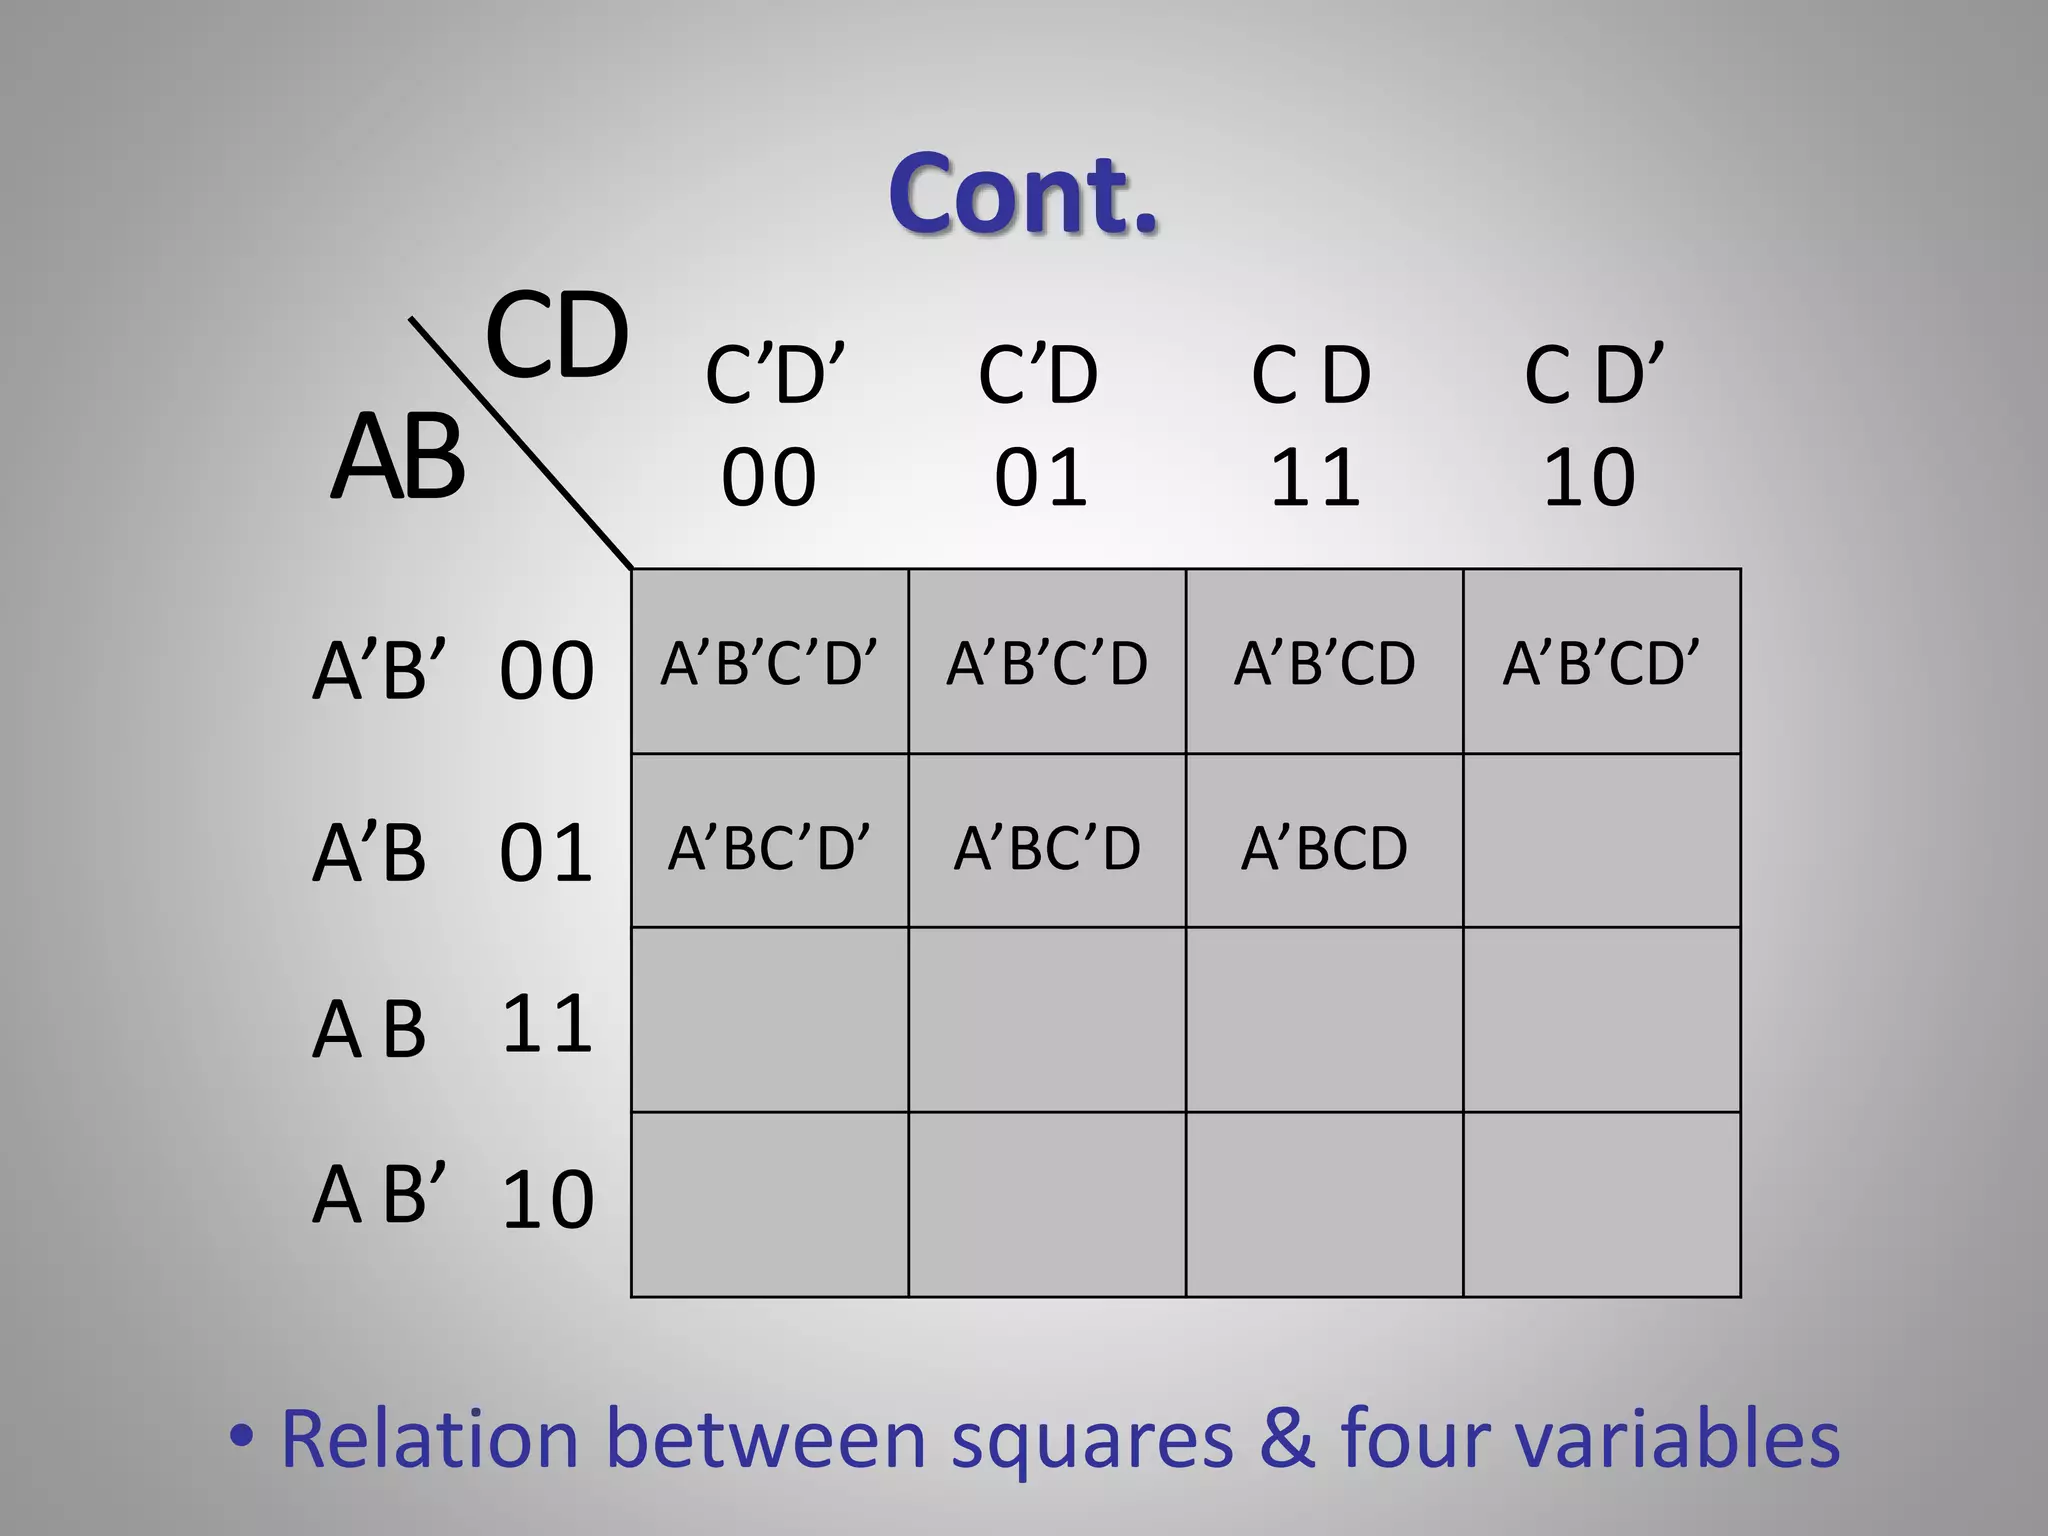
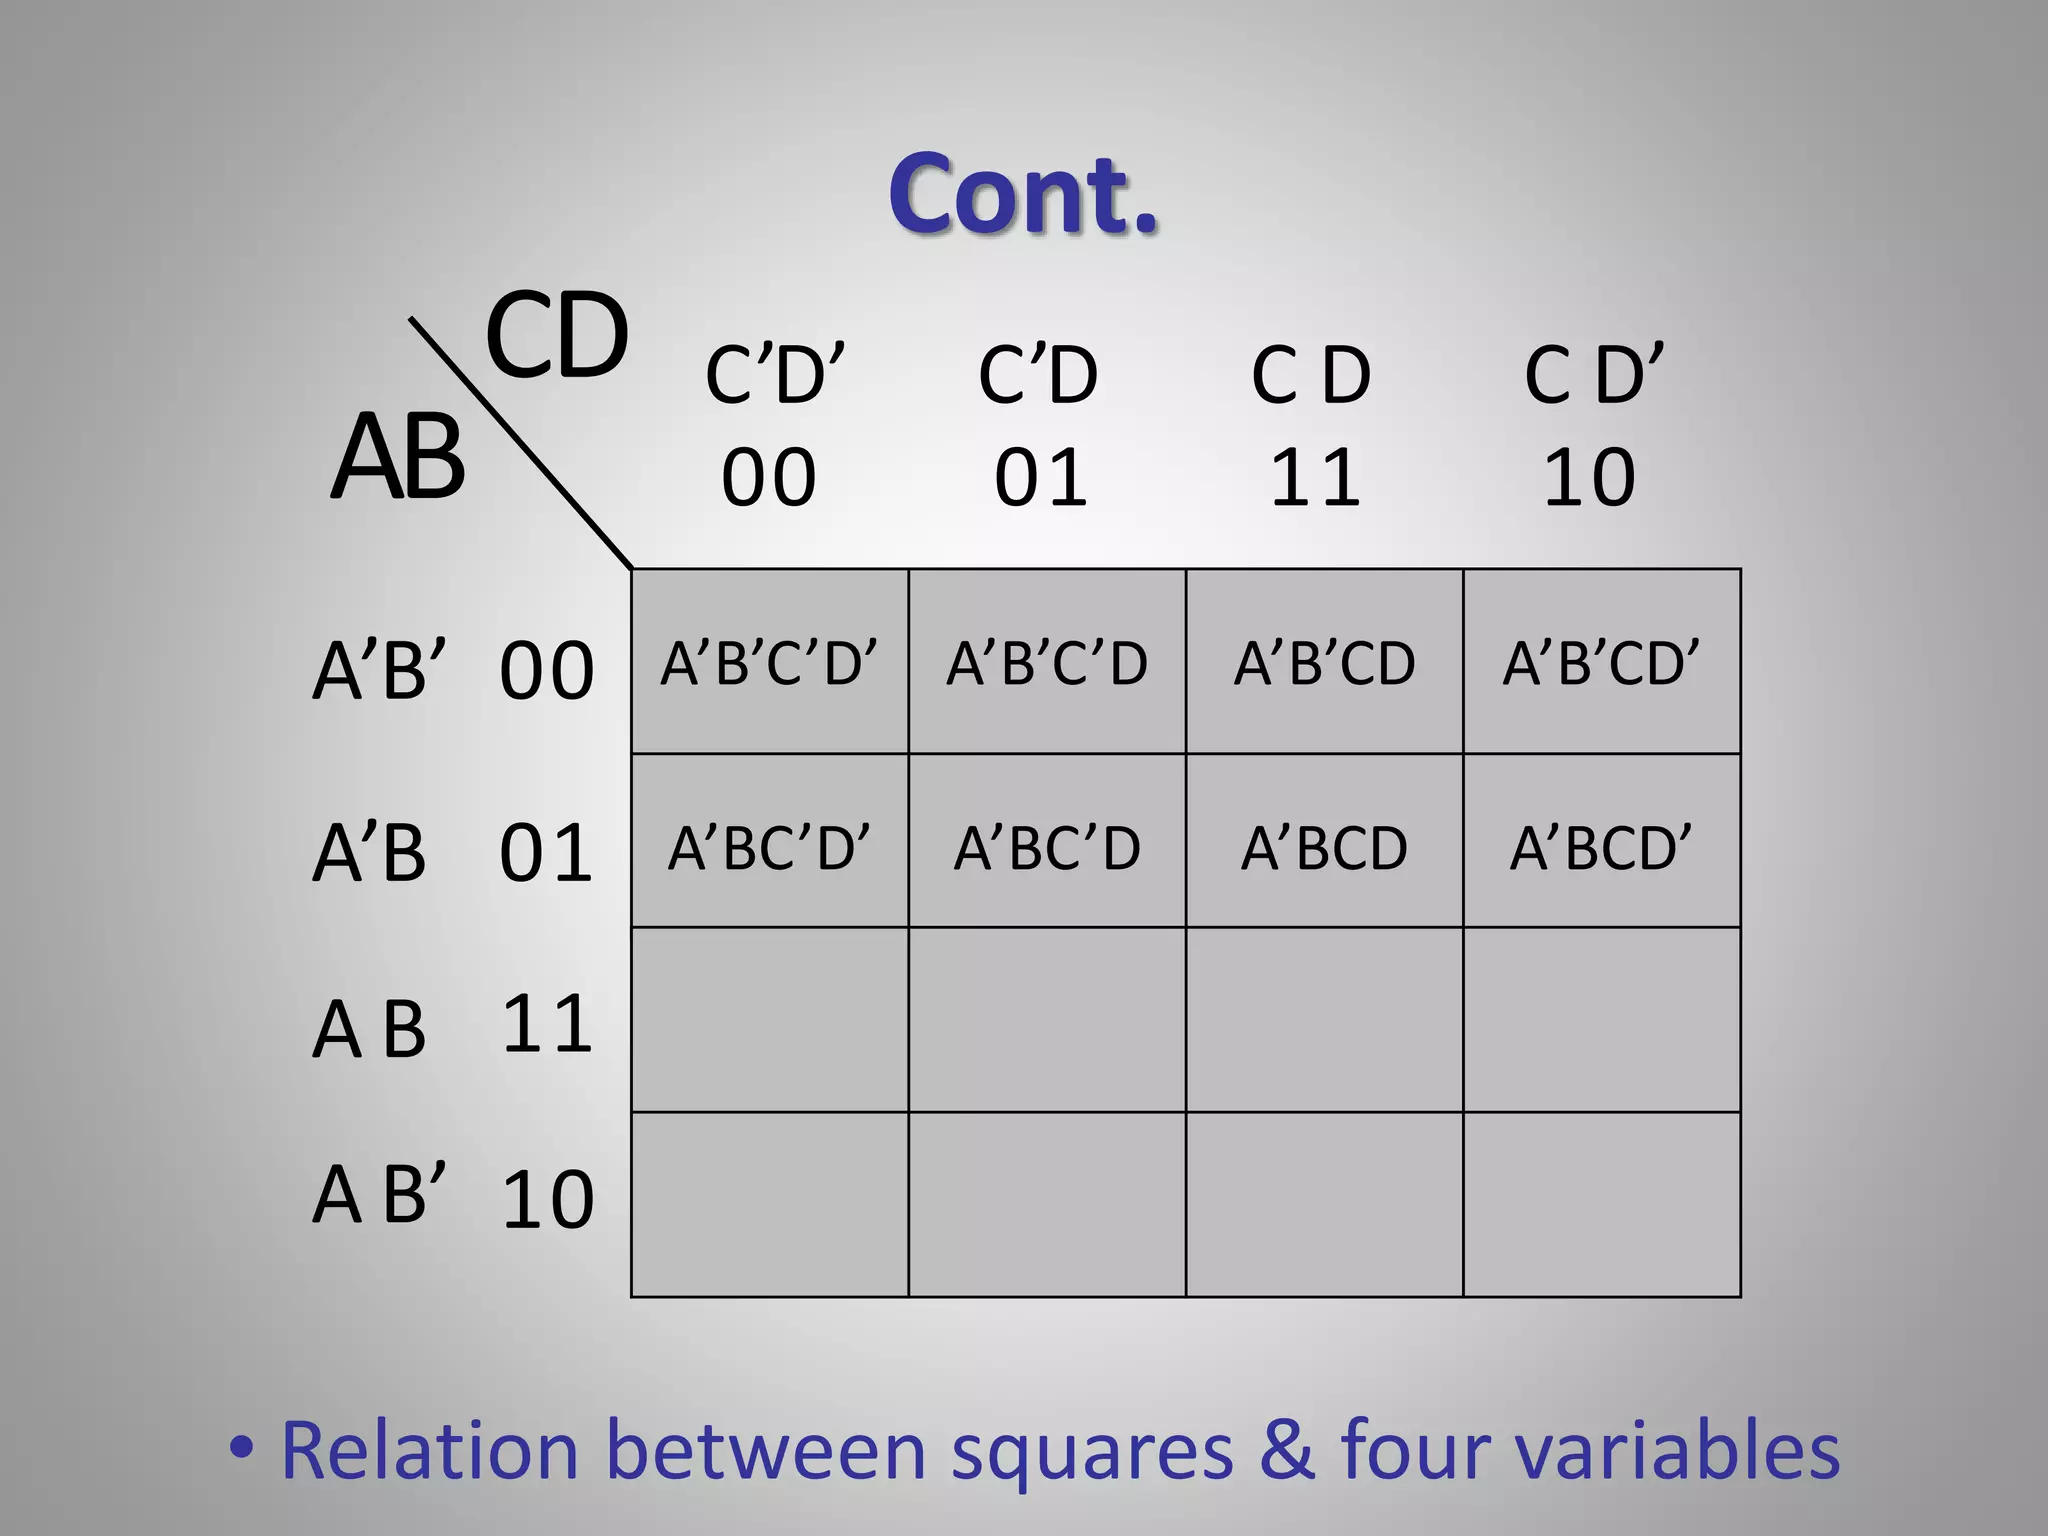
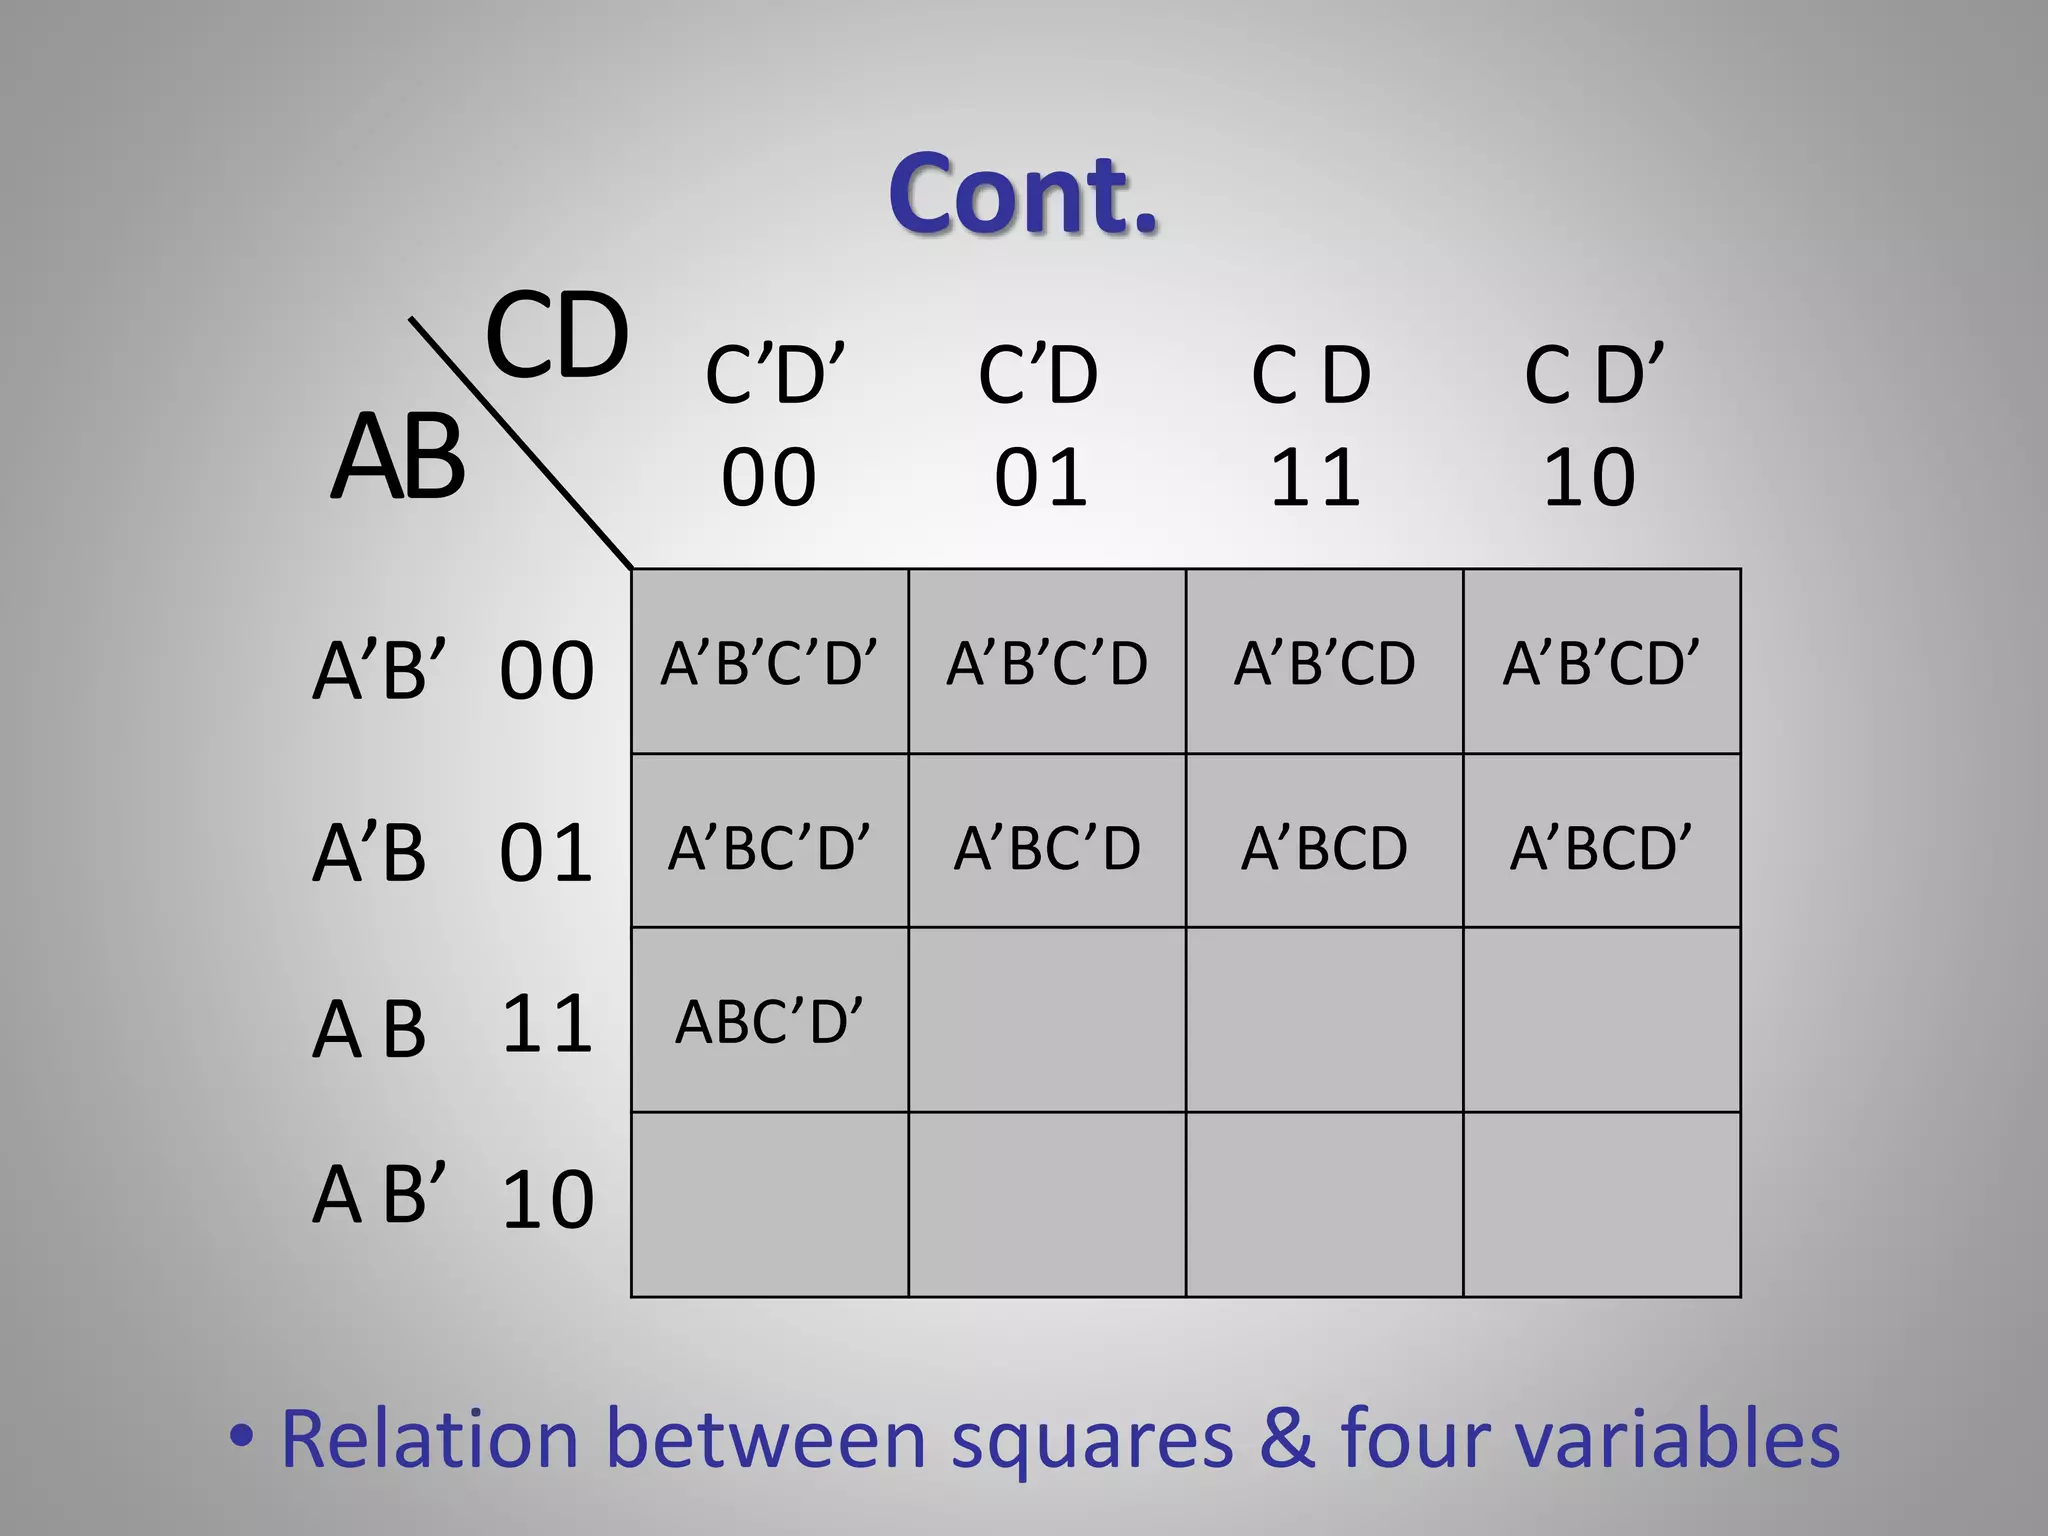
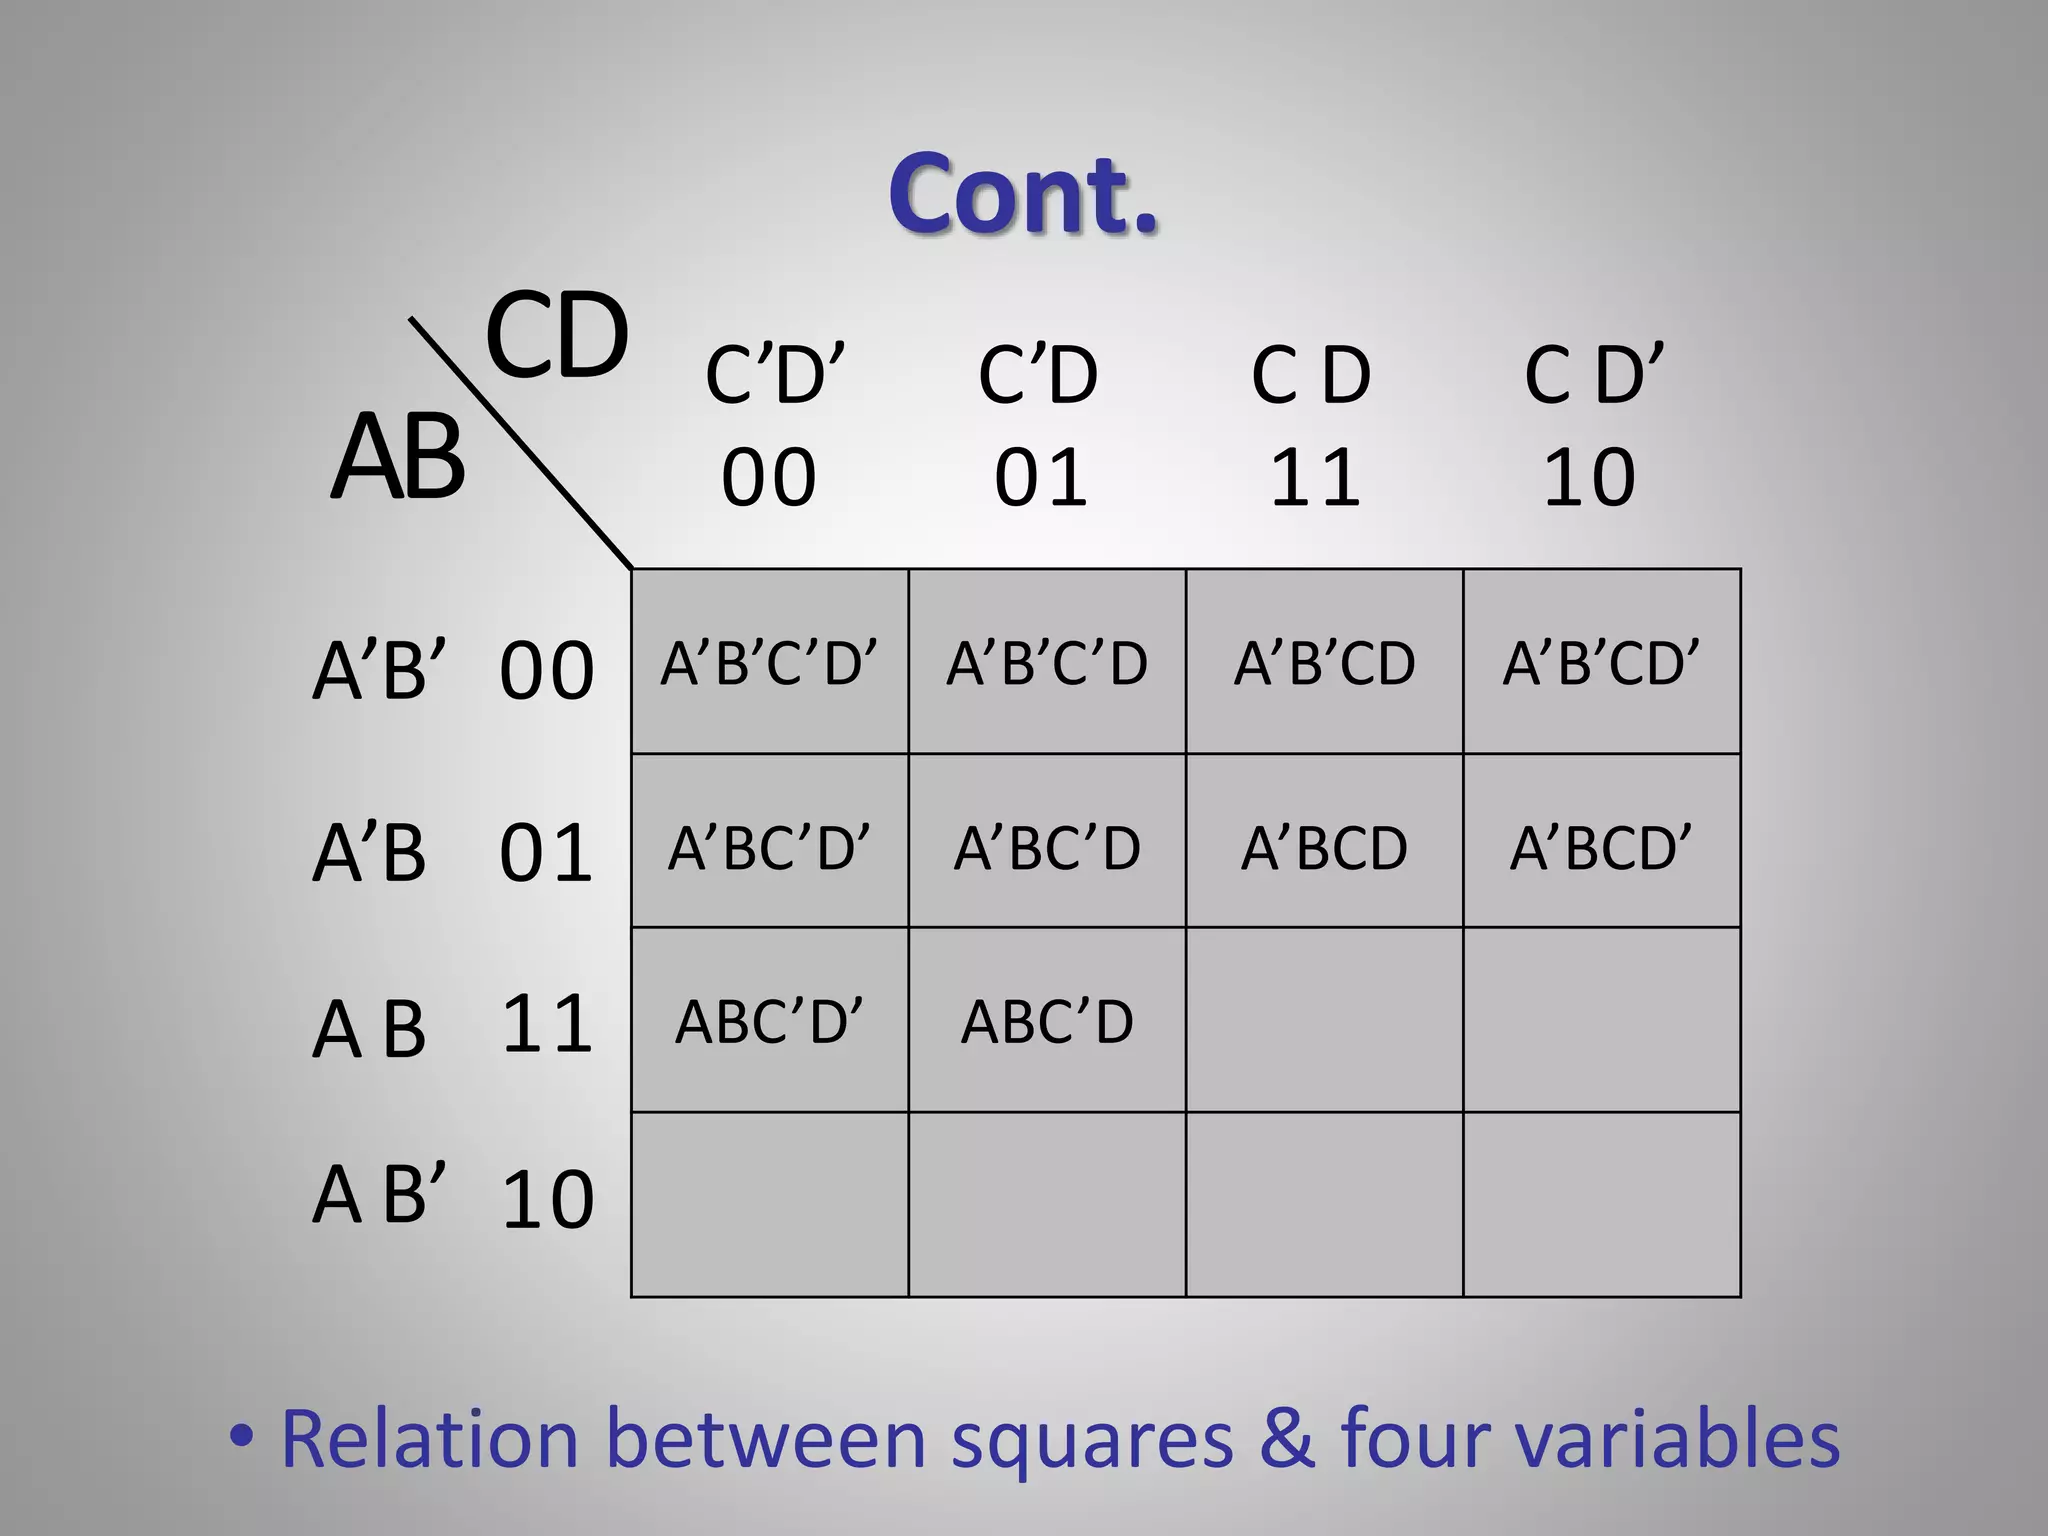
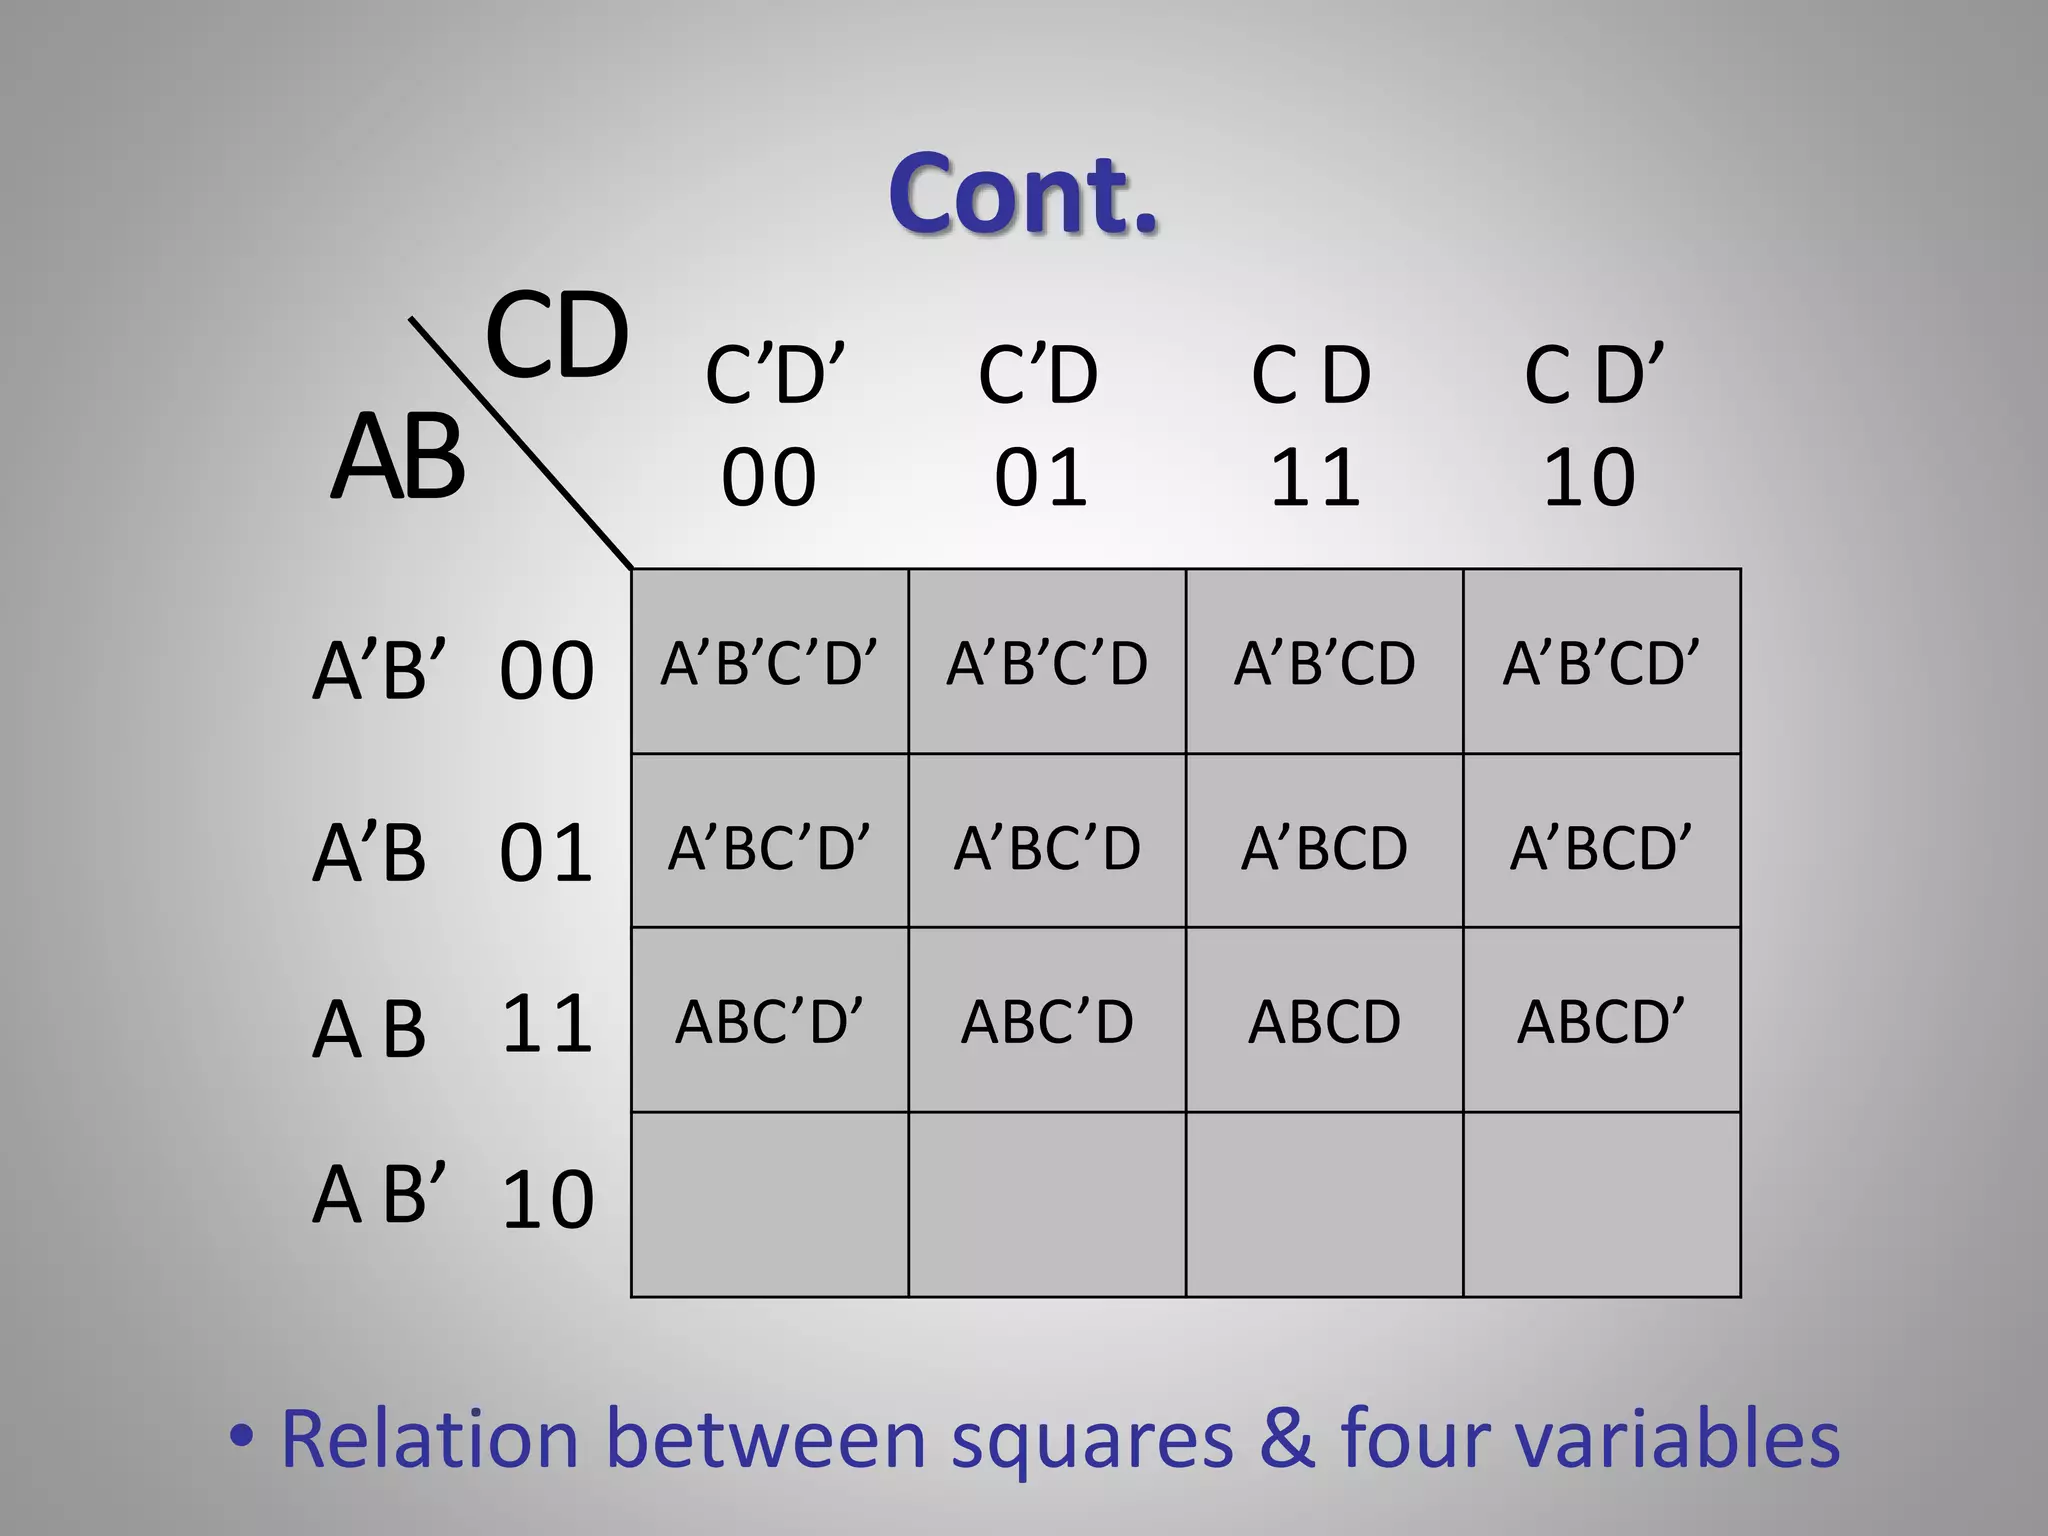
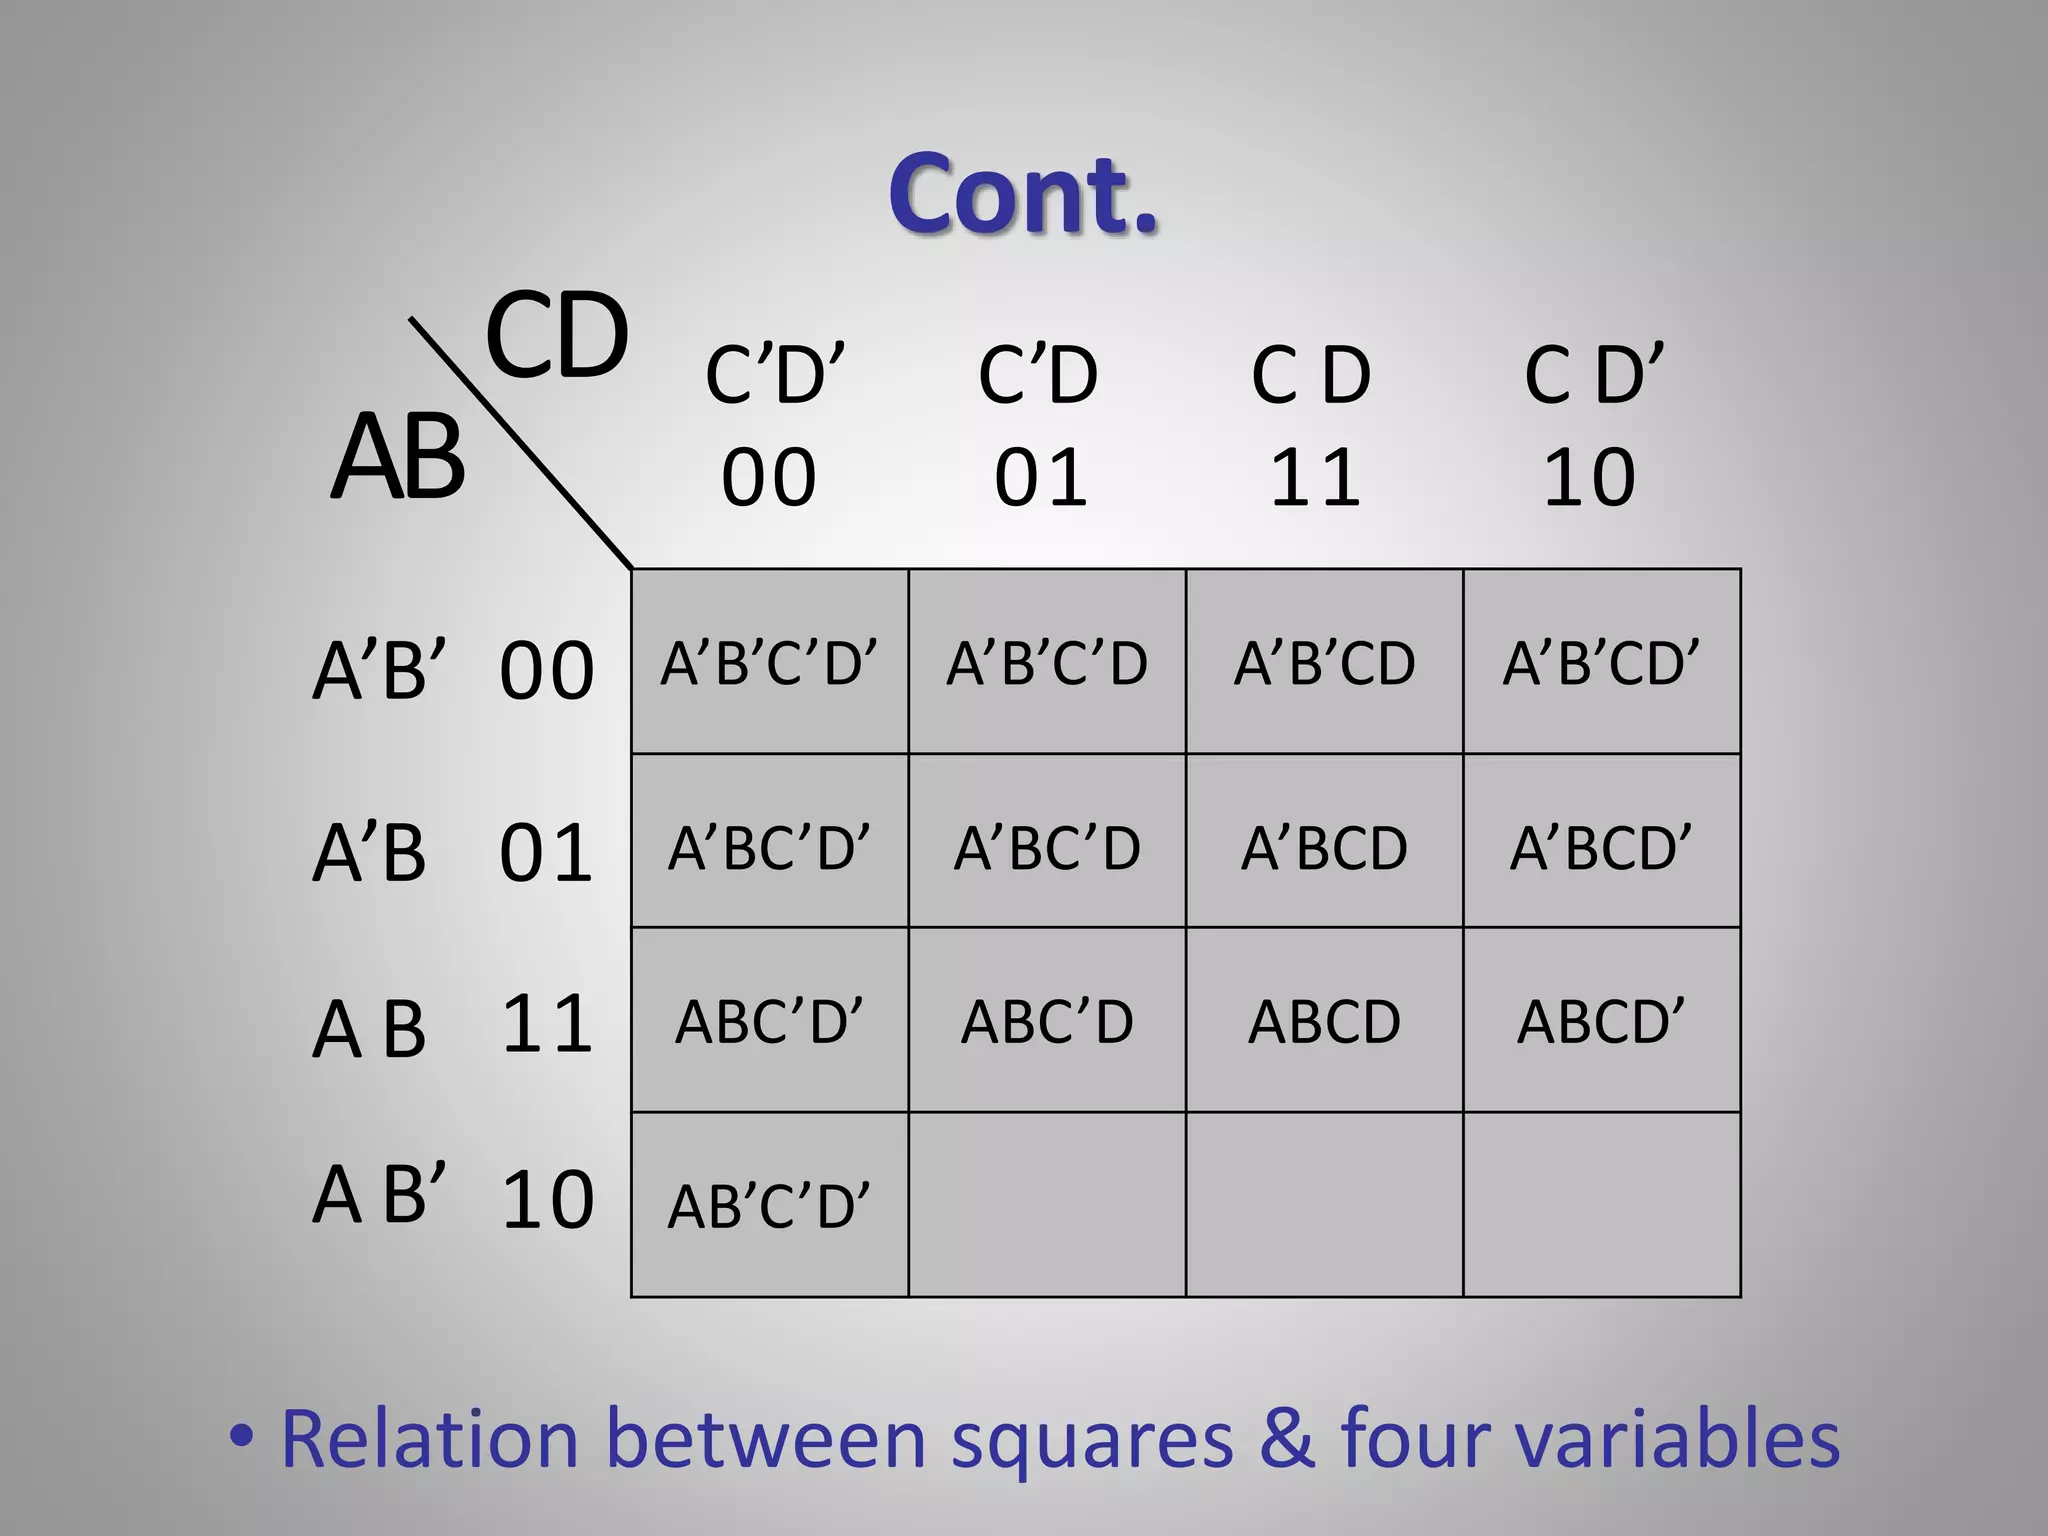
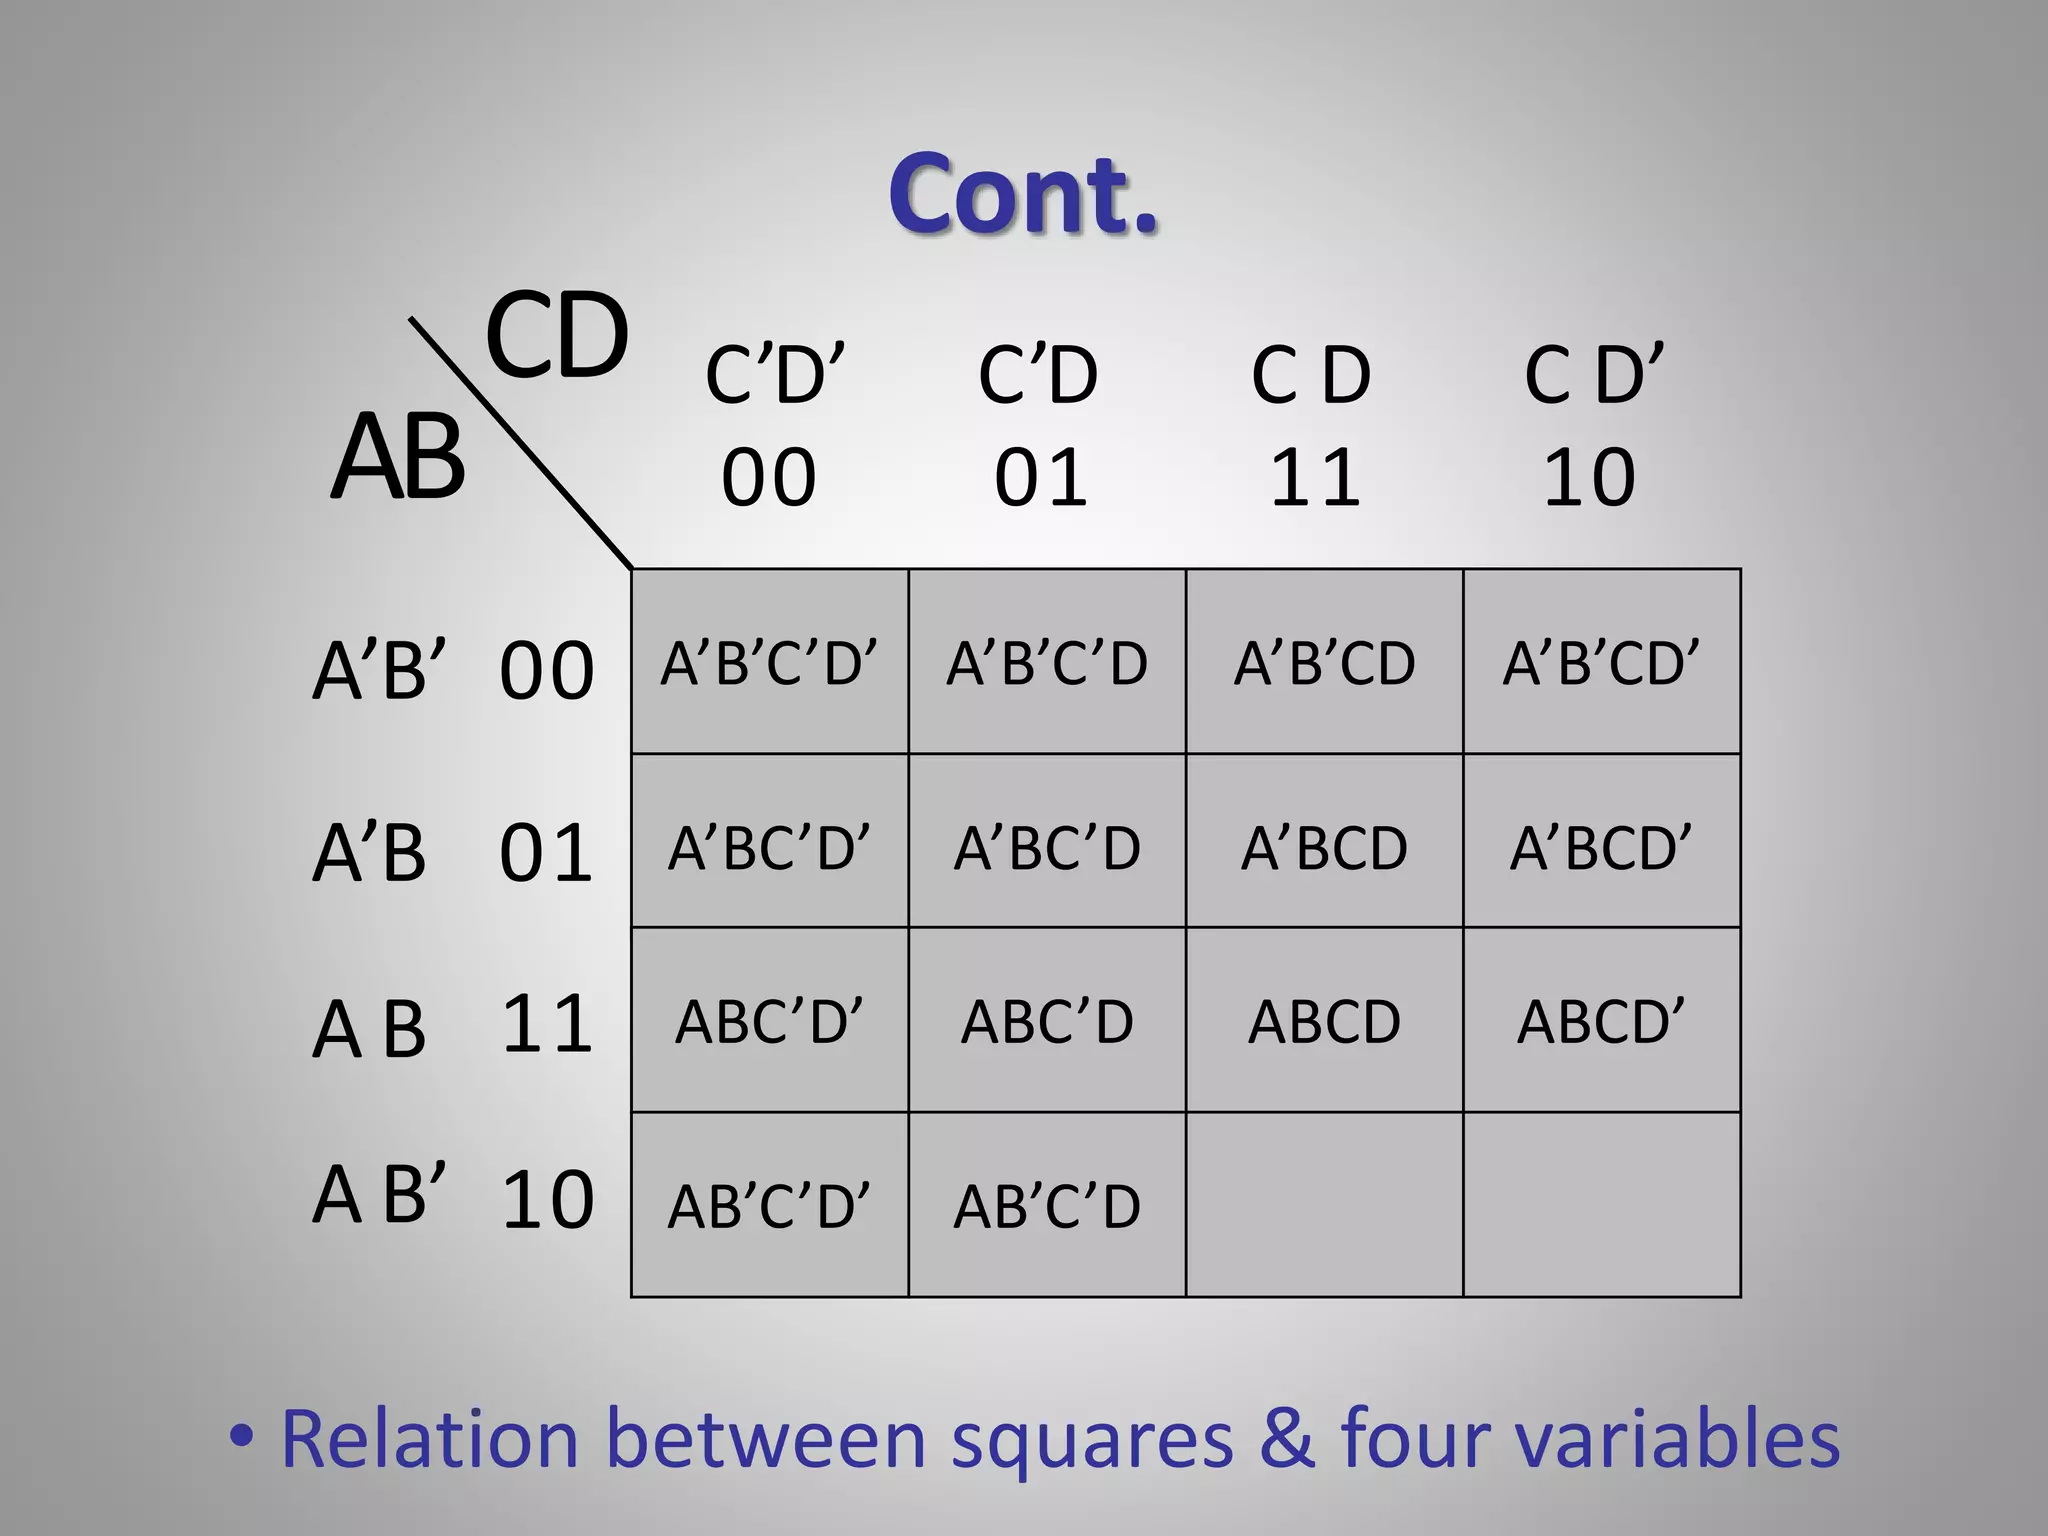
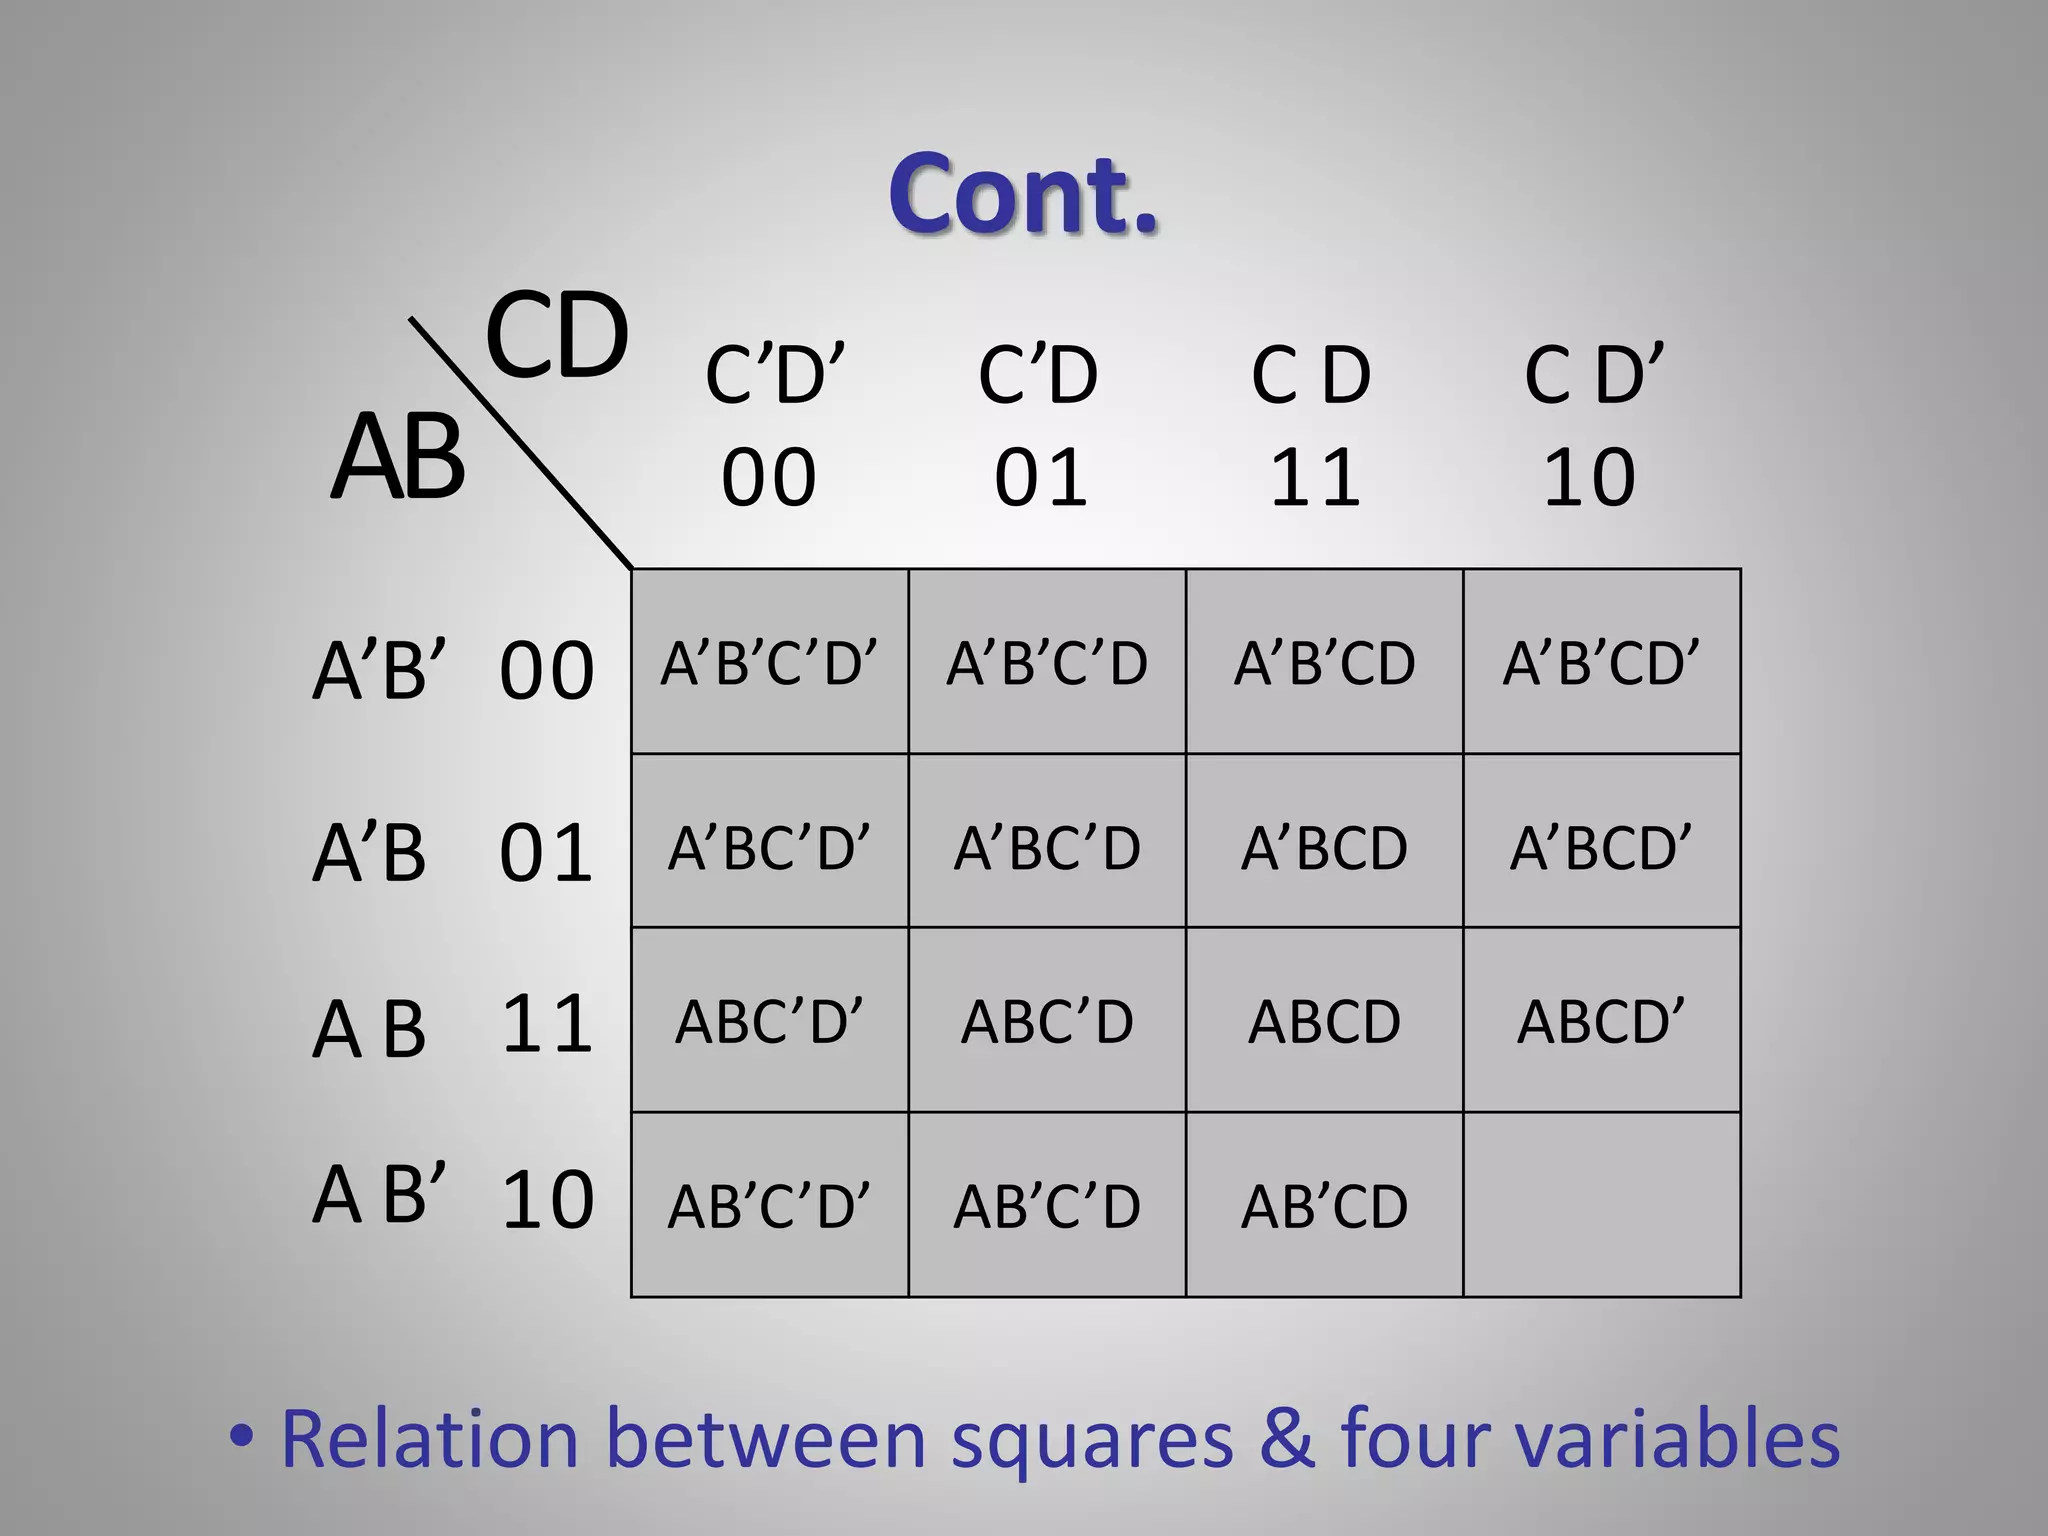
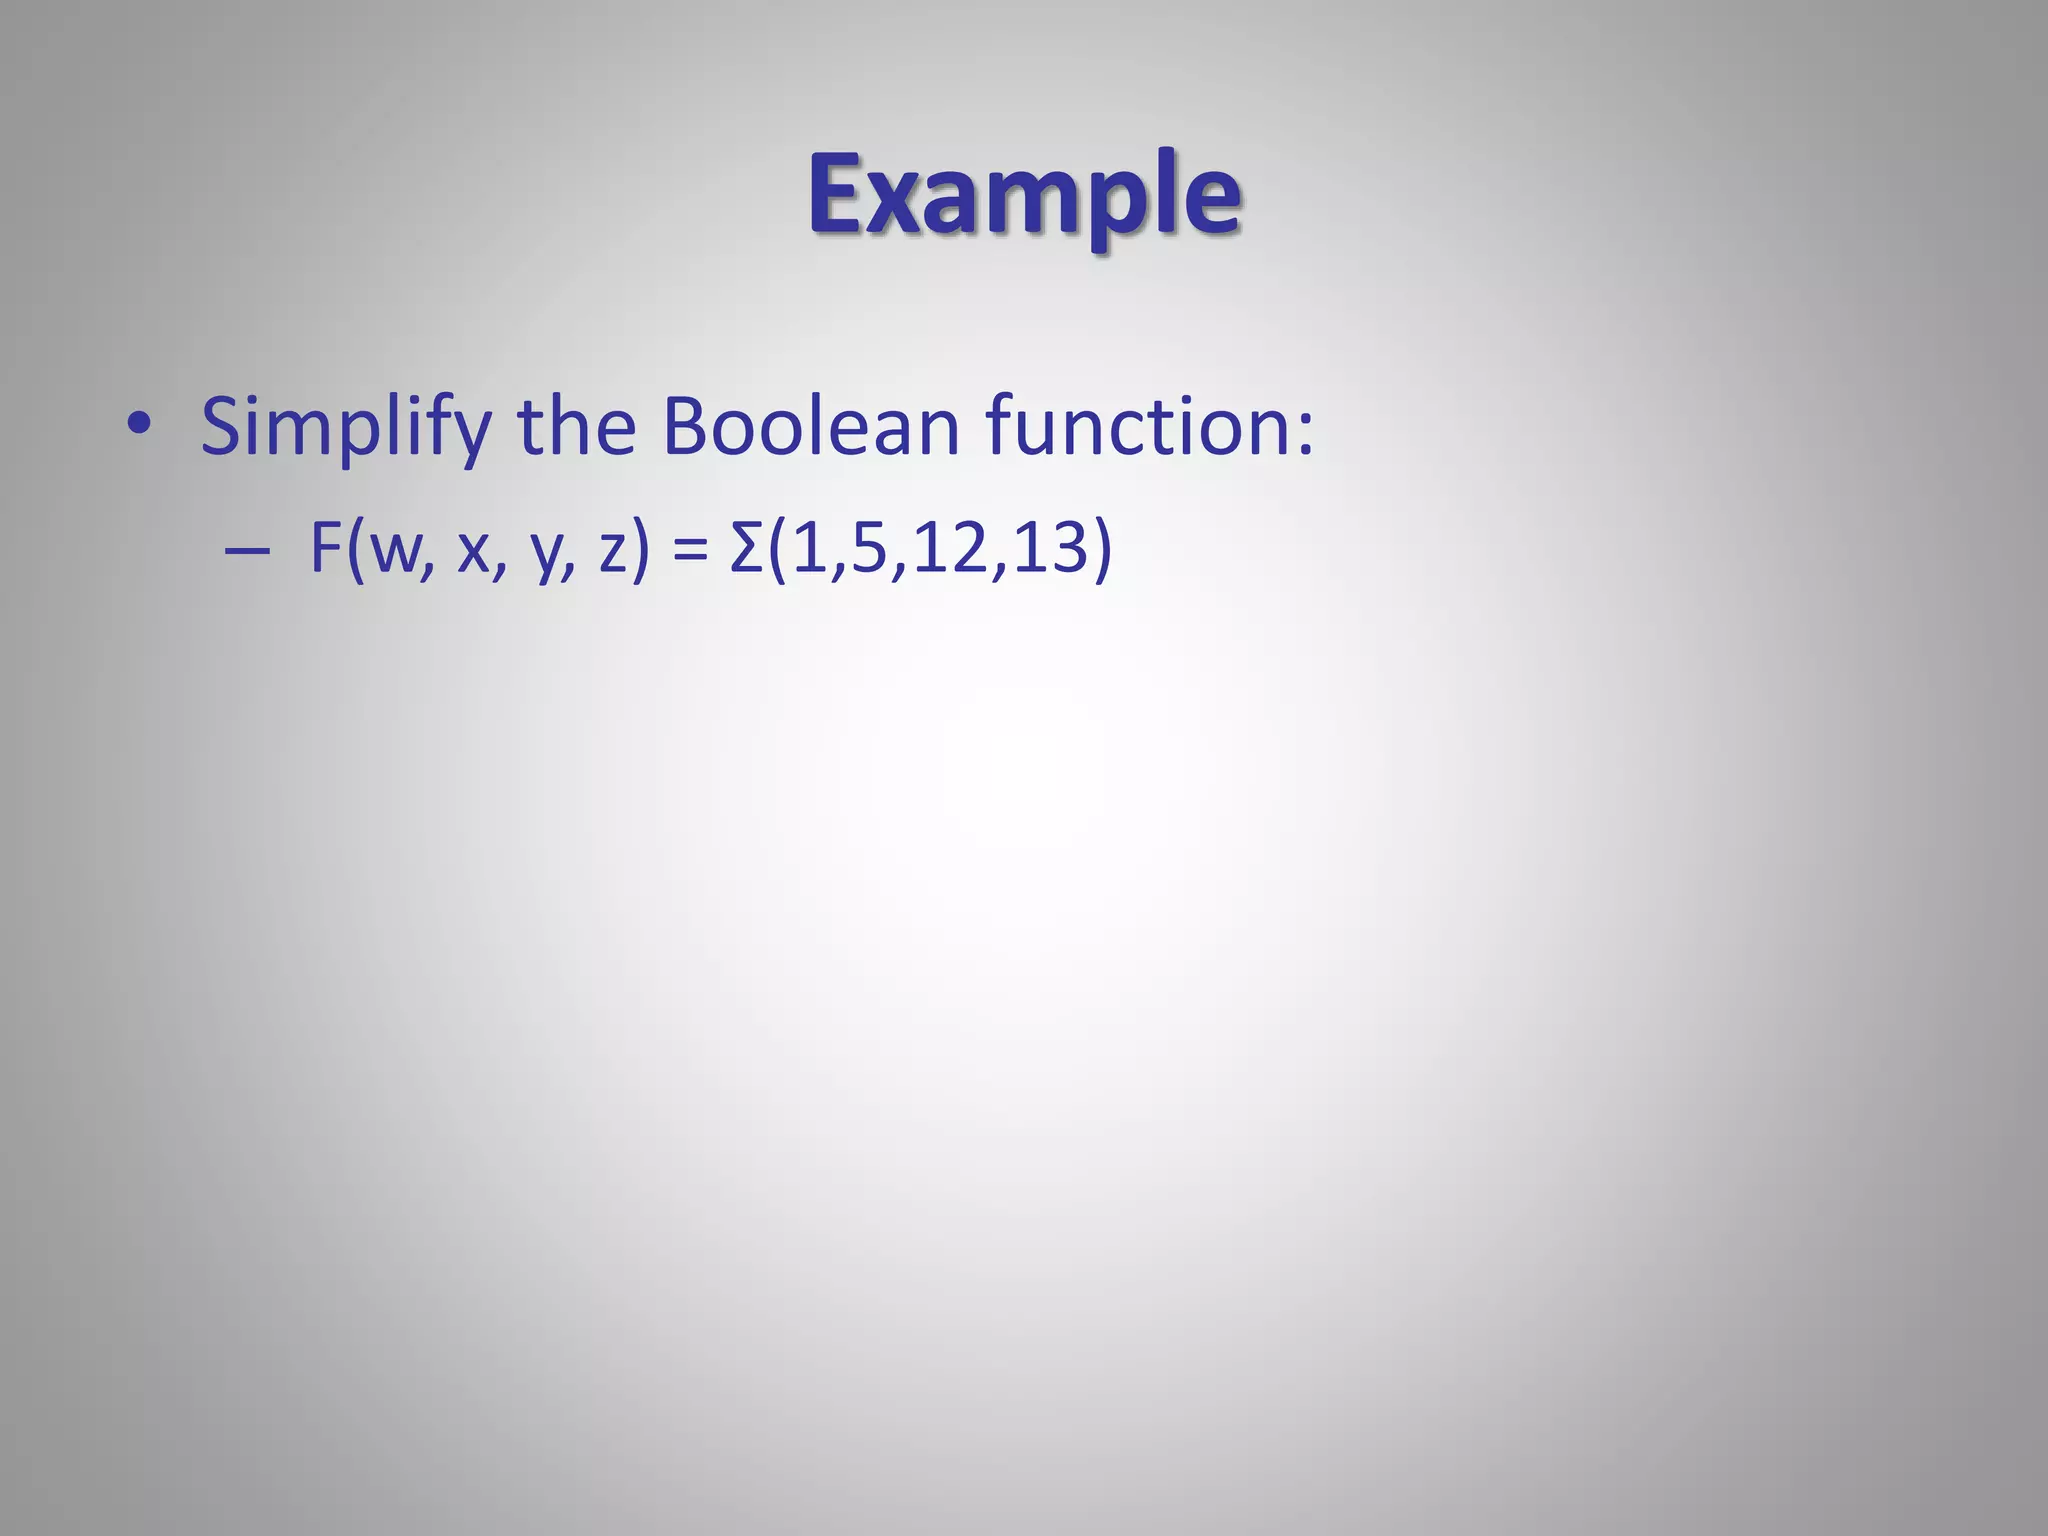
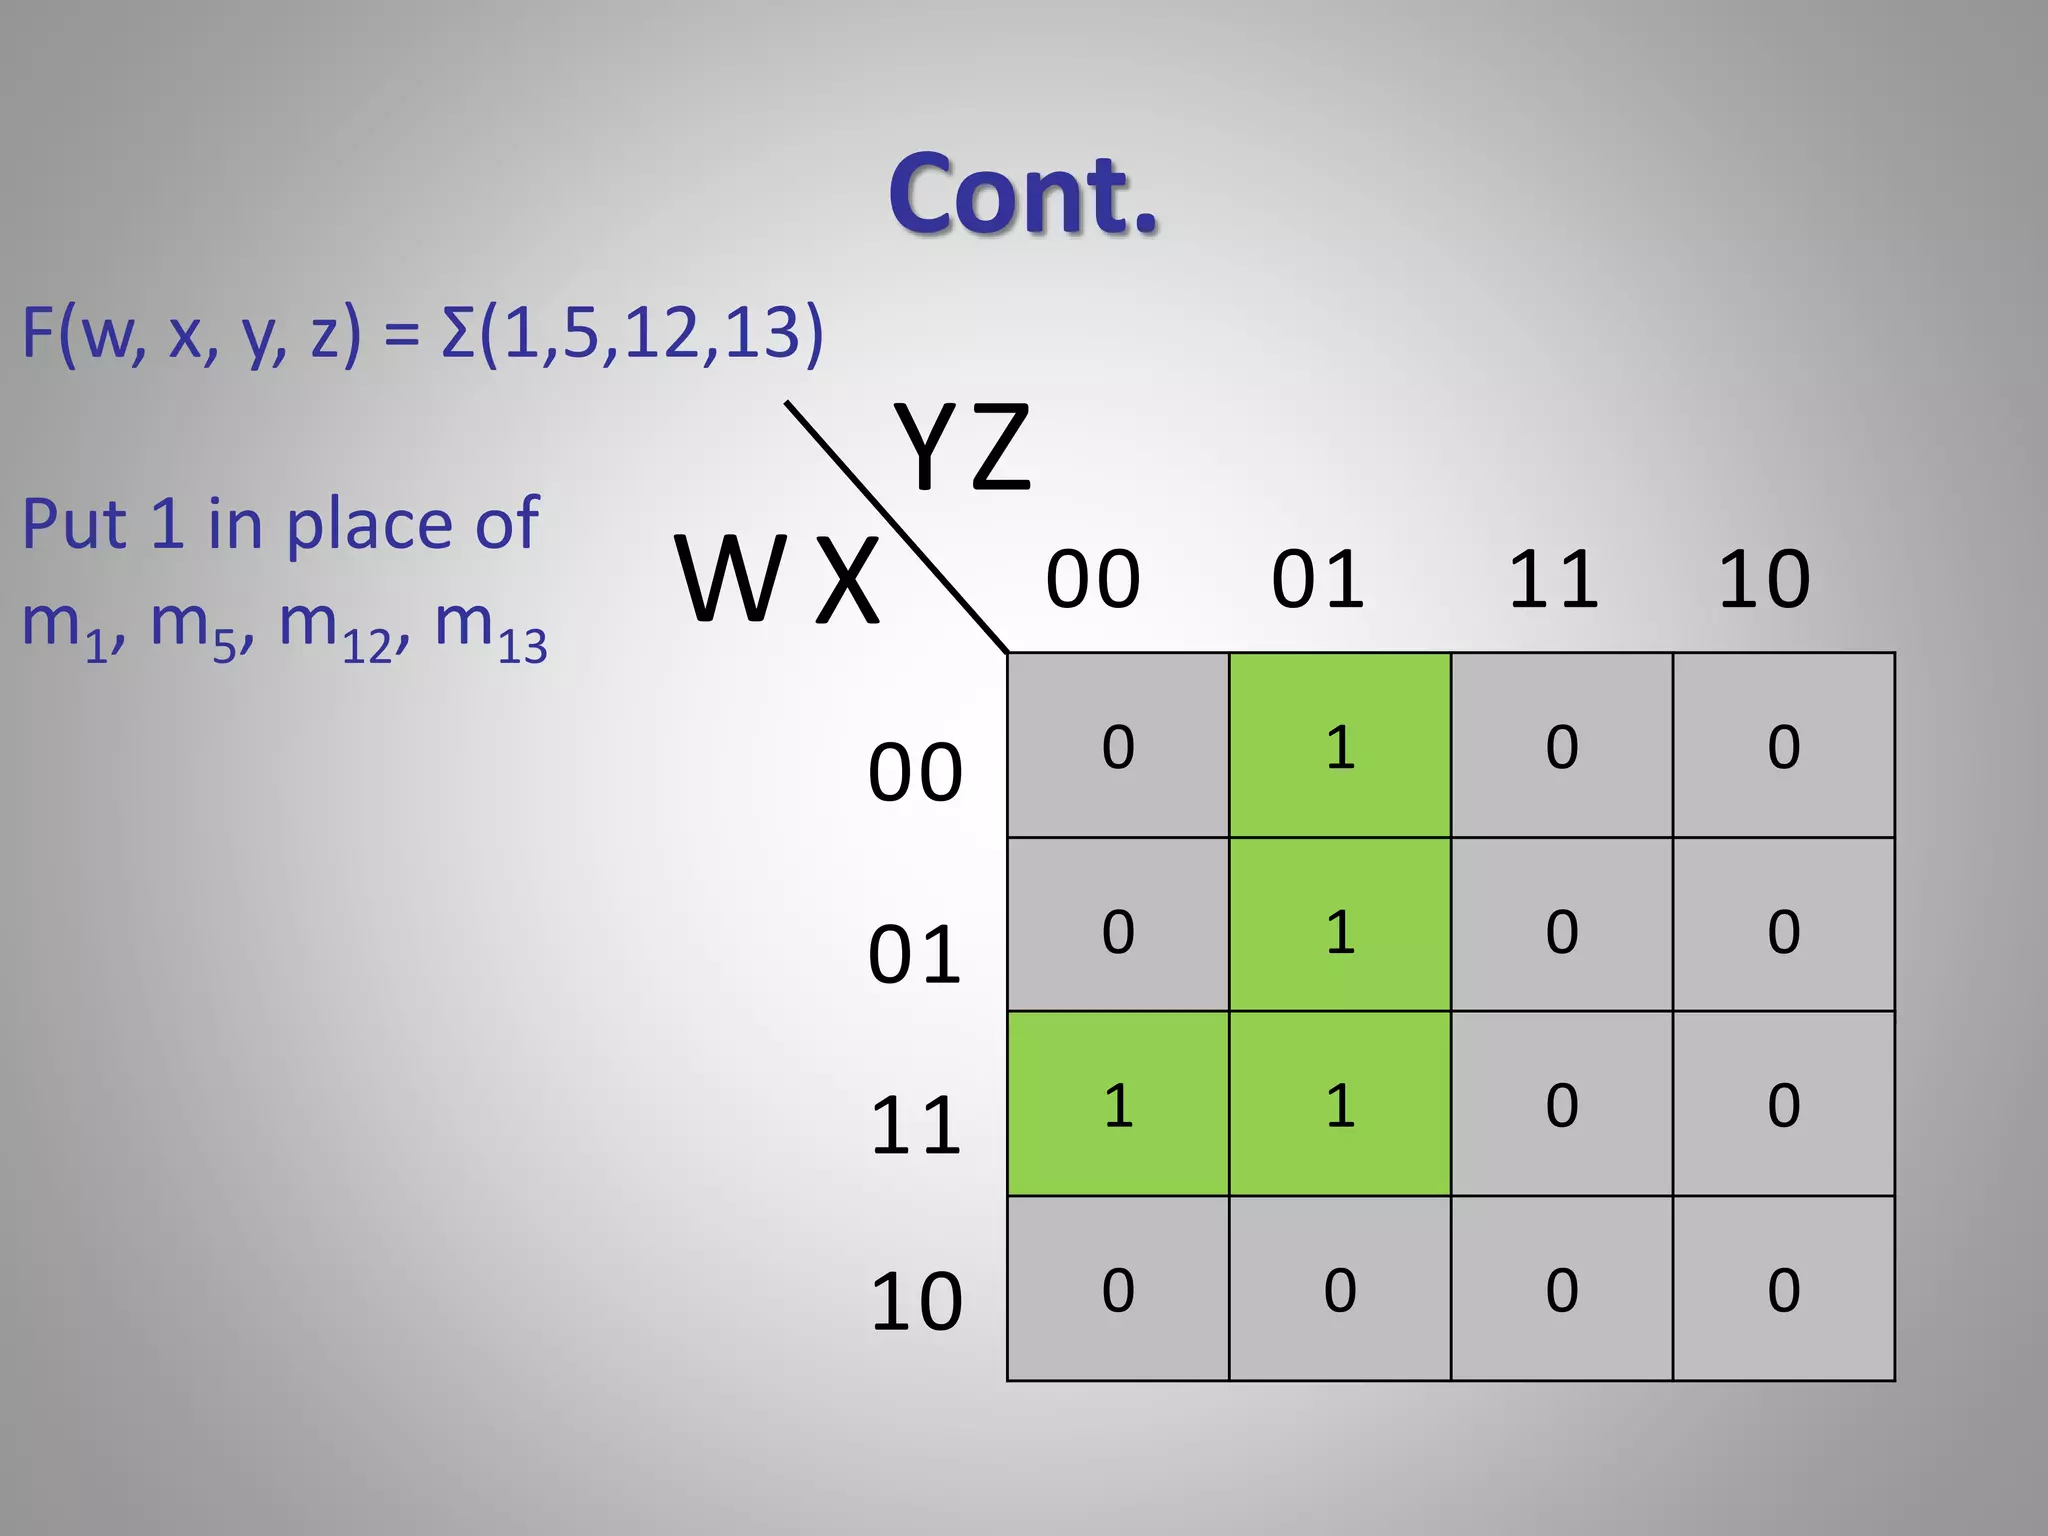
K-map setup for four variables, relationship of cells with binary variables, and example simplifications using K-maps.
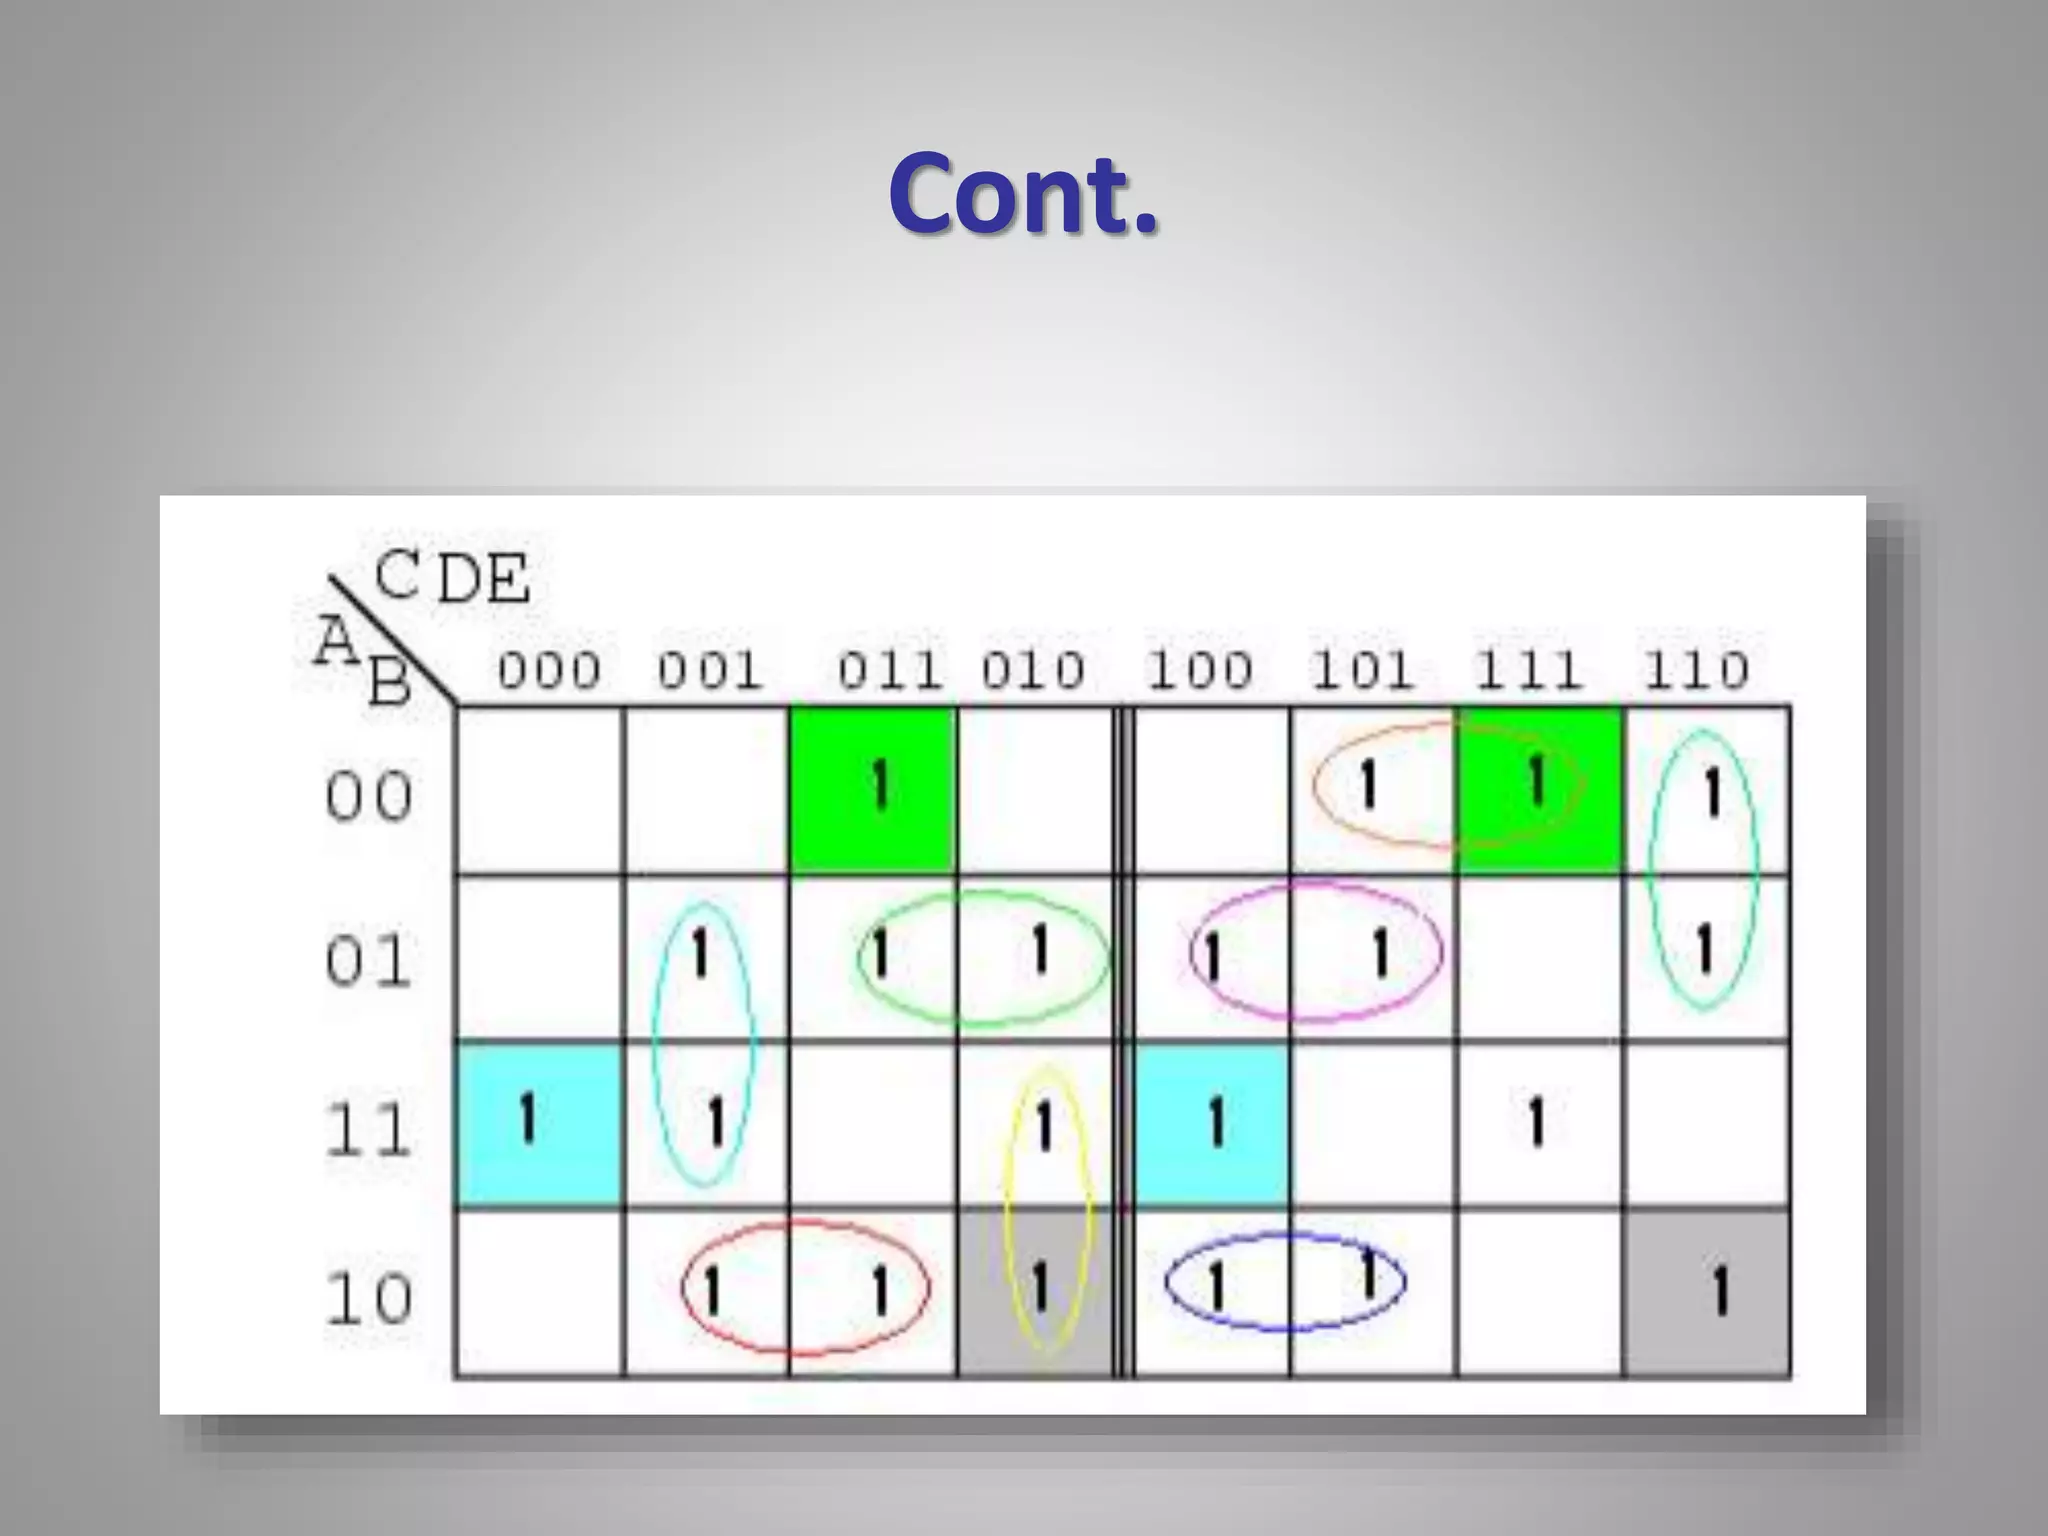
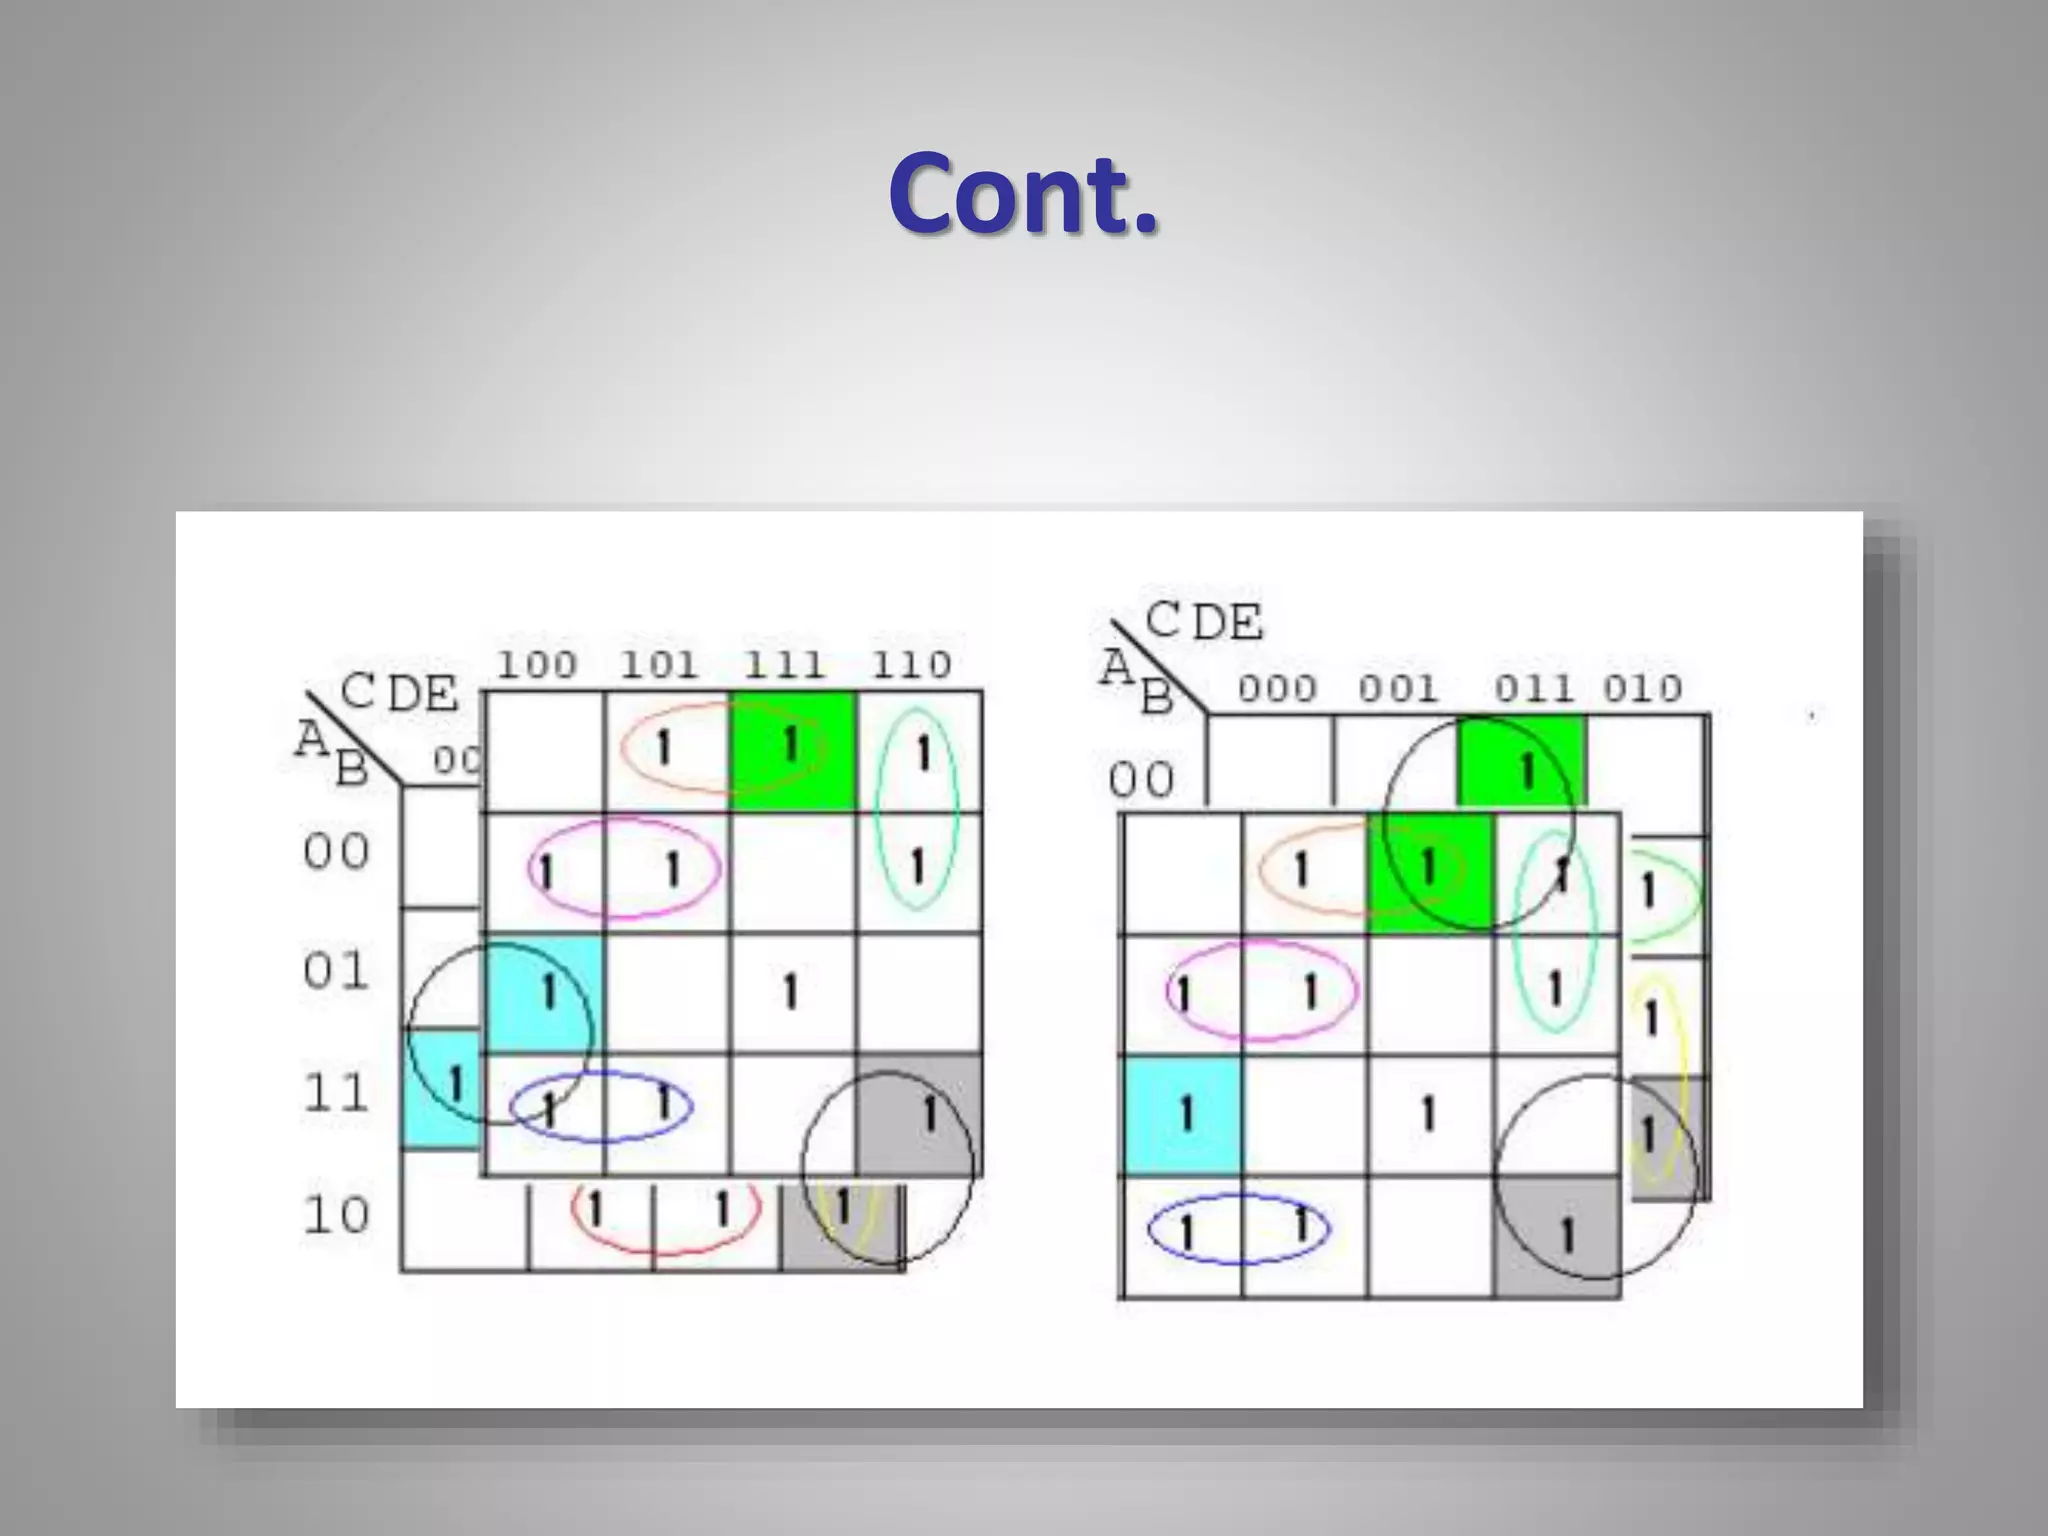
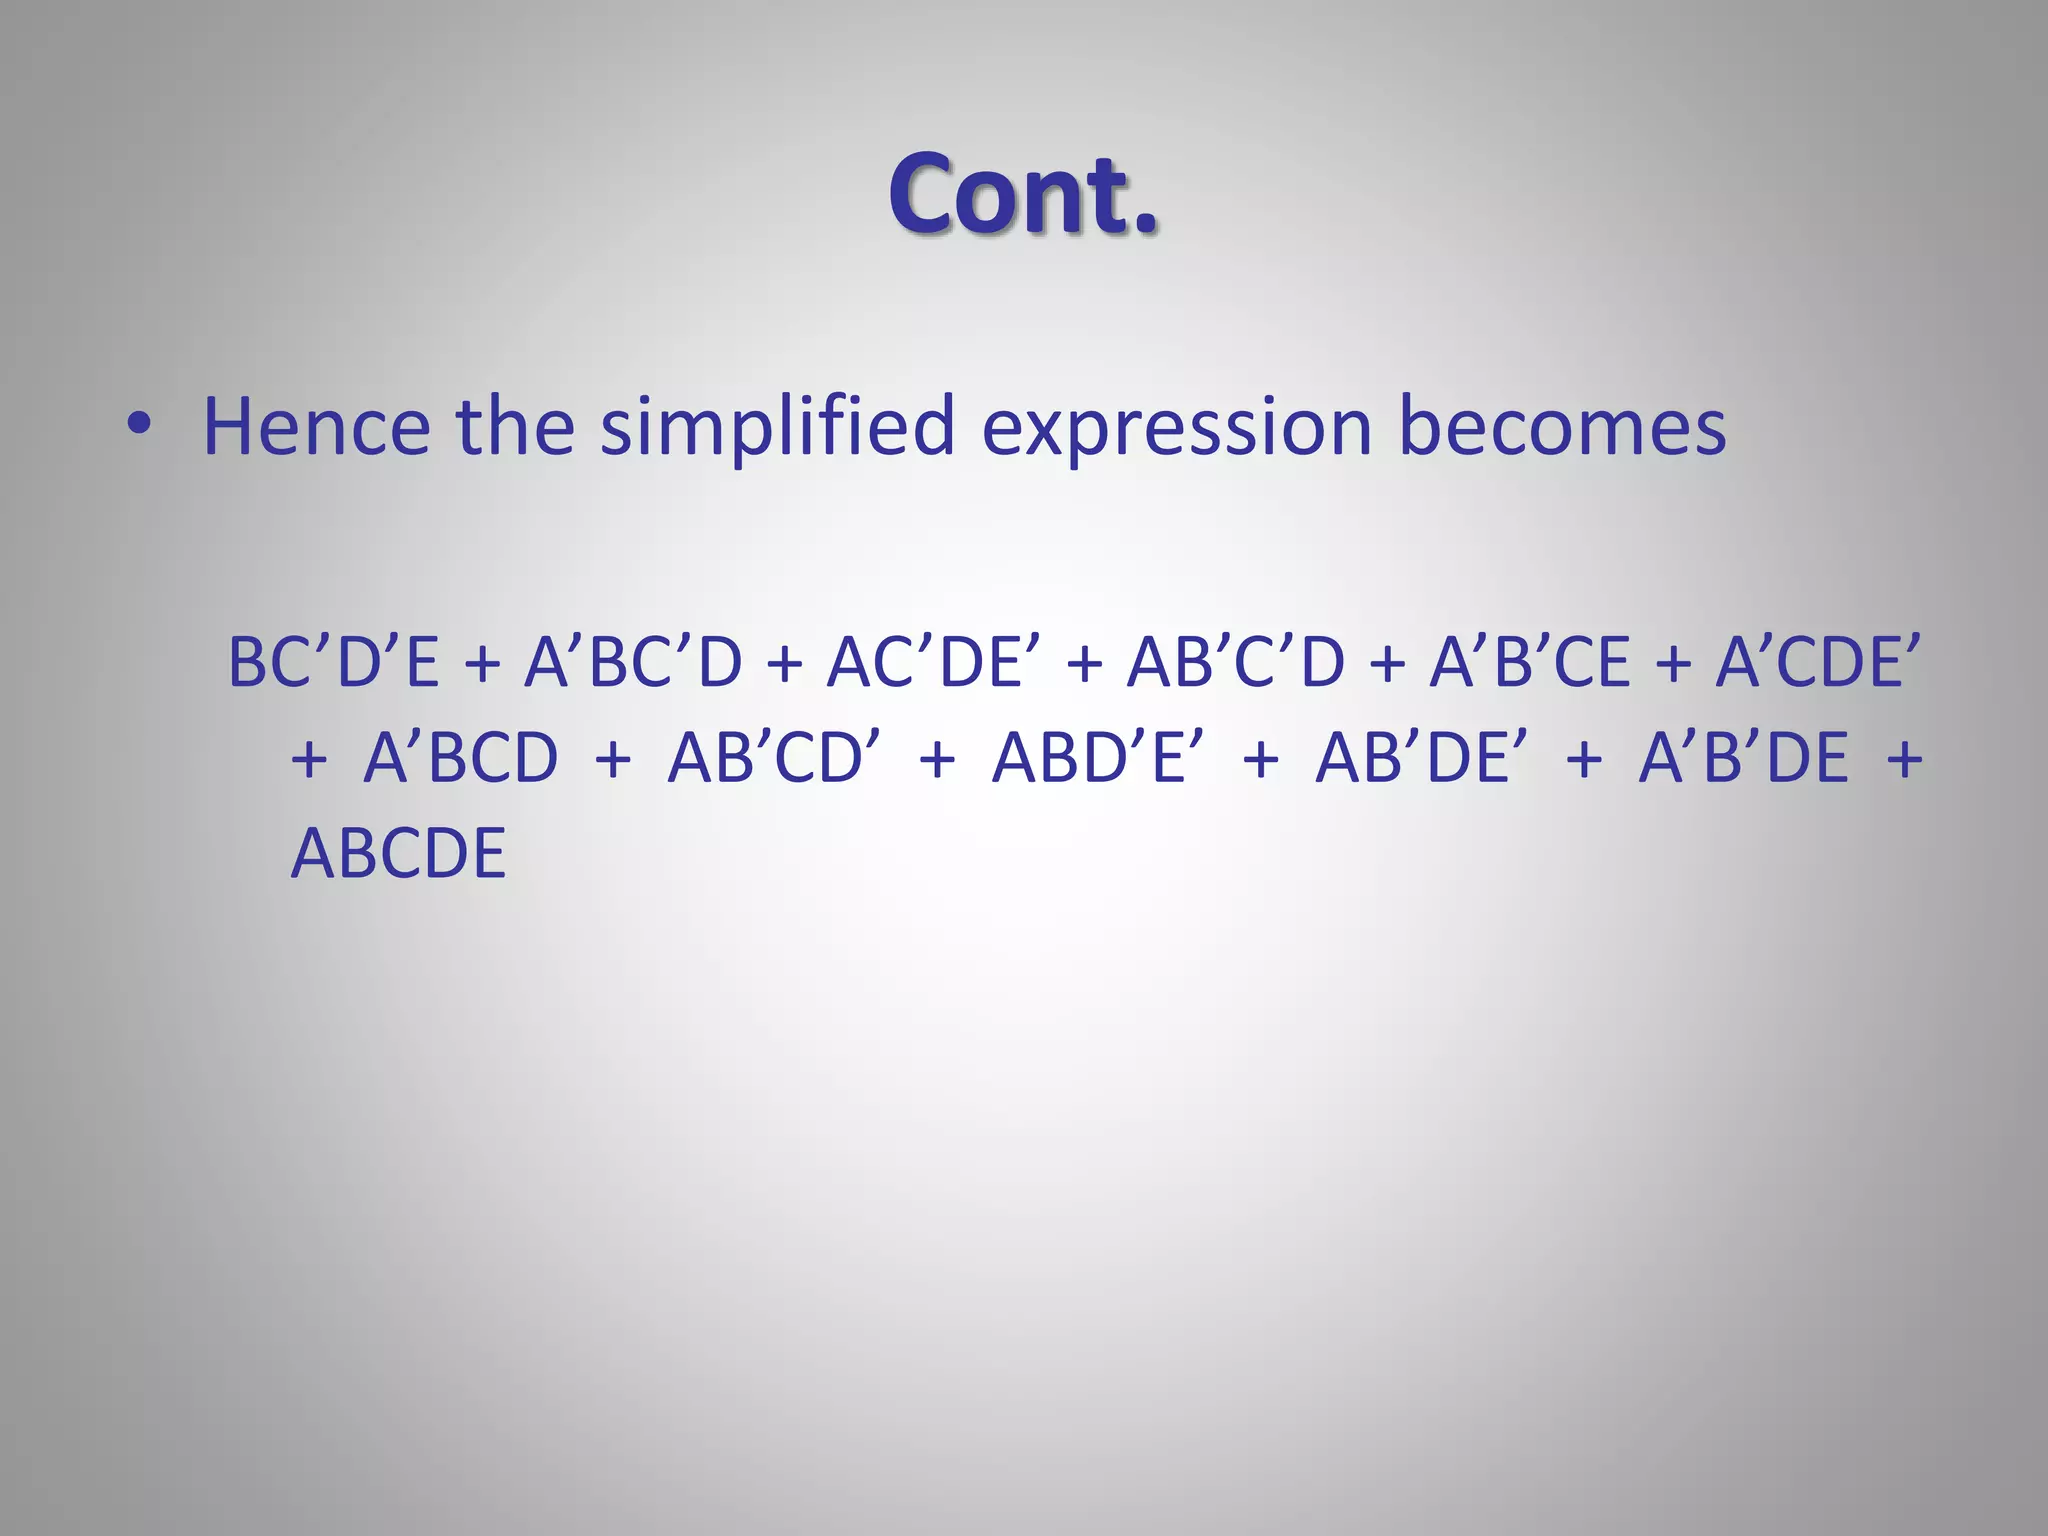
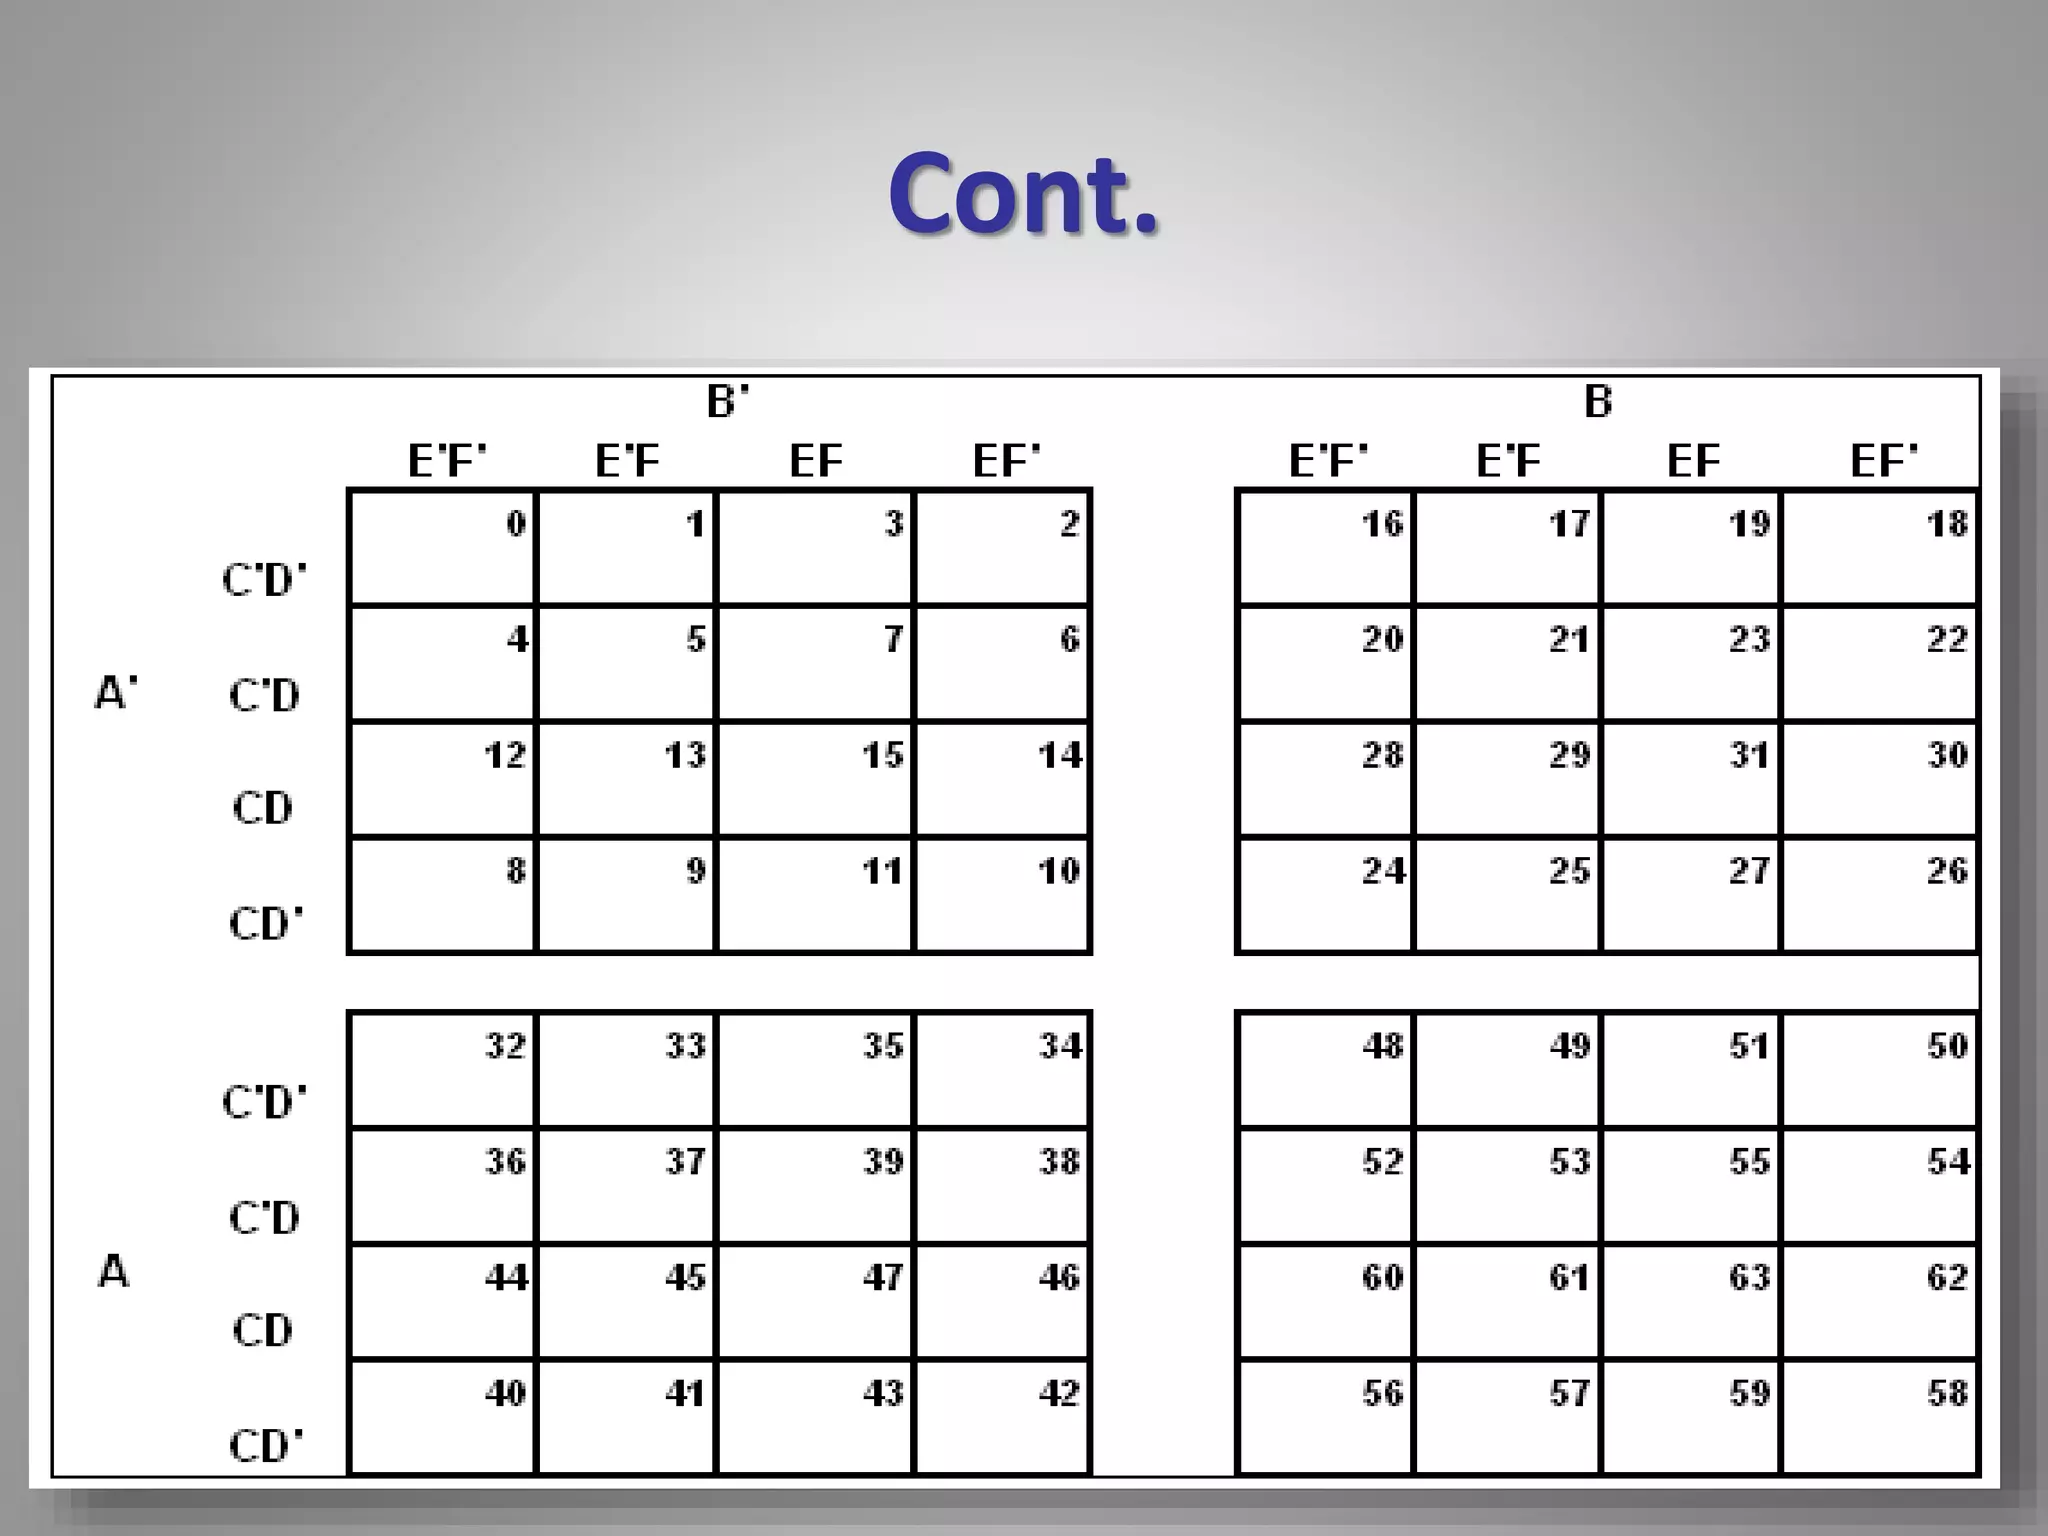
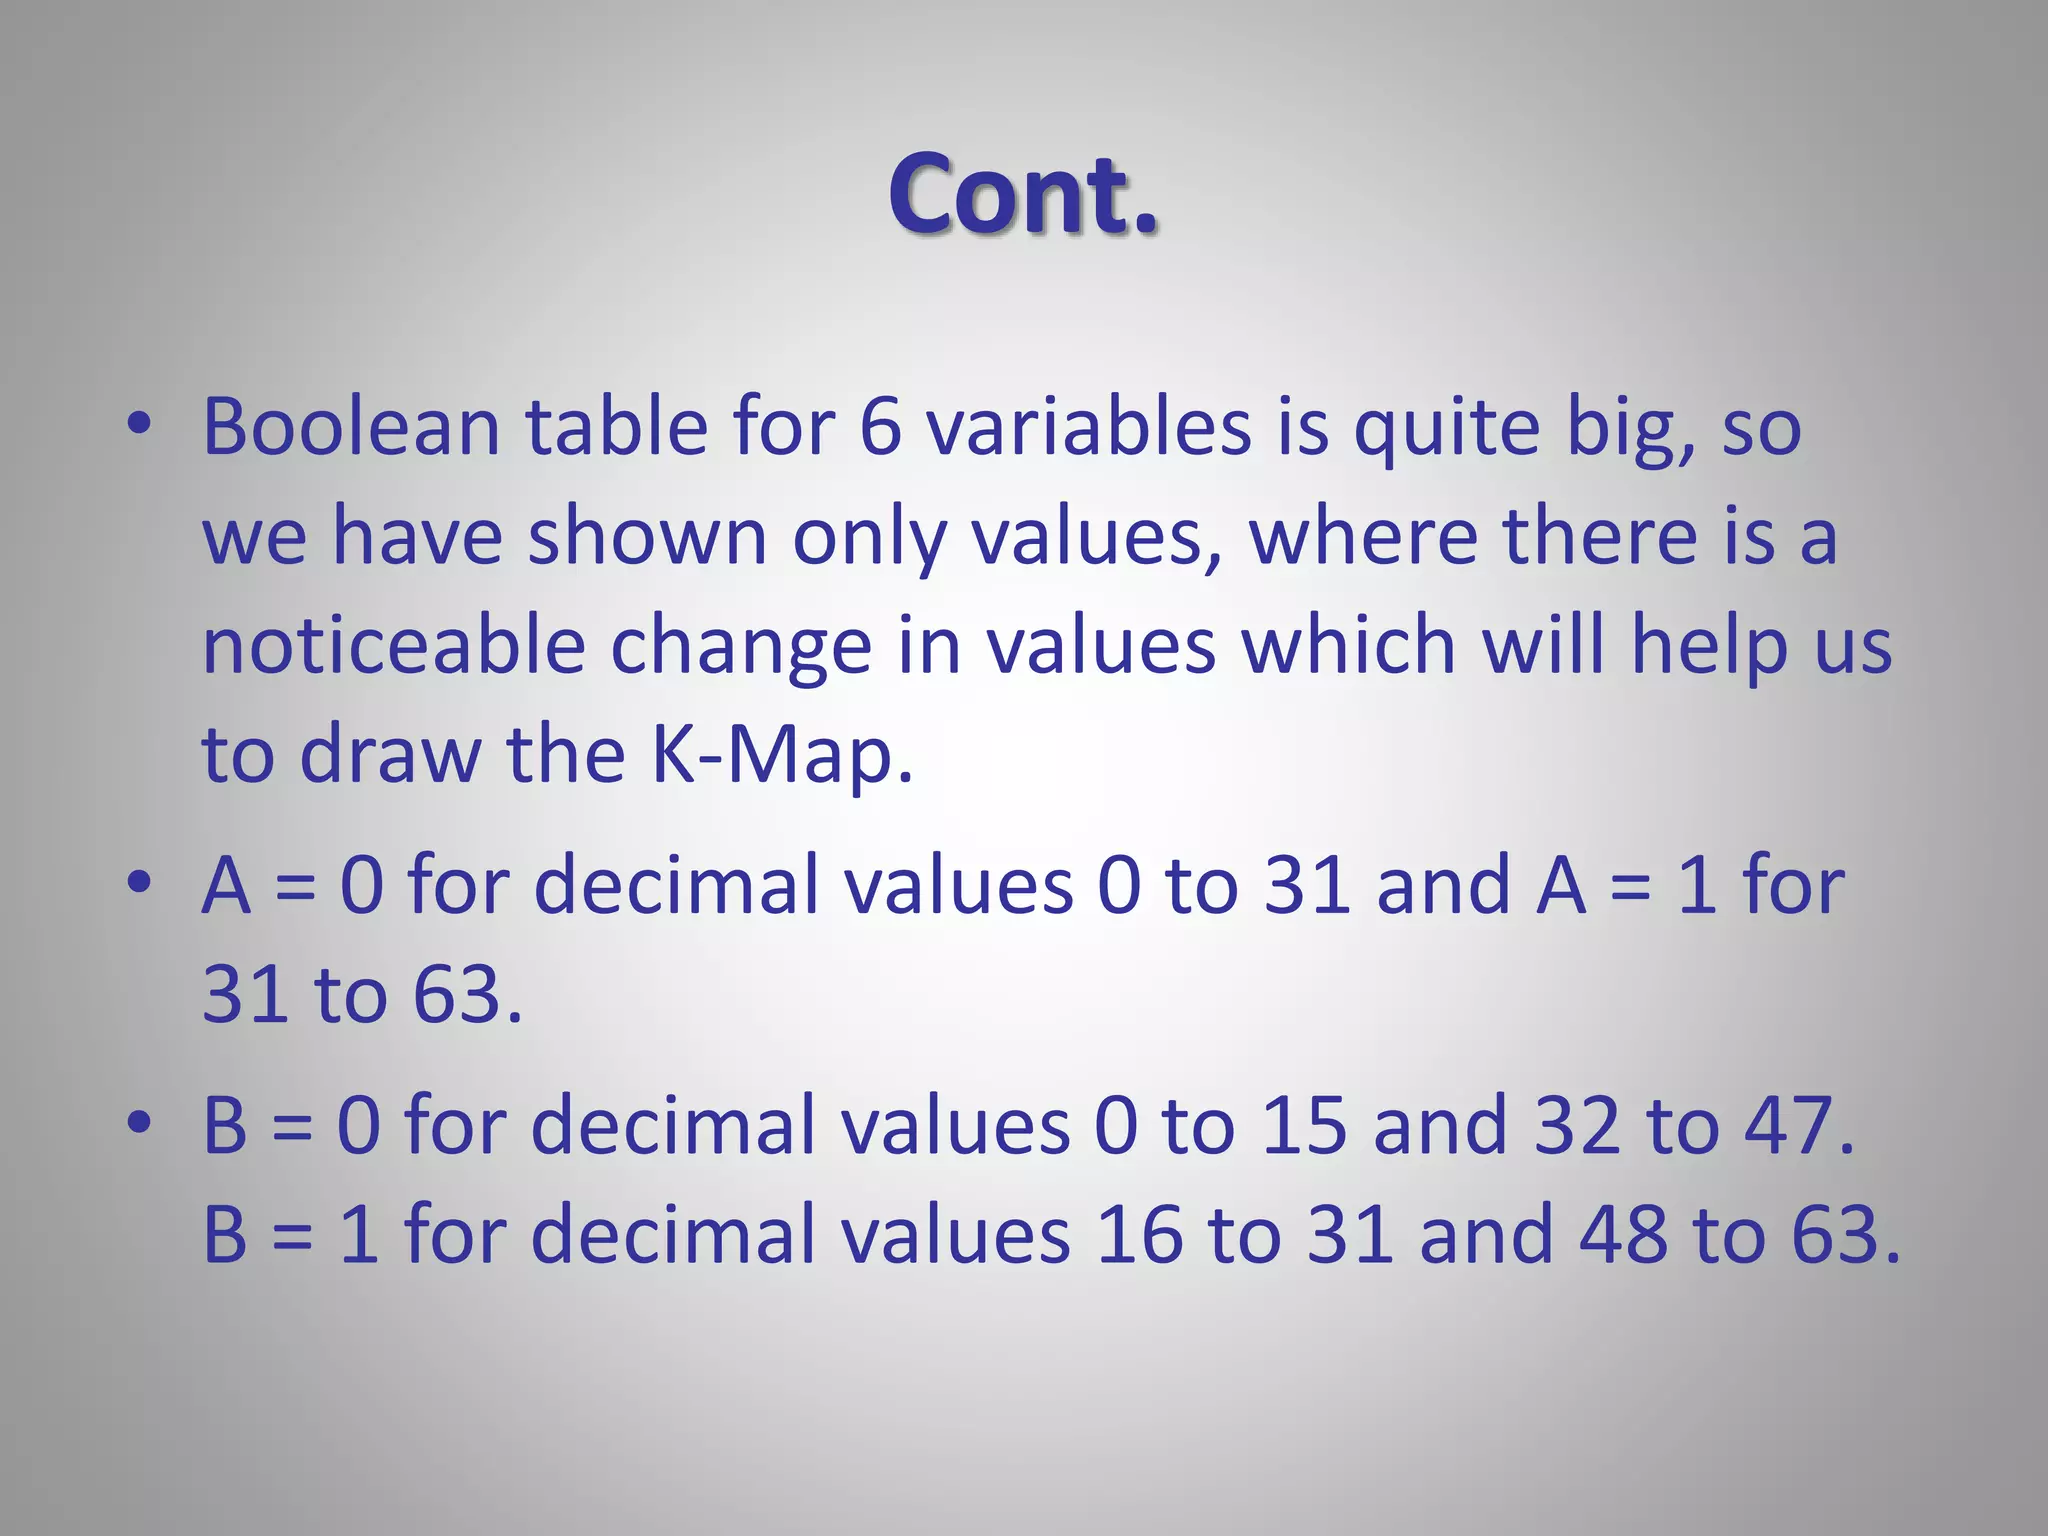
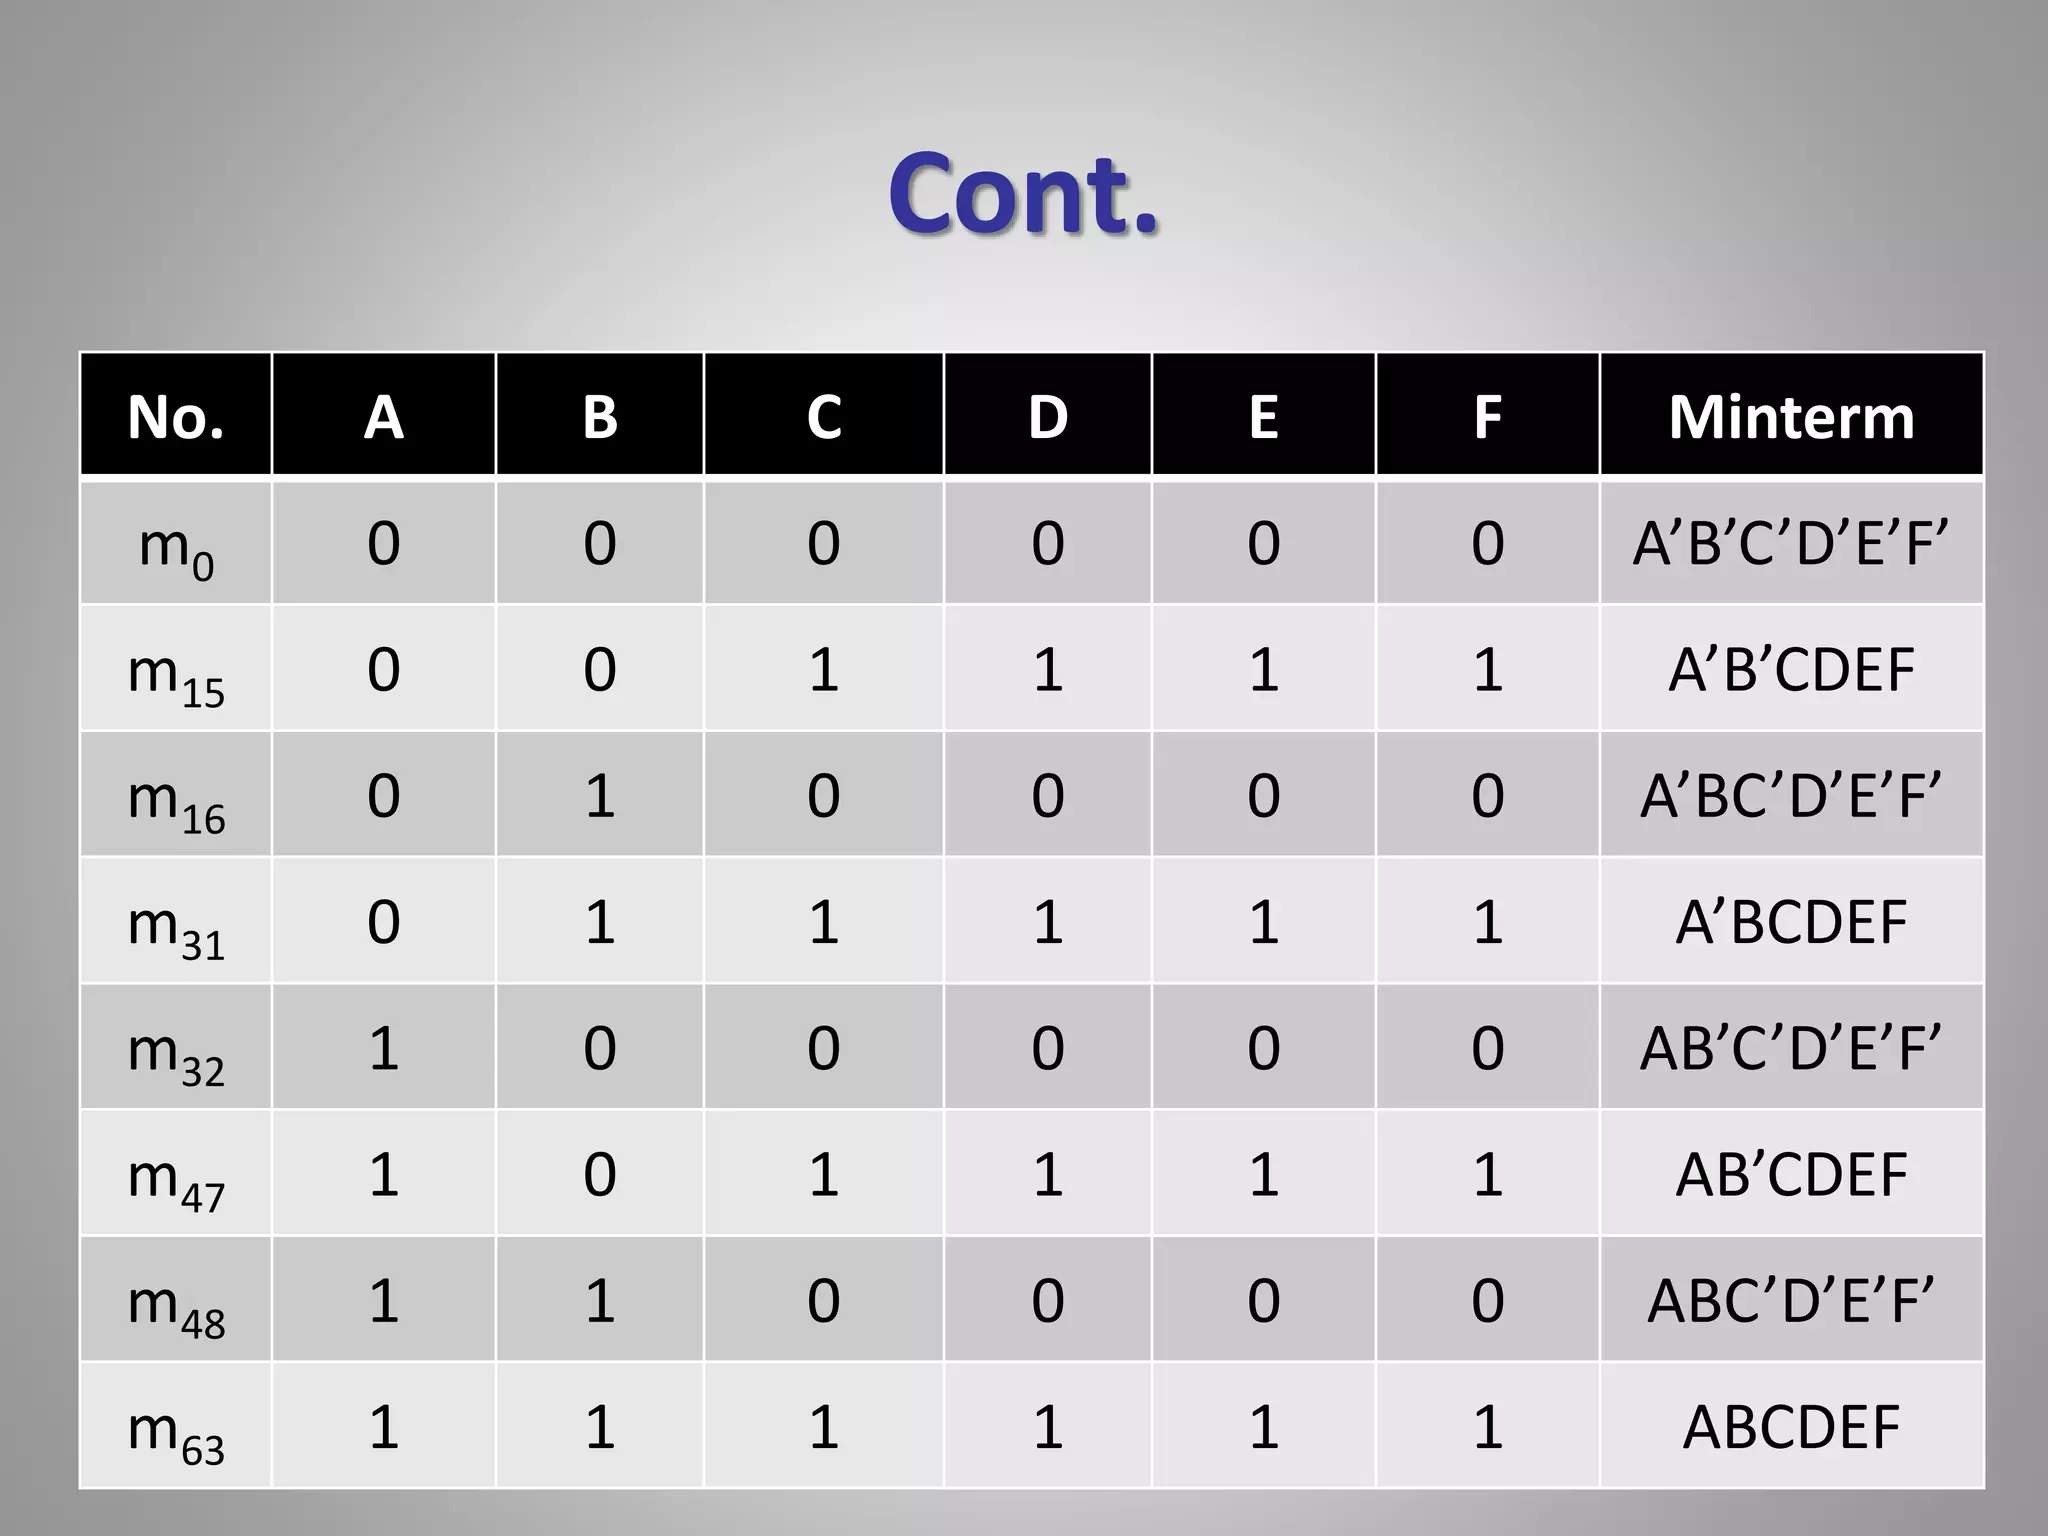
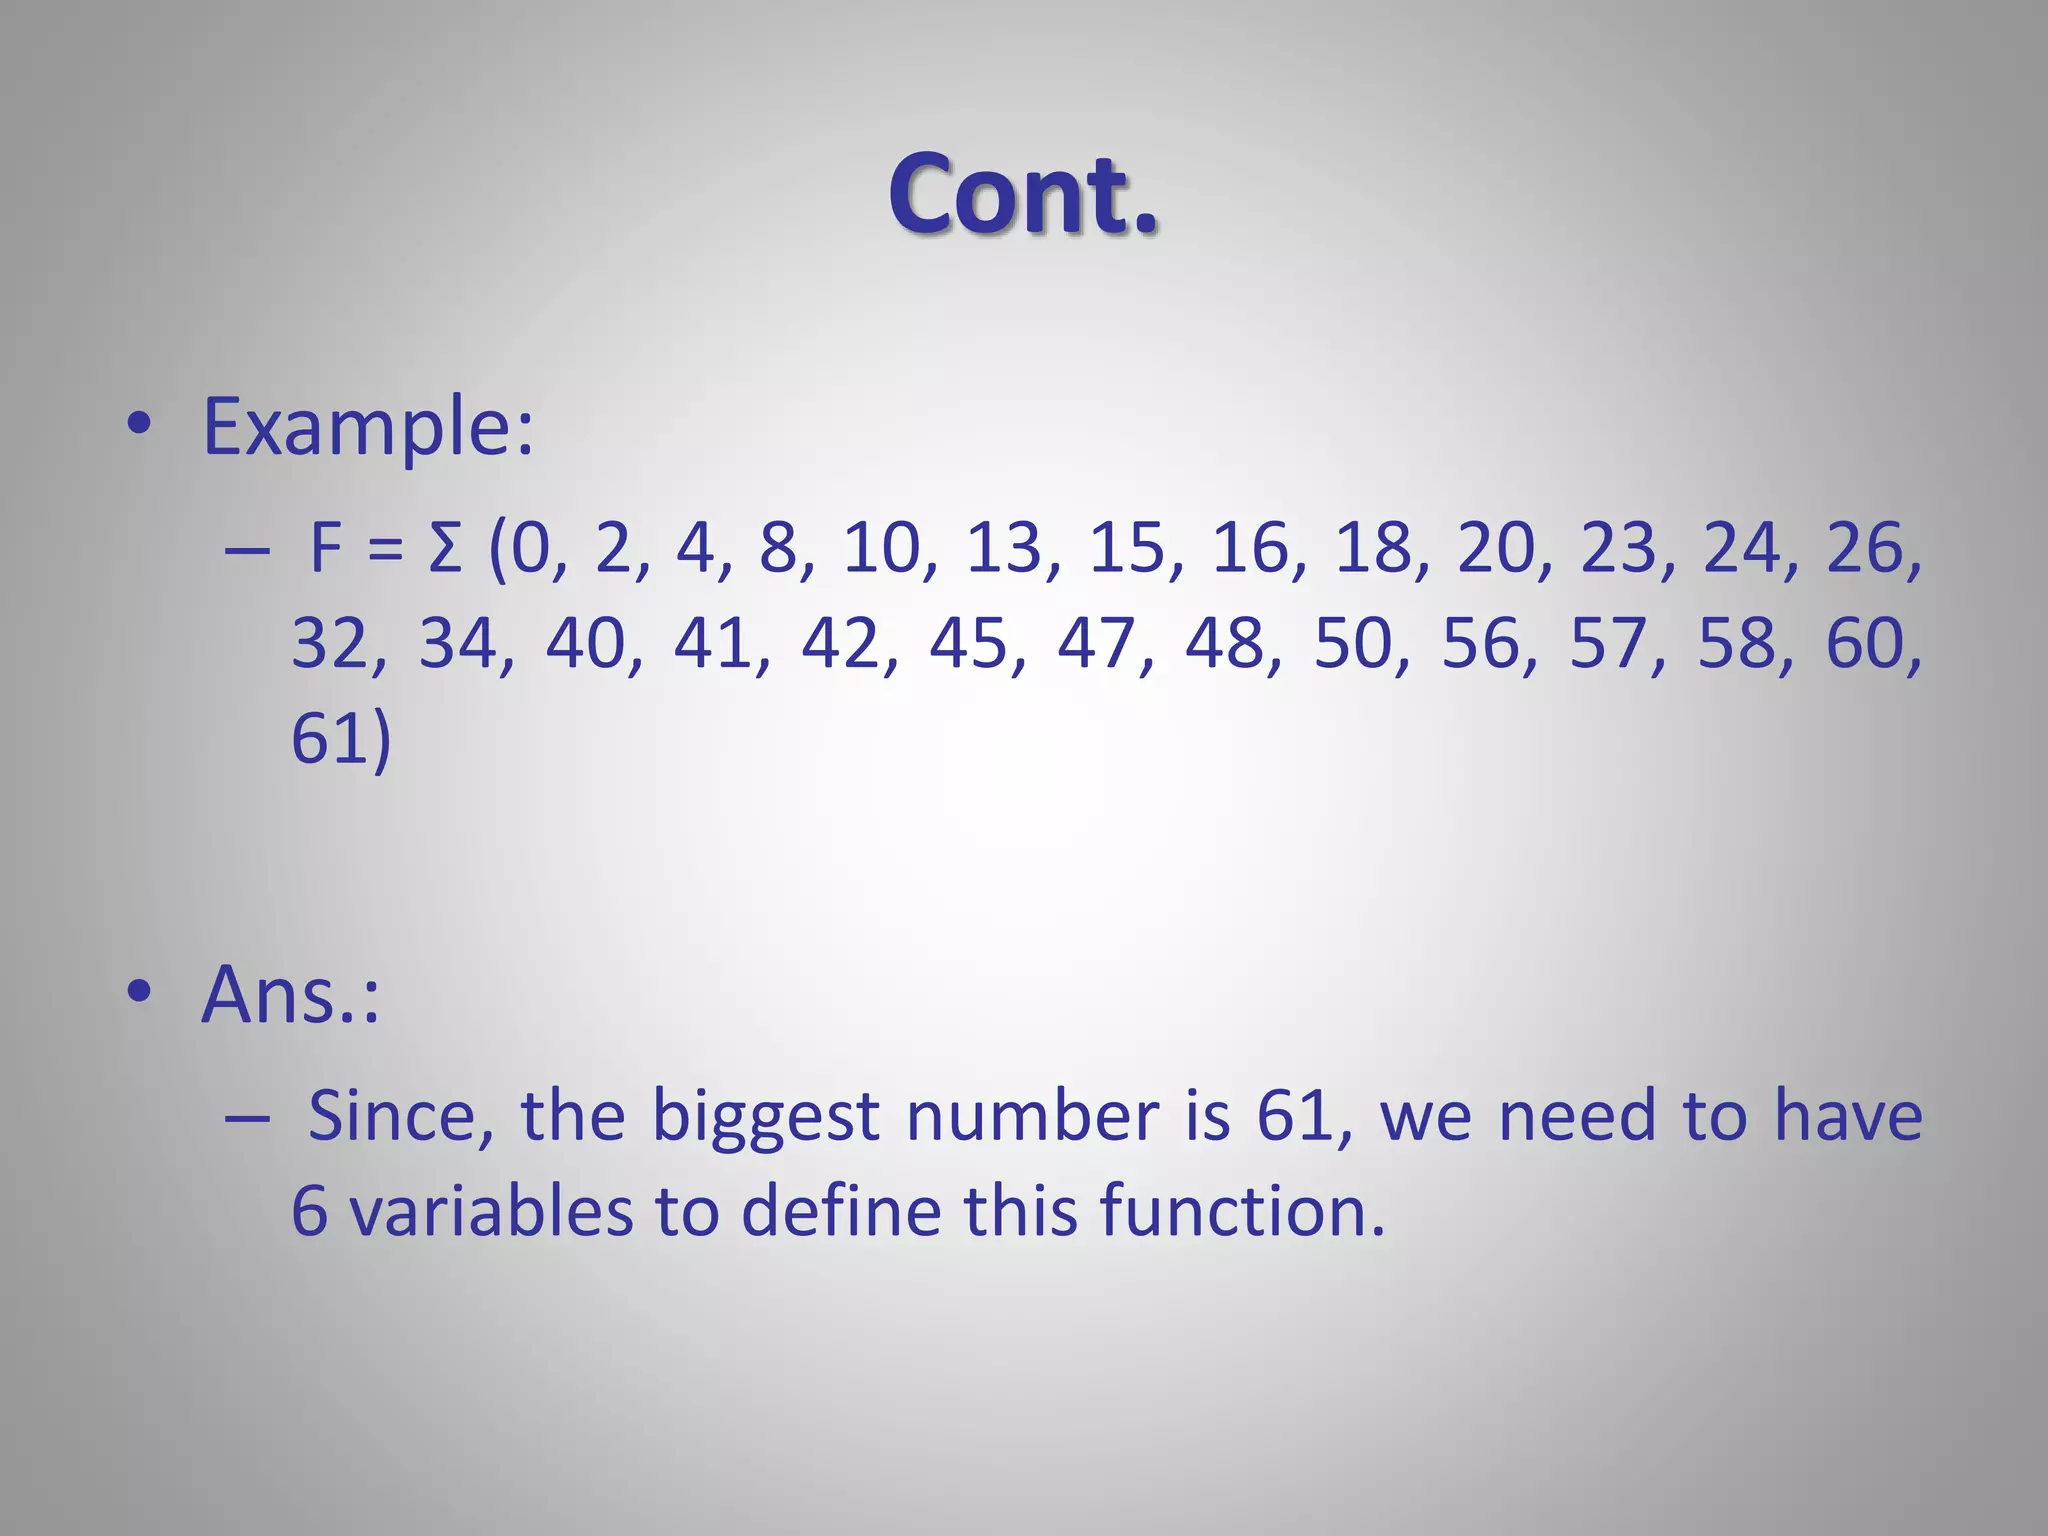
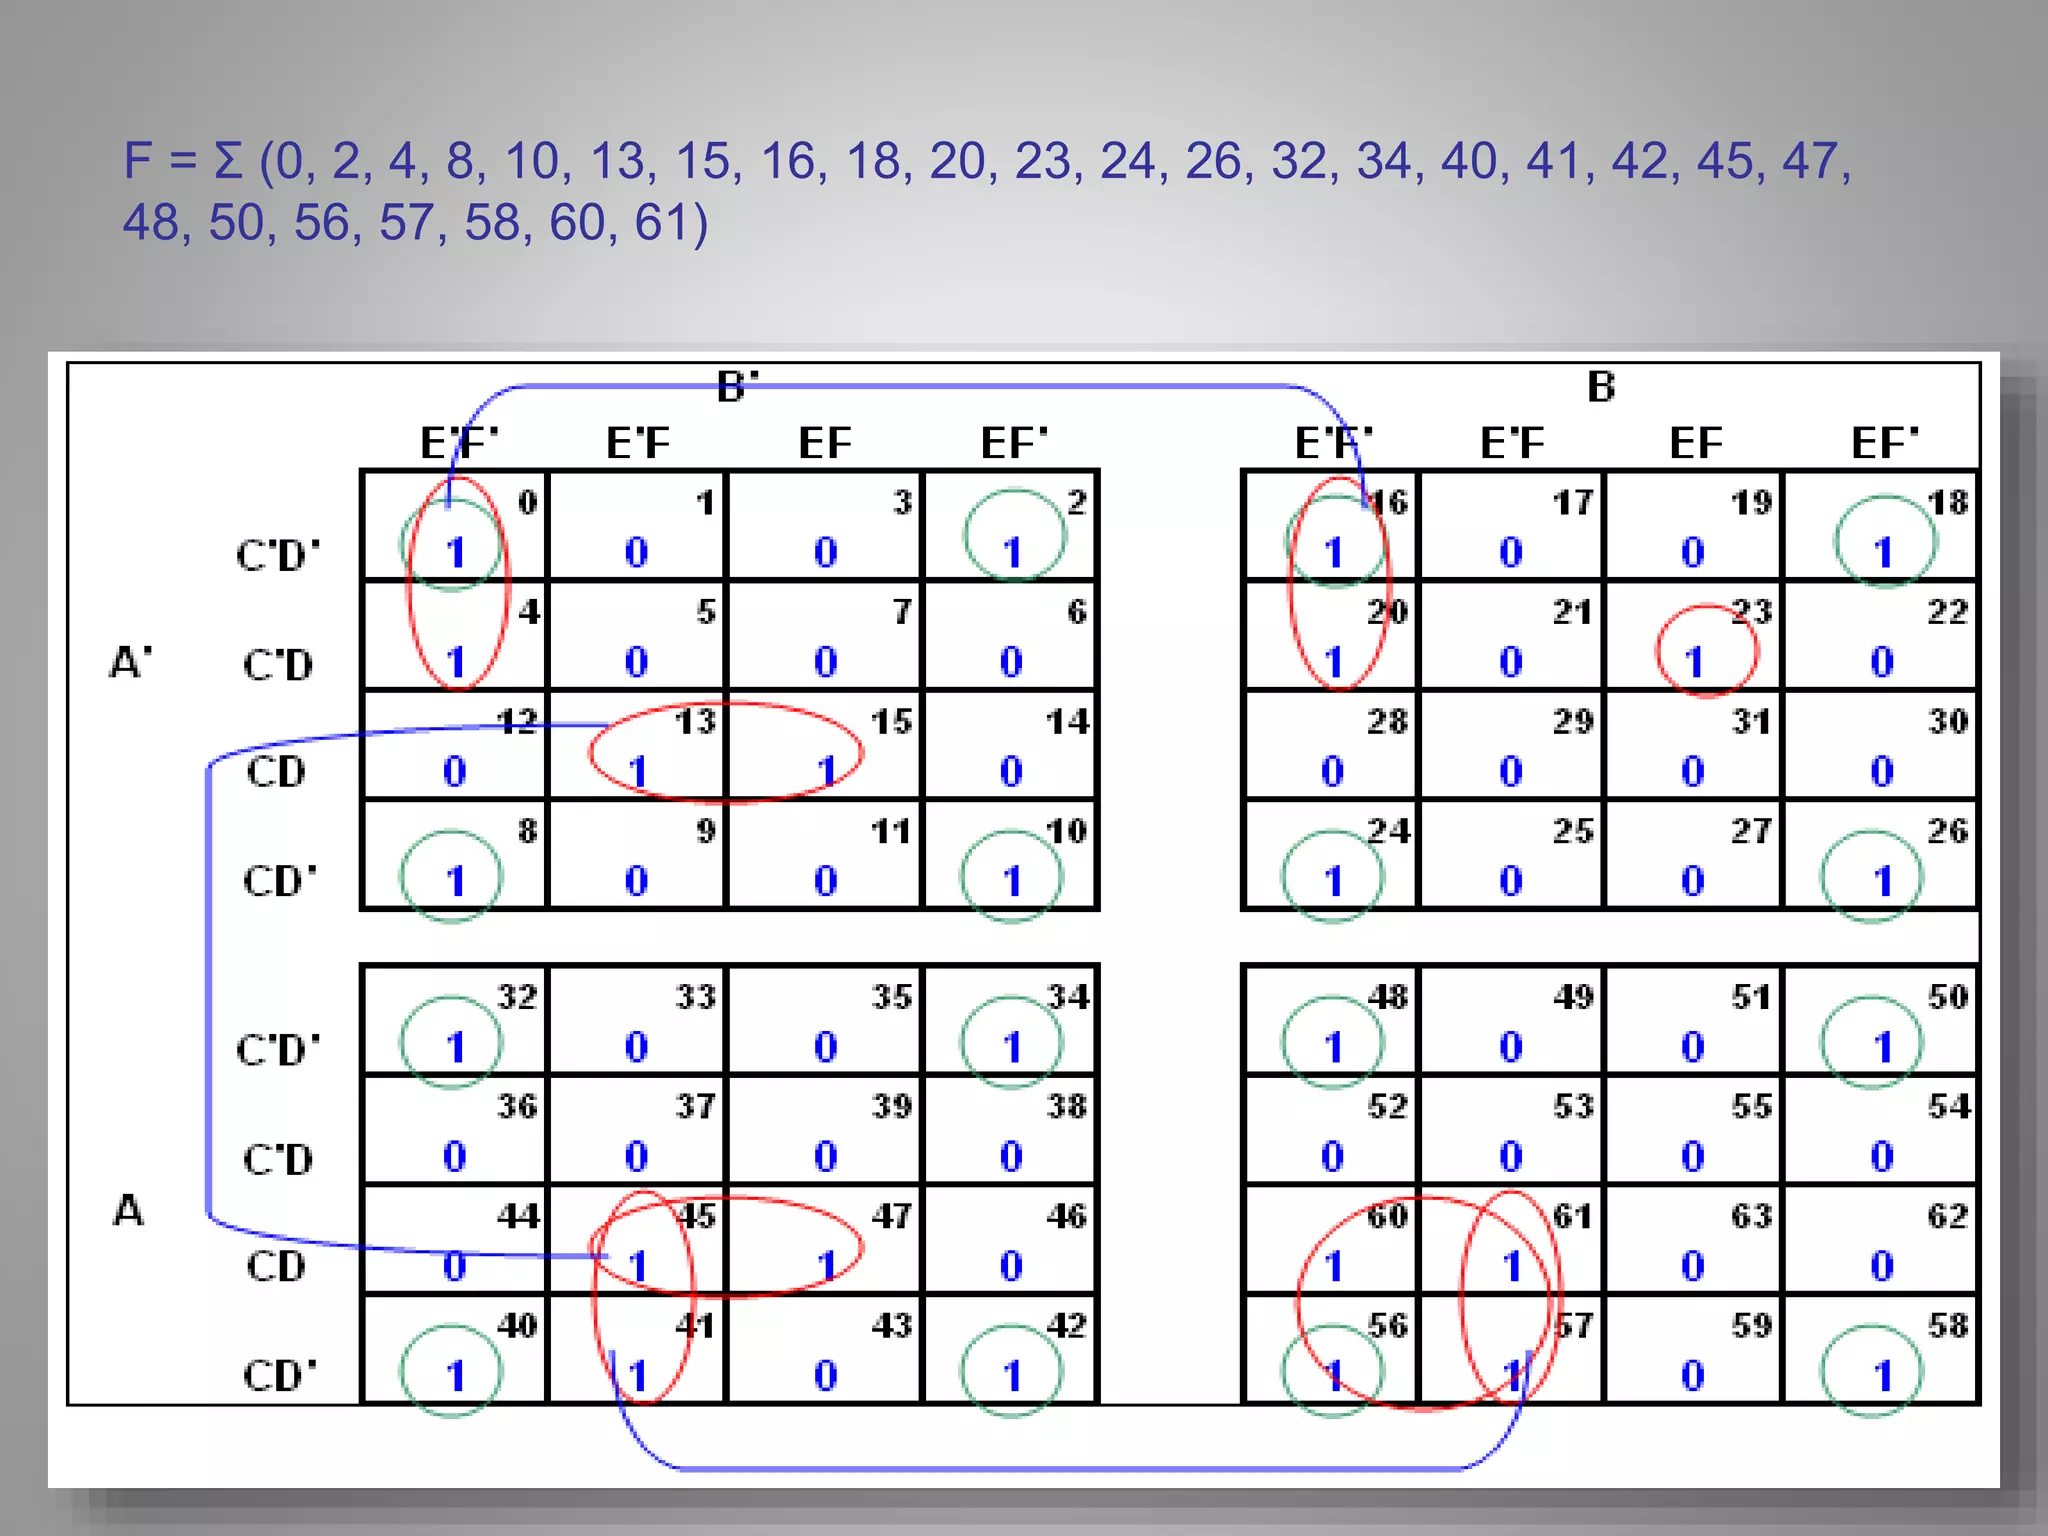
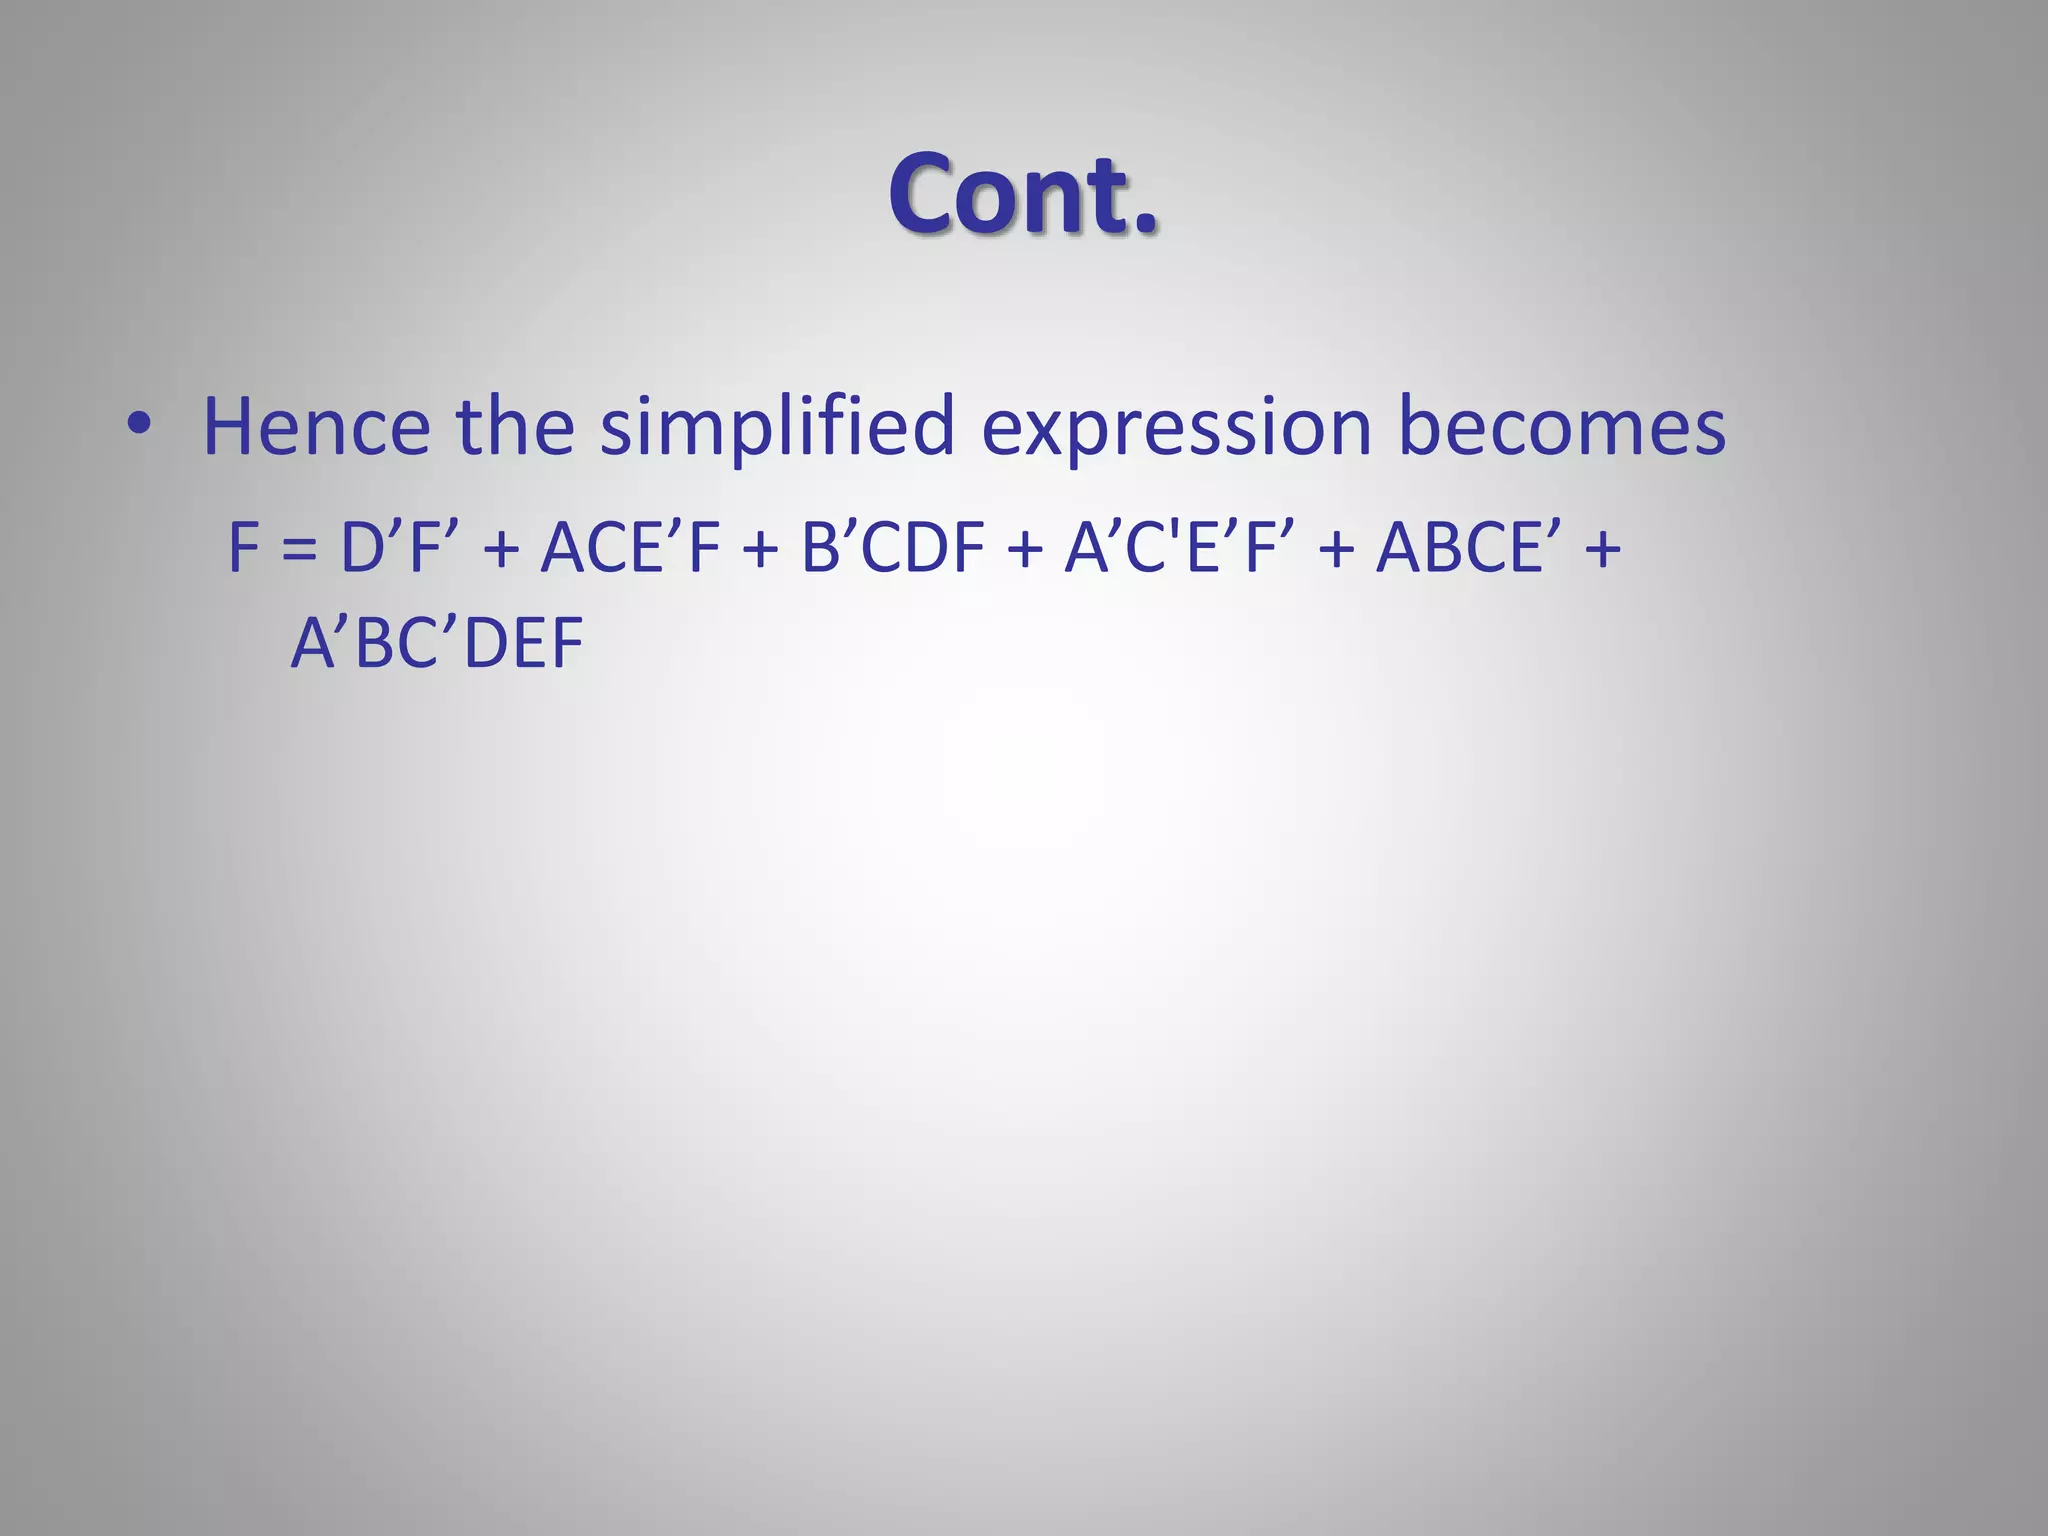
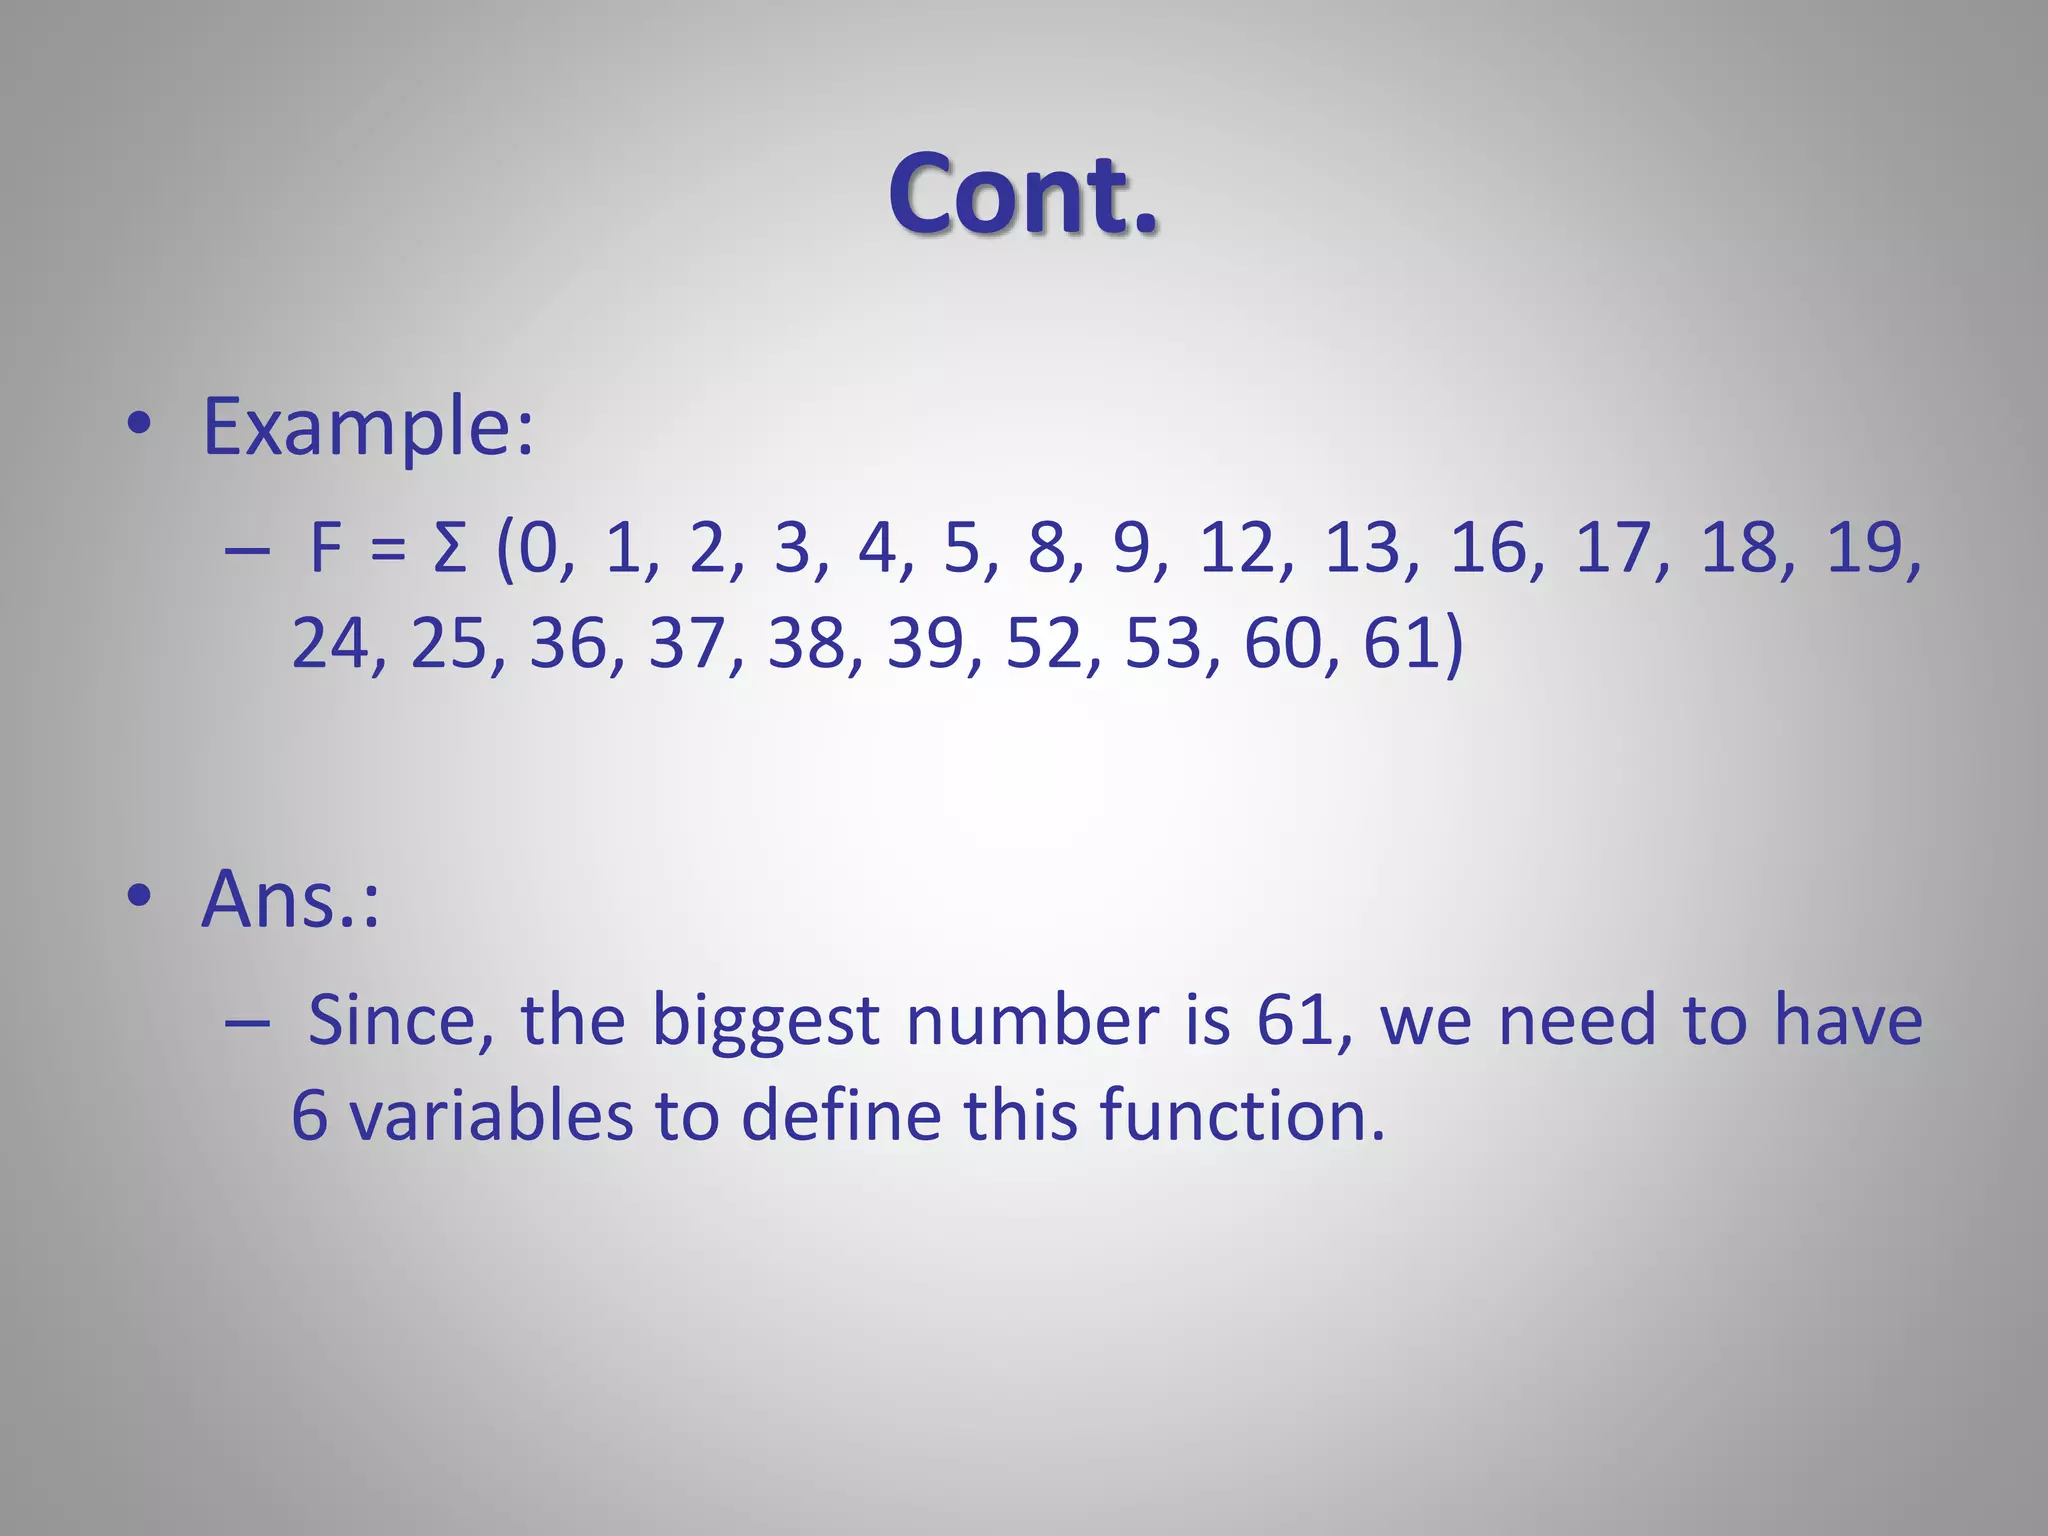
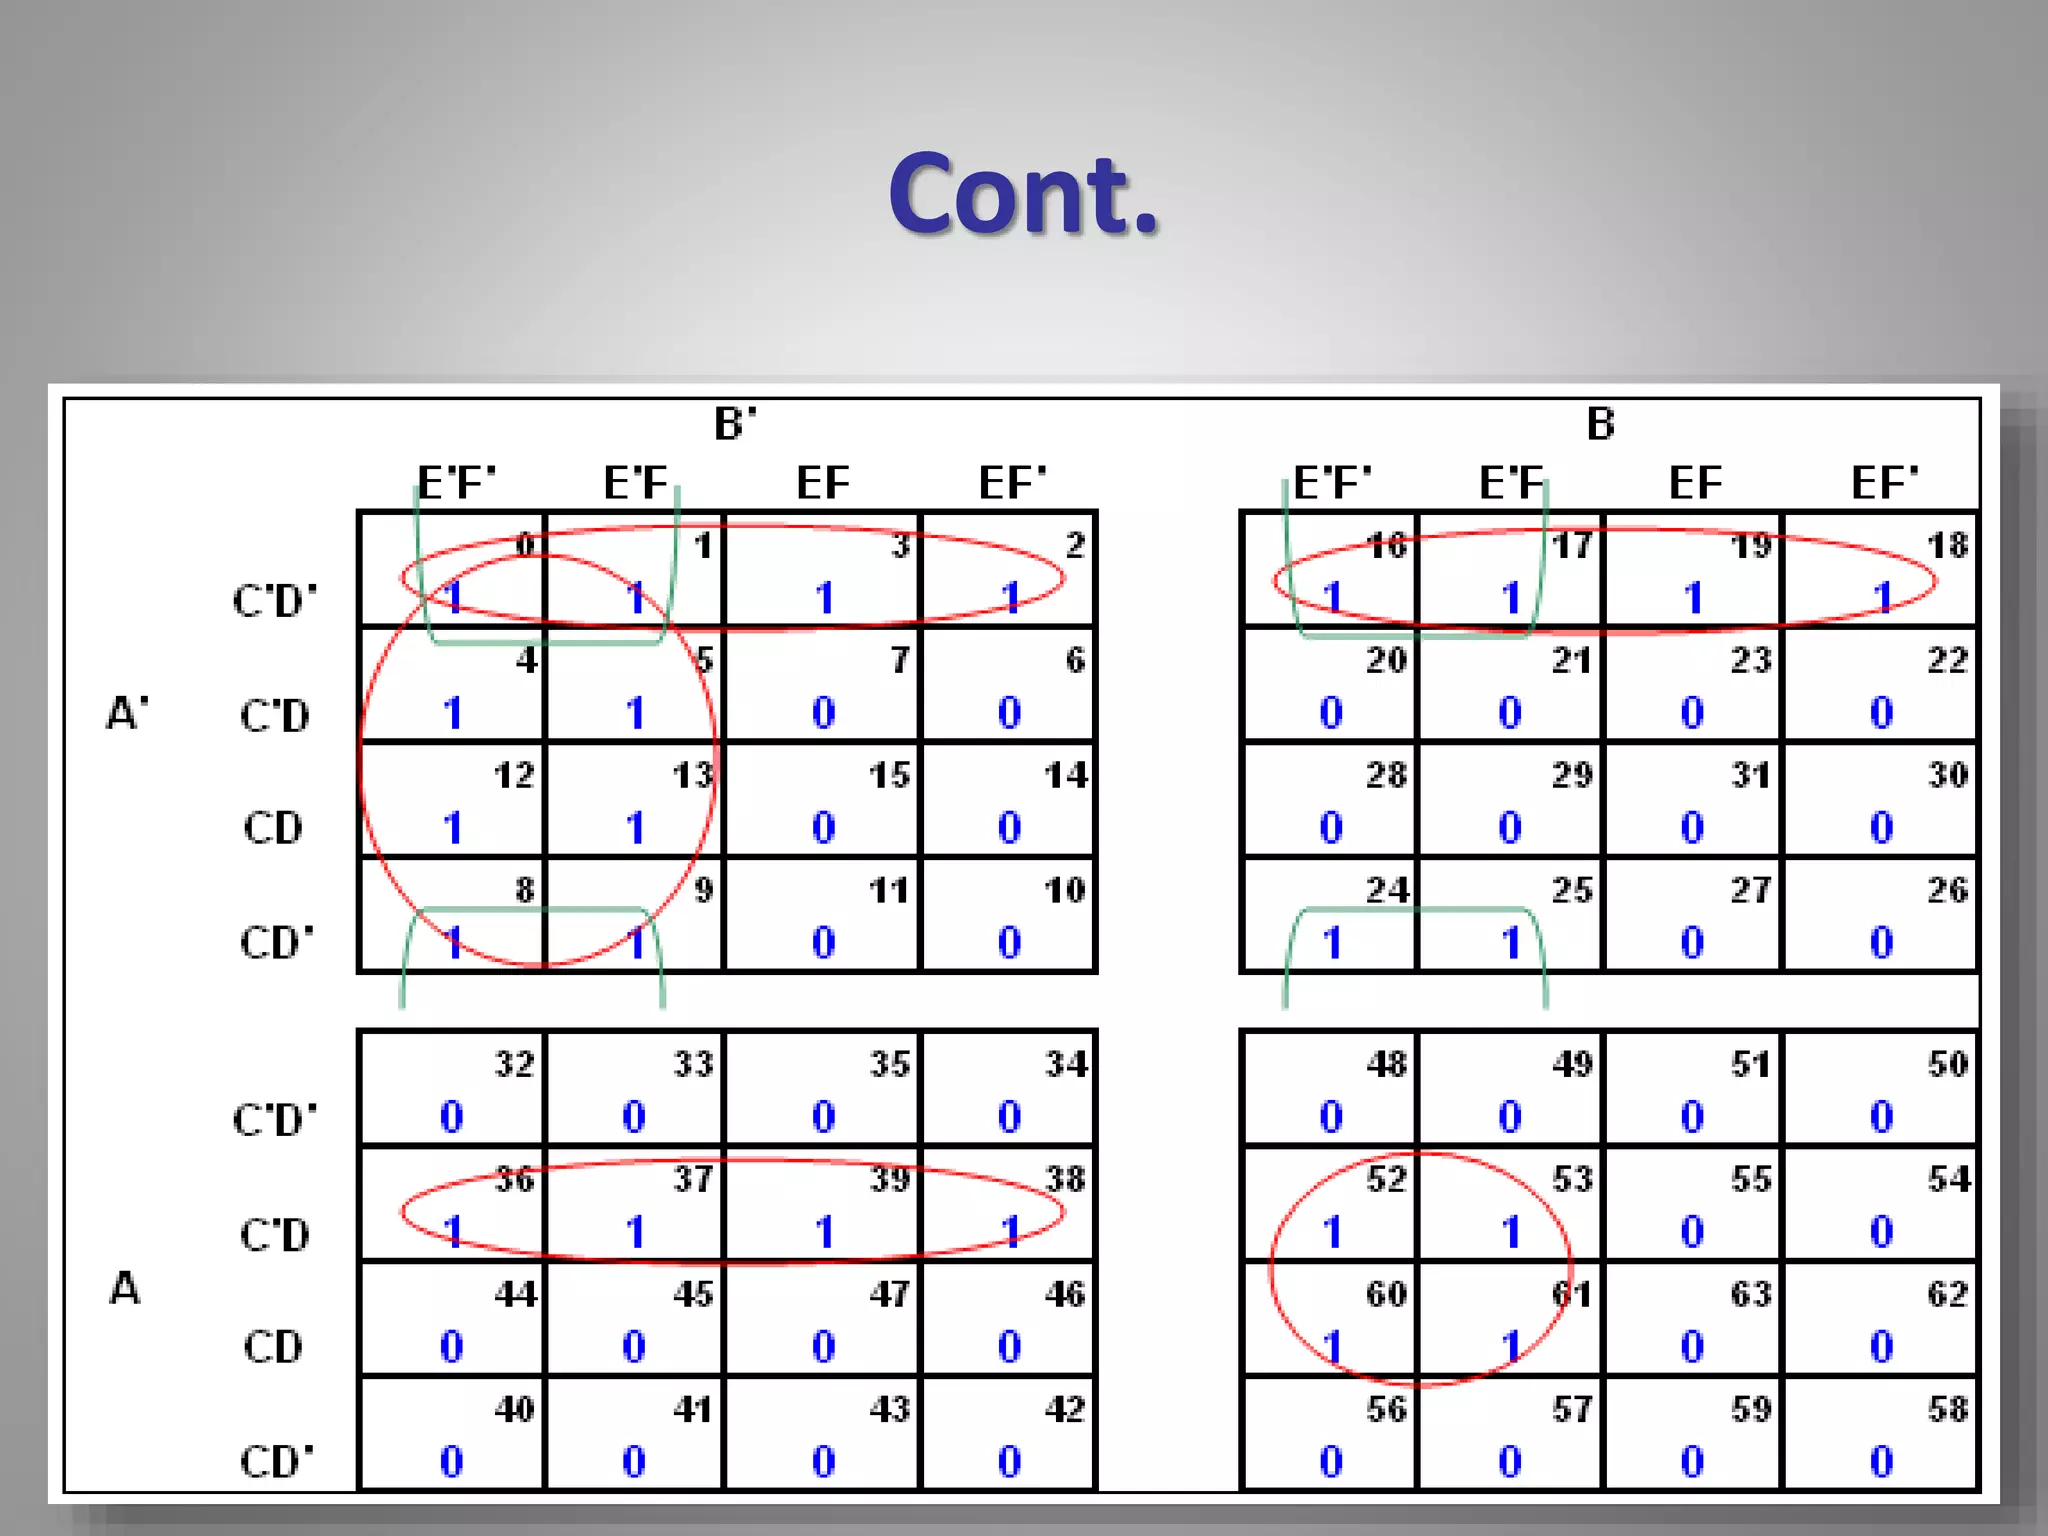
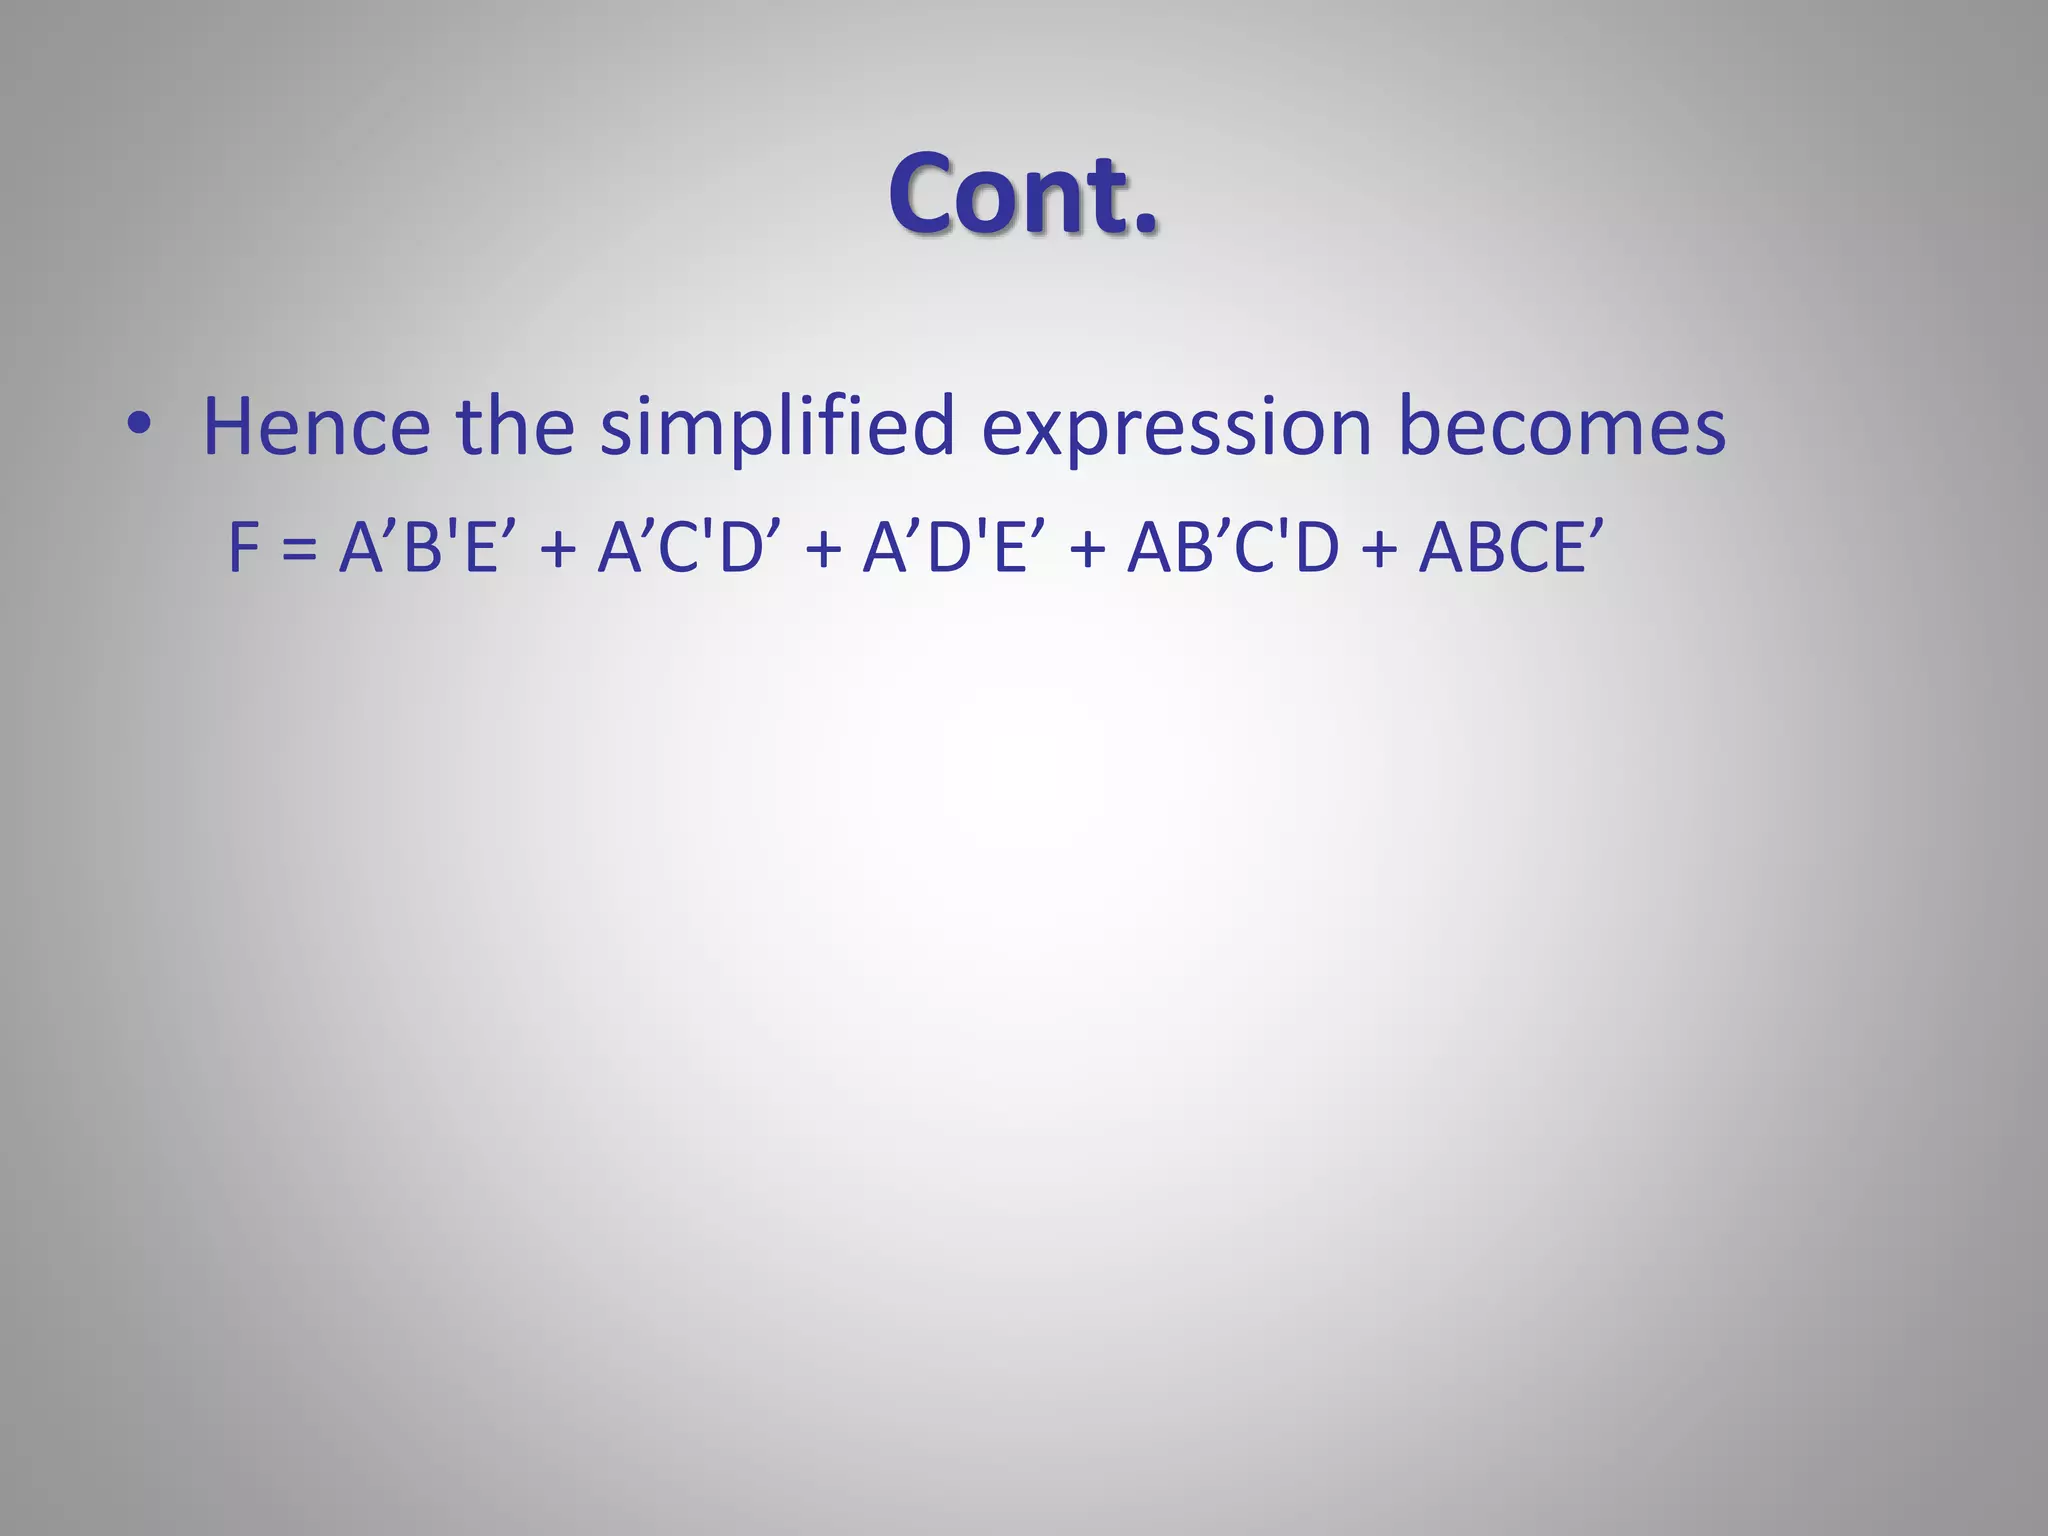
Setup for five variable K-maps explaining relationship of variables and complex output requirements, including a sample example.K-map for six variables encompasses design and simplification of Boolean functions, showcasing examples with variable outputs.
Thank you slide with a link for accessing the presentation, indicating the end of the session.
G H PATELCOLLEGE OF ENGINEERING AND TECHNOLOGY
DEPARTMENT OF INFORMATION TECHNOLOGY
Subject : 2131004 (Digital Electronics)
K-map Method
Preparad By:
Harekrushna Patel (130110116035)
2.
Contents
• Introduction
• Two variable maps
• Three variable maps
• Four variable maps
• Five variable maps
• Six variable maps
3.
Introduction
• Themap method provides a simple straight
forward procedure for minimizing Boolean
functions.
• This method may be regarded either as a
pictorial form of a truth table or as an
extension of the Venn diagram.
• The map method, first proposed by Veitch (1)
and slightly modify by Karnaugh (2), is also
known as the ‘Veitch diagram’ or the
‘Karnaugh map’.
4.
Cont.
Minterm
•Standard Product Term
• For n – variable function → 2n minterm
• Sum of all minterms = 1 i.e. Σmi = 1
5.
Cont.
Maxterm
•Standard Sum Term
• For n – variable function → 2n maxterm
• Product of all maxterms = 1 i.e. ΠMj = 1
6.
Cont.
• Formsof Boolean function:
– Sum of Product(SOP) form
– Product of Sum(POS) form
7.
Cont.
• SOPForm:
– AND - OR Logic or NAND - NAND Logic
8.
Cont.
• POSForm:
– OR - AND Logic or NOR - NOR Logic
9.
Rules
• Nozeros allowed.
• No diagonals.
• Only power of 2 number of cells in each
group.
• Groups should be as large as possible.
• Every 1 must be in at least one group.
• Overlapping allowed.
• Wrap around allowed.
• Fewest number of groups possible.
10.
Two variable K-map
• There are four minterms for two variables;
hence the map consists of four squares, one
for each minterm.
• The 0’s and 1’s marked for each row and each
column designate the values of variables x and
y, respectively.
mo m1
m2 m3
Cont.
x
yz
0
1
y’z’ y’z y z y z’
00 01 11 10
x’
x
m0 m1 m3 m2
m4 m5 m7 m6
• F = x’yz + x’yz’ + xy’z’ + xy’z
37.
Cont.
x
yz
0
1
y’z’ y’z y z y z’
00 01 11 10
x’
x
0 0 1 0
1 0 1 1
• F = x’yz + x’yz’ + xy’z’ + xy’z
38.
Cont.
x
yz
0
1
y’z’ y’z y z y z’
00 01 11 10
x’
x
0 0 1 0
1 0 1 1
• Final Ans.
F = yz + xz’
39.
Four Variable K-map
• There sixteen minterms for four binary
variables. Therefore, a map consists of sixteen
squares.
m0 m1 m3 m2
m4 m5 m7 m6
m12 m13 m15 m14
m8 m9 m11 m10
40.
Cont.
C’D’ C’DC D C D’
00 01 11 10
m0 m1 m3 m2
m4 m5 m7 m6
m12 m13 m15 m14
m8 m9 m11 m10
00
01
11
10
AB
A’B’
A’B
A B
A B’
CD
• Take four variables A,B,C and D
41.
Cont.
C’D’ C’DC D C D’
00 01 11 10
A’B’C’D’
00
01
11
10
AB
A’B’
A’B
A B
A B’
CD
• Relation between squares & four variables
42.
Cont.
C’D’ C’DC D C D’
00 01 11 10
A’B’C’D’ A’B’C’D
00
01
11
10
AB
A’B’
A’B
A B
A B’
CD
• Relation between squares & four variables
43.
Cont.
C’D’ C’DC D C D’
00 01 11 10
A’B’C’D’ A’B’C’D A’B’CD
00
01
11
10
AB
A’B’
A’B
A B
A B’
CD
• Relation between squares & four variables
44.
Cont.
C’D’ C’DC D C D’
00 01 11 10
A’B’C’D’ A’B’C’D A’B’CD A’B’CD’
00
01
11
10
AB
A’B’
A’B
A B
A B’
CD
• Relation between squares & four variables
45.
Cont.
C’D’ C’DC D C D’
00 01 11 10
A’B’C’D’ A’B’C’D A’B’CD A’B’CD’
A’BC’D’
00
01
11
10
AB
A’B’
A’B
A B
A B’
CD
• Relation between squares & four variables
46.
Cont.
C’D’ C’DC D C D’
00 01 11 10
A’B’C’D’ A’B’C’D A’B’CD A’B’CD’
A’BC’D’ A’BC’D
00
01
11
10
AB
A’B’
A’B
A B
A B’
CD
• Relation between squares & four variables
47.
Cont.
C’D’ C’DC D C D’
00 01 11 10
A’B’C’D’ A’B’C’D A’B’CD A’B’CD’
A’BC’D’ A’BC’D A’BCD
00
01
11
10
AB
A’B’
A’B
A B
A B’
CD
• Relation between squares & four variables
48.
Cont.
C’D’ C’DC D C D’
00 01 11 10
A’B’C’D’ A’B’C’D A’B’CD A’B’CD’
A’BC’D’ A’BC’D A’BCD A’BCD’
00
01
11
10
AB
A’B’
A’B
A B
A B’
CD
• Relation between squares & four variables
49.
Cont.
C’D’ C’DC D C D’
00 01 11 10
A’B’C’D’ A’B’C’D A’B’CD A’B’CD’
A’BC’D’ A’BC’D A’BCD A’BCD’
ABC’D’
00
01
11
10
AB
A’B’
A’B
A B
A B’
CD
• Relation between squares & four variables
50.
Cont.
C’D’ C’DC D C D’
00 01 11 10
A’B’C’D’ A’B’C’D A’B’CD A’B’CD’
A’BC’D’ A’BC’D A’BCD A’BCD’
ABC’D’ ABC’D
00
01
11
10
AB
A’B’
A’B
A B
A B’
CD
• Relation between squares & four variables
51.
Cont.
C’D’ C’DC D C D’
00 01 11 10
A’B’C’D’ A’B’C’D A’B’CD A’B’CD’
A’BC’D’ A’BC’D A’BCD A’BCD’
ABC’D’ ABC’D ABCD
00
01
11
10
AB
A’B’
A’B
A B
A B’
CD
• Relation between squares & four variables
52.
Cont.
C’D’ C’DC D C D’
00 01 11 10
A’B’C’D’ A’B’C’D A’B’CD A’B’CD’
A’BC’D’ A’BC’D A’BCD A’BCD’
ABC’D’ ABC’D ABCD ABCD’
00
01
11
10
AB
A’B’
A’B
A B
A B’
CD
• Relation between squares & four variables
53.
Cont.
C’D’ C’DC D C D’
00 01 11 10
A’B’C’D’ A’B’C’D A’B’CD A’B’CD’
A’BC’D’ A’BC’D A’BCD A’BCD’
ABC’D’ ABC’D ABCD ABCD’
AB’C’D’
00
01
11
10
AB
A’B’
A’B
A B
A B’
CD
• Relation between squares & four variables
54.
Cont.
C’D’ C’DC D C D’
00 01 11 10
A’B’C’D’ A’B’C’D A’B’CD A’B’CD’
A’BC’D’ A’BC’D A’BCD A’BCD’
ABC’D’ ABC’D ABCD ABCD’
AB’C’D’ AB’C’D
00
01
11
10
AB
A’B’
A’B
A B
A B’
CD
• Relation between squares & four variables
55.
Cont.
C’D’ C’DC D C D’
00 01 11 10
A’B’C’D’ A’B’C’D A’B’CD A’B’CD’
A’BC’D’ A’BC’D A’BCD A’BCD’
ABC’D’ ABC’D ABCD ABCD’
AB’C’D’ AB’C’D AB’CD
00
01
11
10
AB
A’B’
A’B
A B
A B’
CD
• Relation between squares & four variables
56.
Cont.
C’D’ C’DC D C D’
00 01 11 10
A’B’C’D’ A’B’C’D A’B’CD A’B’CD’
A’BC’D’ A’BC’D A’BCD A’BCD’
ABC’D’ ABC’D ABCD ABCD’
AB’C’D’ AB’C’D AB’CD AB’CD’
00
01
11
10
AB
A’B’
A’B
A B
A B’
CD
• Relation between squares & four variables
Cont.
m0 m1m3 m2
m4 m5 m7 m6
m12 m13 m15 m14
m8 m9 m11 m10
W
Z
X
Y
00 01 11 10
00
01
11
10
F(w, x, y, z) = Σ(1,5,12,13)
59.
Cont.
0 10 0
0 1 0 0
1 1 0 0
0 0 0 0
W
Z
X
Y
00 01 11 10
00
01
11
10
F(w, x, y, z) = Σ(1,5,12,13)
Put 1 in place of
m1, m5, m12, m13
60.
Cont.
0 10 0
0 1 0 0
1 1 0 0
0 0 0 0
W
Z
X
Y
00 01 11 10
00
01
11
10
F(w, x, y, z) = Σ(1,5,12,13)
Put 1 in place of
m1, m5, m12, m13
Making pairs
61.
Cont.
0 10 0
0 1 0 0
1 1 0 0
0 0 0 0
W
Z
X
Y
00 01 11 10
00
01
11
10
F(w, x, y, z) = Σ(1,5,12,13)
Put 1 in place of
m1, m5, m12, m13
Making pairs
Hence the simplified
Expression is
F = WY’Z + W’Y’Z
62.
Five variable K-map
• There thirty two minterms for five binary
variables. Therefore, a map consists of thirty
two squares.
m16 m17 m19 m18
m20 m21 m23 m22
M28 m29 M31 m30
m24 m25 m27 m26
m0 m1 m3 m2
m4 m5 m7 m6
m12 m13 m15 m14
m8 m9 m11 m10
Cont.
• Example:
– Design a circuit of 5 input variables that generates
output 1 if and only if the number of 1’s in the
input is prime (i.e., 2, 3 or 5).
• Ans.:
– The minterms can easily be found from Karnaugh
Map where addresses of 2,3 or 5 numbers of 1.
6 variable K-map
• A 6-variable K-Map will have 26 = 64 cells. A
function F which has maximum decimal value
of 63, can be defined and simplified by a 6-
variable Karnaugh Map.
Cont.
• Booleantable for 6 variables is quite big, so
we have shown only values, where there is a
noticeable change in values which will help us
to draw the K-Map.
• A = 0 for decimal values 0 to 31 and A = 1 for
31 to 63.
• B = 0 for decimal values 0 to 15 and 32 to 47.
B = 1 for decimal values 16 to 31 and 48 to 63.
Cont.
• Example:
– F = Σ (0, 1, 2, 3, 4, 5, 8, 9, 12, 13, 16, 17, 18, 19,
24, 25, 36, 37, 38, 39, 52, 53, 60, 61)
• Ans.:
– Since, the biggest number is 61, we need to have
6 variables to define this function.