The document discusses Pareto charts, also known as 80/20 charts, which were developed based on Pareto's principle. It provides examples of how the principle can be applied in various contexts to identify the vital few causes that create the majority of effects. The document then guides the reader through a series of exercises to create Pareto charts using manufacturing defect data, examining frequency of defects, cost of defects, and ultimately identifying the most important problem to address.
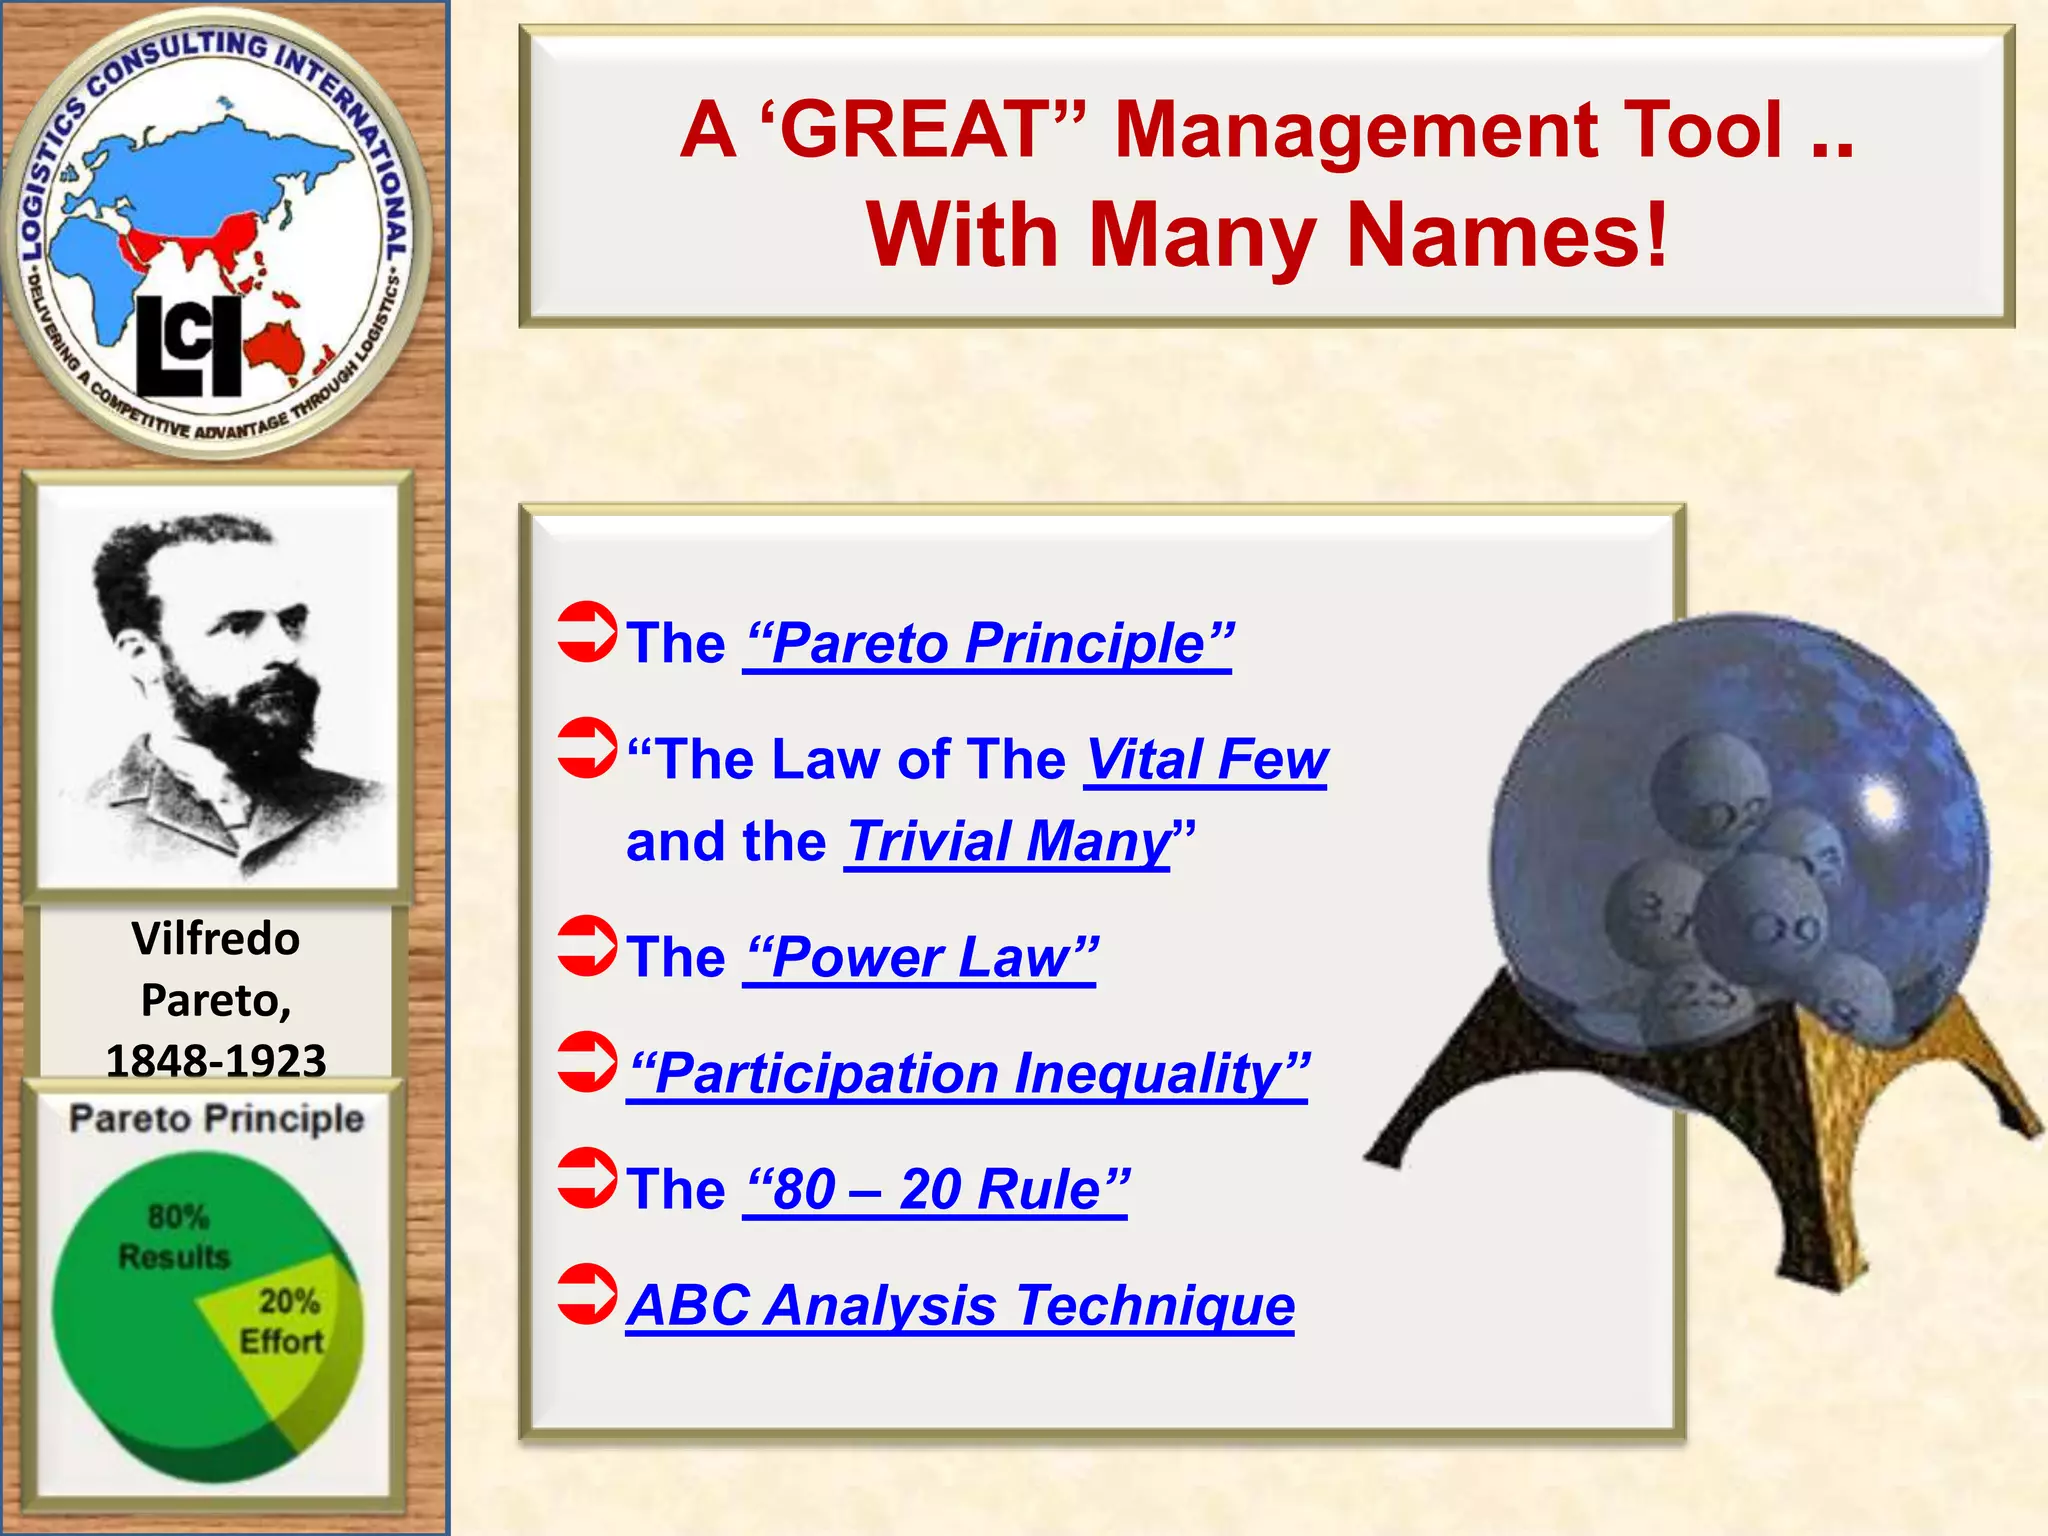
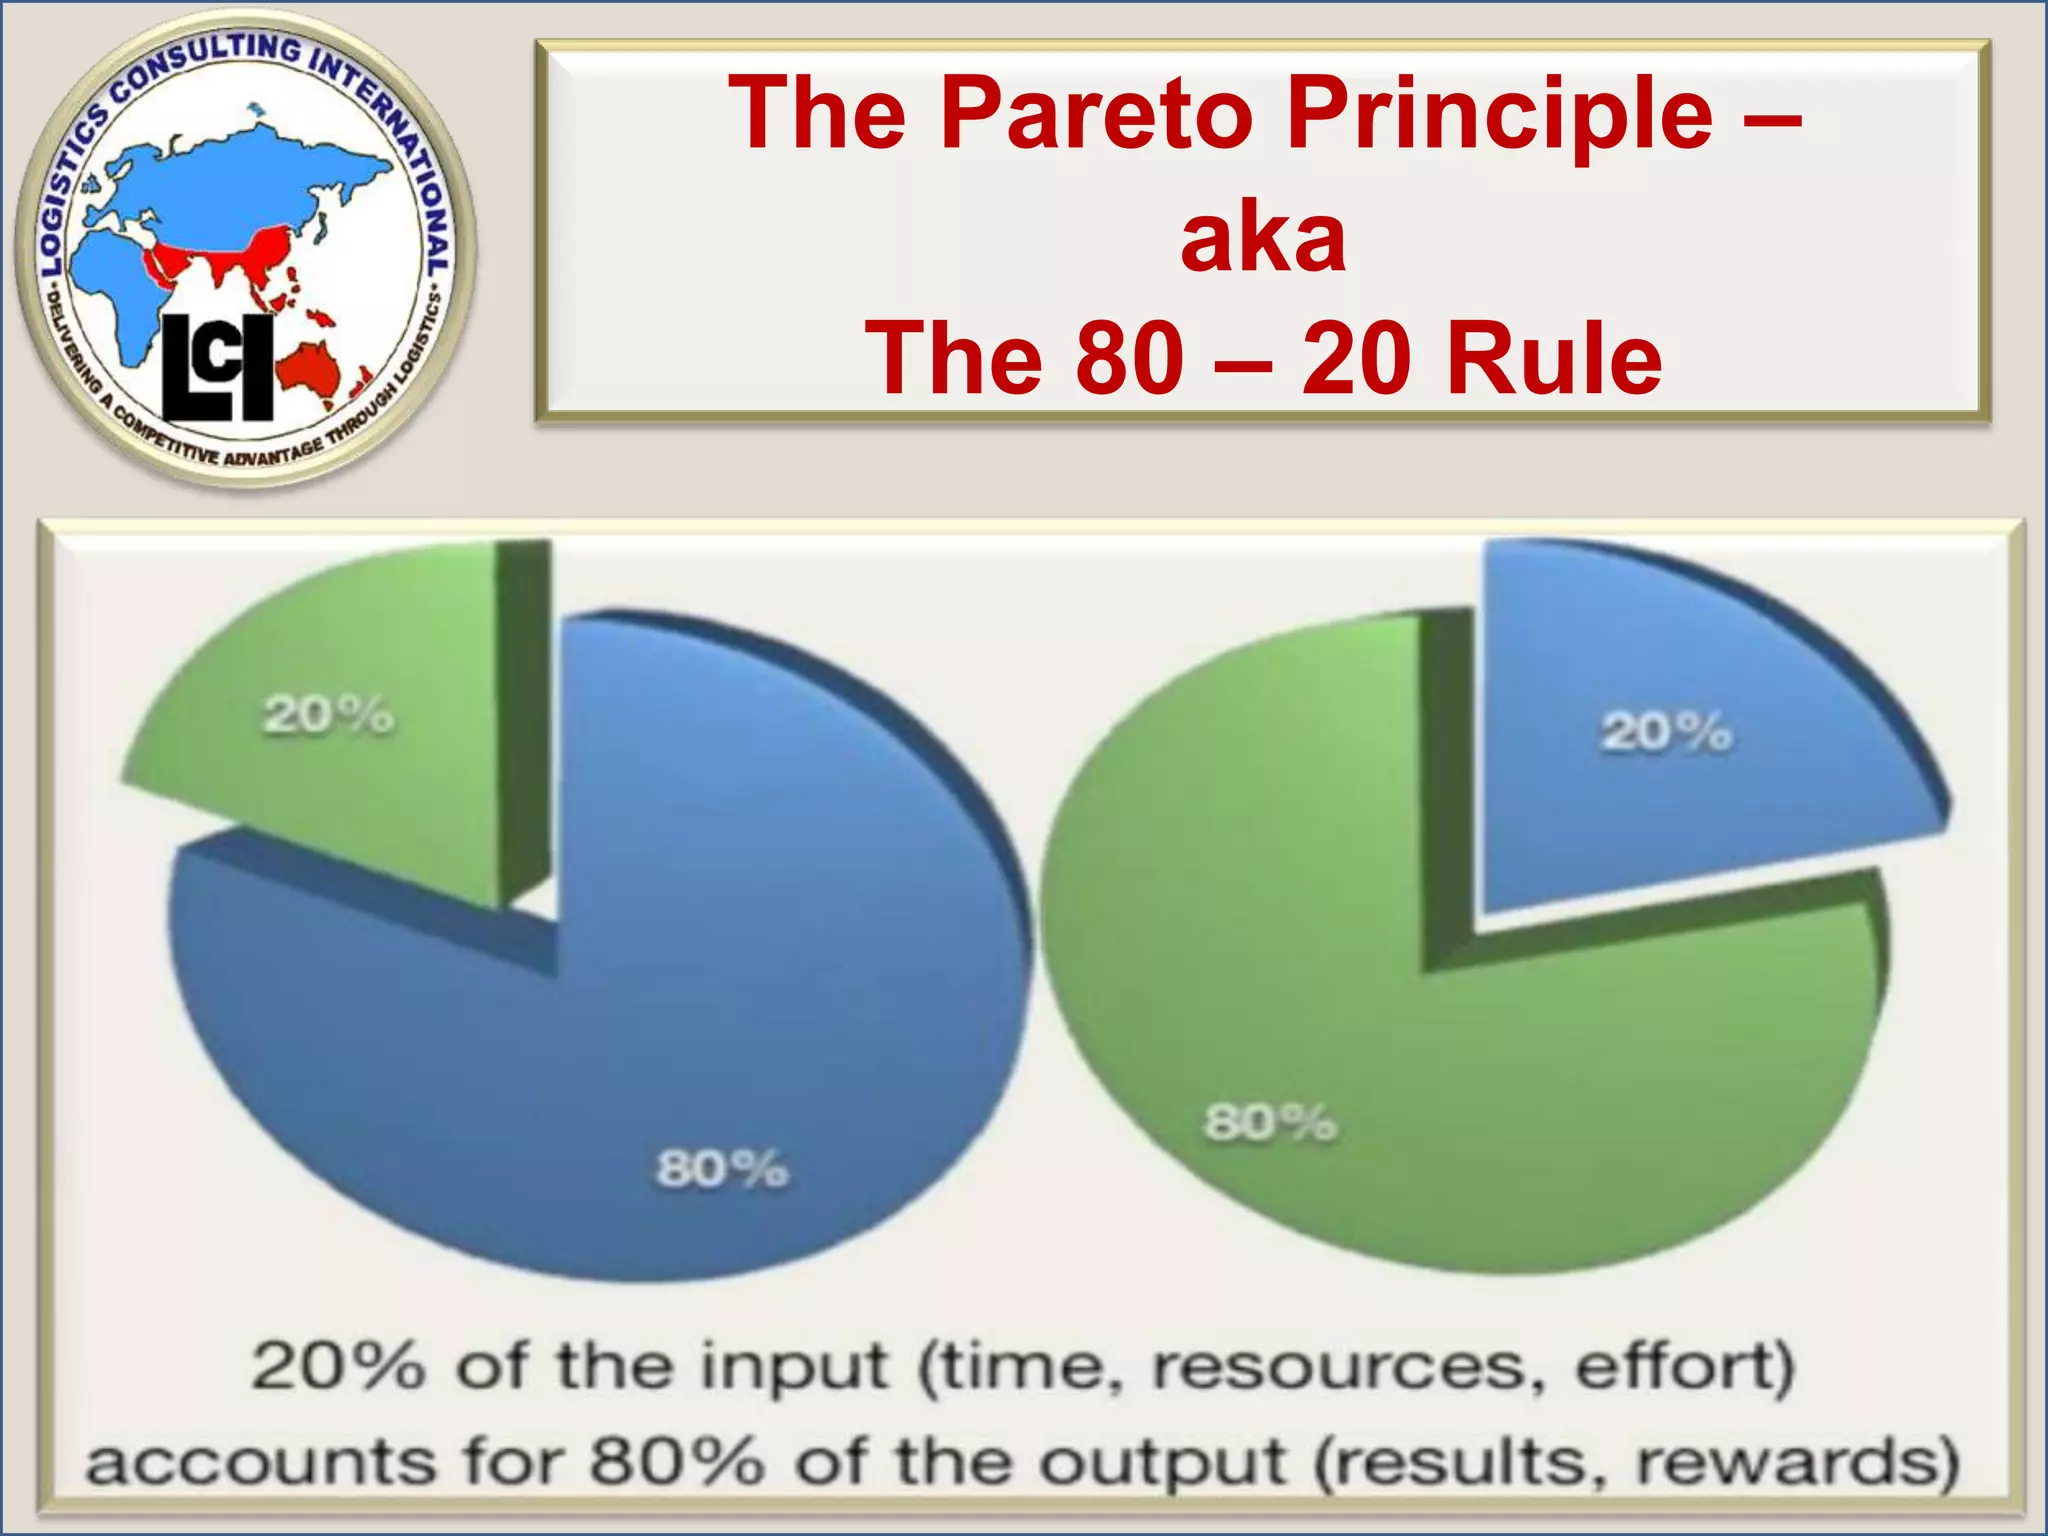
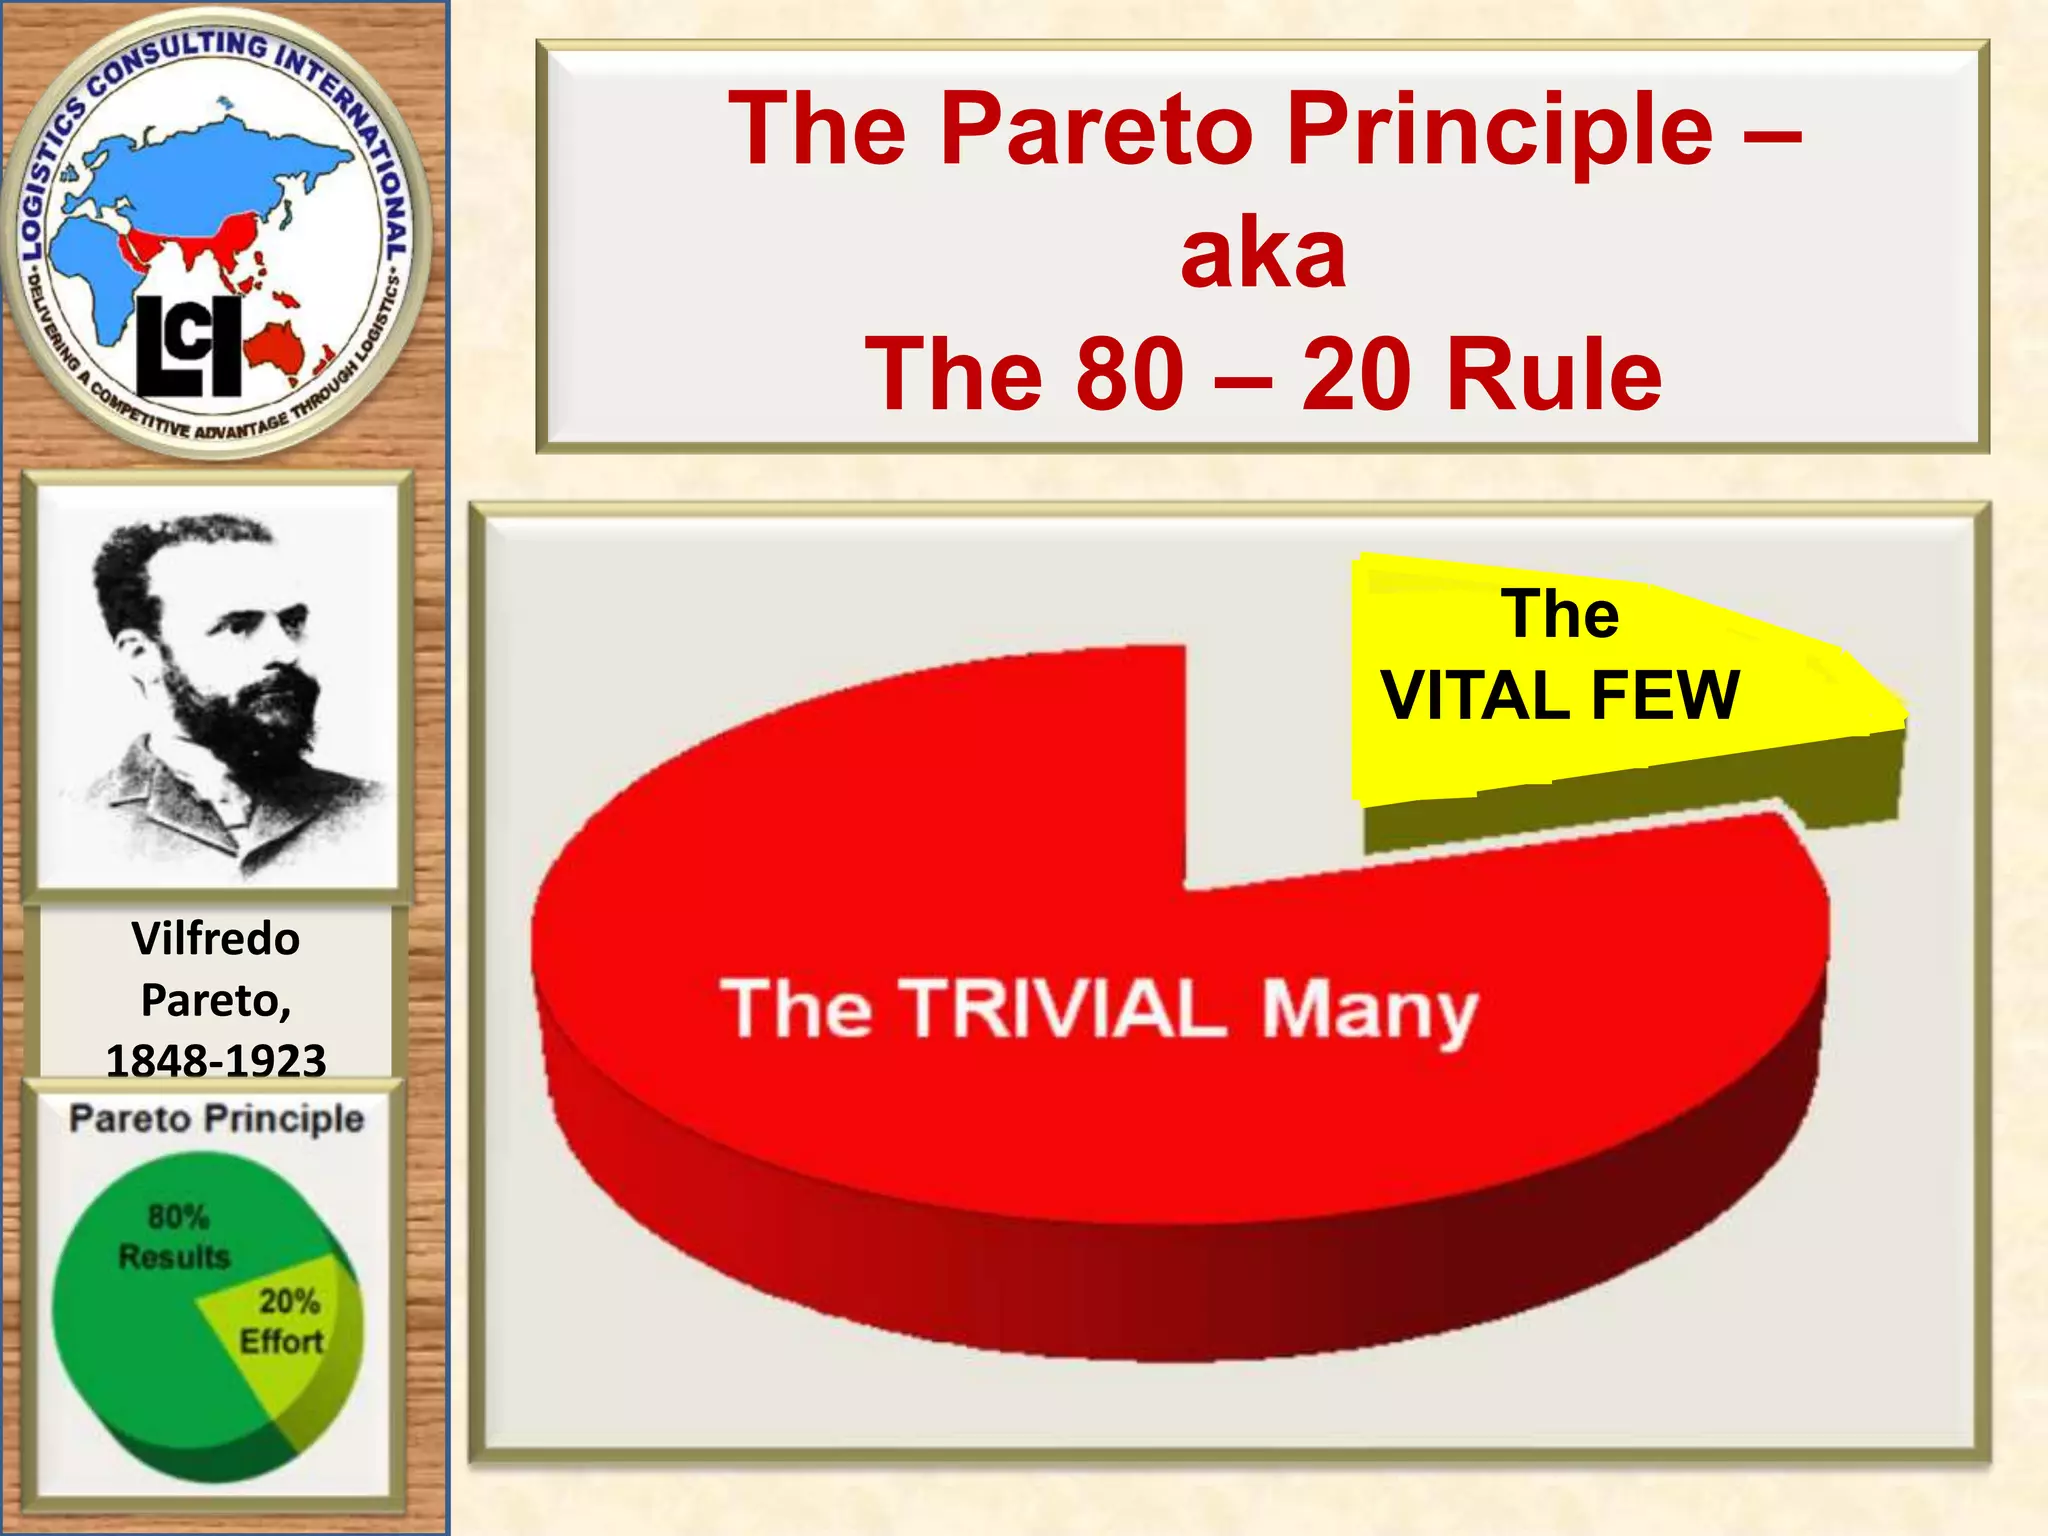
A ‘GREAT” ManagementTool .. With Many Names!The “Pareto Principle”“The Law of The Vital Few and the Trivial Many”The “Power Law”“Participation Inequality”The “80 – 20 Rule”ABC Analysis Technique
3.
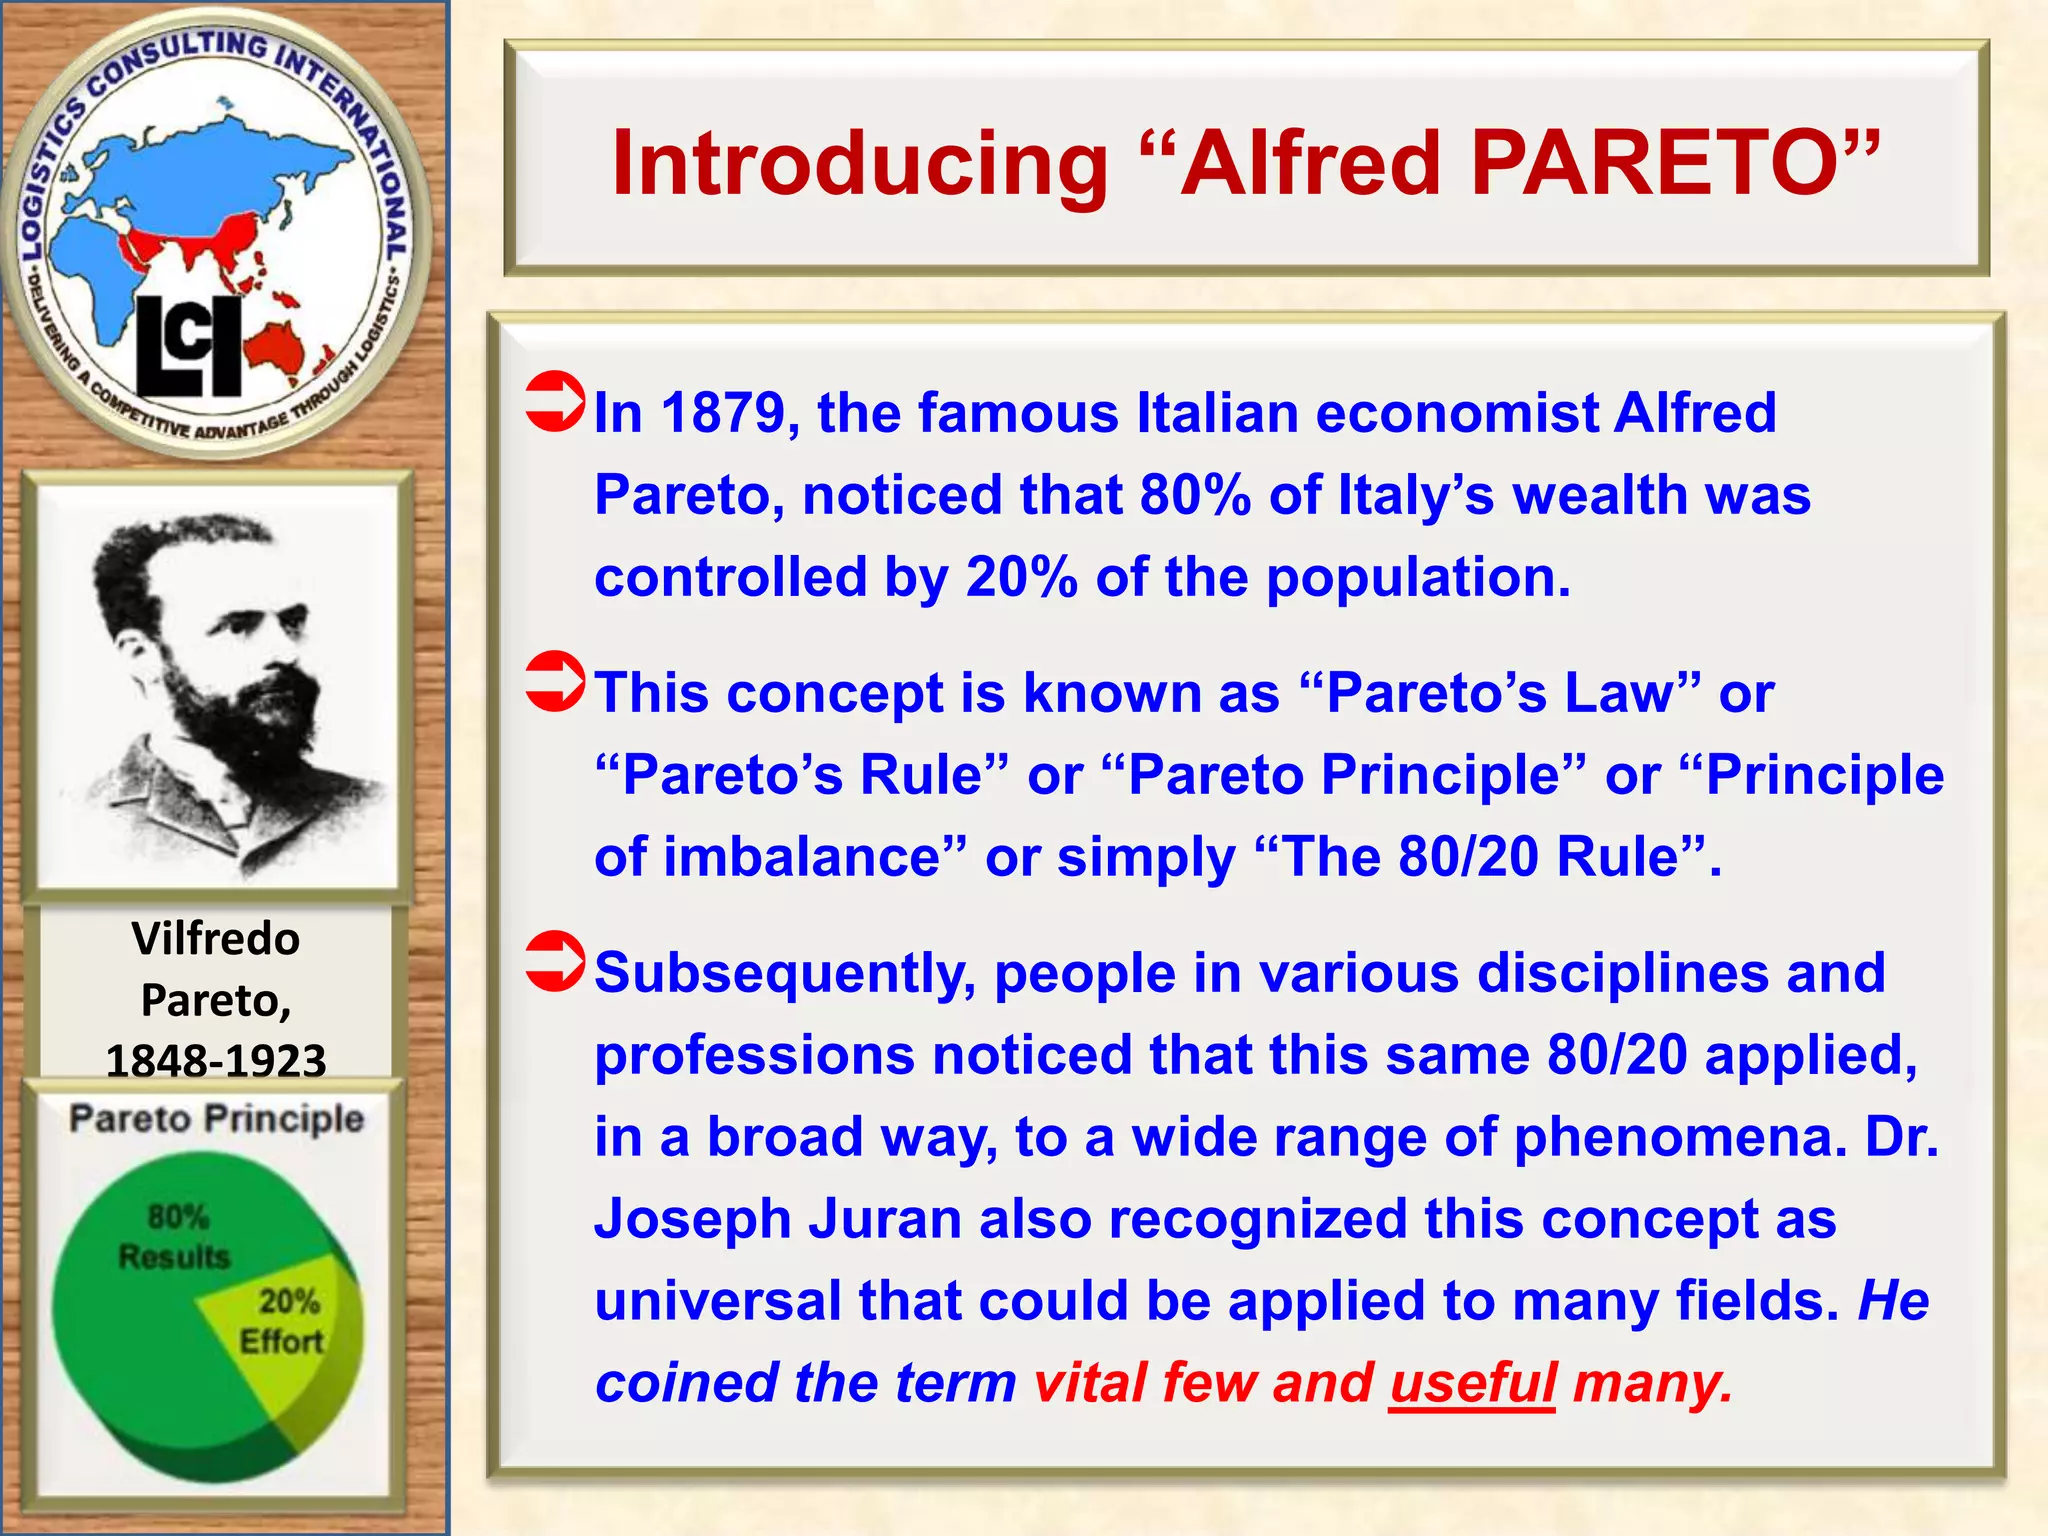
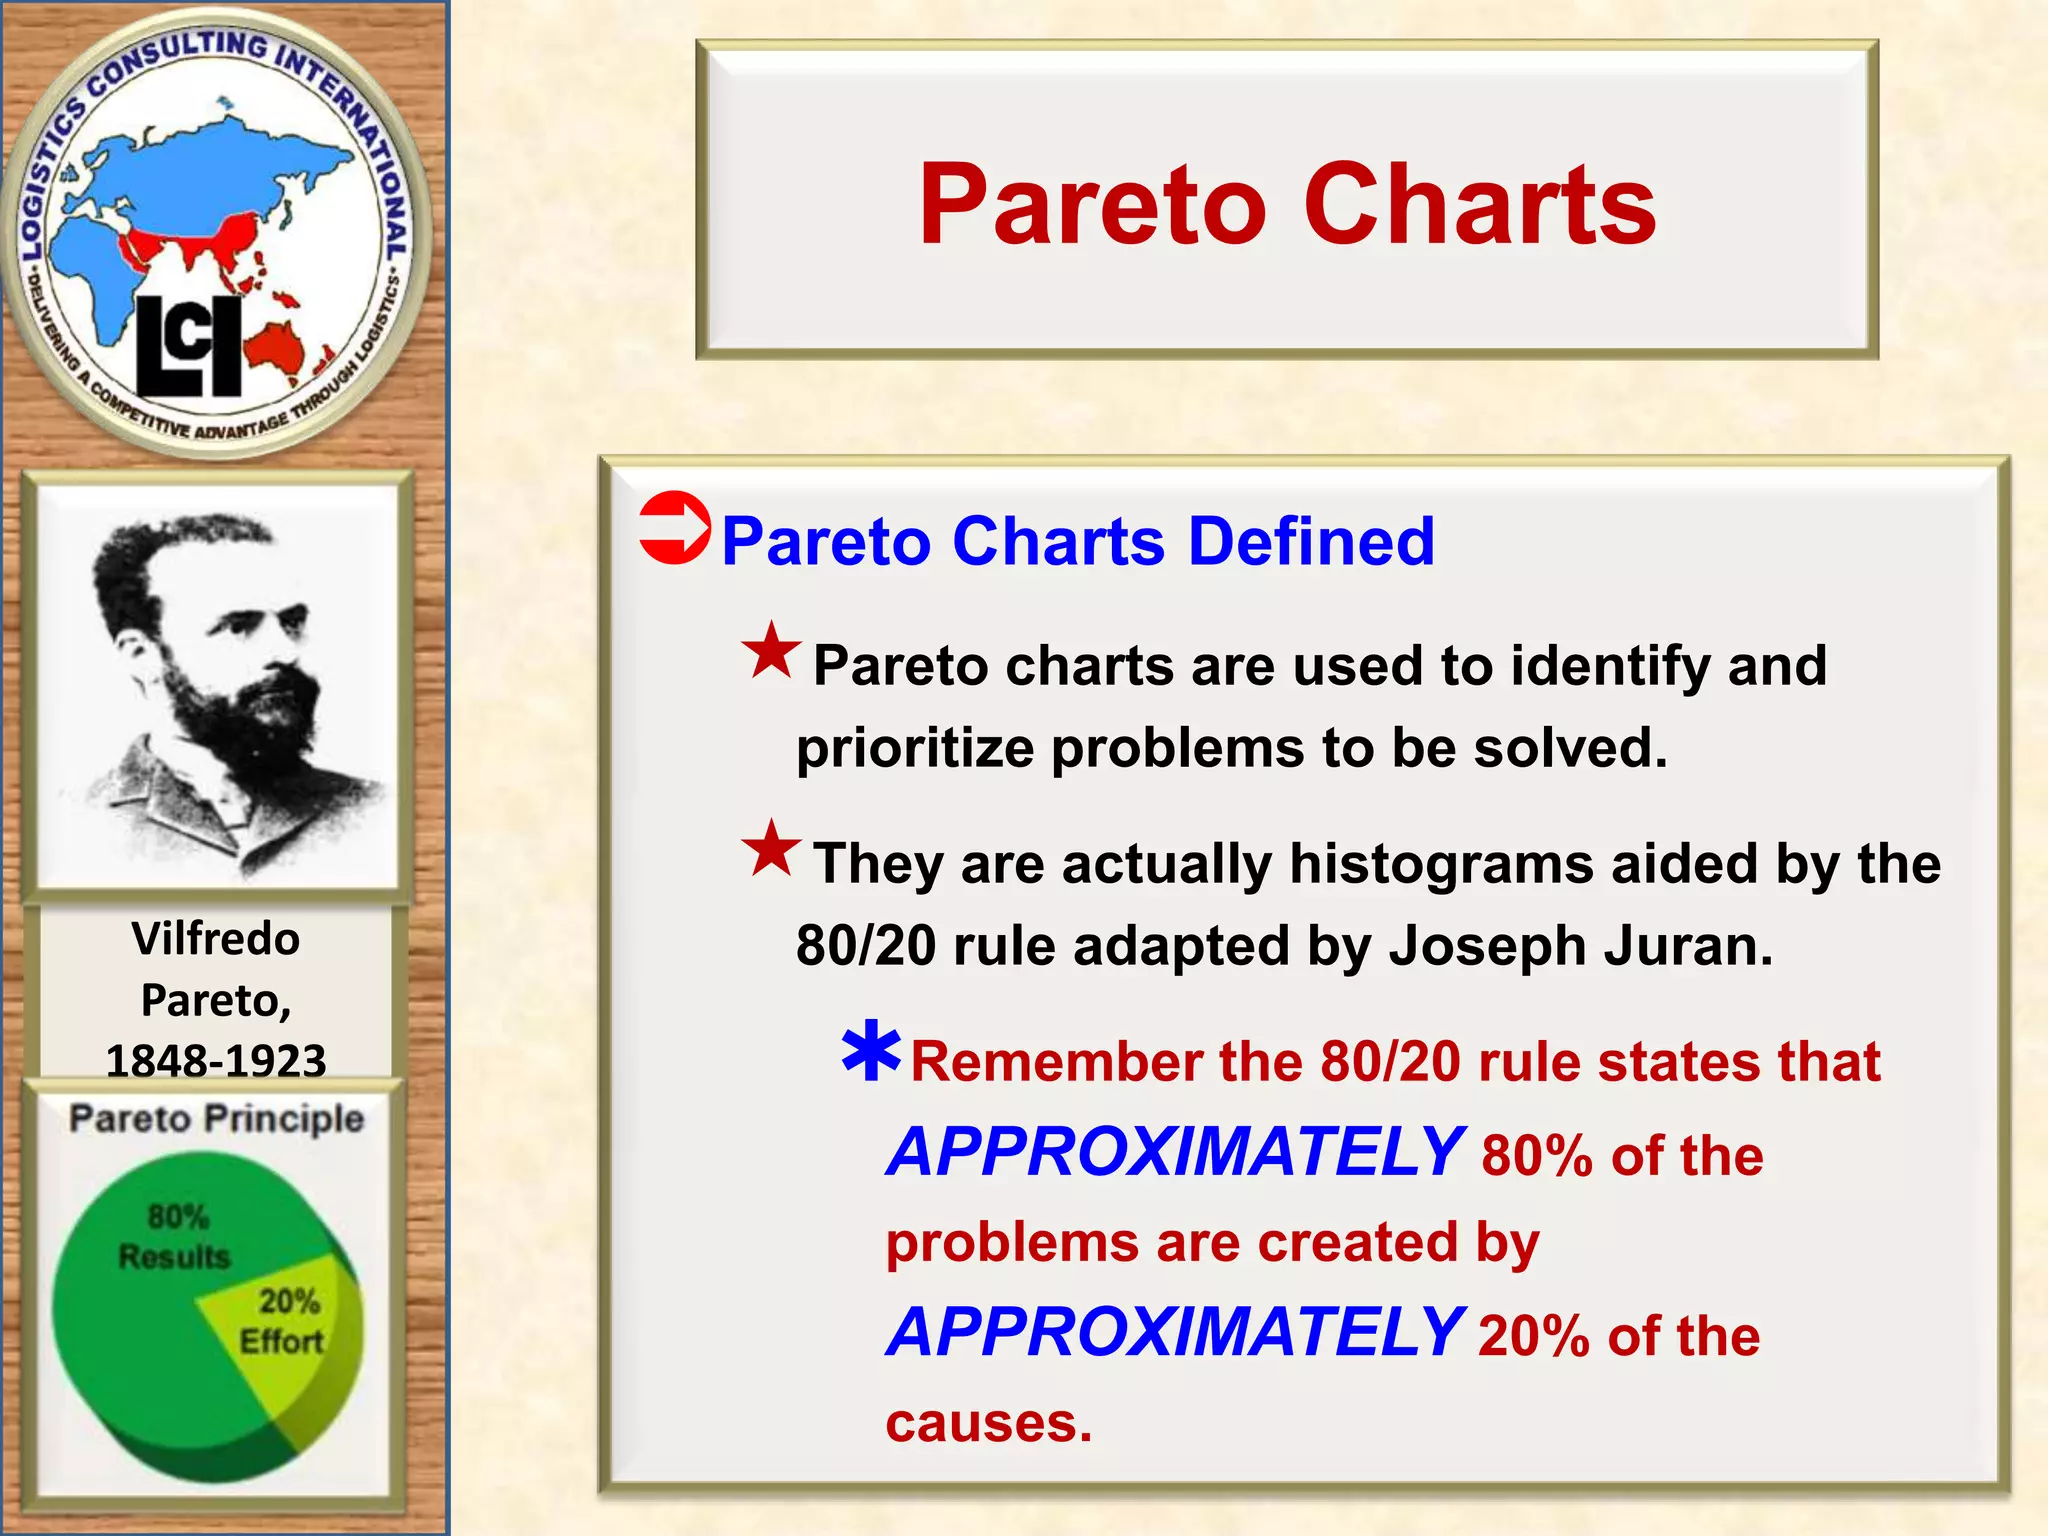
Introducing “Alfred PARETO”In1879, the famous Italian economist Alfred Pareto, noticed that 80% of Italy’s wealth was controlled by 20% of the population. This concept is known as “Pareto’s Law” or “Pareto’s Rule” or “Pareto Principle” or “Principle of imbalance” or simply “The 80/20 Rule”.Subsequently, people in various disciplines and professions noticed that this same 80/20 applied, in a broad way, to a wide range of phenomena. Dr. Joseph Juran also recognized this concept as universal that could be applied to many fields. He coined the term vital few and useful many.
4.
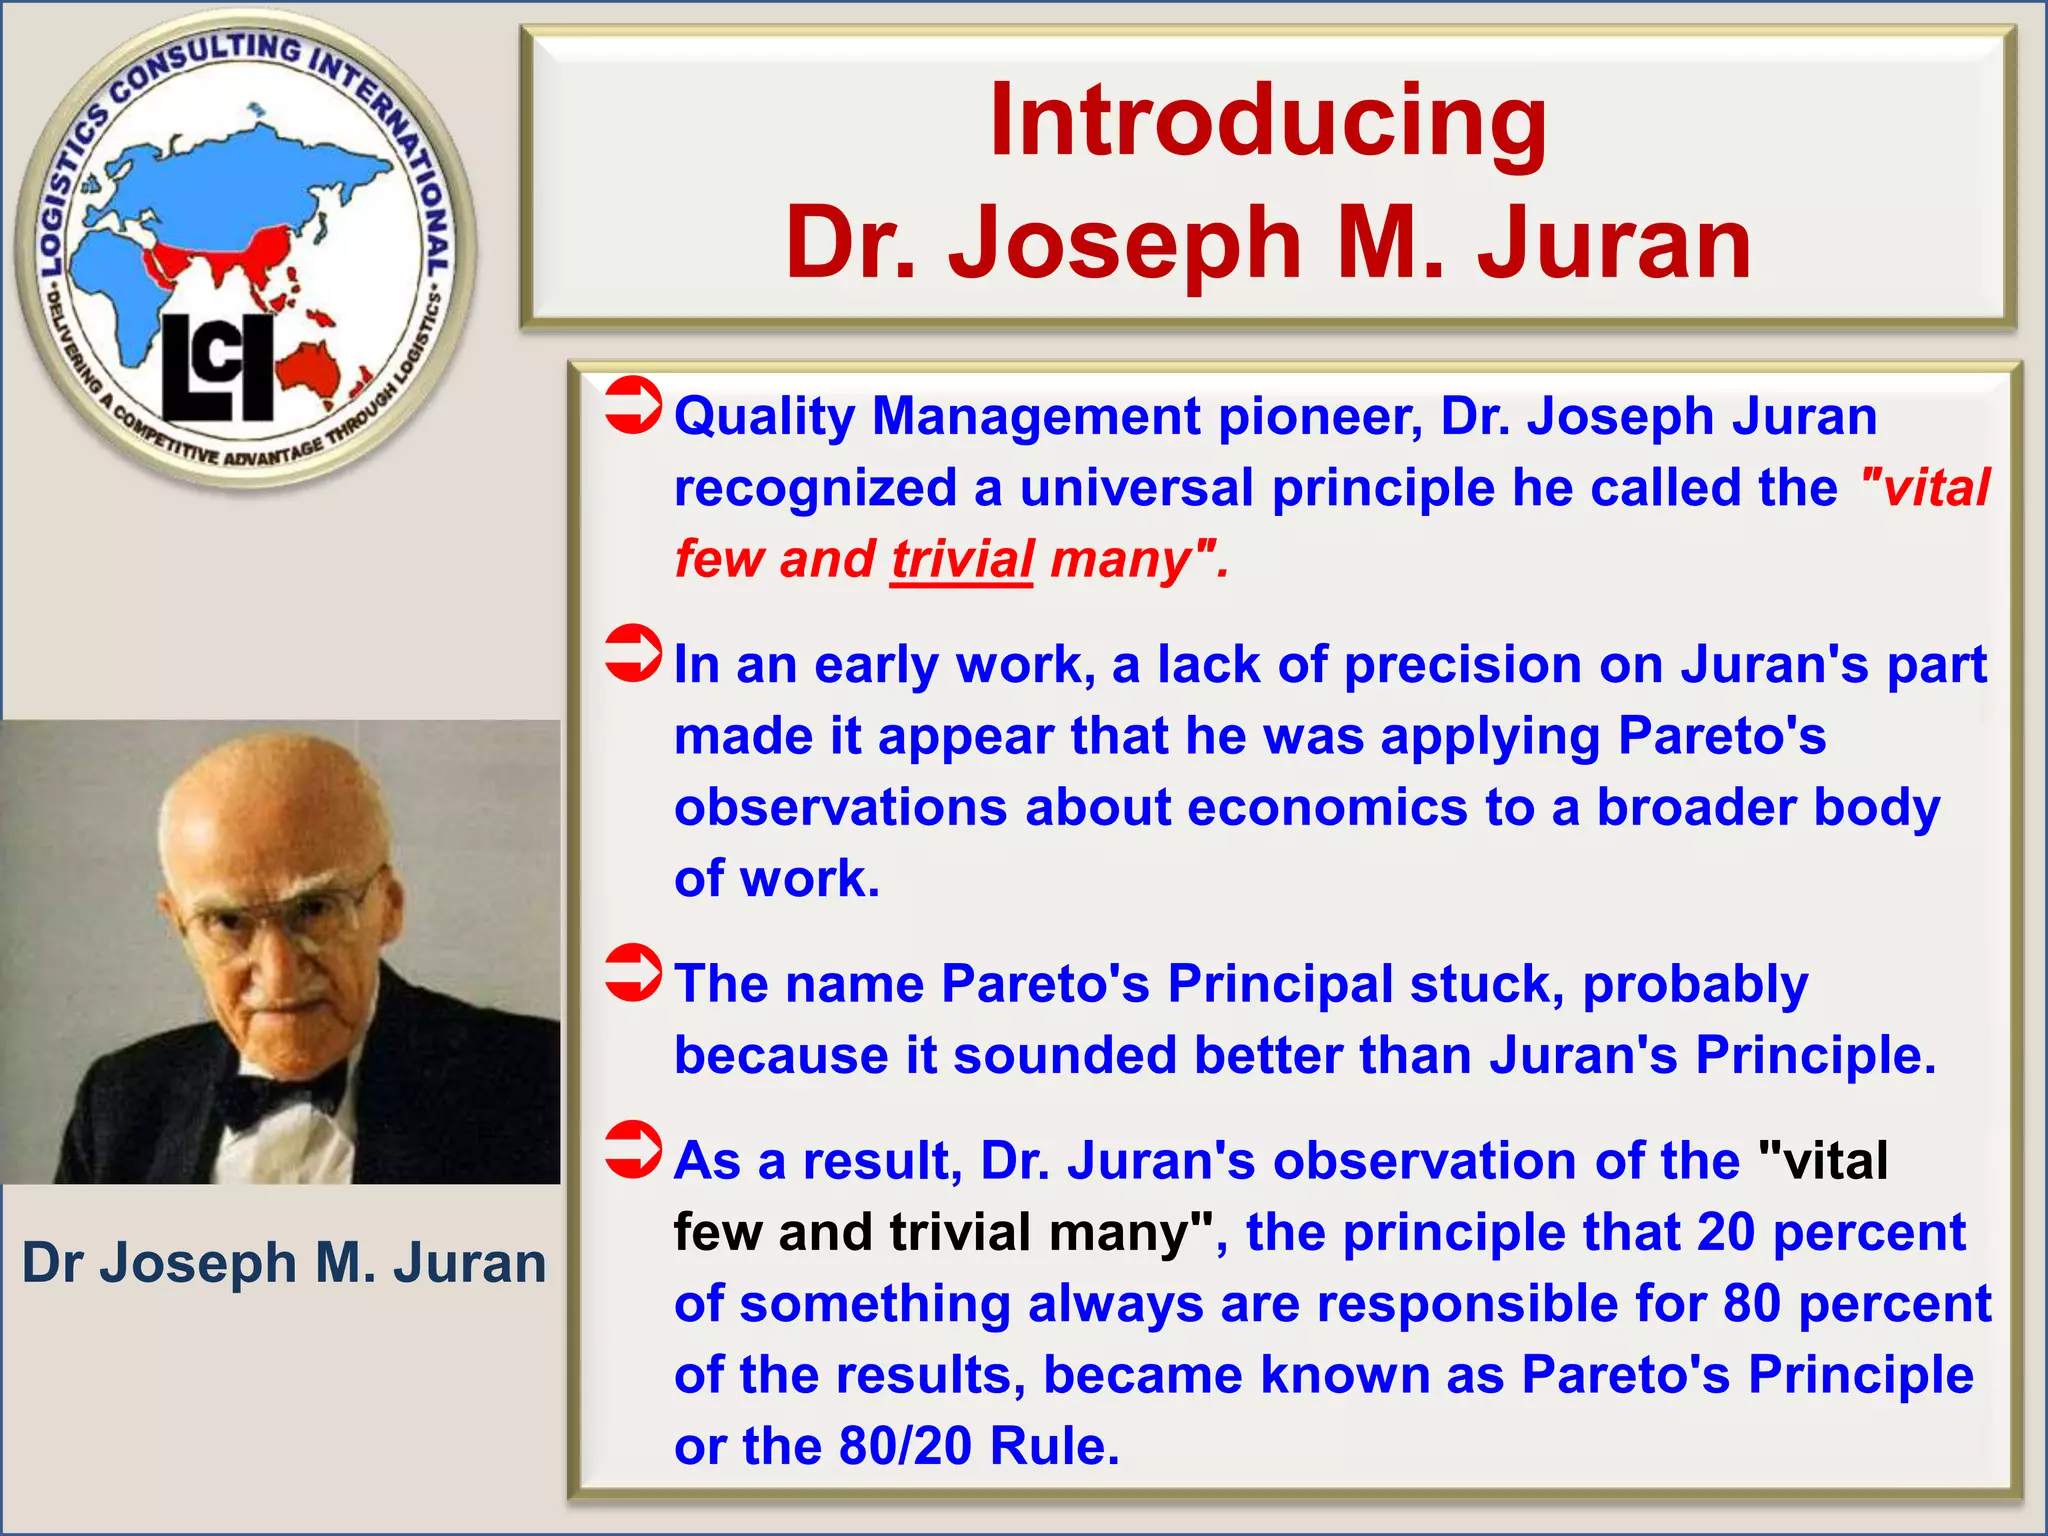
Introducing Dr.Joseph M. JuranQuality Management pioneer, Dr. Joseph Juran recognized a universal principle he called the "vital few and trivial many". In an early work, a lack of precision on Juran's part made it appear that he was applying Pareto's observations about economics to a broader body of work. The name Pareto's Principal stuck, probably because it sounded better than Juran's Principle. As a result, Dr. Juran's observation of the "vital few and trivial many", the principle that 20 percent of something always are responsible for 80 percent of the results, became known as Pareto's Principle or the 80/20 Rule. Dr Joseph M. Juran
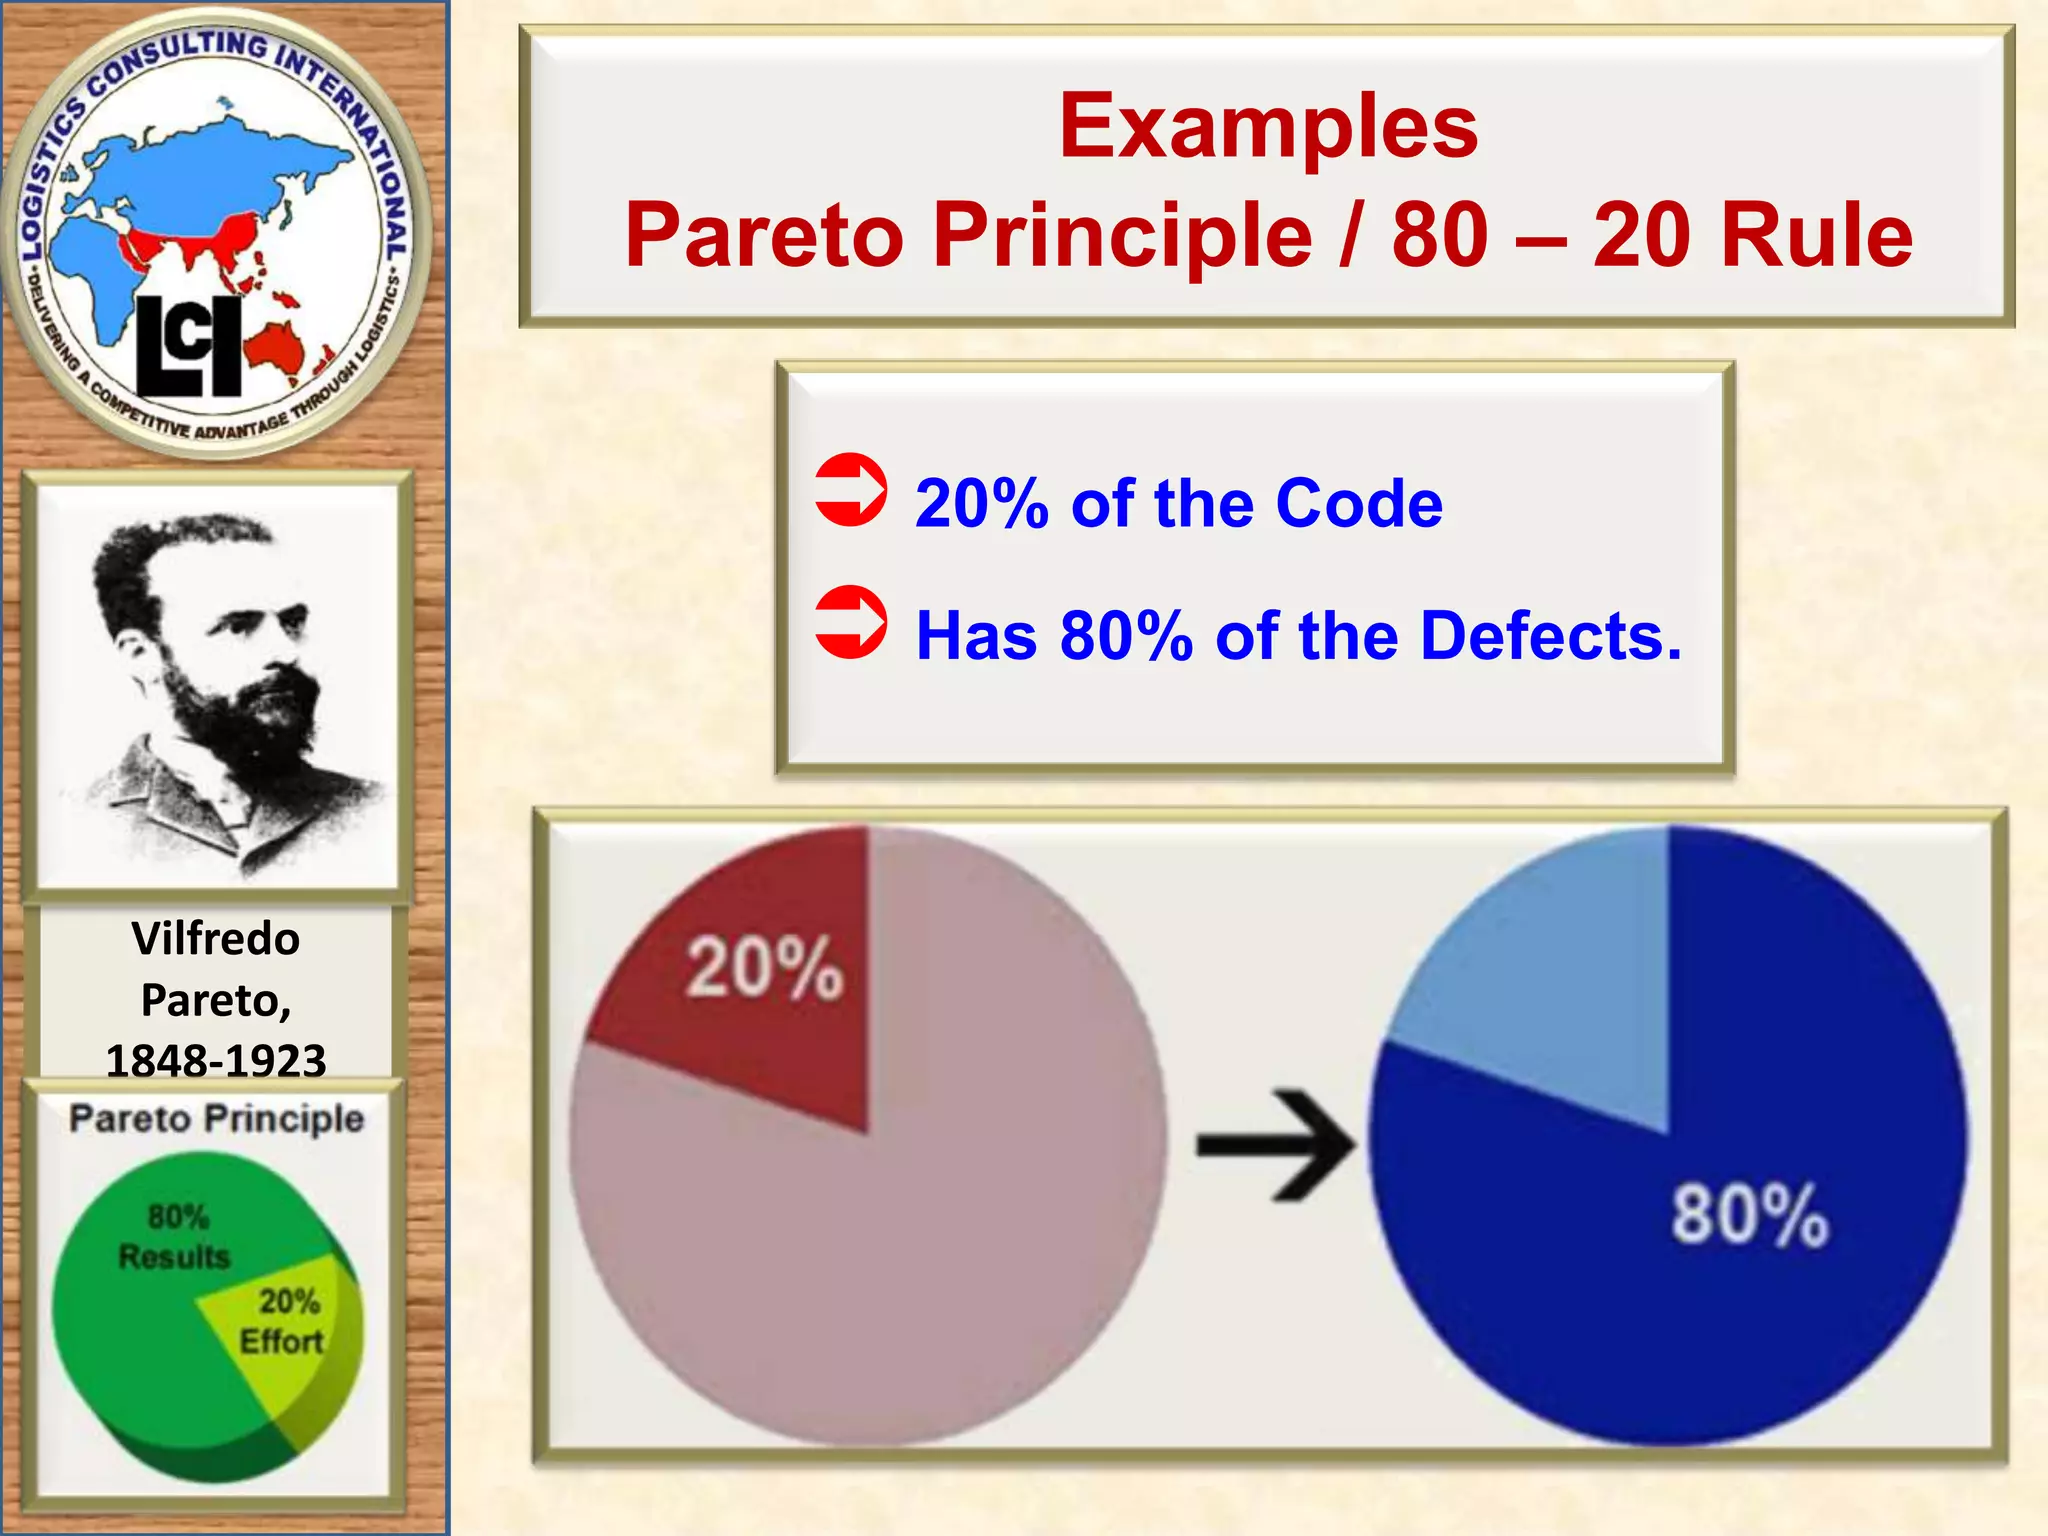
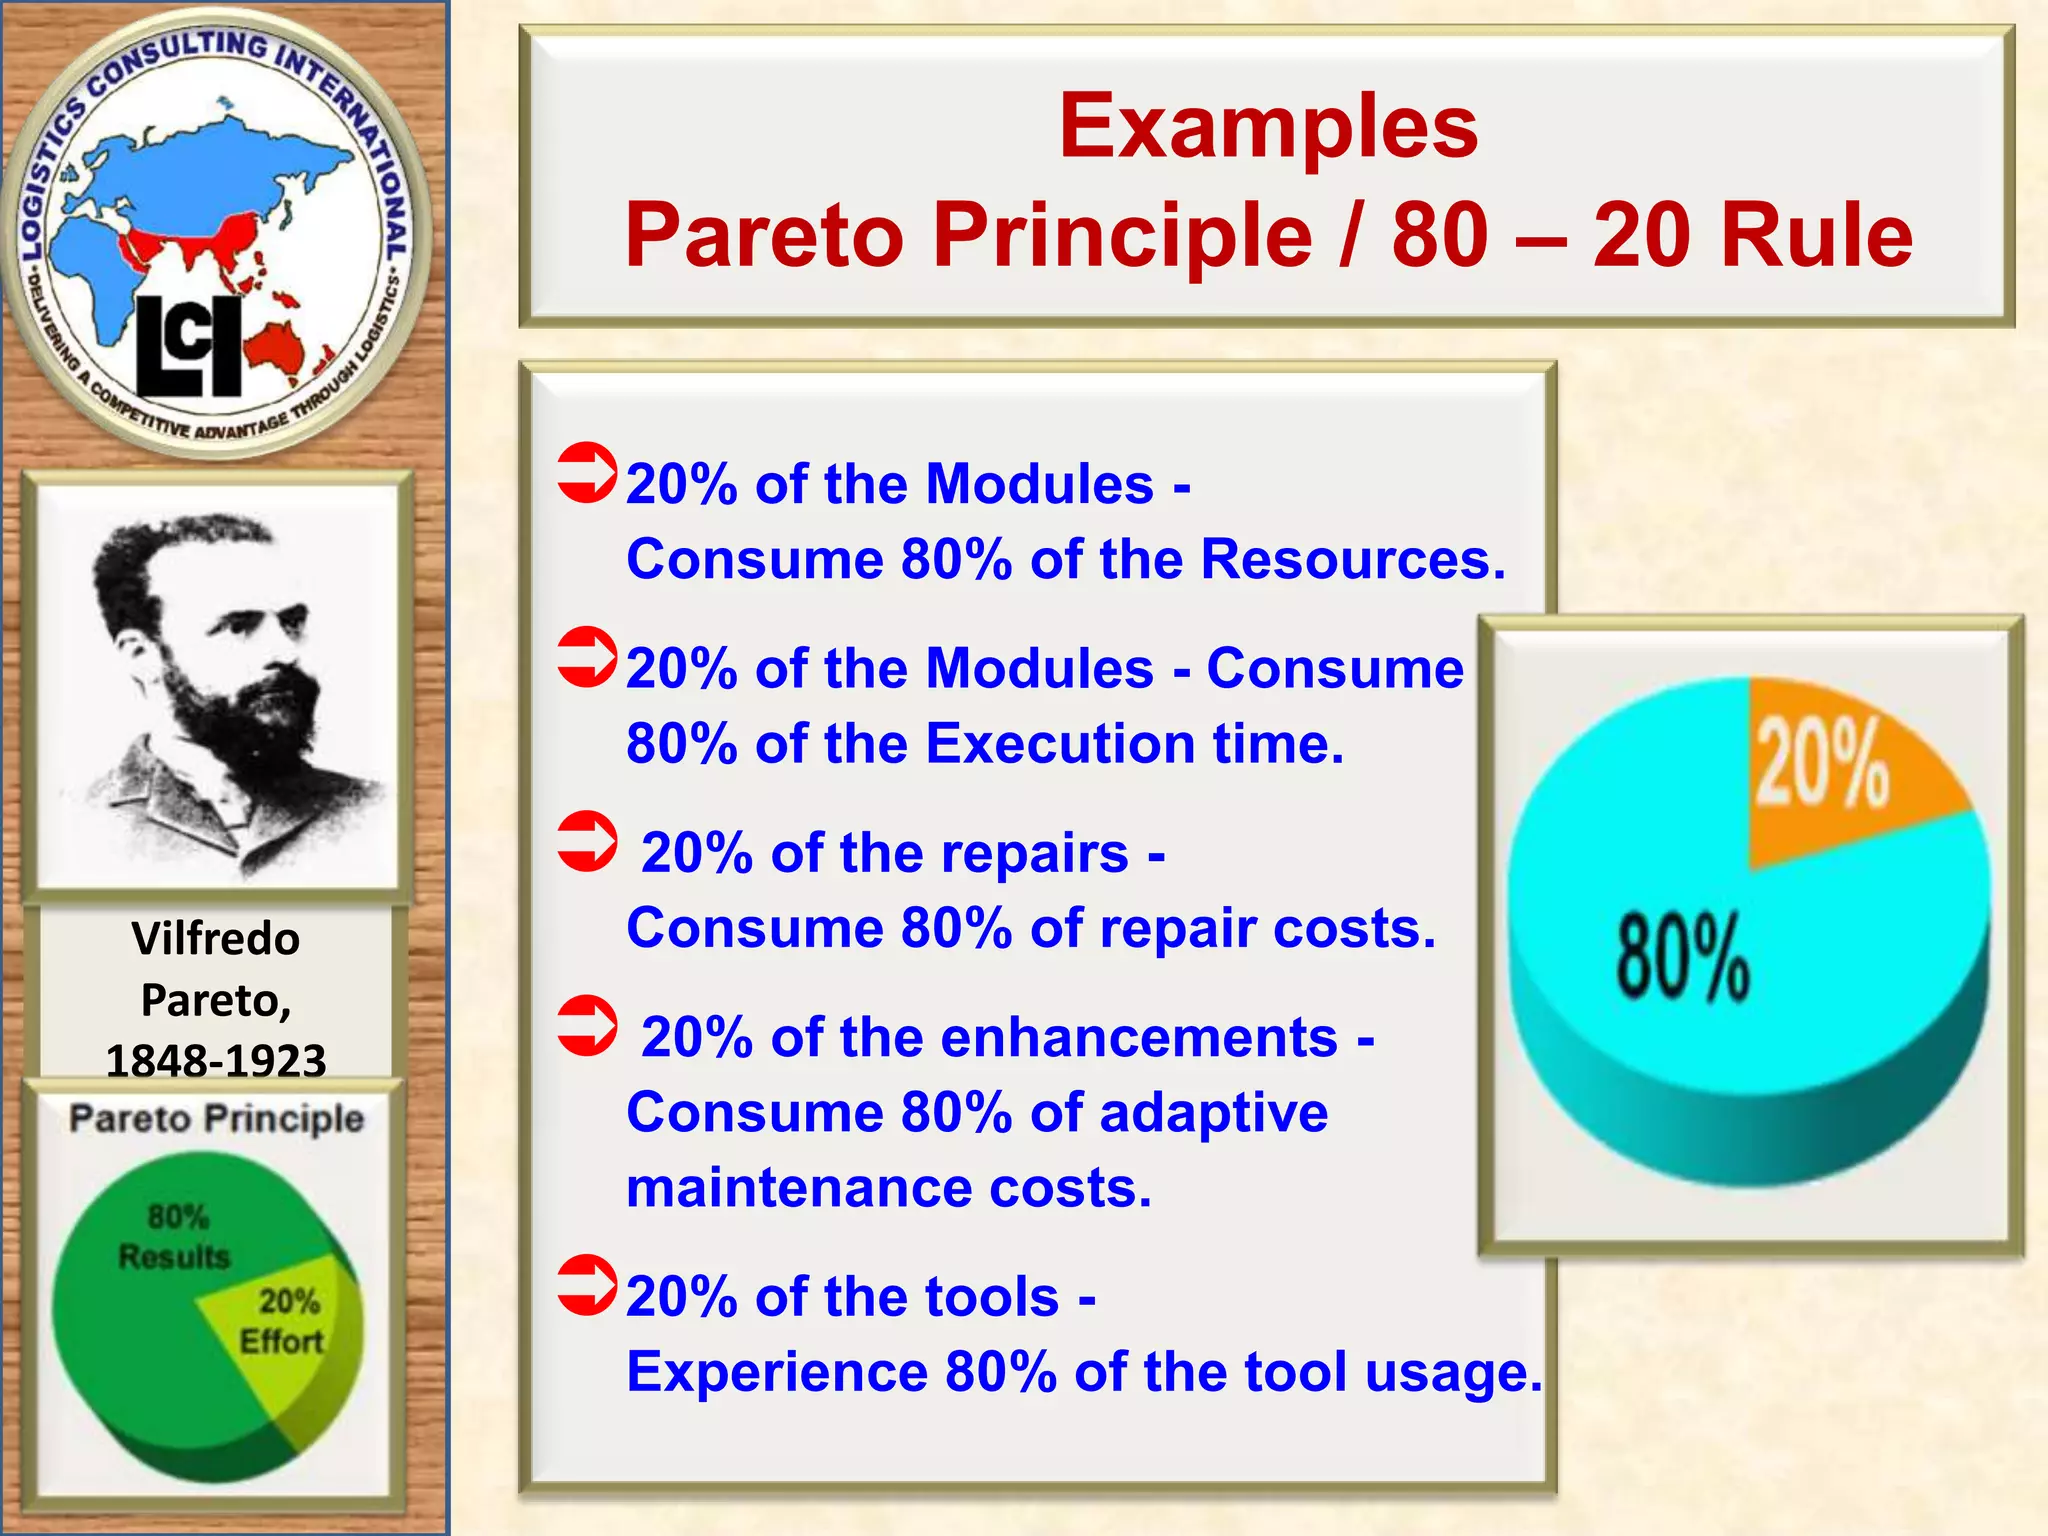
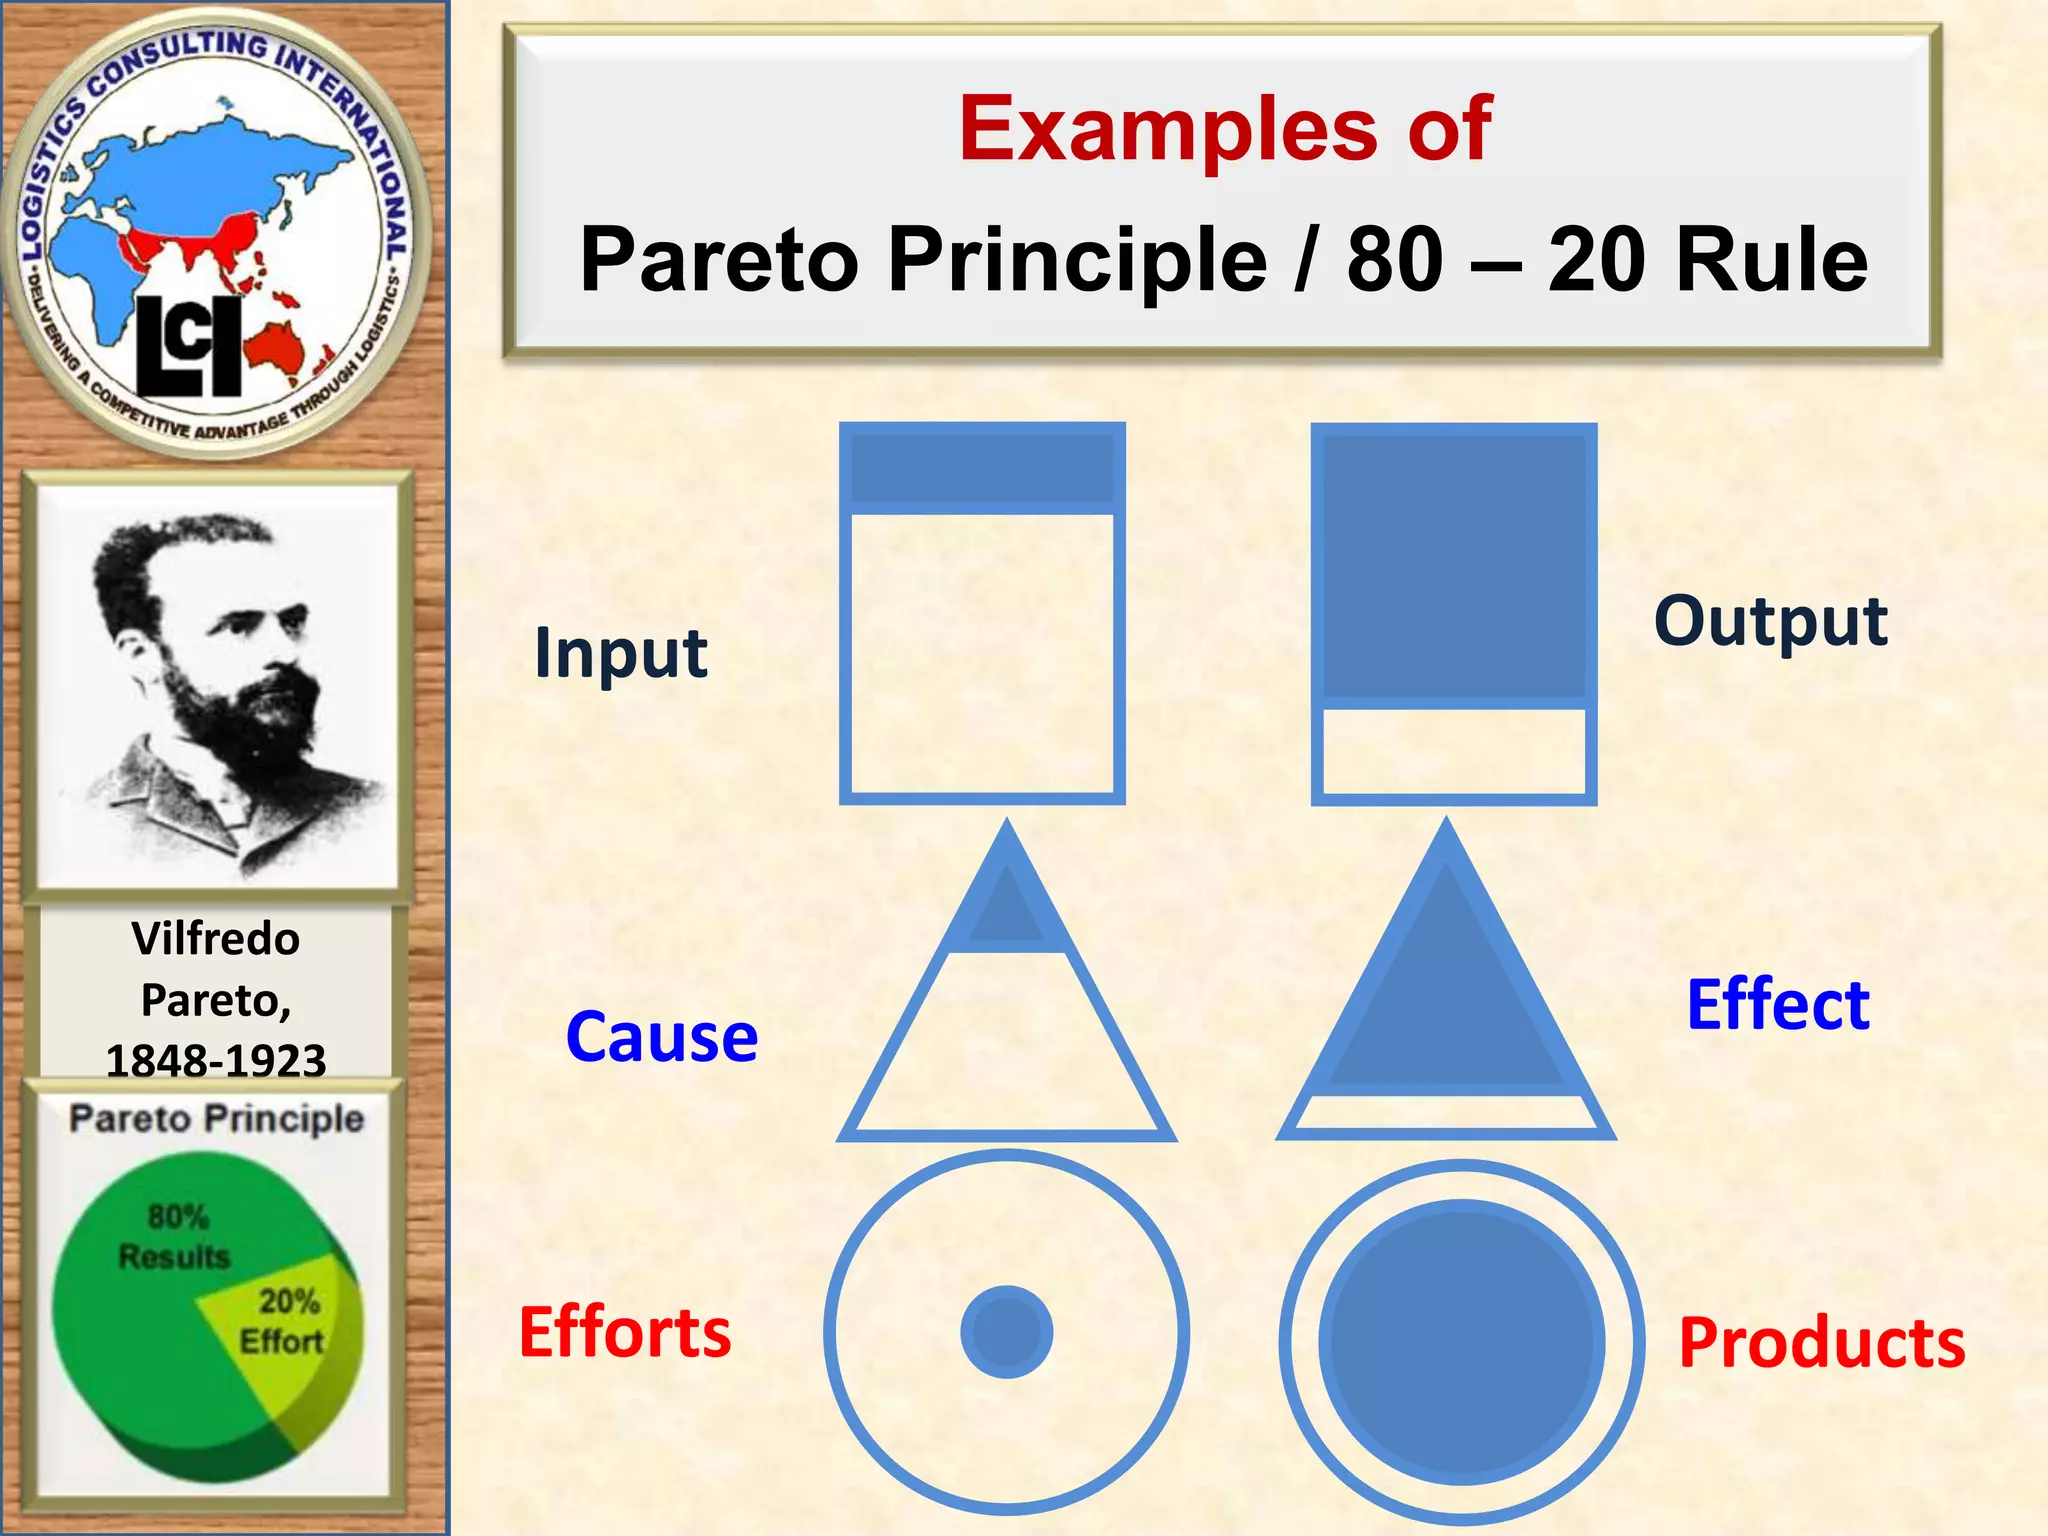
Examples Pareto Principle/ 80 – 20 Rule20% of the Modules - Consume 80% of the Resources.20% of the Modules - Consume 80% of the Execution time. 20% of the repairs - Consume 80% of repair costs. 20% of the enhancements - Consume 80% of adaptive maintenance costs.20% of the tools - Experience 80% of the tool usage.
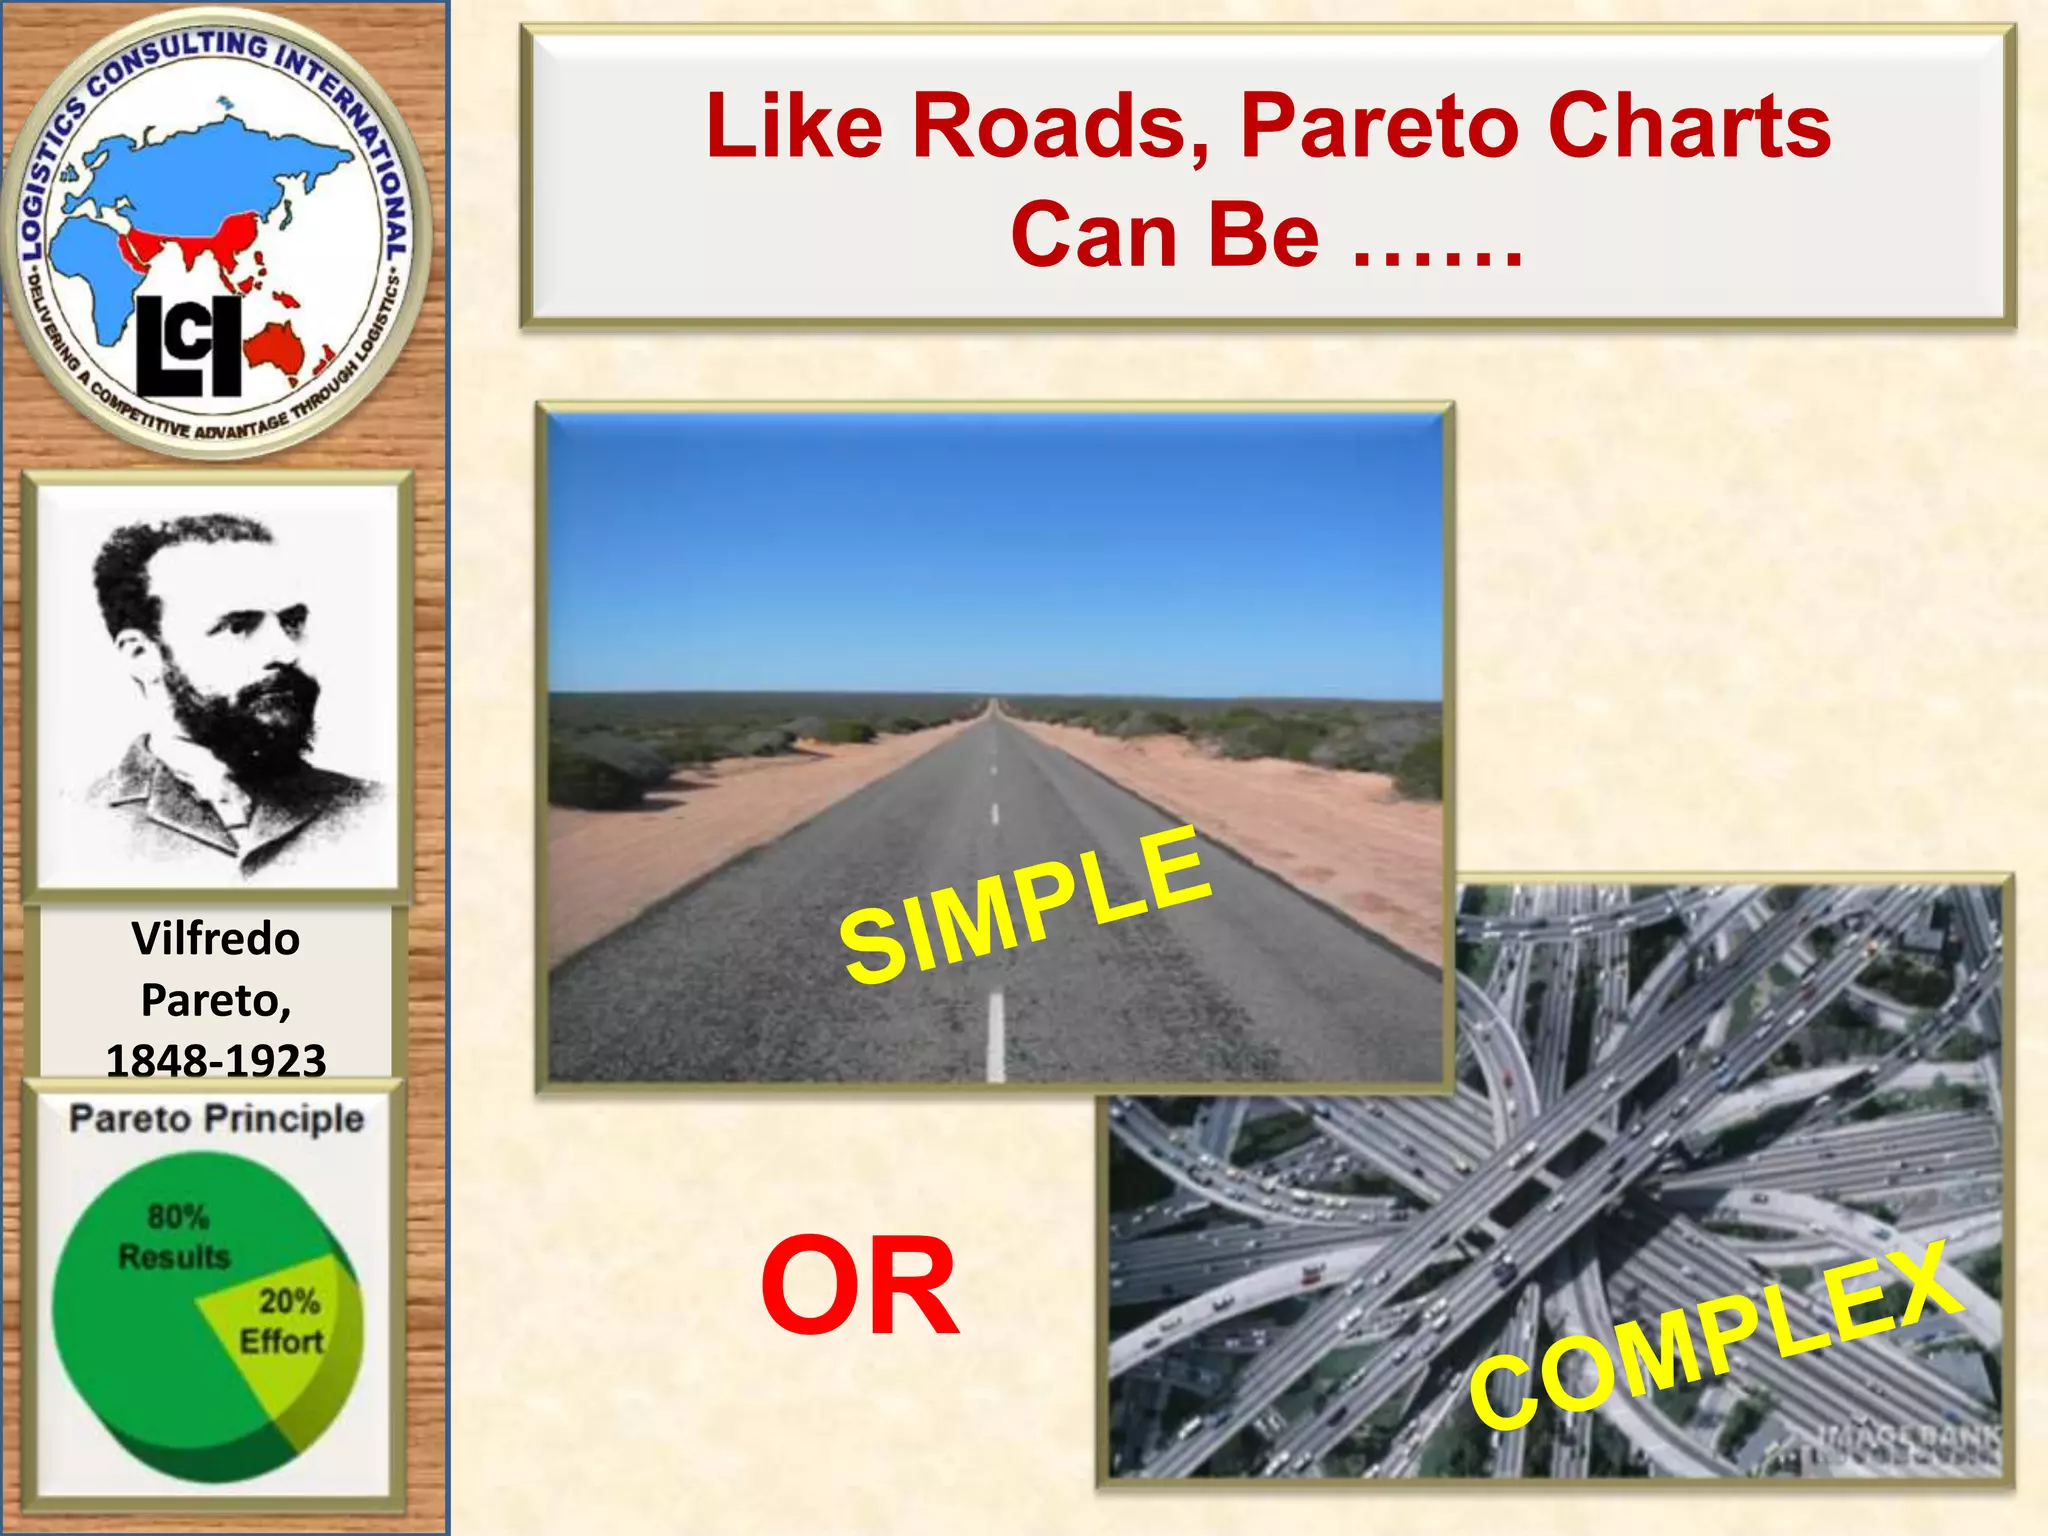
What Makes TheCharts “Complex”?Our initial “Simple” Charts will only involve examination of the “Production of Doors” with only:6 Manufacturing Defects,Over a Period of 31 Days.Now visualize the greater complexity of Charts for;An Inventory of 30,000 + Stock Keeping Units / Items Over a Period of 365 days.When we are comfortable with the “Process” – the “Complex will become Simple”
15.
SO ……In thisSession we will start with simple “Manual” Bar Charts - to learn the “Process” …..Then ……In the NEXT Session “ABC Analysis” we will move on to more complex Charts using “MS Excel” to apply the “Process” to large amounts of (Real Life) Data
16.
Variables & DataVariablesand data can be:Qualitative = the answer isNOT a number; orQuantitative = the answer IS a number.REMEMBER - In Exercise 1Chart we will only be examining ONE “Quantitative” VARIABLE – “Frequency”
17.
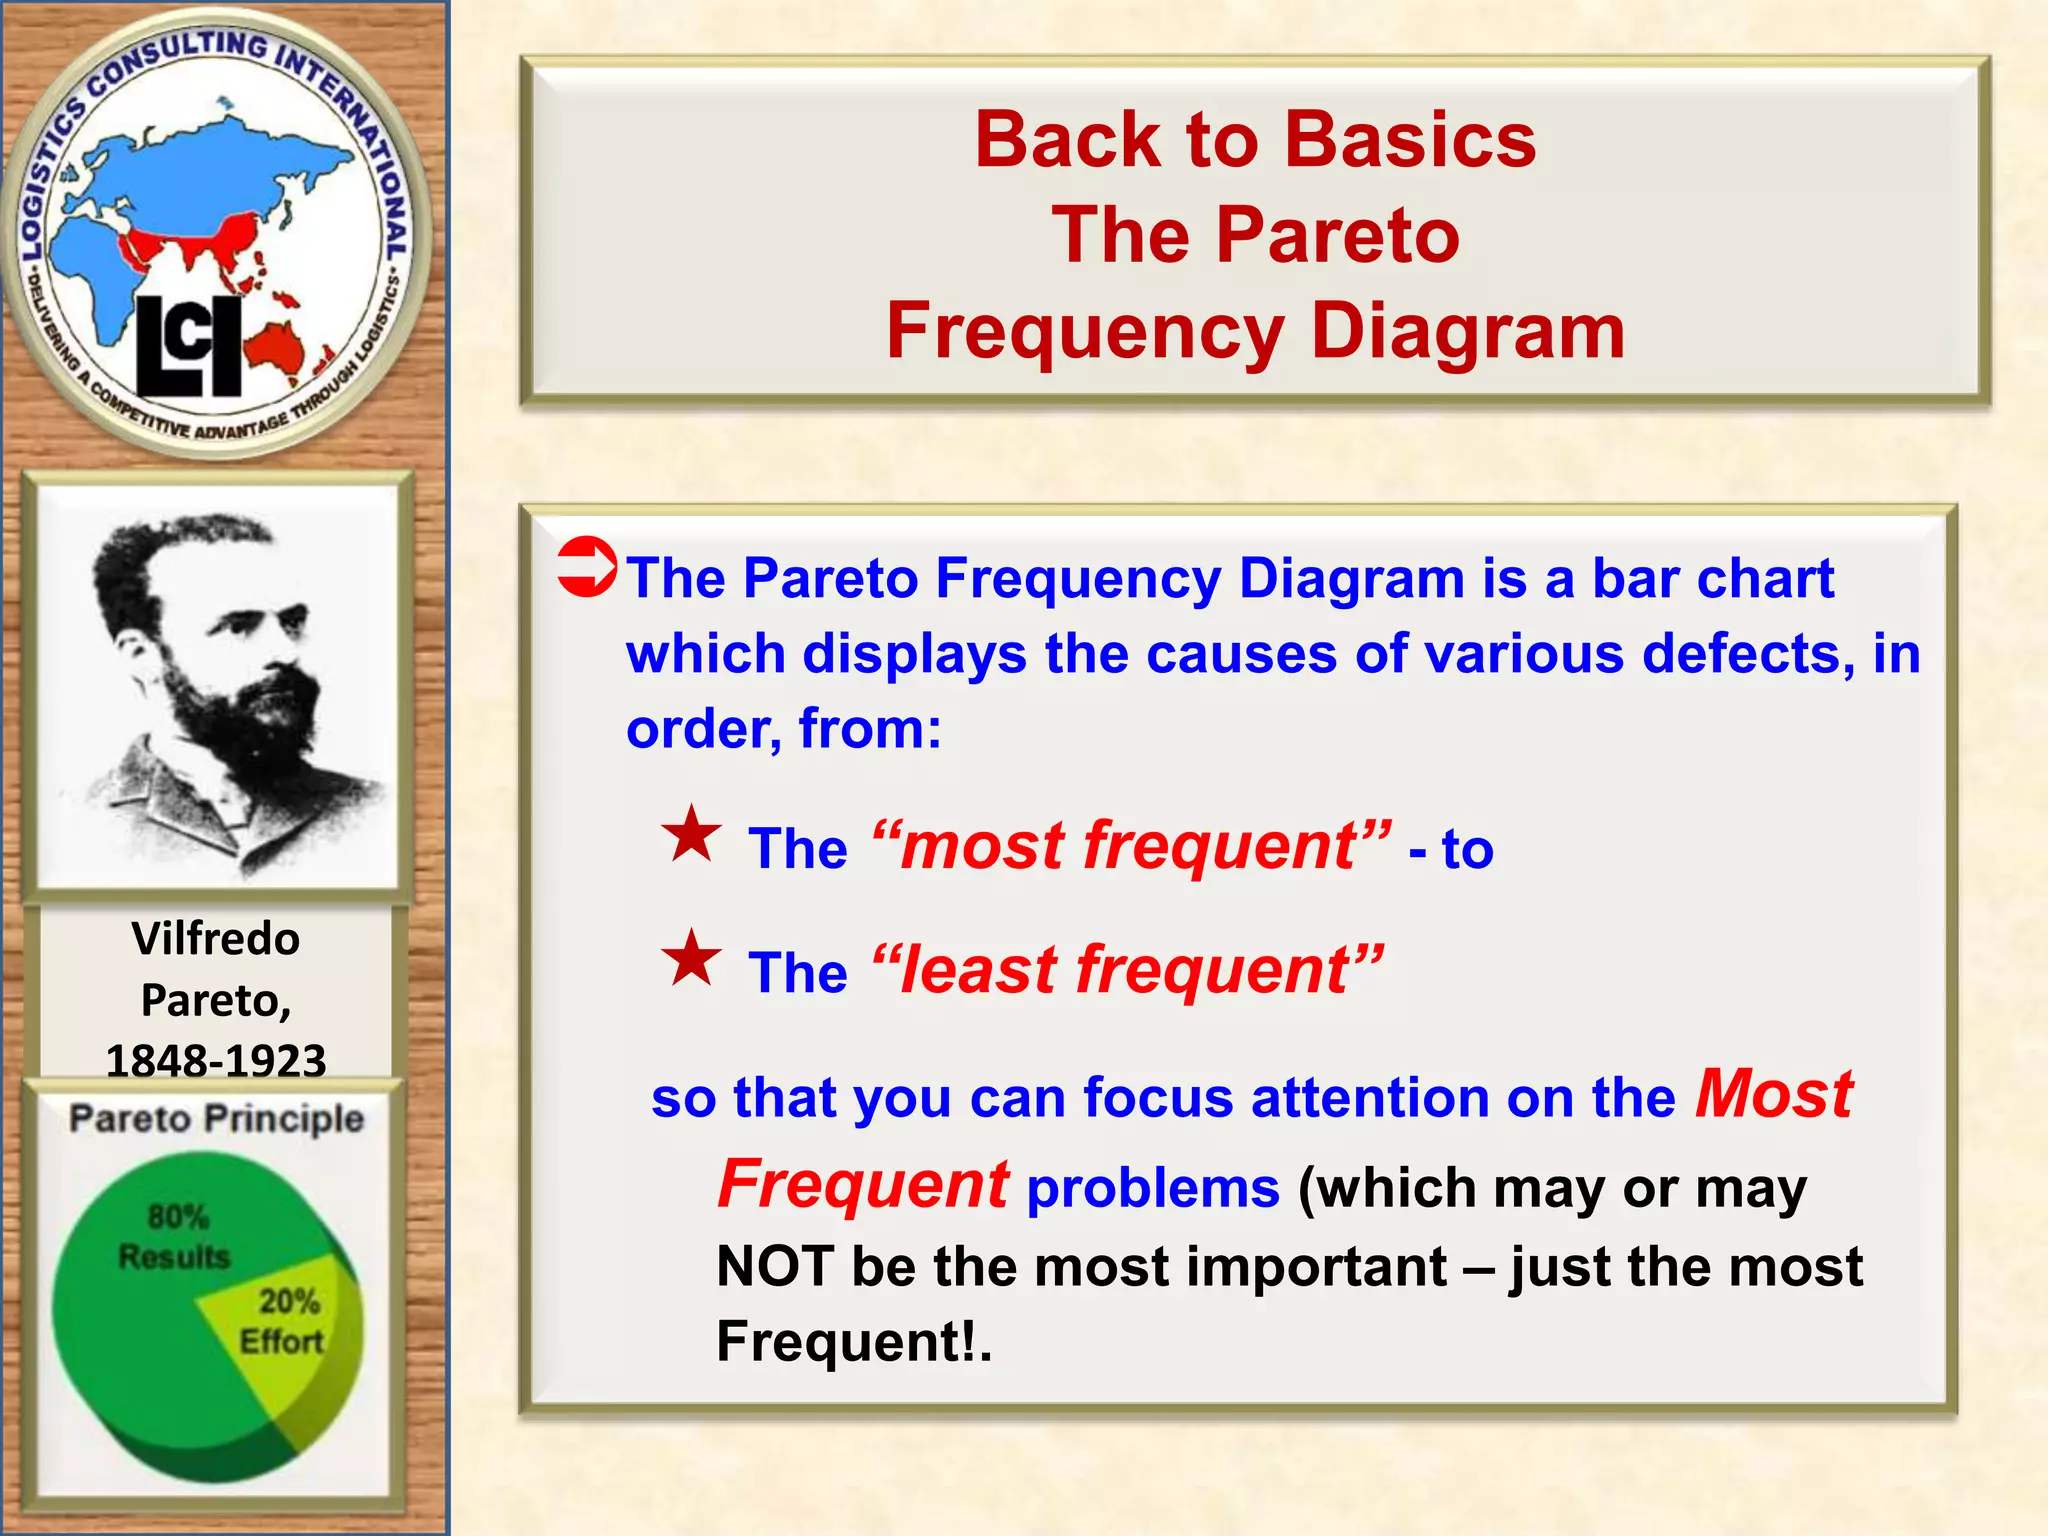
Back to BasicsThePareto Frequency DiagramThe Pareto Frequency Diagram is a bar chart which displays the causes of various defects, in order, from: The “most frequent” - to The “least frequent” so that you can focus attention on the Most Frequent problems (which may or may NOT be the most important – just the most Frequent!.
18.
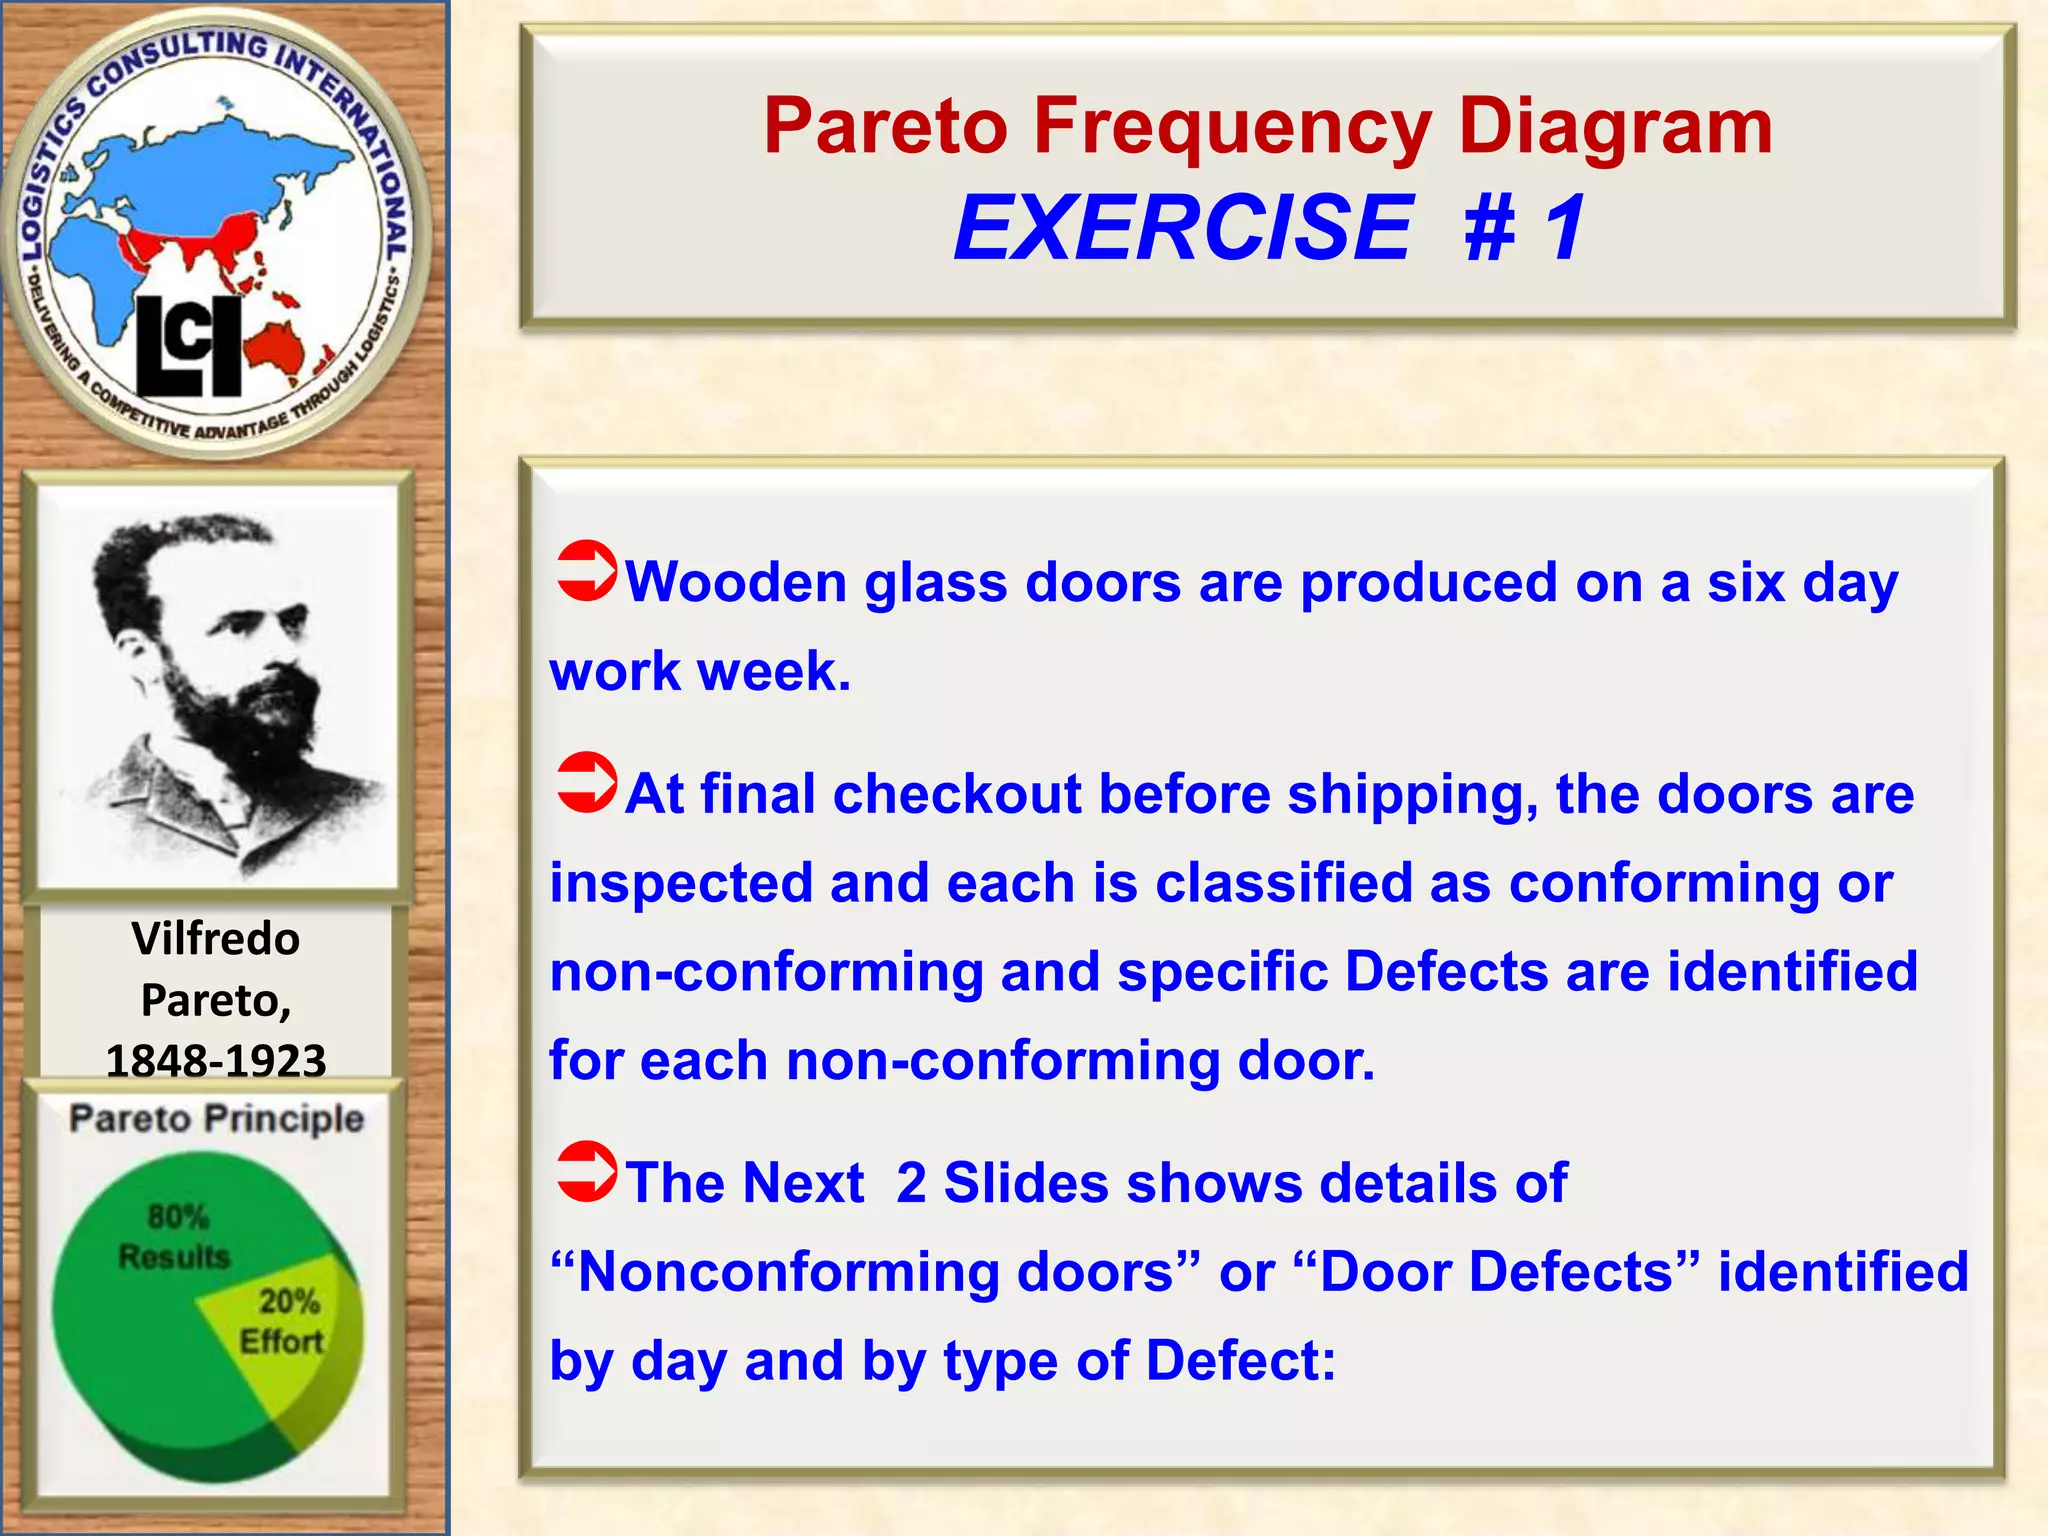
Pareto Frequency DiagramEXERCISE # 1Wooden glass doors are produced on a six day work week. At final checkout before shipping, the doors are inspected and each is classified as conforming or non-conforming and specific Defects are identified for each non-conforming door.The Next 2 Slides shows details of “Nonconforming doors” or “Door Defects” identified by day and by type of Defect:
19.
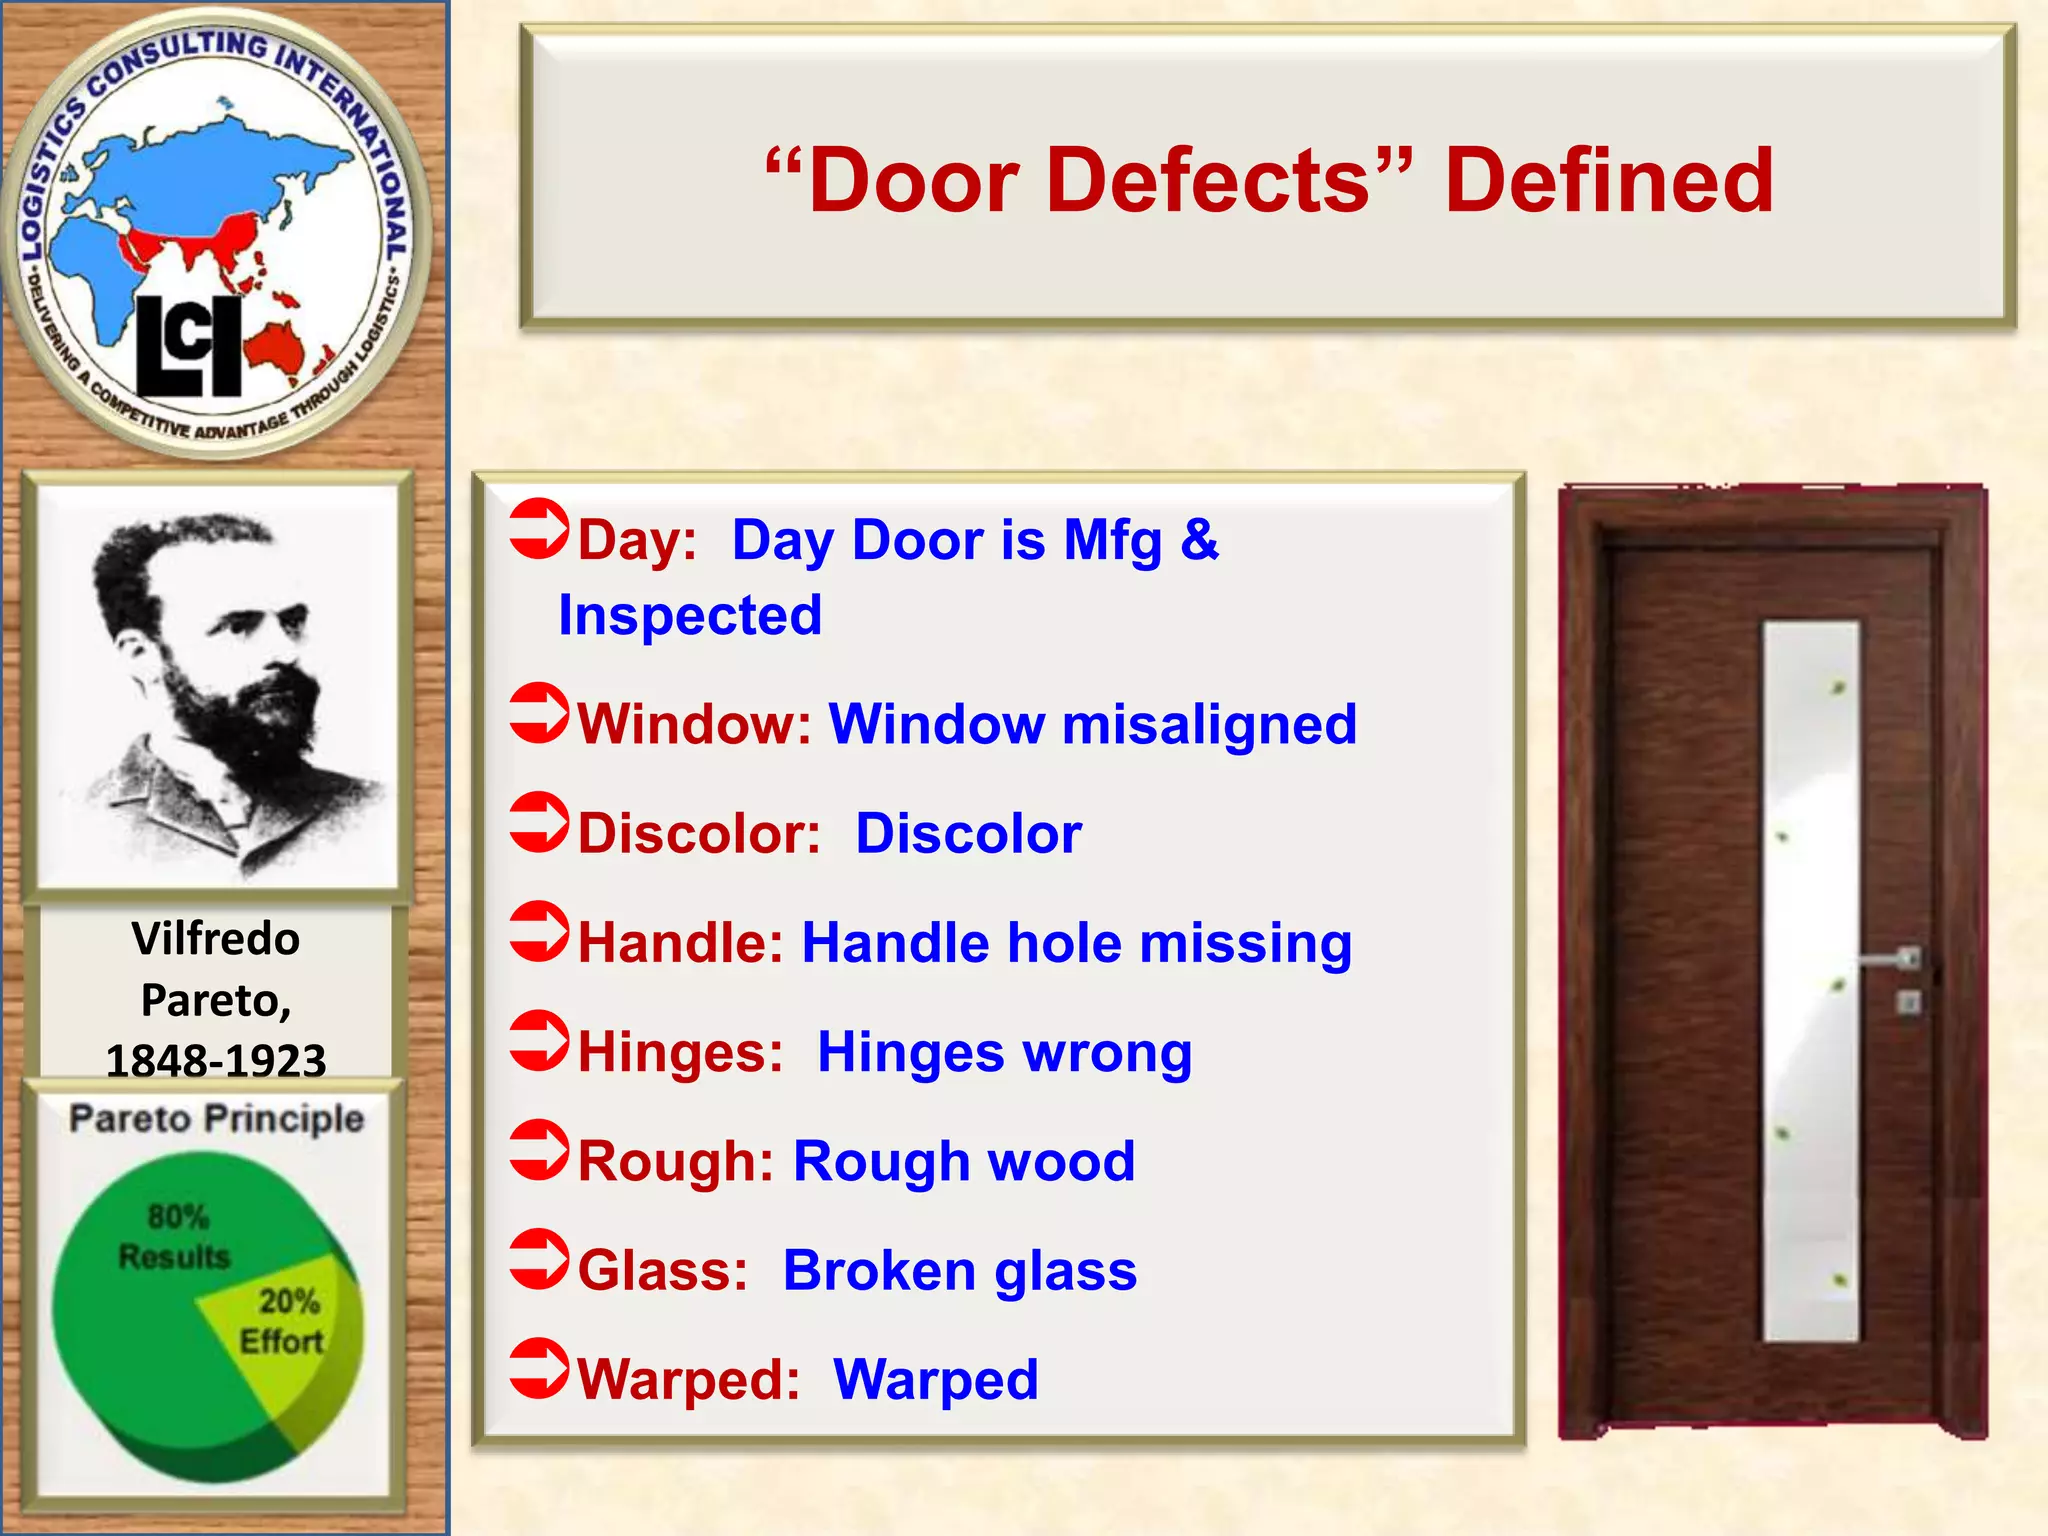
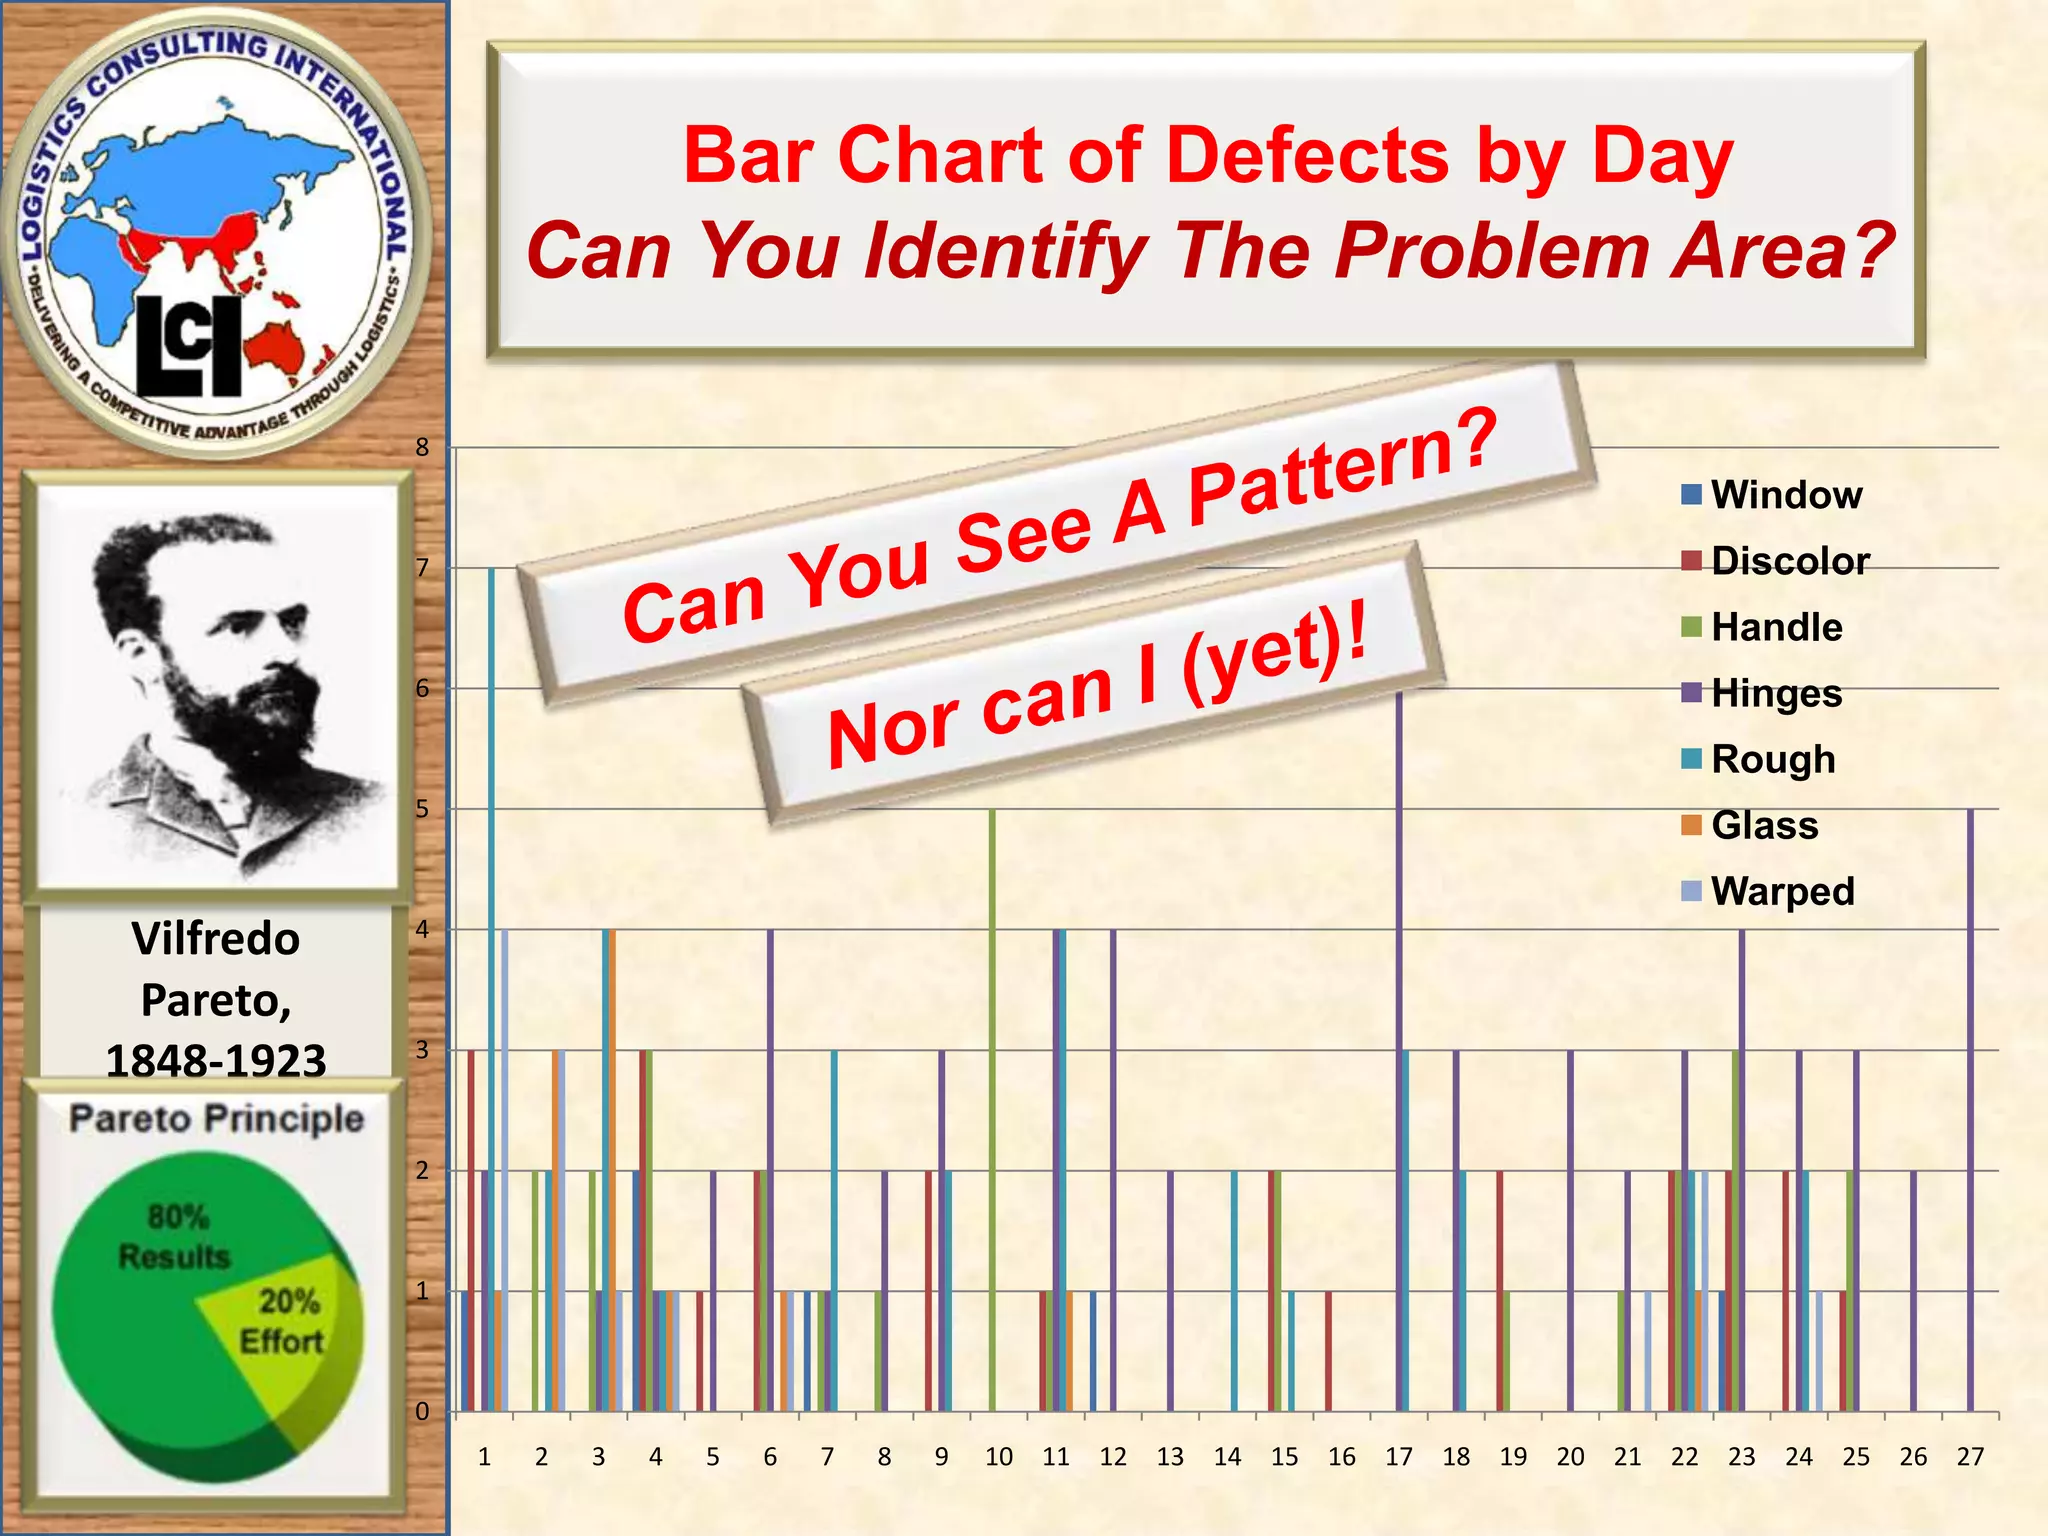
“Door Defects” DefinedDay: Day Door is Mfg & InspectedWindow: Window misalignedDiscolor: Discolor Handle: Handle hole missingHinges: Hinges wrong Rough: Rough wood Glass: Broken glass Warped: Warped
Bar Chart ofDefects by DayCan You Identify The Problem Area?Can You See A Pattern?Nor can I (yet)!
22.
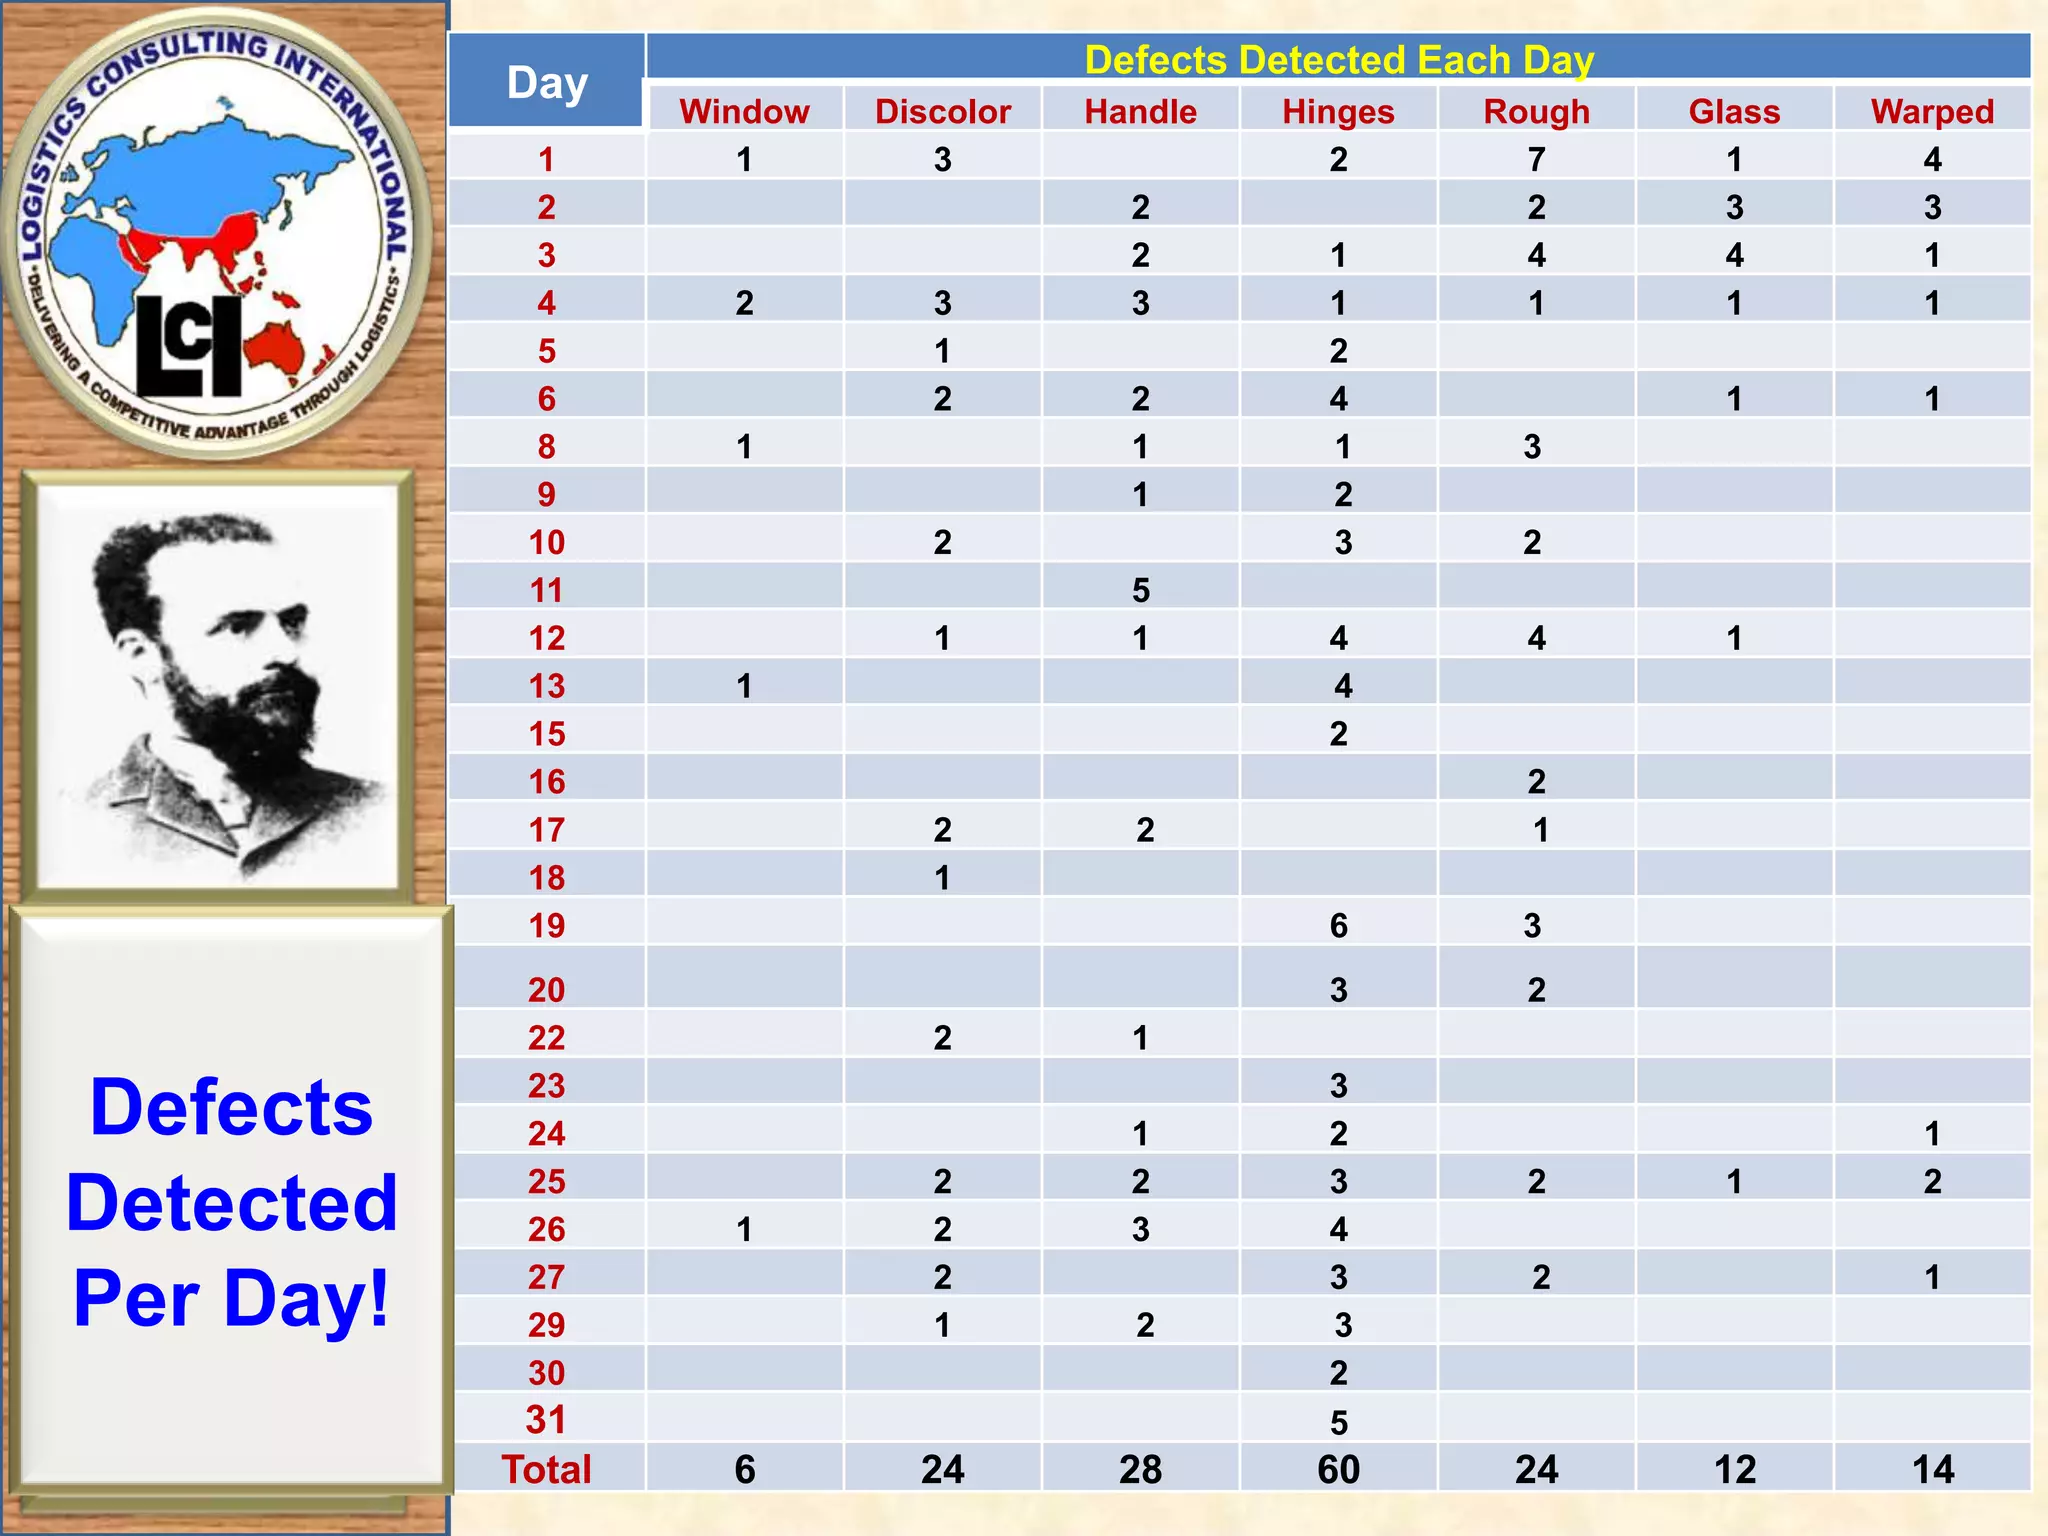
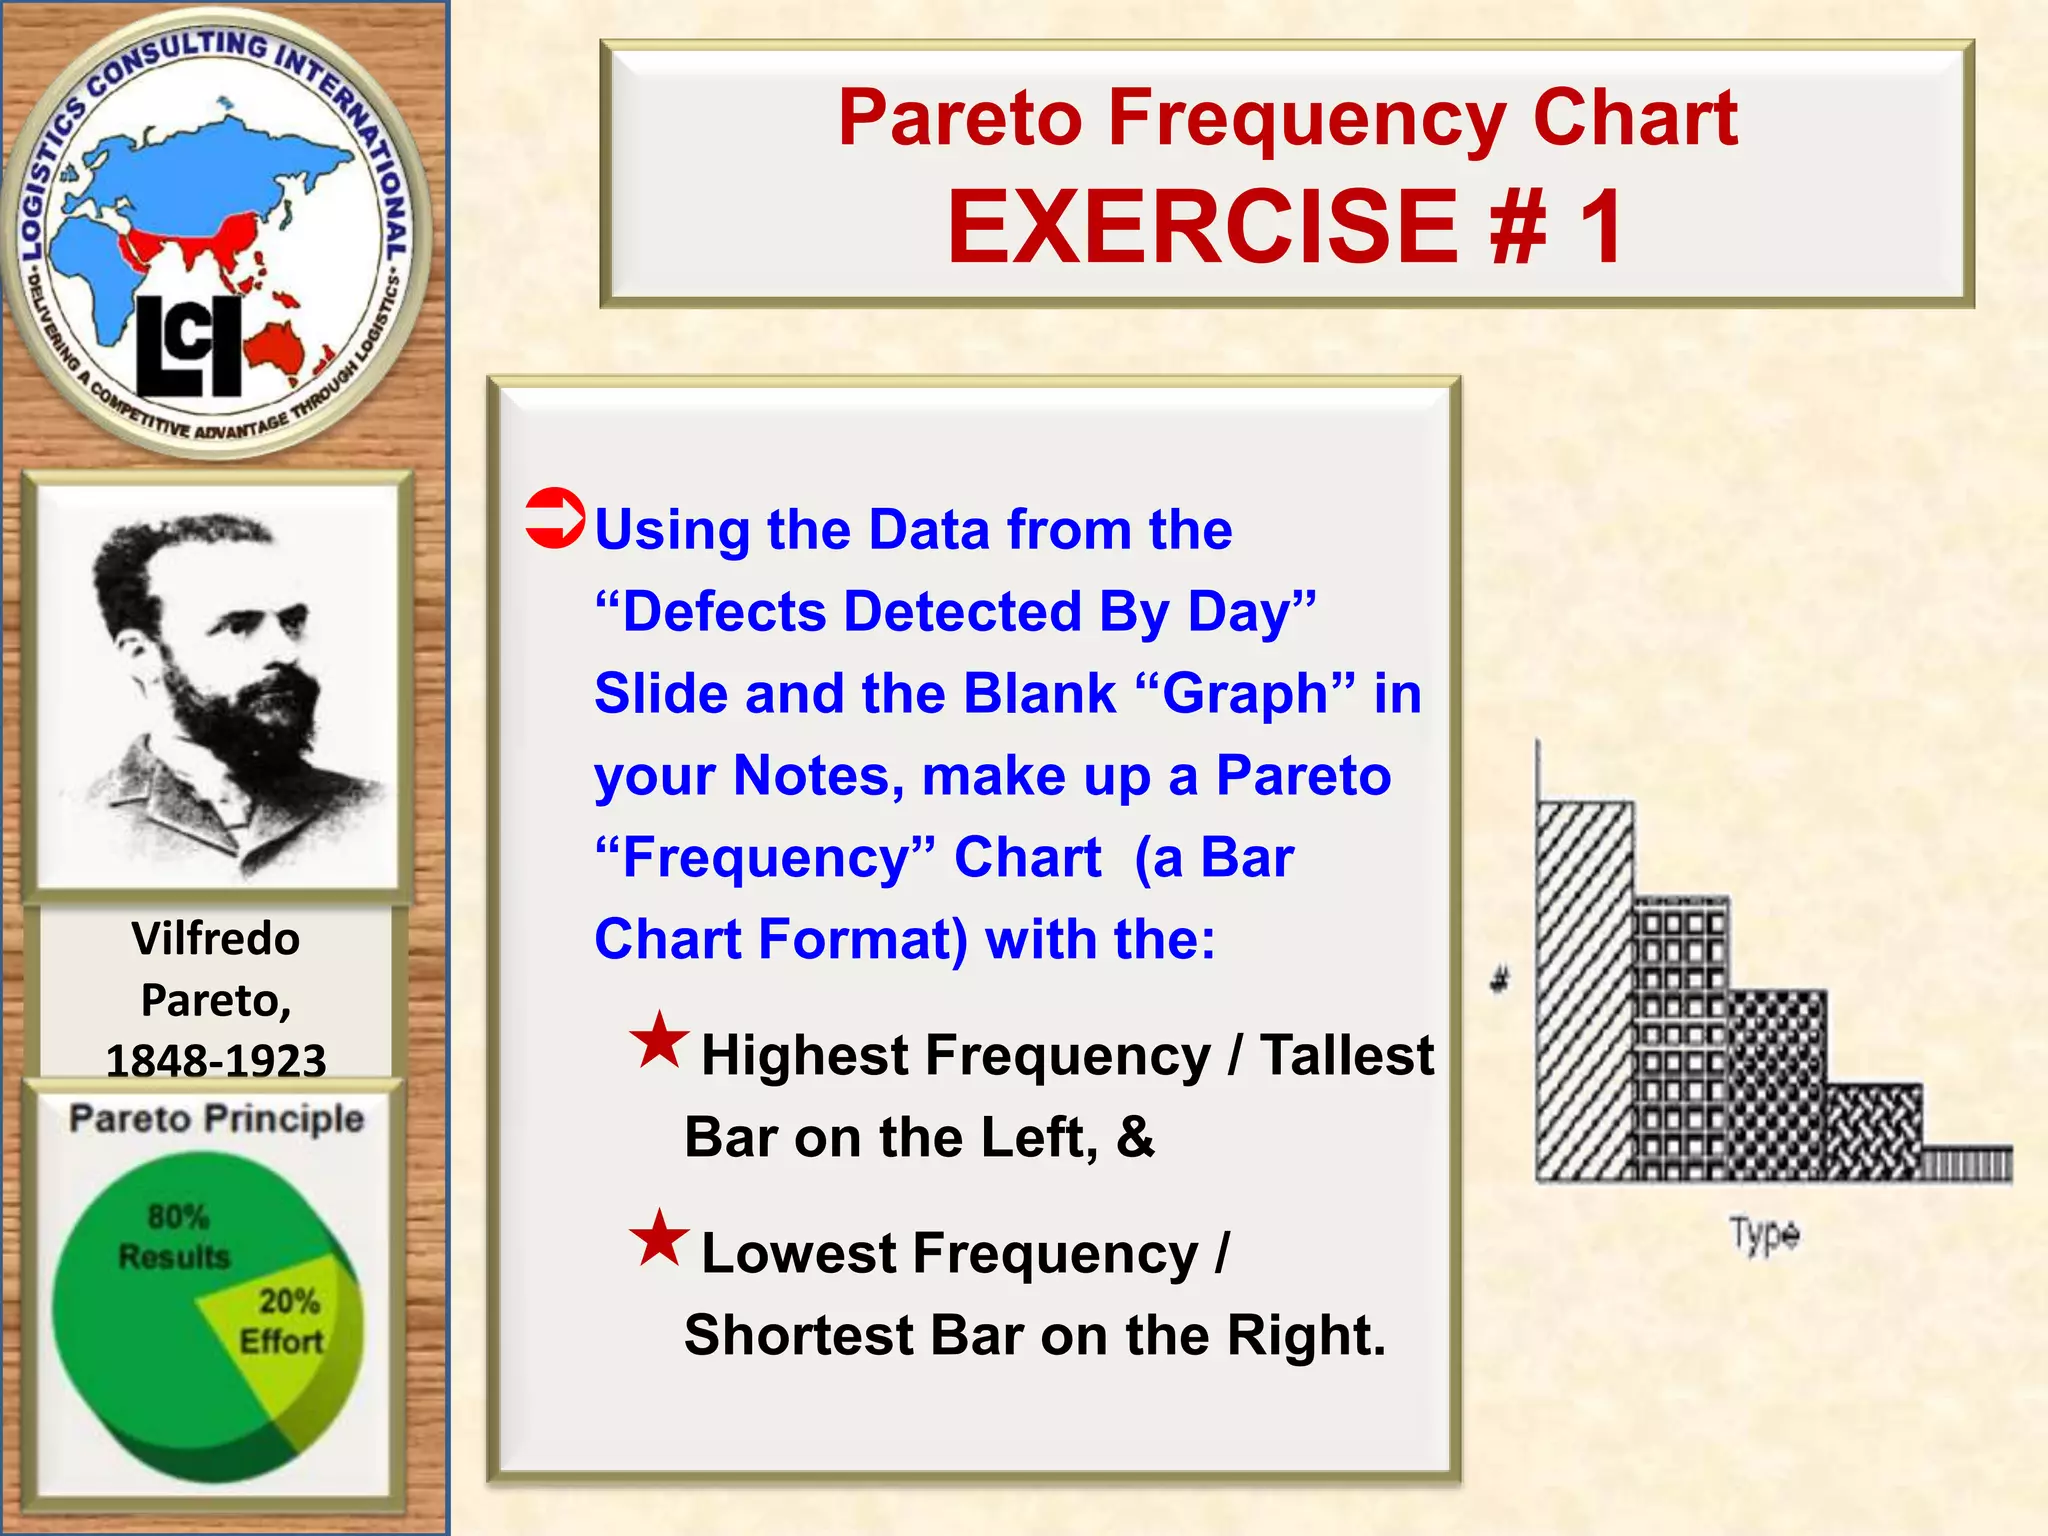
Pareto Frequency ChartEXERCISE # 1 Using the Data from the “Defects Detected By Day” Slide and the Blank “Graph” in your Notes, make up a Pareto “Frequency” Chart (a Bar Chart Format) with the:Highest Frequency / Tallest Bar on the Left, &Lowest Frequency / Shortest Bar on the Right.
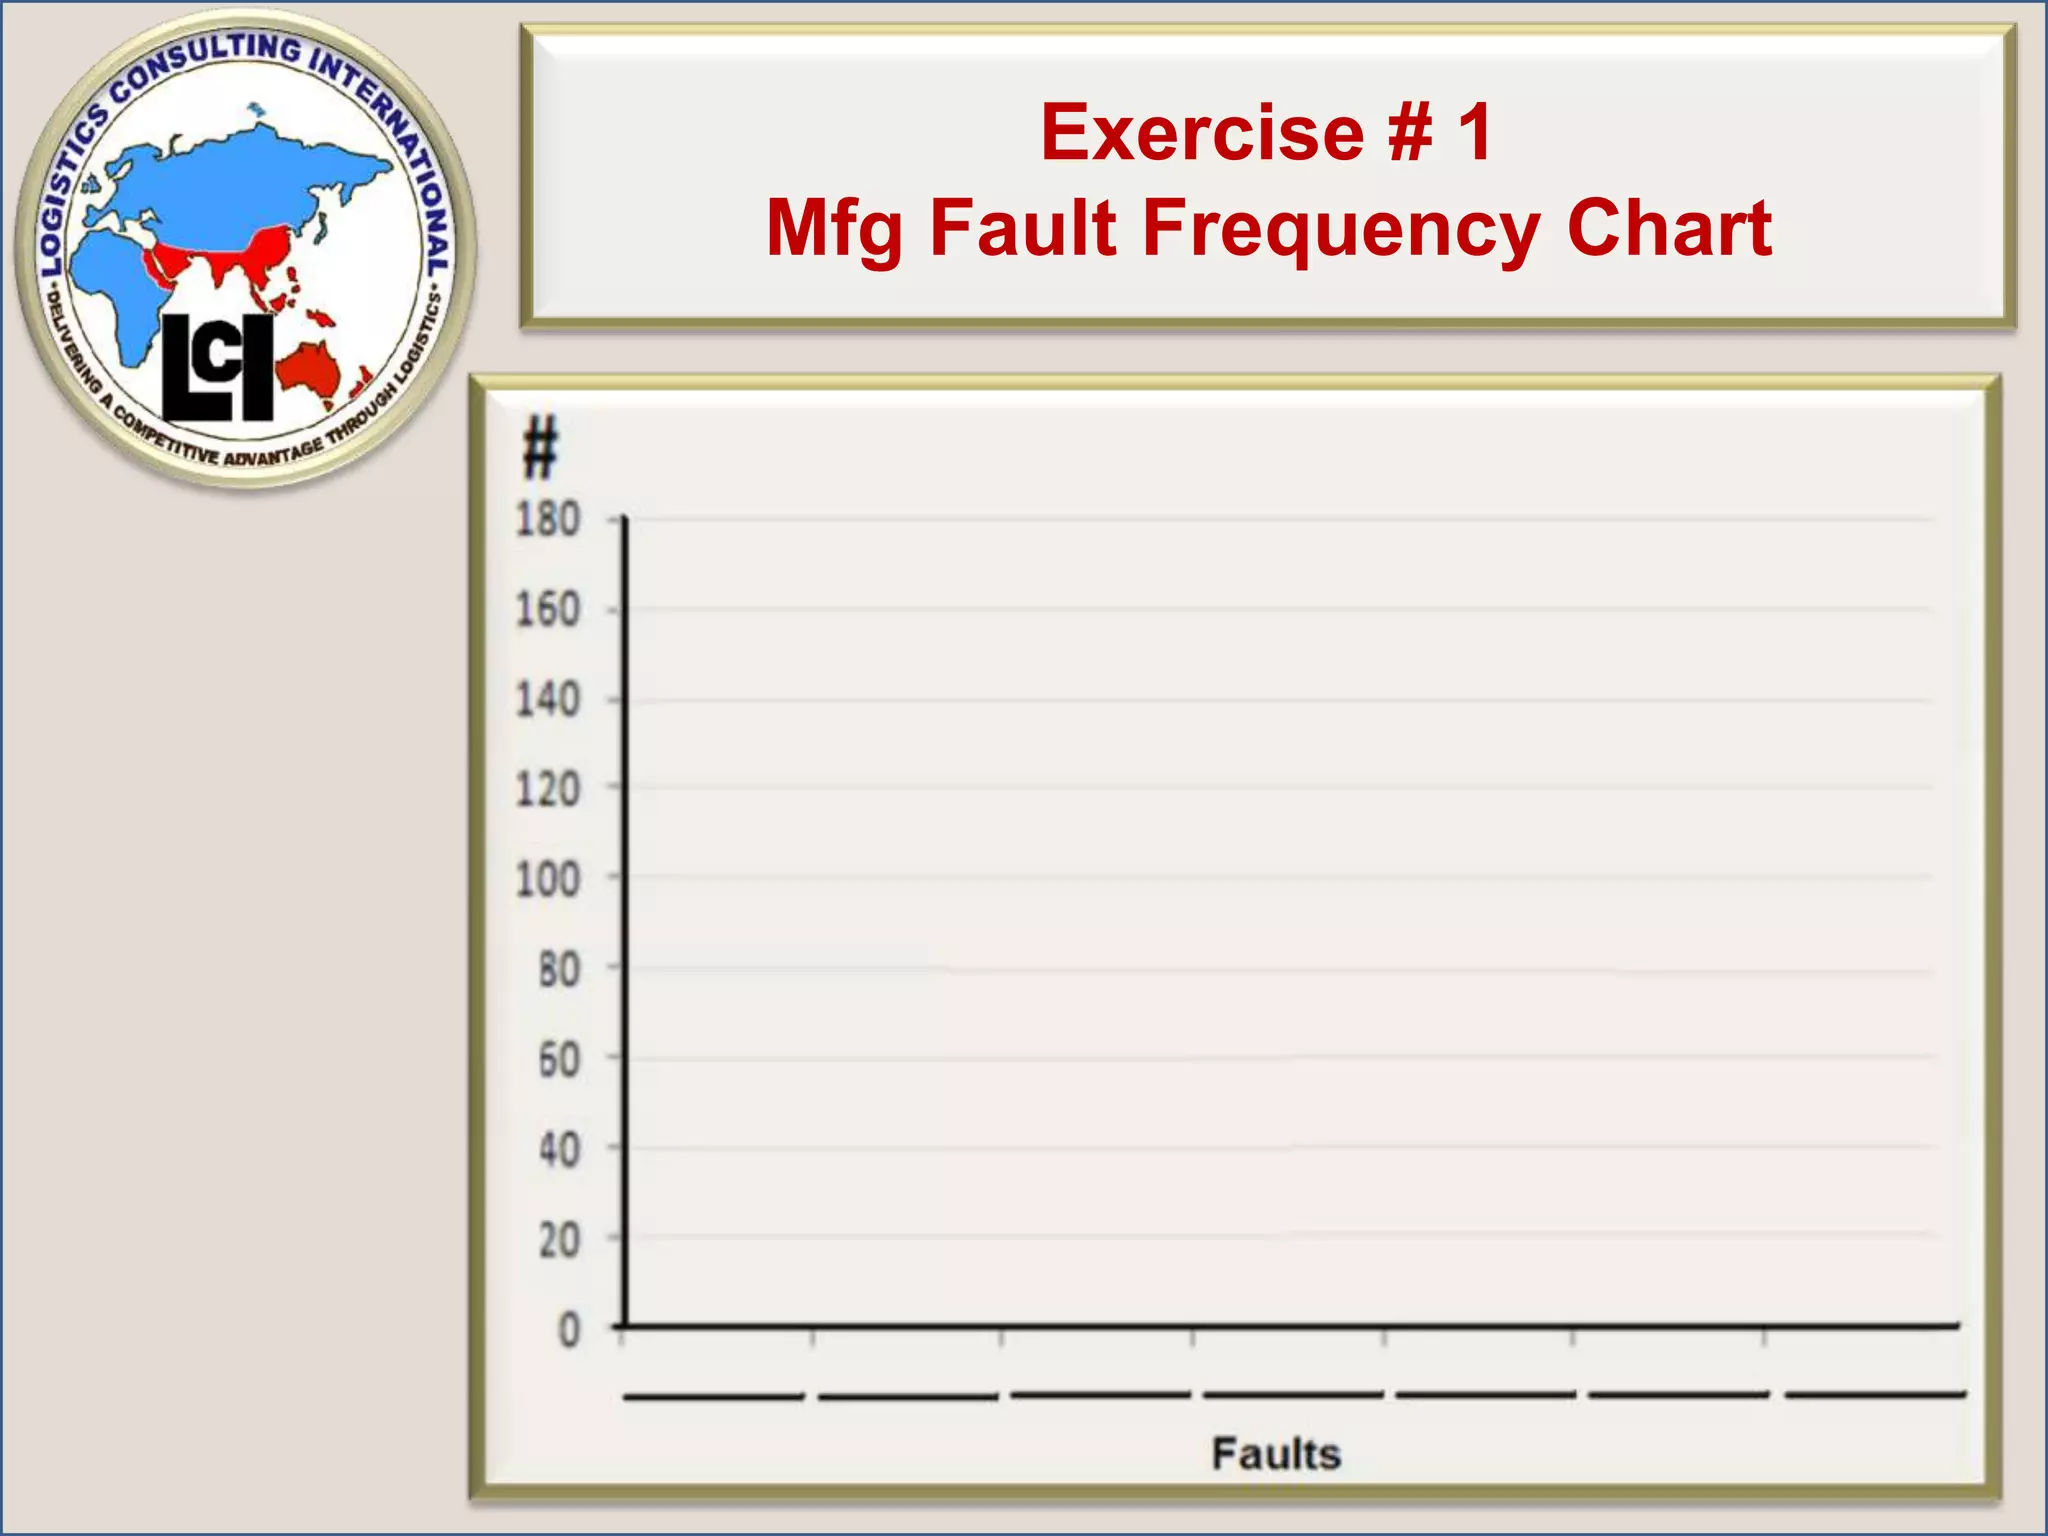
Exercise # 1MfgFault Frequency Chart Use this BLANK Chart in Your Notes To Produce Your Chart
25.
Review of Your Exercise # 1 “Pareto Frequency Chart” for Manufacturing DefectsNOW .. What is the most Frequent Problem?Your Chart Should Look Like This
26.
Exercise 1 -Solution “Frequency of Defects”Data in Original Sequence
27.
Exercise 1 -Solution “Frequency of Defects”Data Sorted to Frequency Sequence
28.
Exercise 1 -Solution “Frequency Bar Chart”# Data Converted to Bar Chart
29.
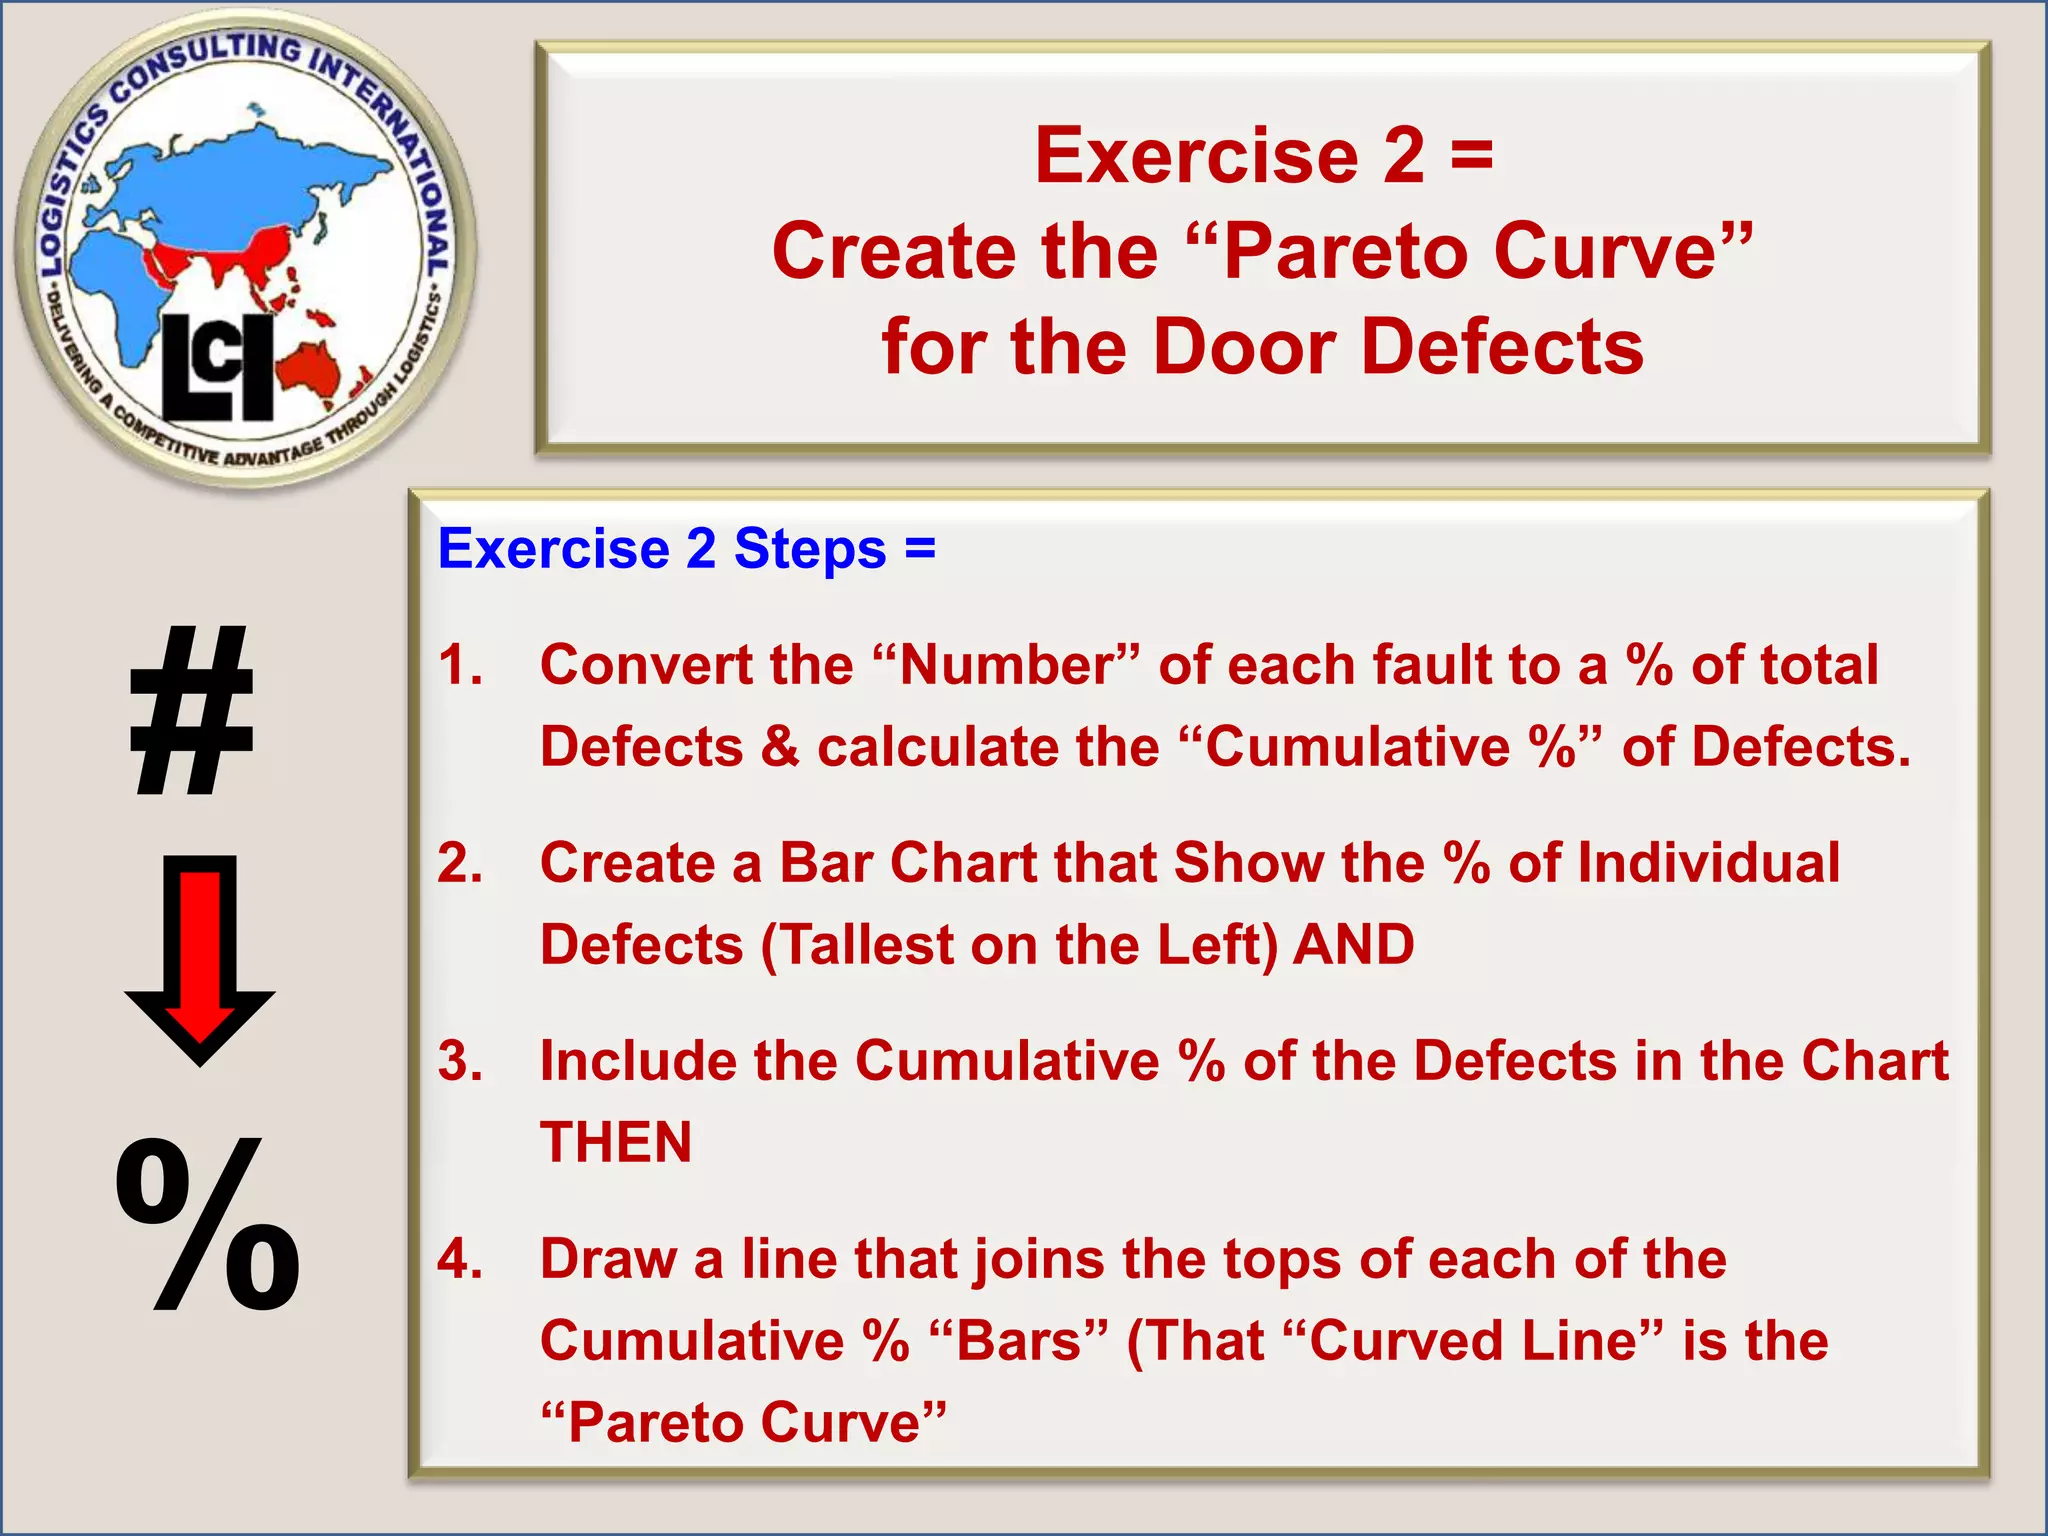
Exercise 2 =Createthe “Pareto Curve” for the Door Defects Exercise 2 Steps =Convert the “Number” of each fault to a % of total Defects & calculate the “Cumulative %” of Defects.Create a Bar Chart that Show the % of Individual Defects (Tallest on the Left) AND Include the Cumulative % of the Defects in the Chart THENDraw a line that joins the tops of each of the Cumulative % “Bars” (That “Curved Line” is the “Pareto Curve”#%
30.
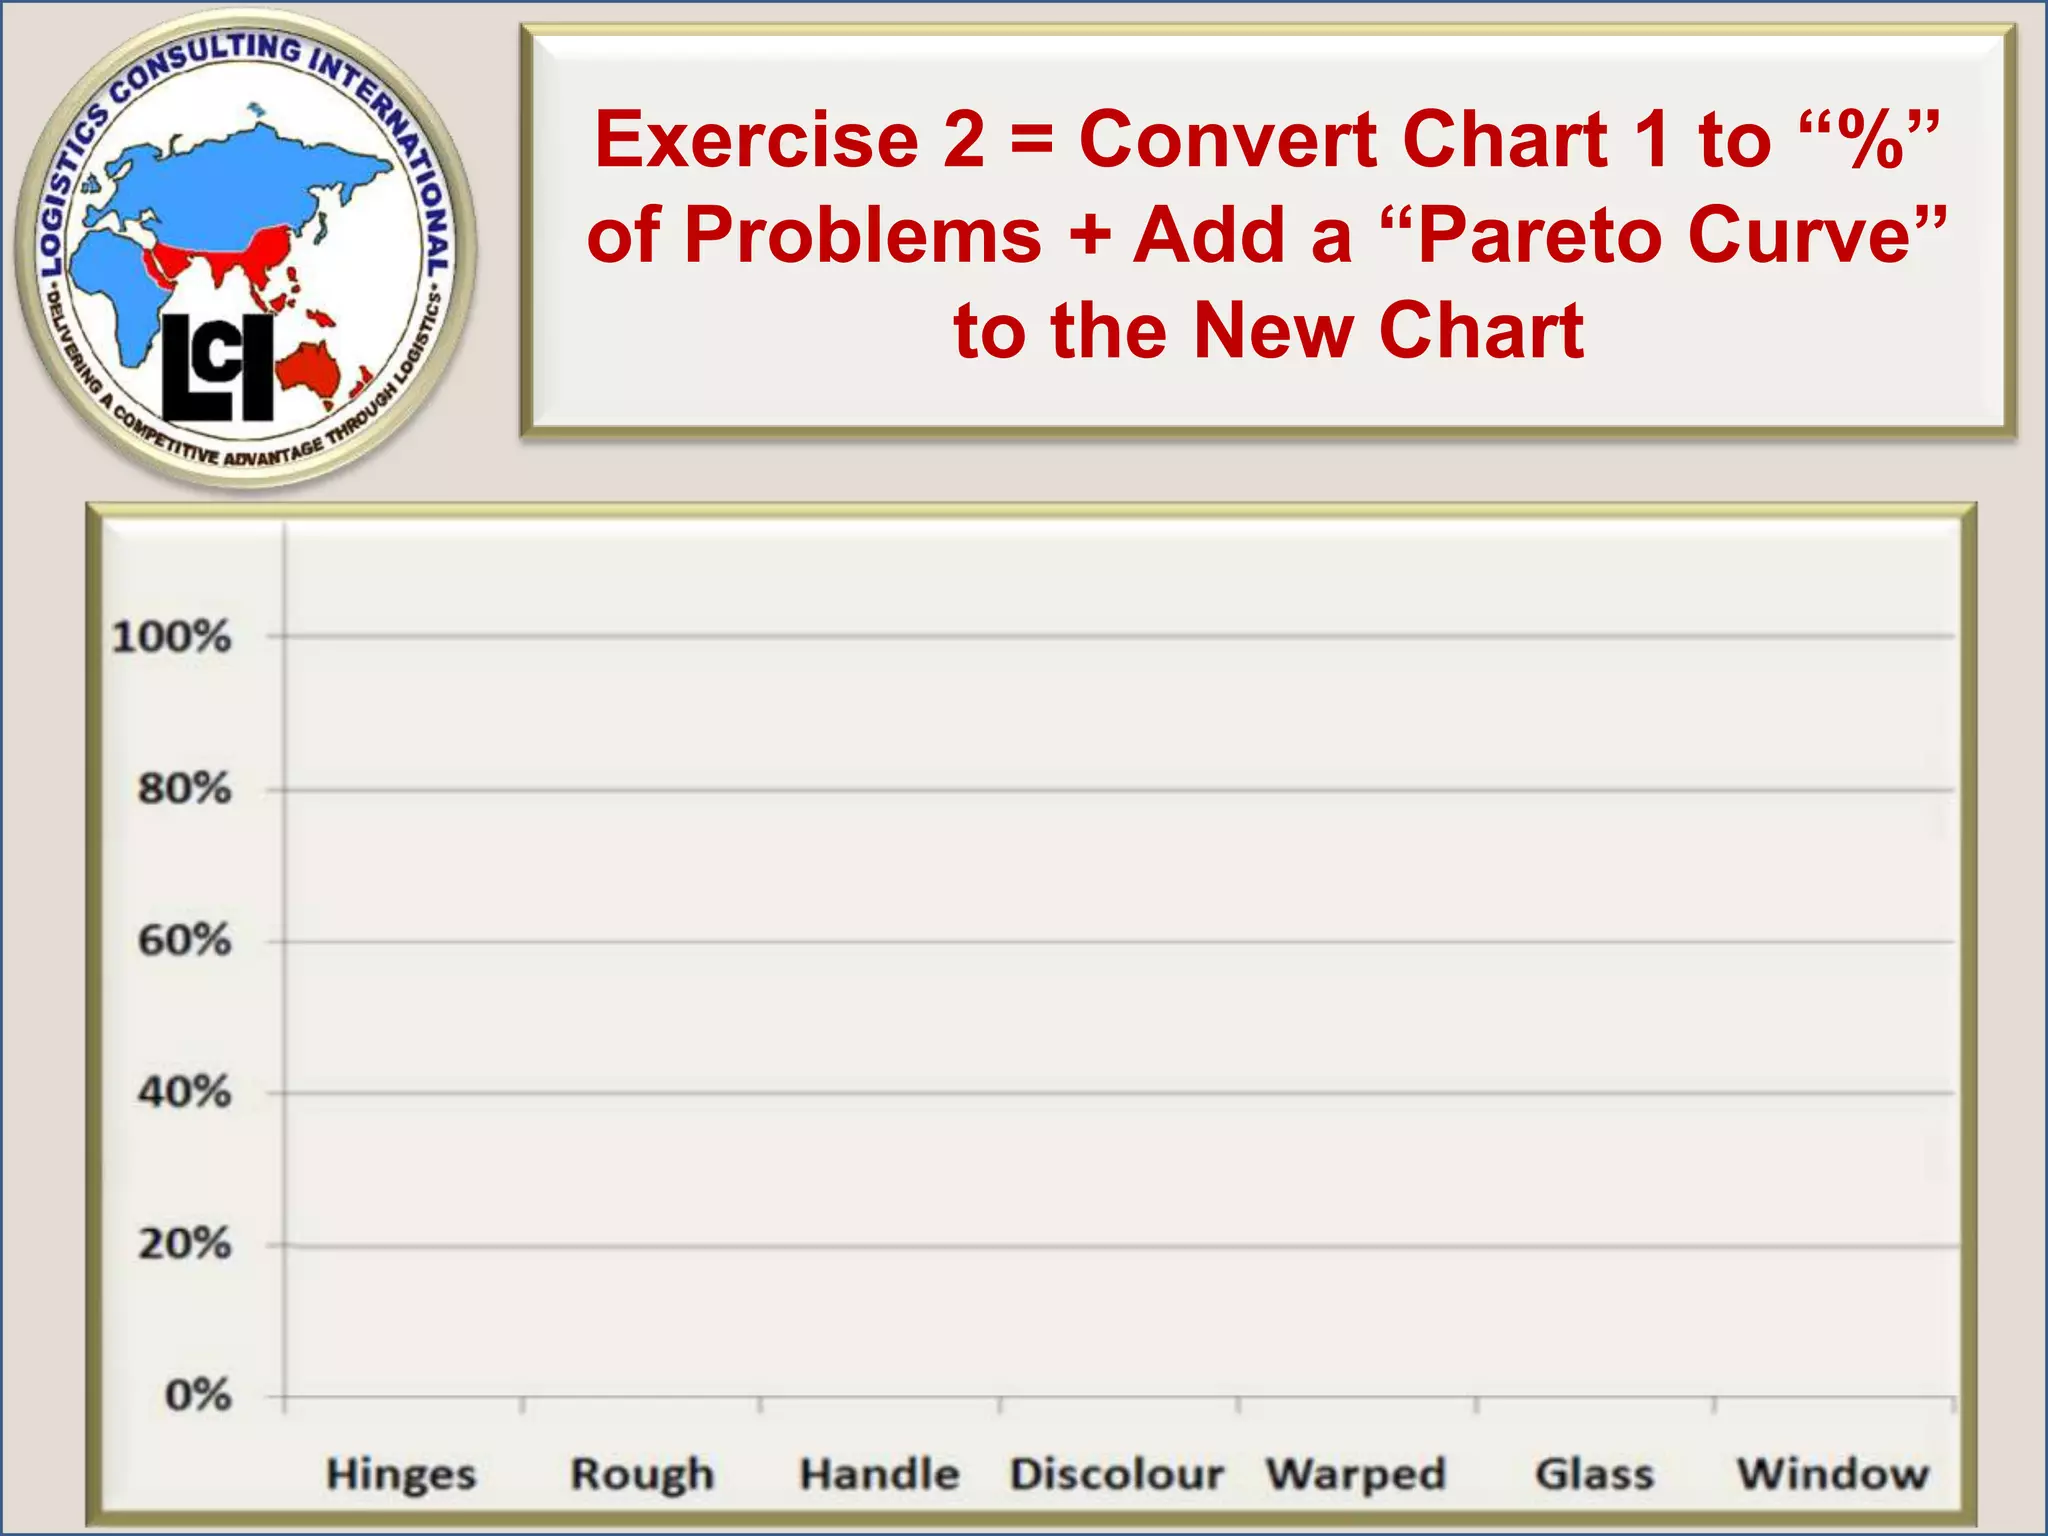
Exercise 2 =Convert Chart 1 to “%” of Problems + Add a “Pareto Curve” to the New ChartUse this BLANK Chart in Your Notes To Produce Your Chart
31.
Exercise 2 =Convert Chart 1 to “%” of Problems + Add a “Pareto Curve” to the New Chart
32.
Complete Exercise #2 “Pareto Frequency Chart” with Pareto Curve for Manufacturing DefectsYour Chart Should Look Like This
33.
Exercise 2 =Convert Chart 1 to “%” of Problems + Add a “Pareto Curve” to the New ChartLink to Excel Worksheet – How to find the answer!
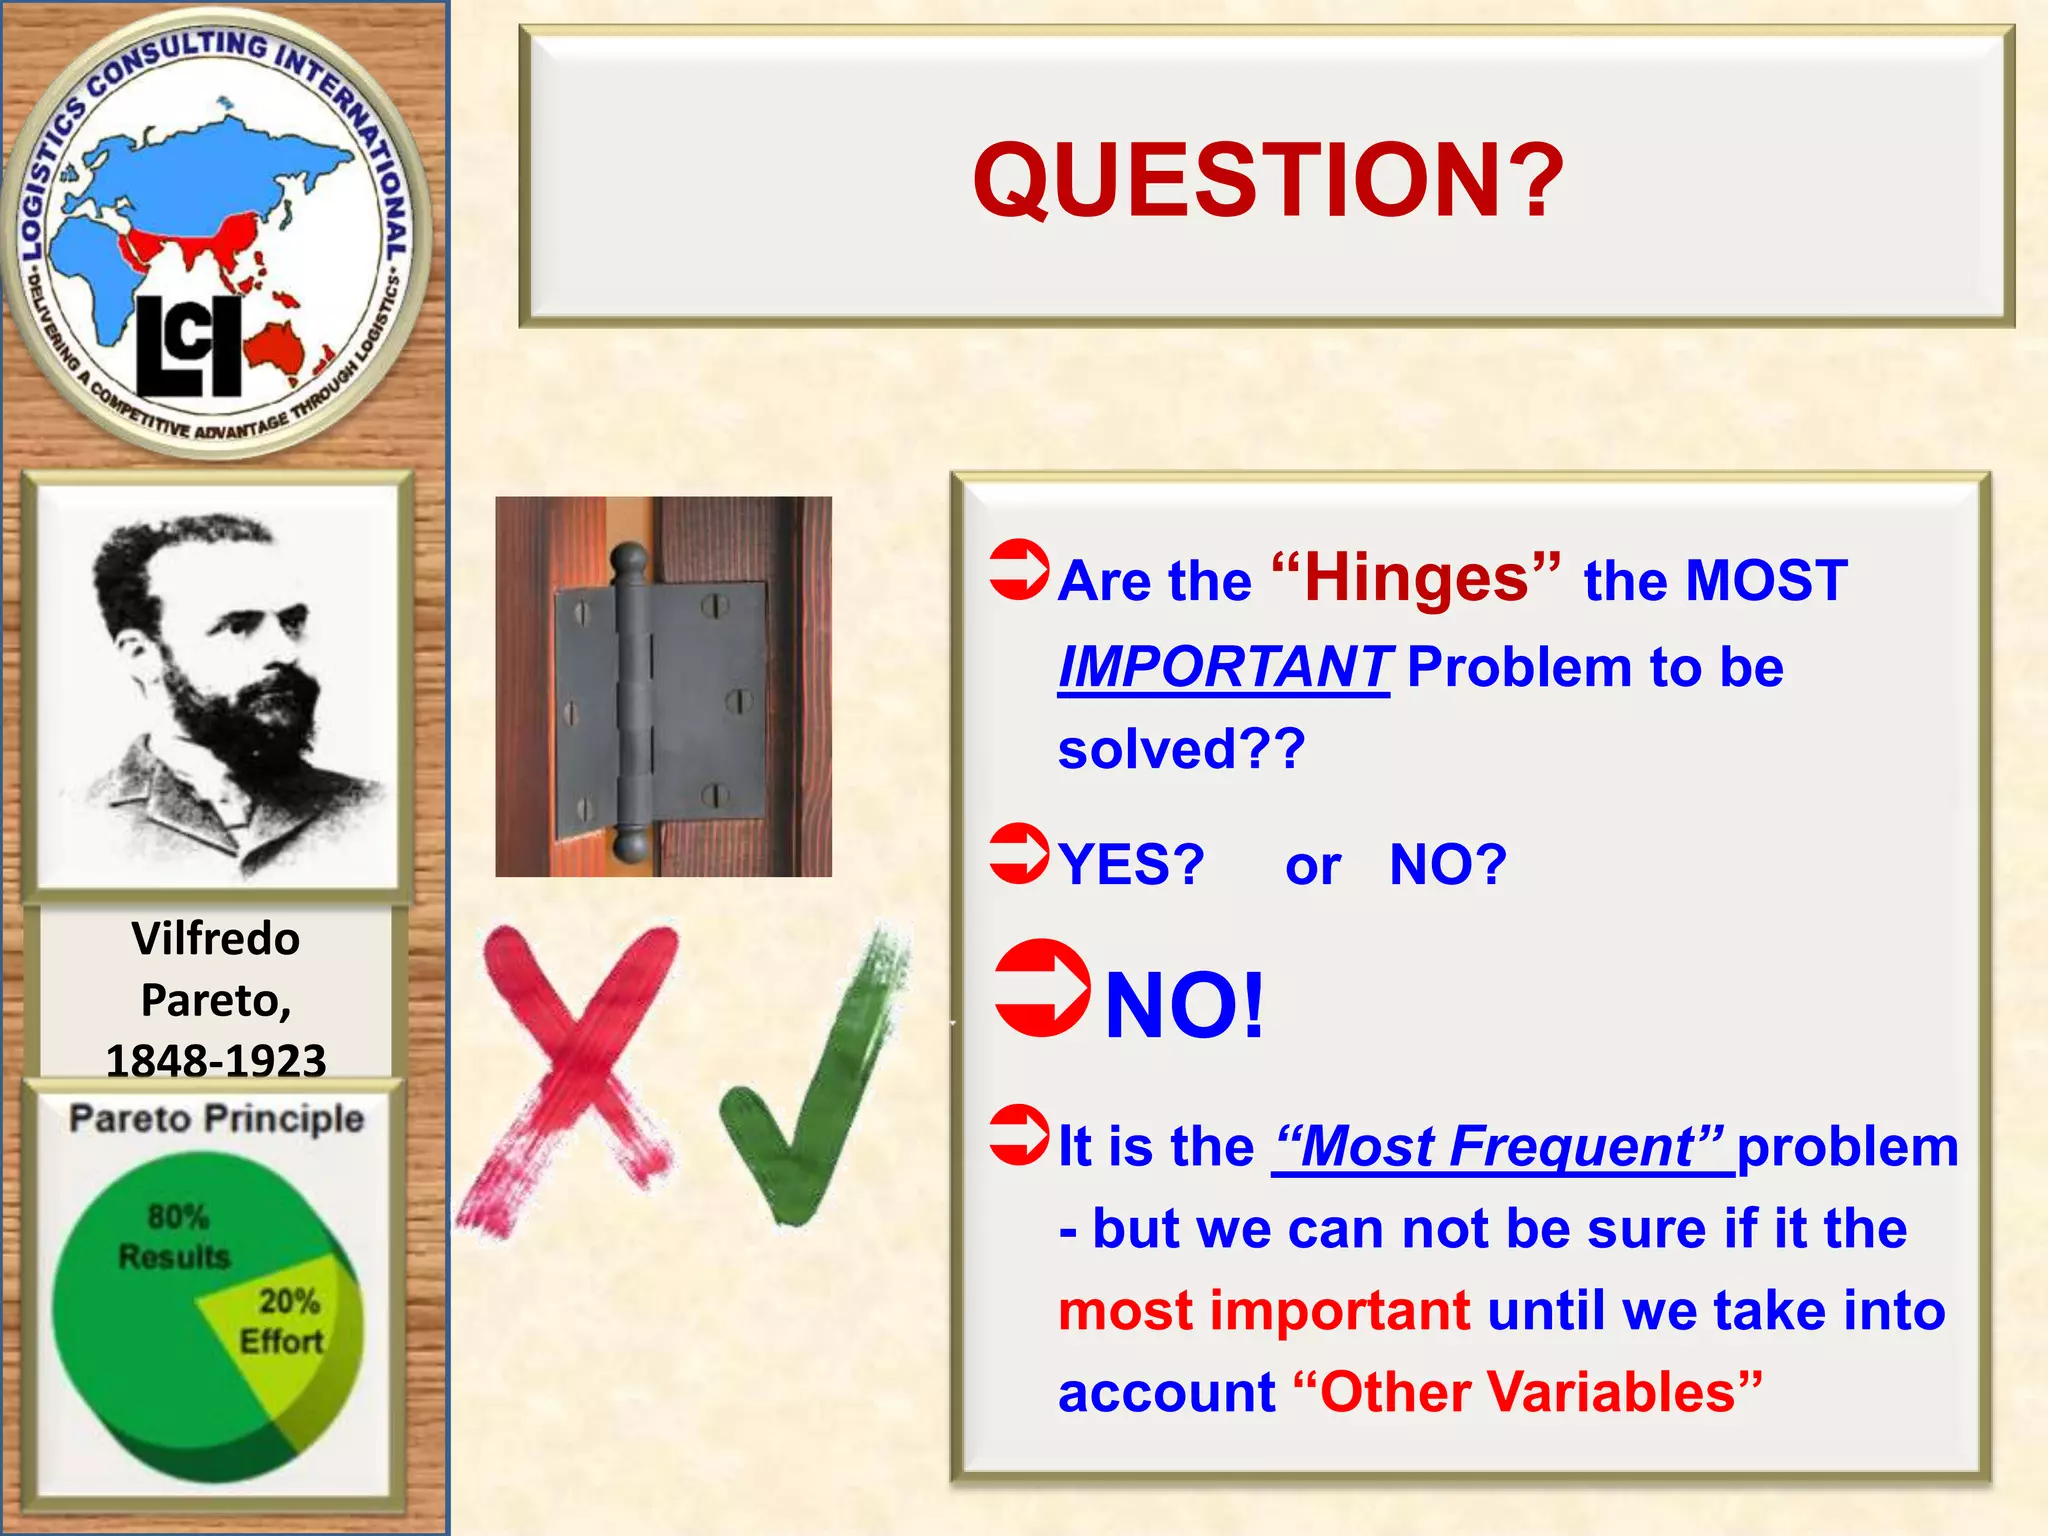
QUESTION?Are the “Hinges”the MOST IMPORTANT Problem to be solved??YES? or NO?NO! It is the “Most Frequent” problem - but we can not be sure if it the most important until we take into account “Other Variables”
39.
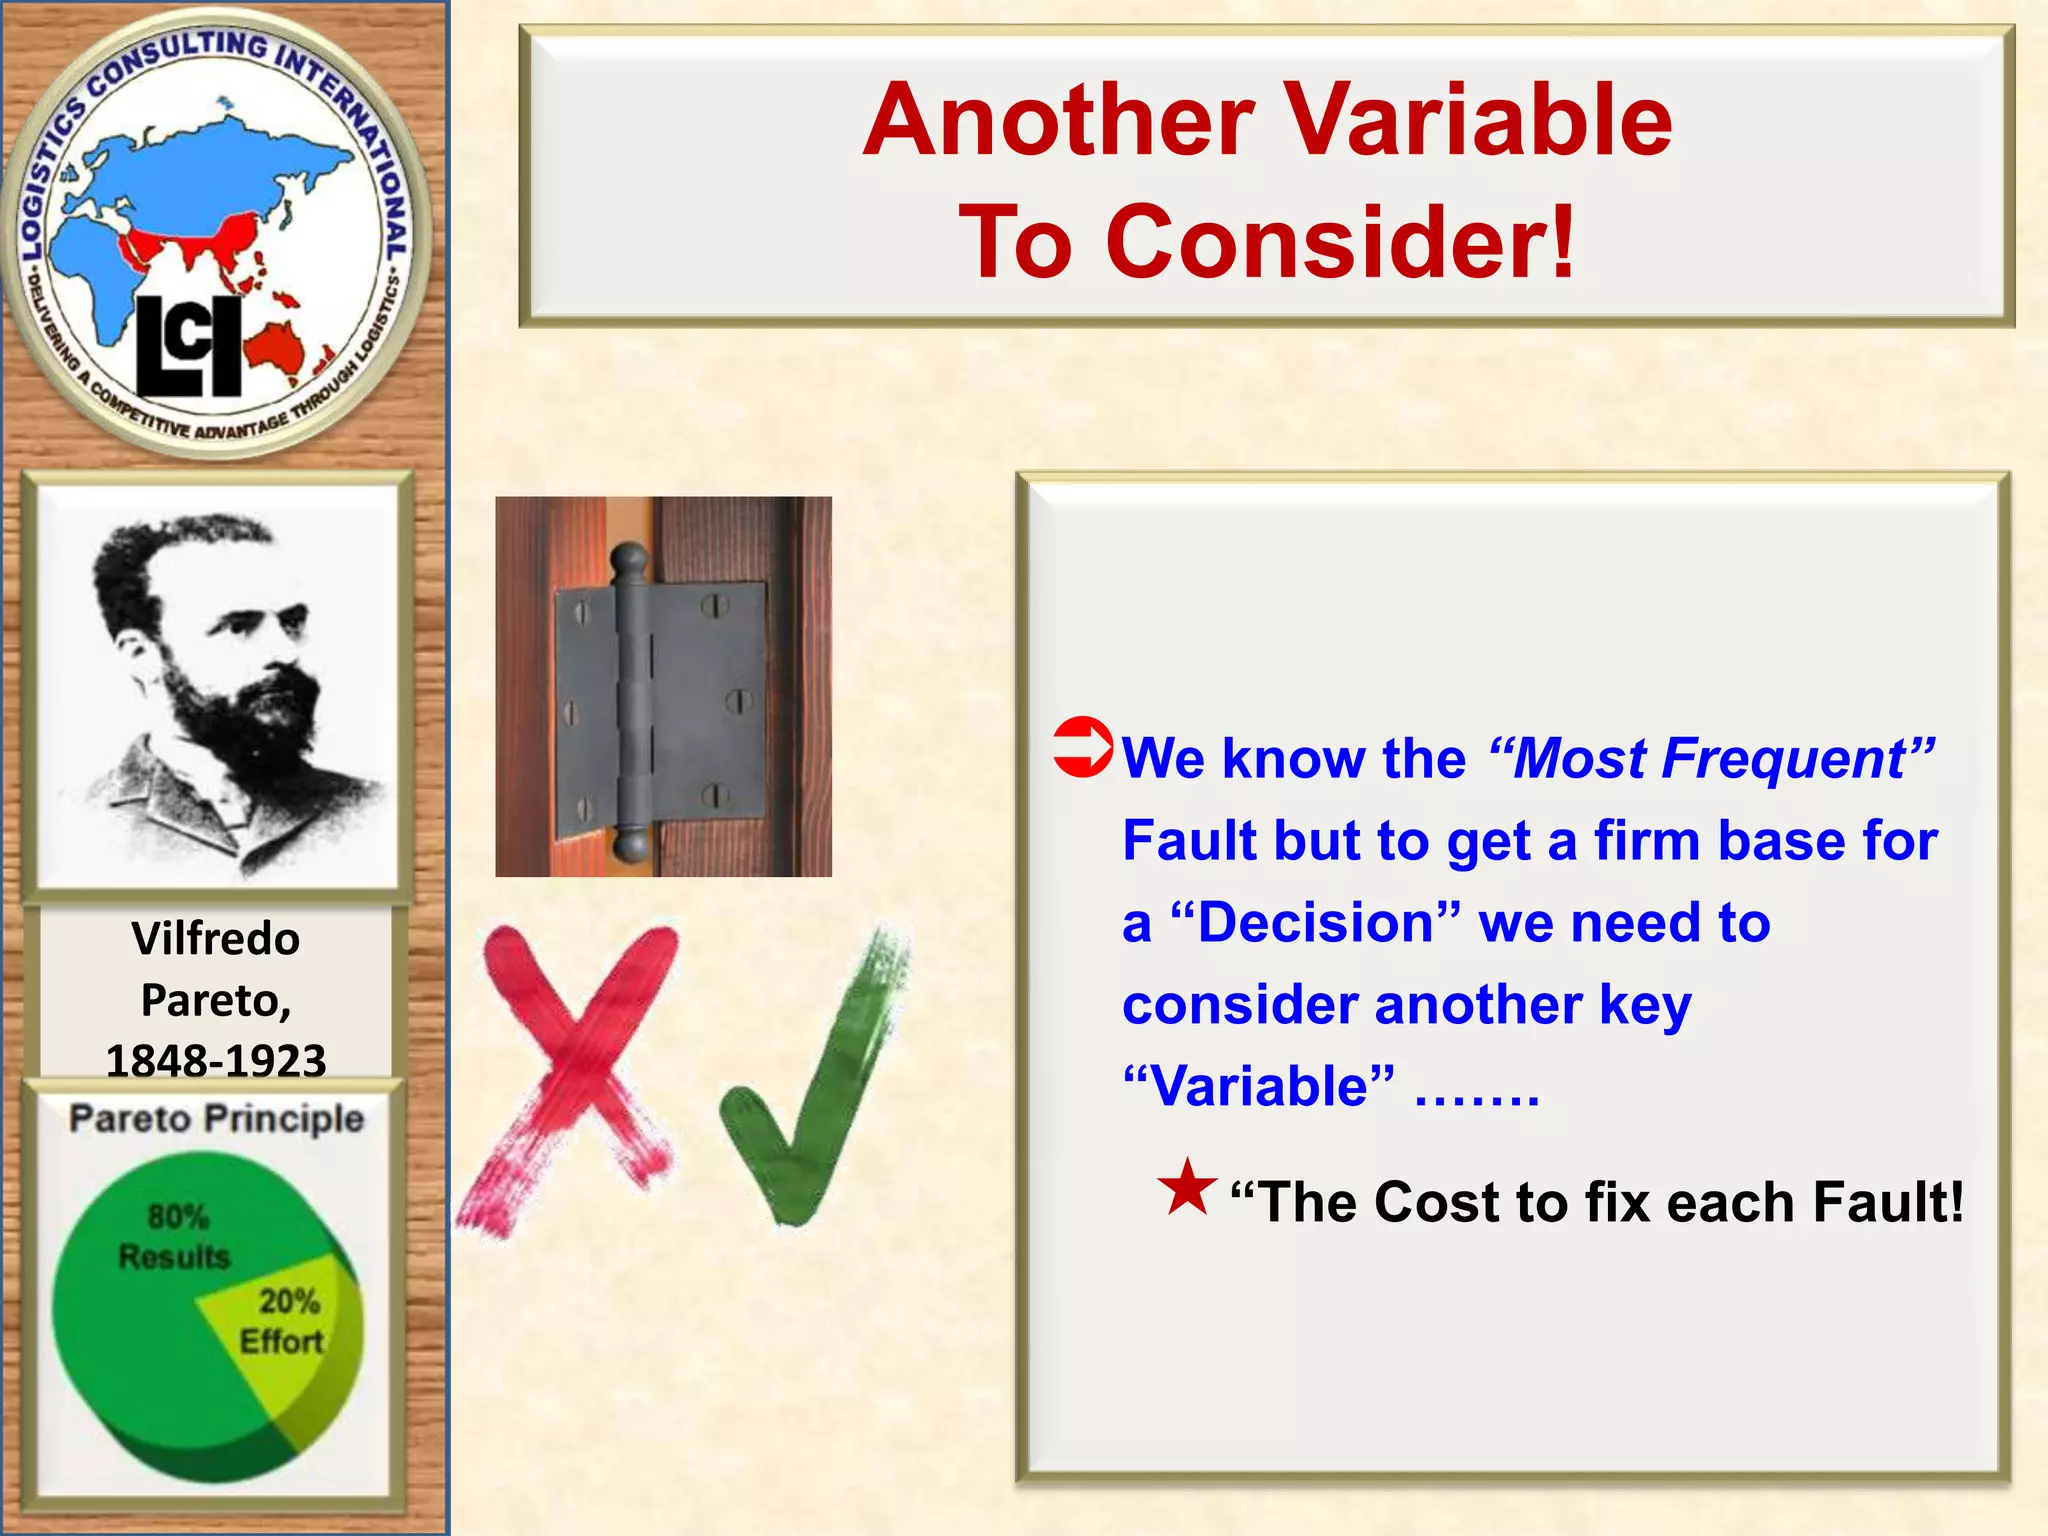
Another Variable ToConsider!We know the “Most Frequent” Fault but to get a firm base for a “Decision” we need to consider another key “Variable” ……. “The Cost to fix each Fault!
40.
EXERCISE # 3Pareto “Fault Costs” ChartWe will now use the same technique with the “Cost “ Data from the Next Slide to create a Pareto Fault “Cost” Chart.Then we will know the relative “Cost” of each Fault! = 1 step closer to a “Decision Chart”
41.
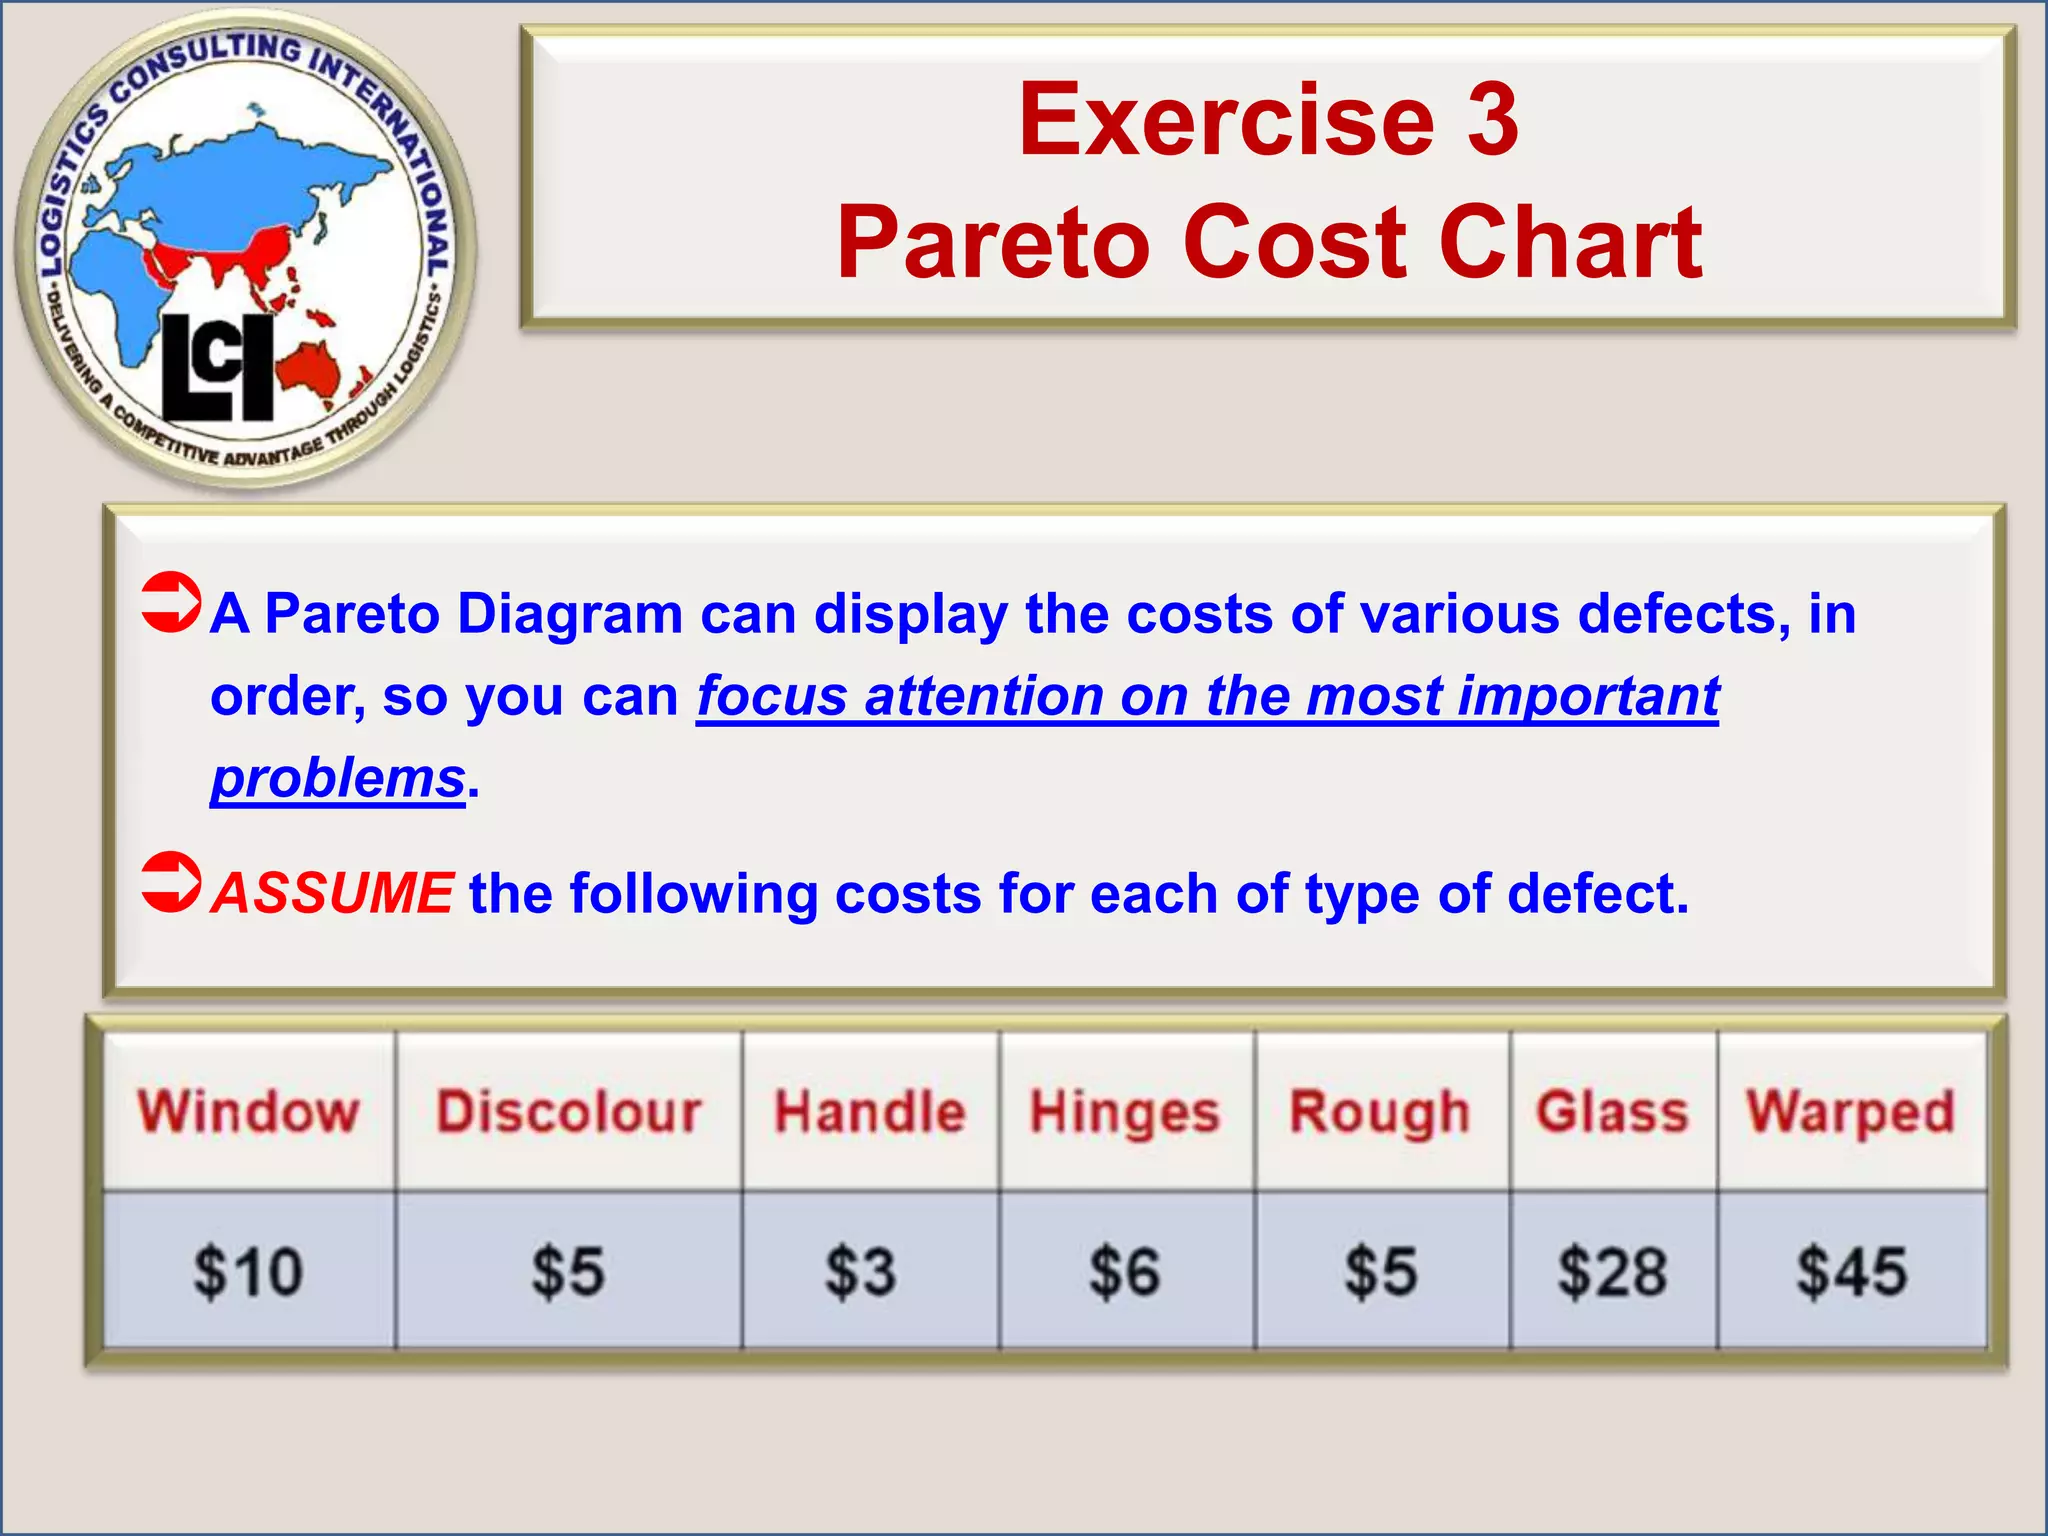
Exercise 3Pareto CostChartA Pareto Diagram can display the costs of various defects, in order, so you can focus attention on the most important problems. ASSUME the following costs for each of type of defect.
42.
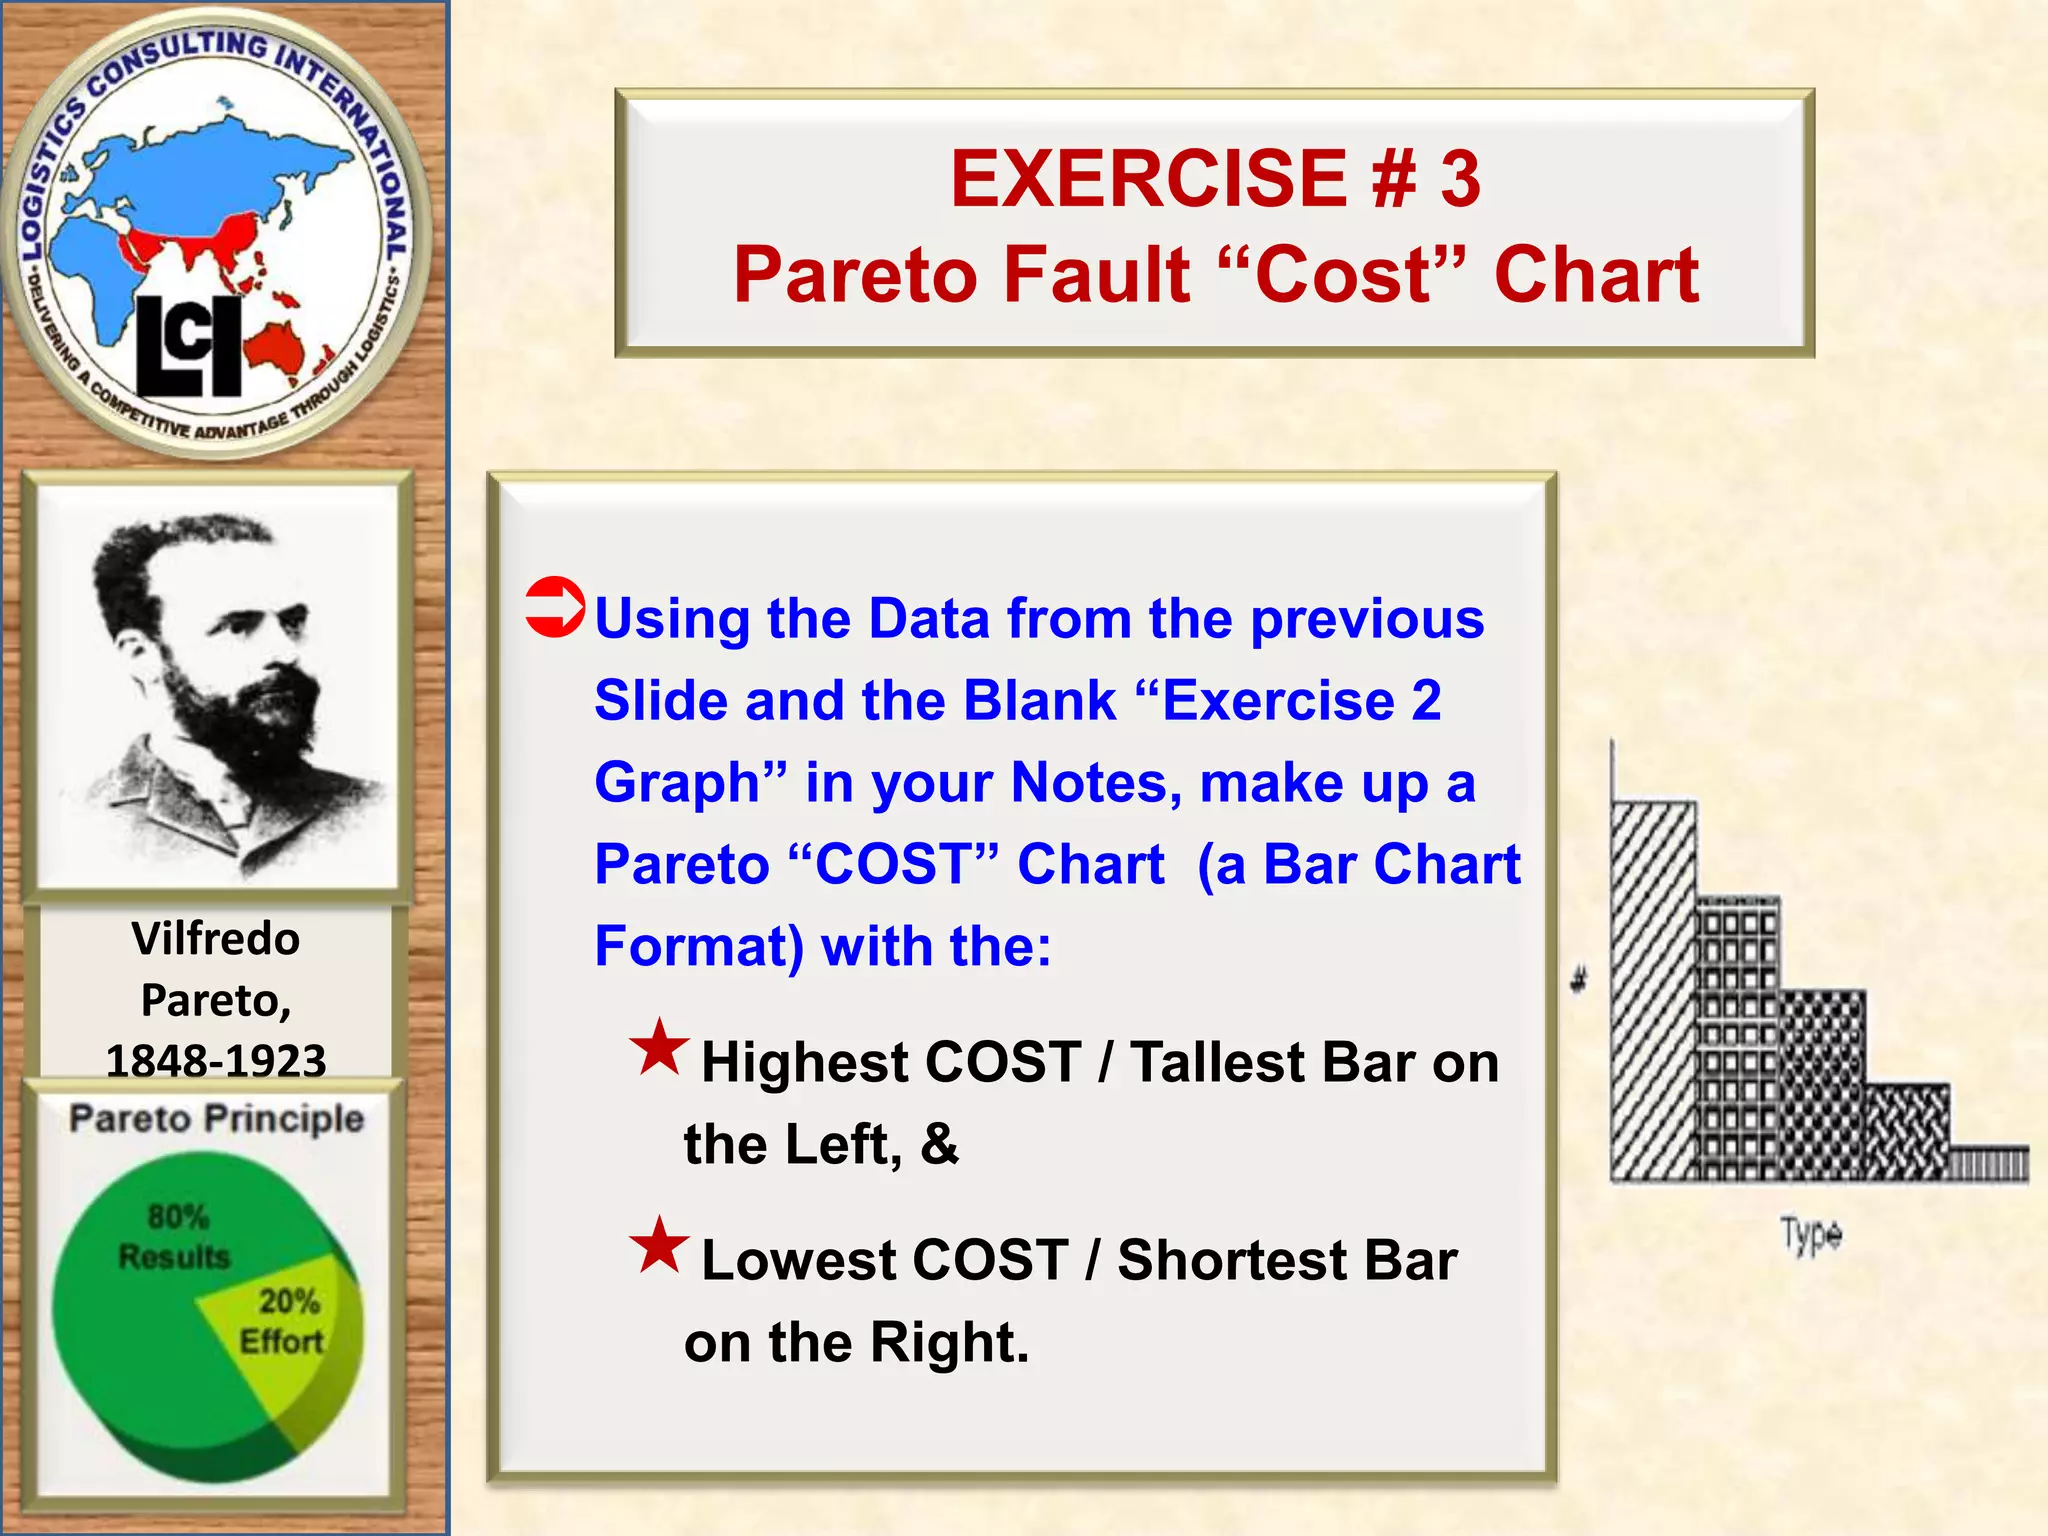
EXERCISE # 3Pareto Fault “Cost” ChartUsing the Data from the previous Slide and the Blank “Exercise 2 Graph” in your Notes, make up a Pareto “COST” Chart (a Bar Chart Format) with the:Highest COST / Tallest Bar on the Left, &Lowest COST / Shortest Bar on the Right.
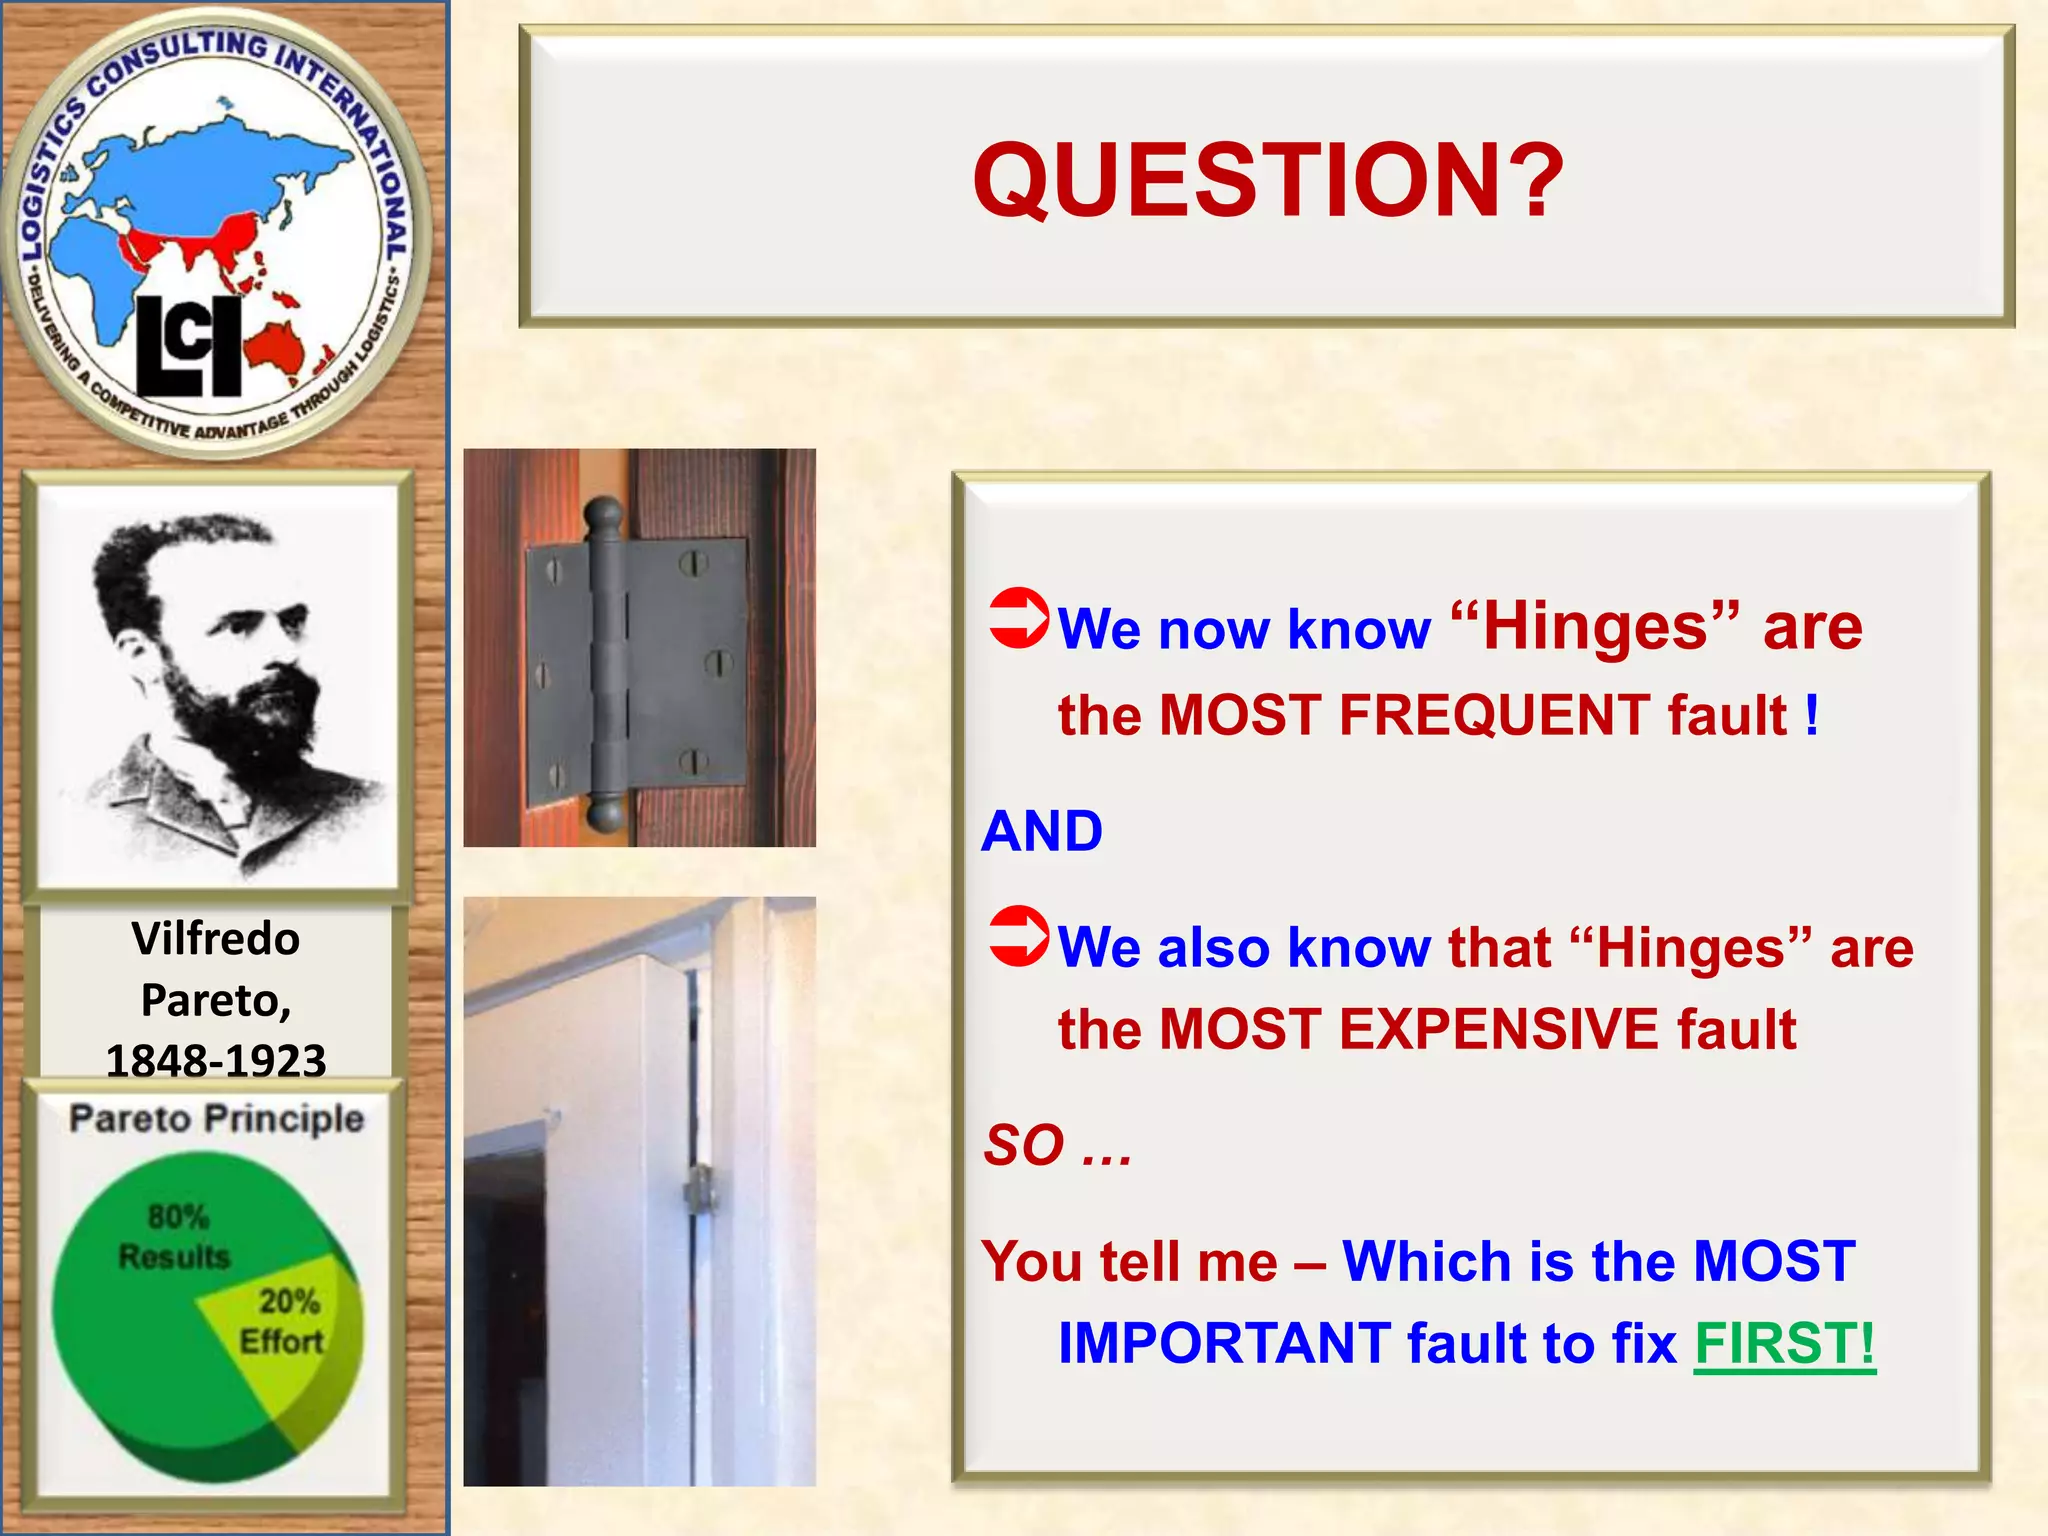
QUESTION?We now know“Hinges” are the MOST FREQUENT fault !ANDWe also know that “Hinges” are the MOST EXPENSIVE fault SO …You tell me – Which is the MOST IMPORTANT fault to fix FIRST!
What Else DoWe Need To Do To Make a Valid Decision?
47.
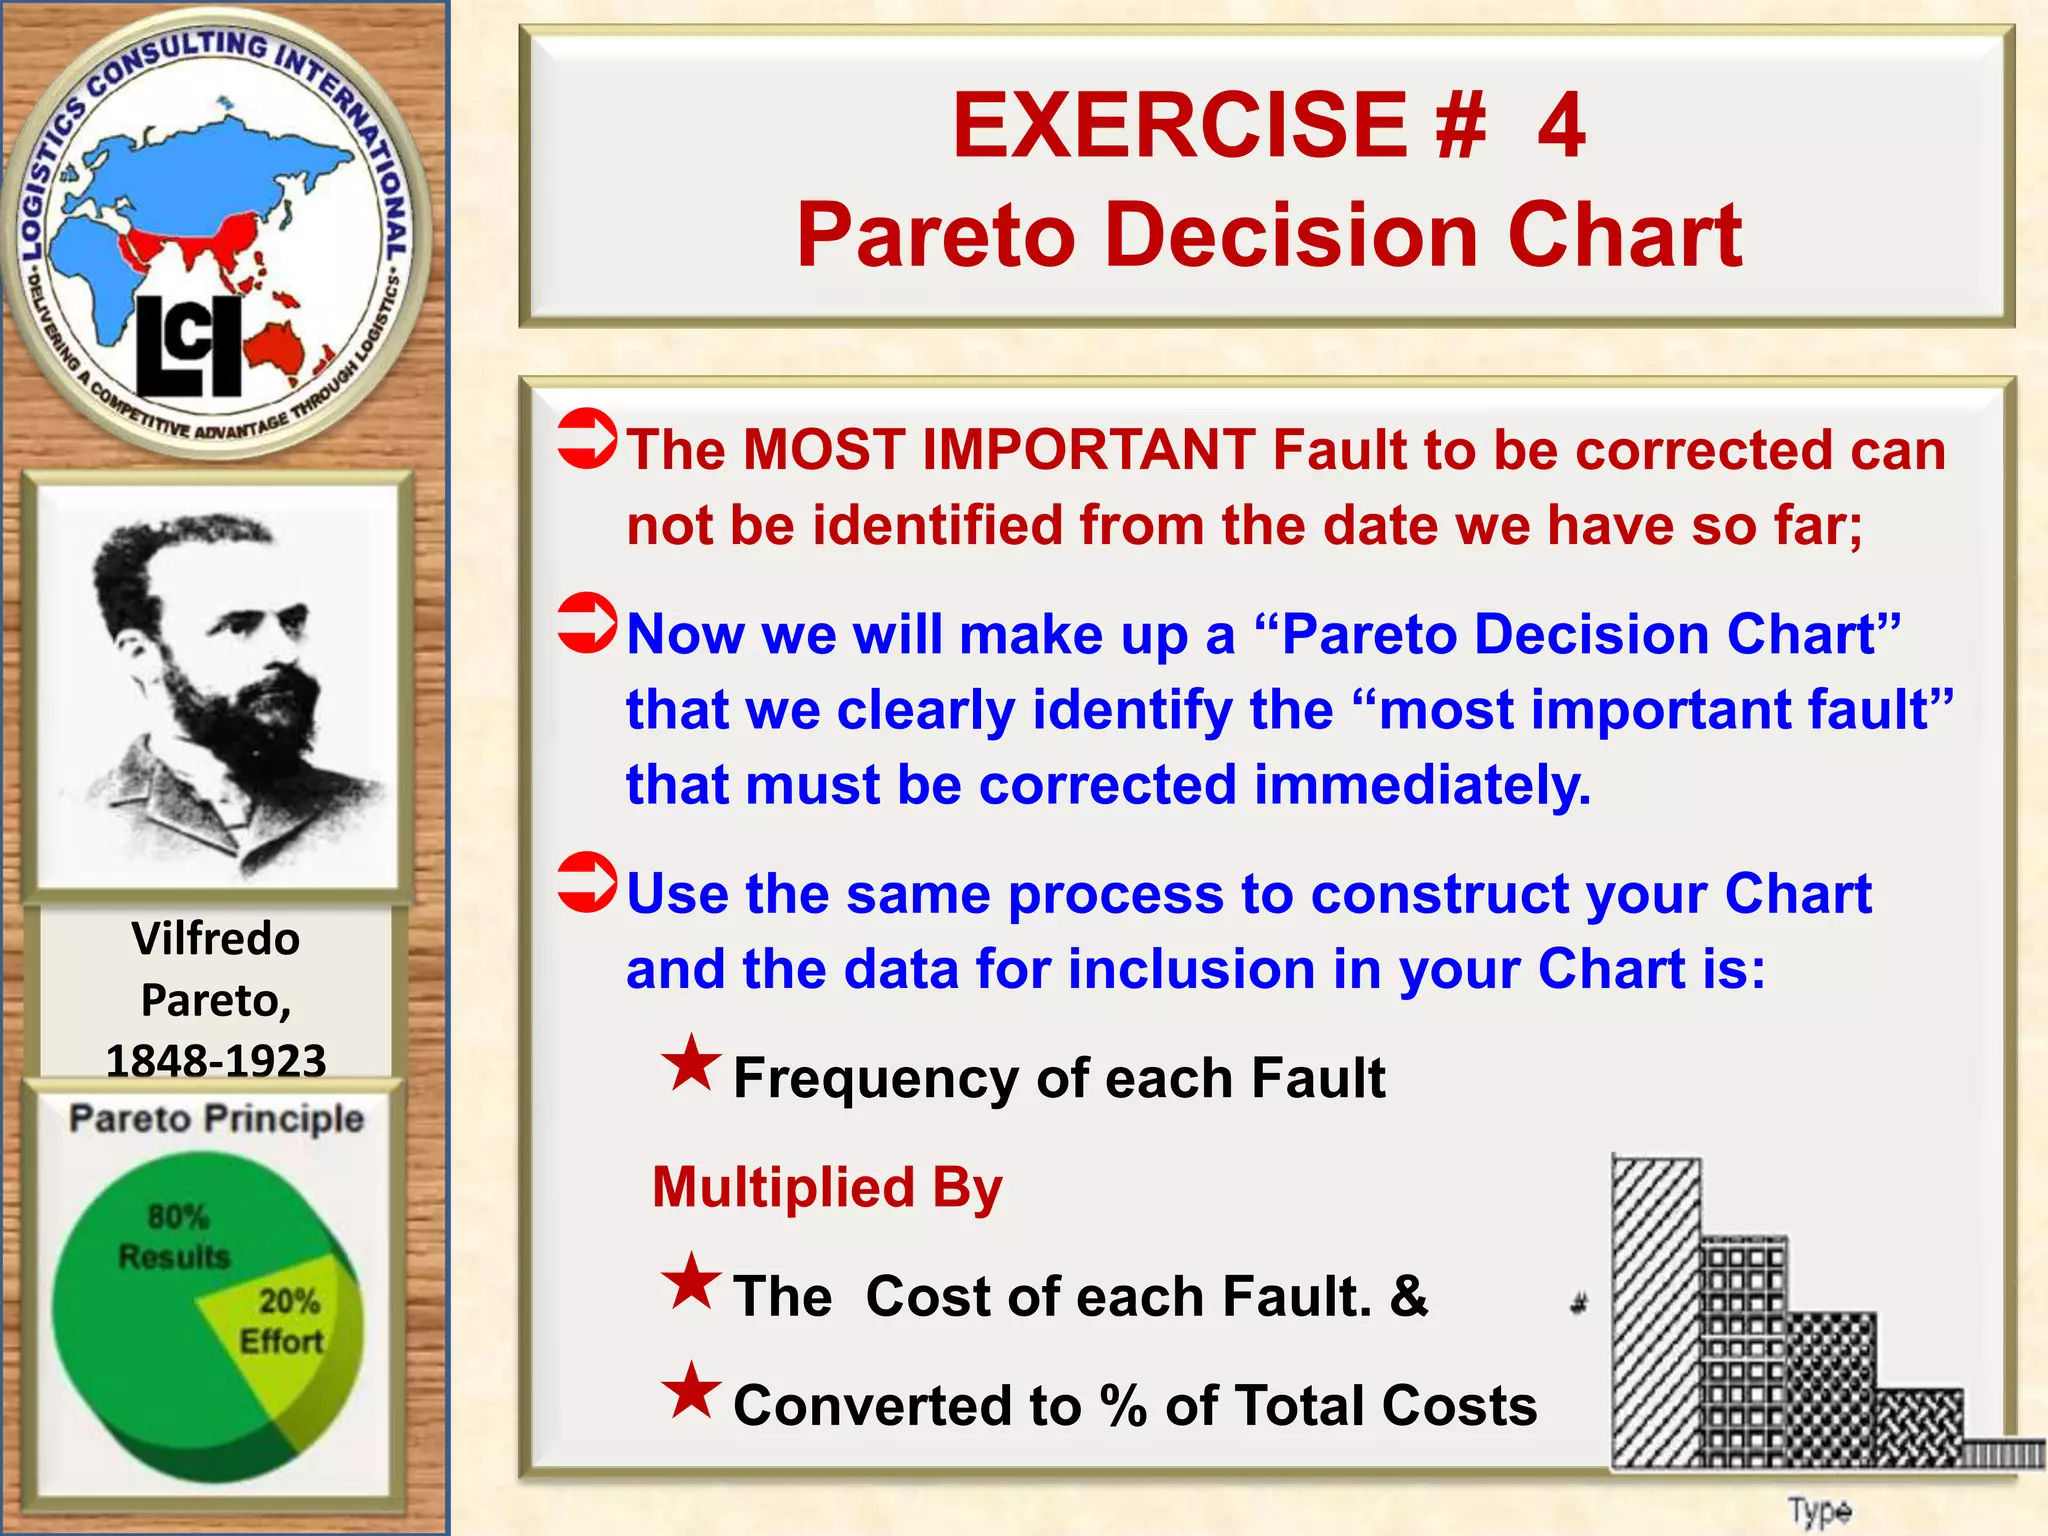
EXERCISE # 4Pareto Decision ChartThe MOST IMPORTANT Fault to be corrected can not be identified from the date we have so far;Now we will make up a “Pareto Decision Chart” that we clearly identify the “most important fault” that must be corrected immediately.Use the same process to construct your Chart and the data for inclusion in your Chart is:Frequency of each FaultMultiplied ByThe Cost of each Fault. &Converted to % of Total Costs
48.
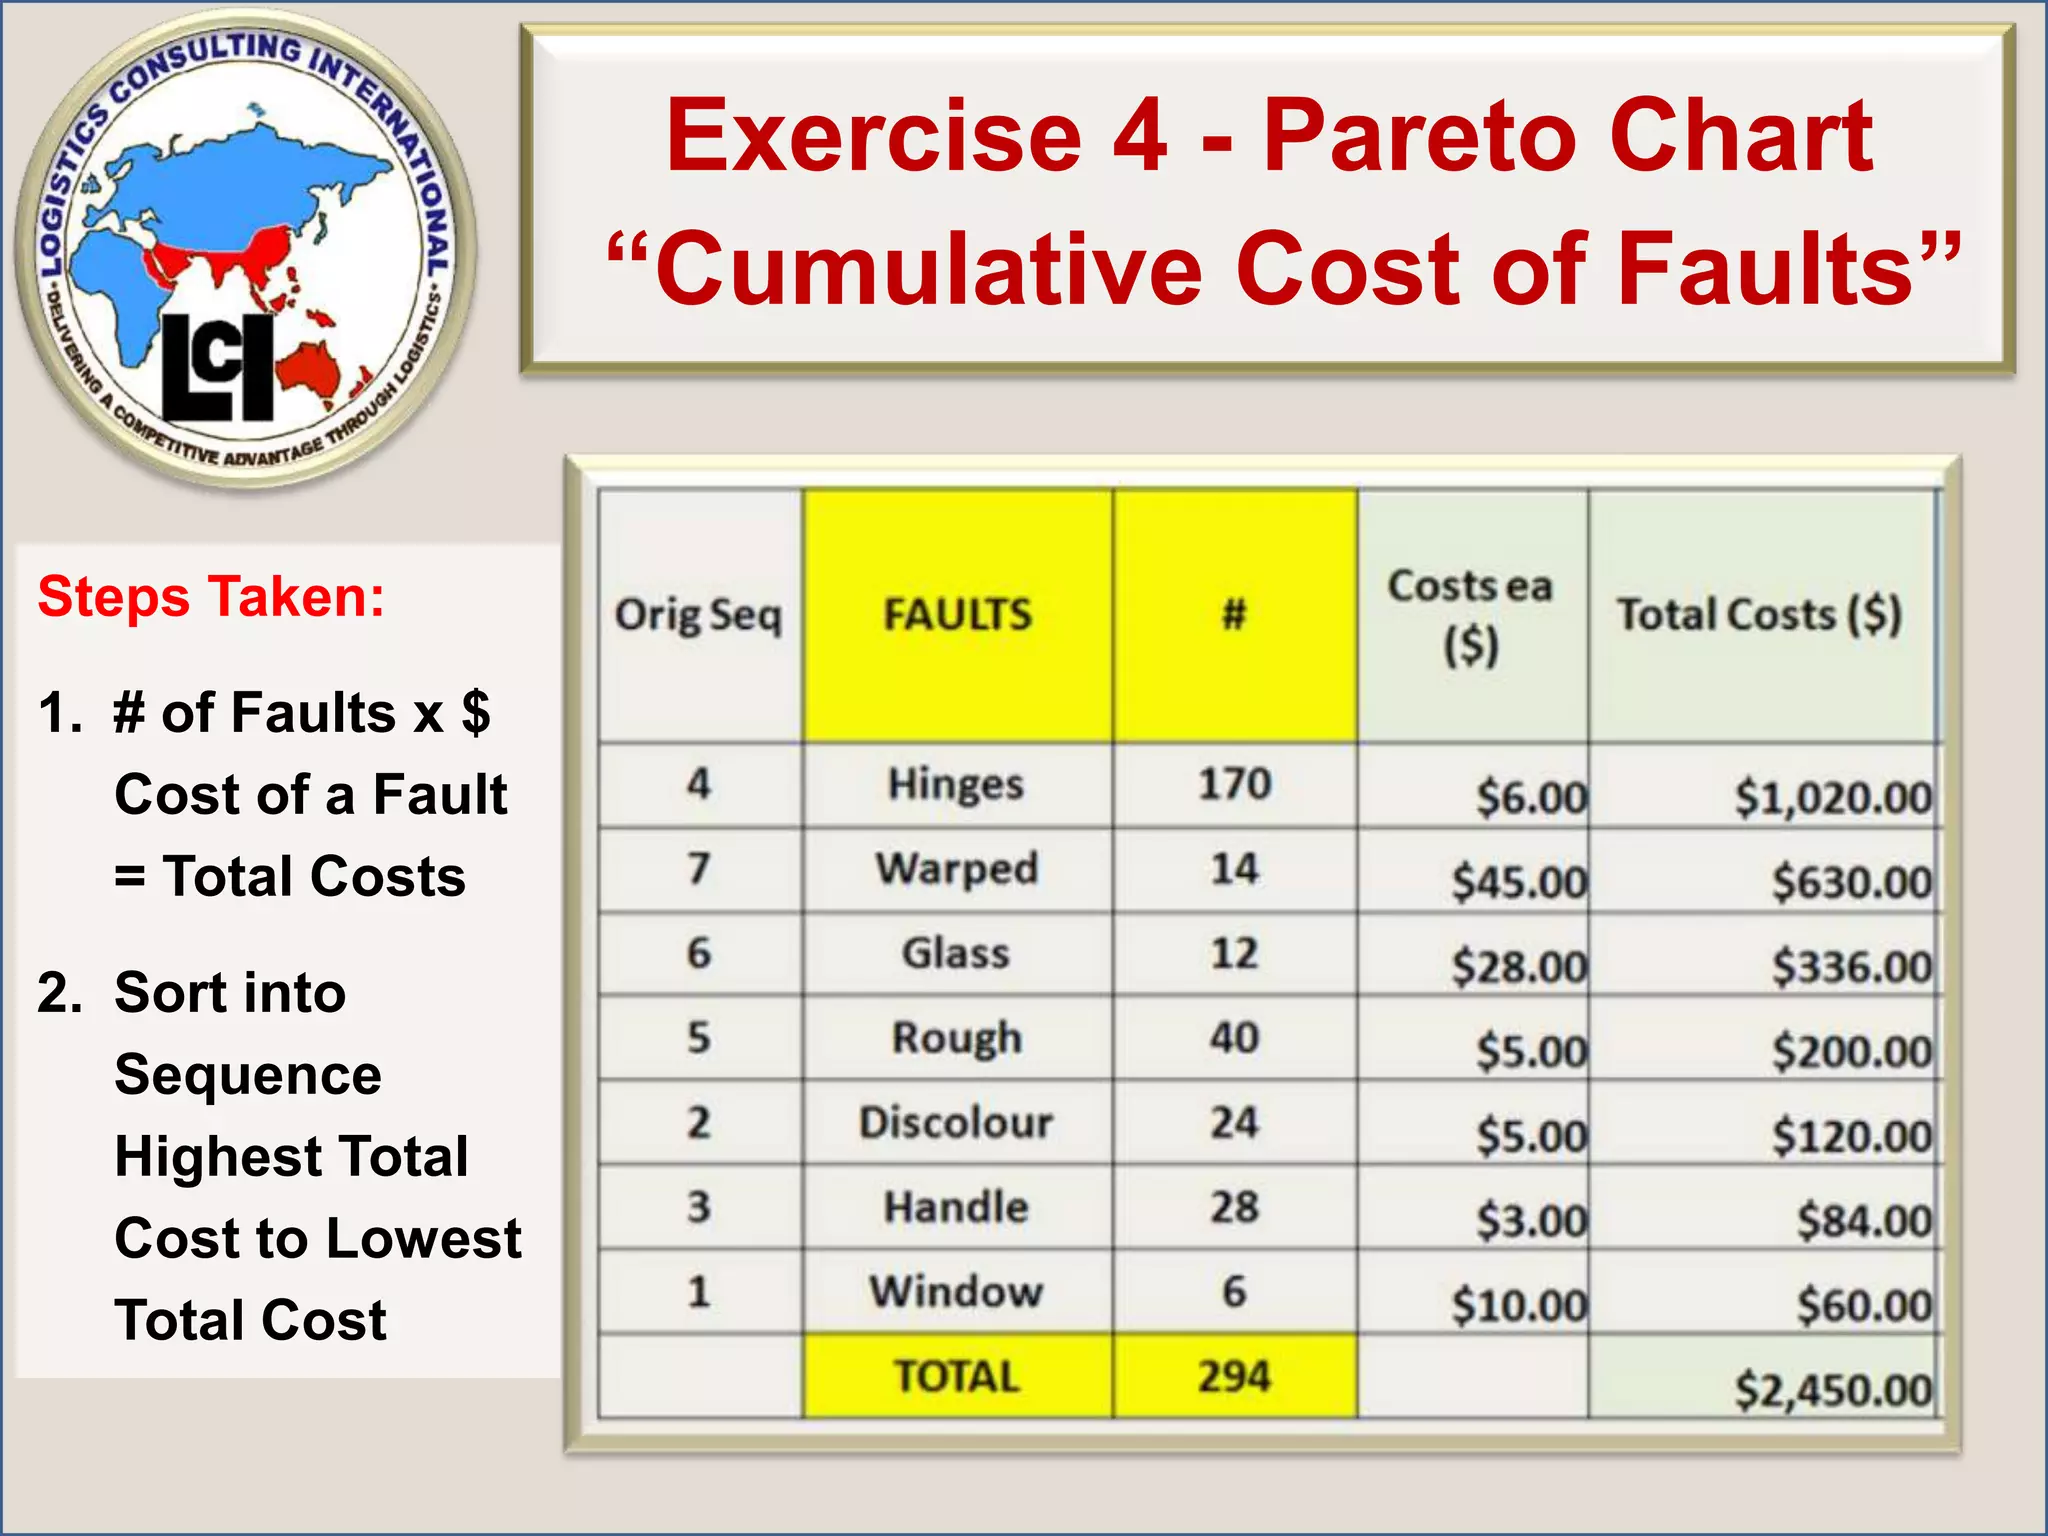
Exercise 4 -Pareto Chart“Cumulative Cost of Faults”Steps Taken:# of Faults x $ Cost of a Fault = Total CostsSort into Sequence Highest Total Cost to Lowest Total Cost
49.
Exercise # 4 Create a“Pareto Decision Chart” that Shows You To Identify the most Important 80% of the Cost of Defects to be Attacked!Your Chart Should Look Like This
50.
Exercise 4 -Pareto Chart“Cumulative Cost of Faults”
Pareto ChartsPareto ChartsDefinedPareto charts are used to identify and prioritize problems to be solved.They are actually histograms aided by the 80/20 rule adapted by Joseph Juran.Remember the 80/20 rule states that APPROXIMATELY80% of the problems are created by APPROXIMATELY 20% of the causes.
57.
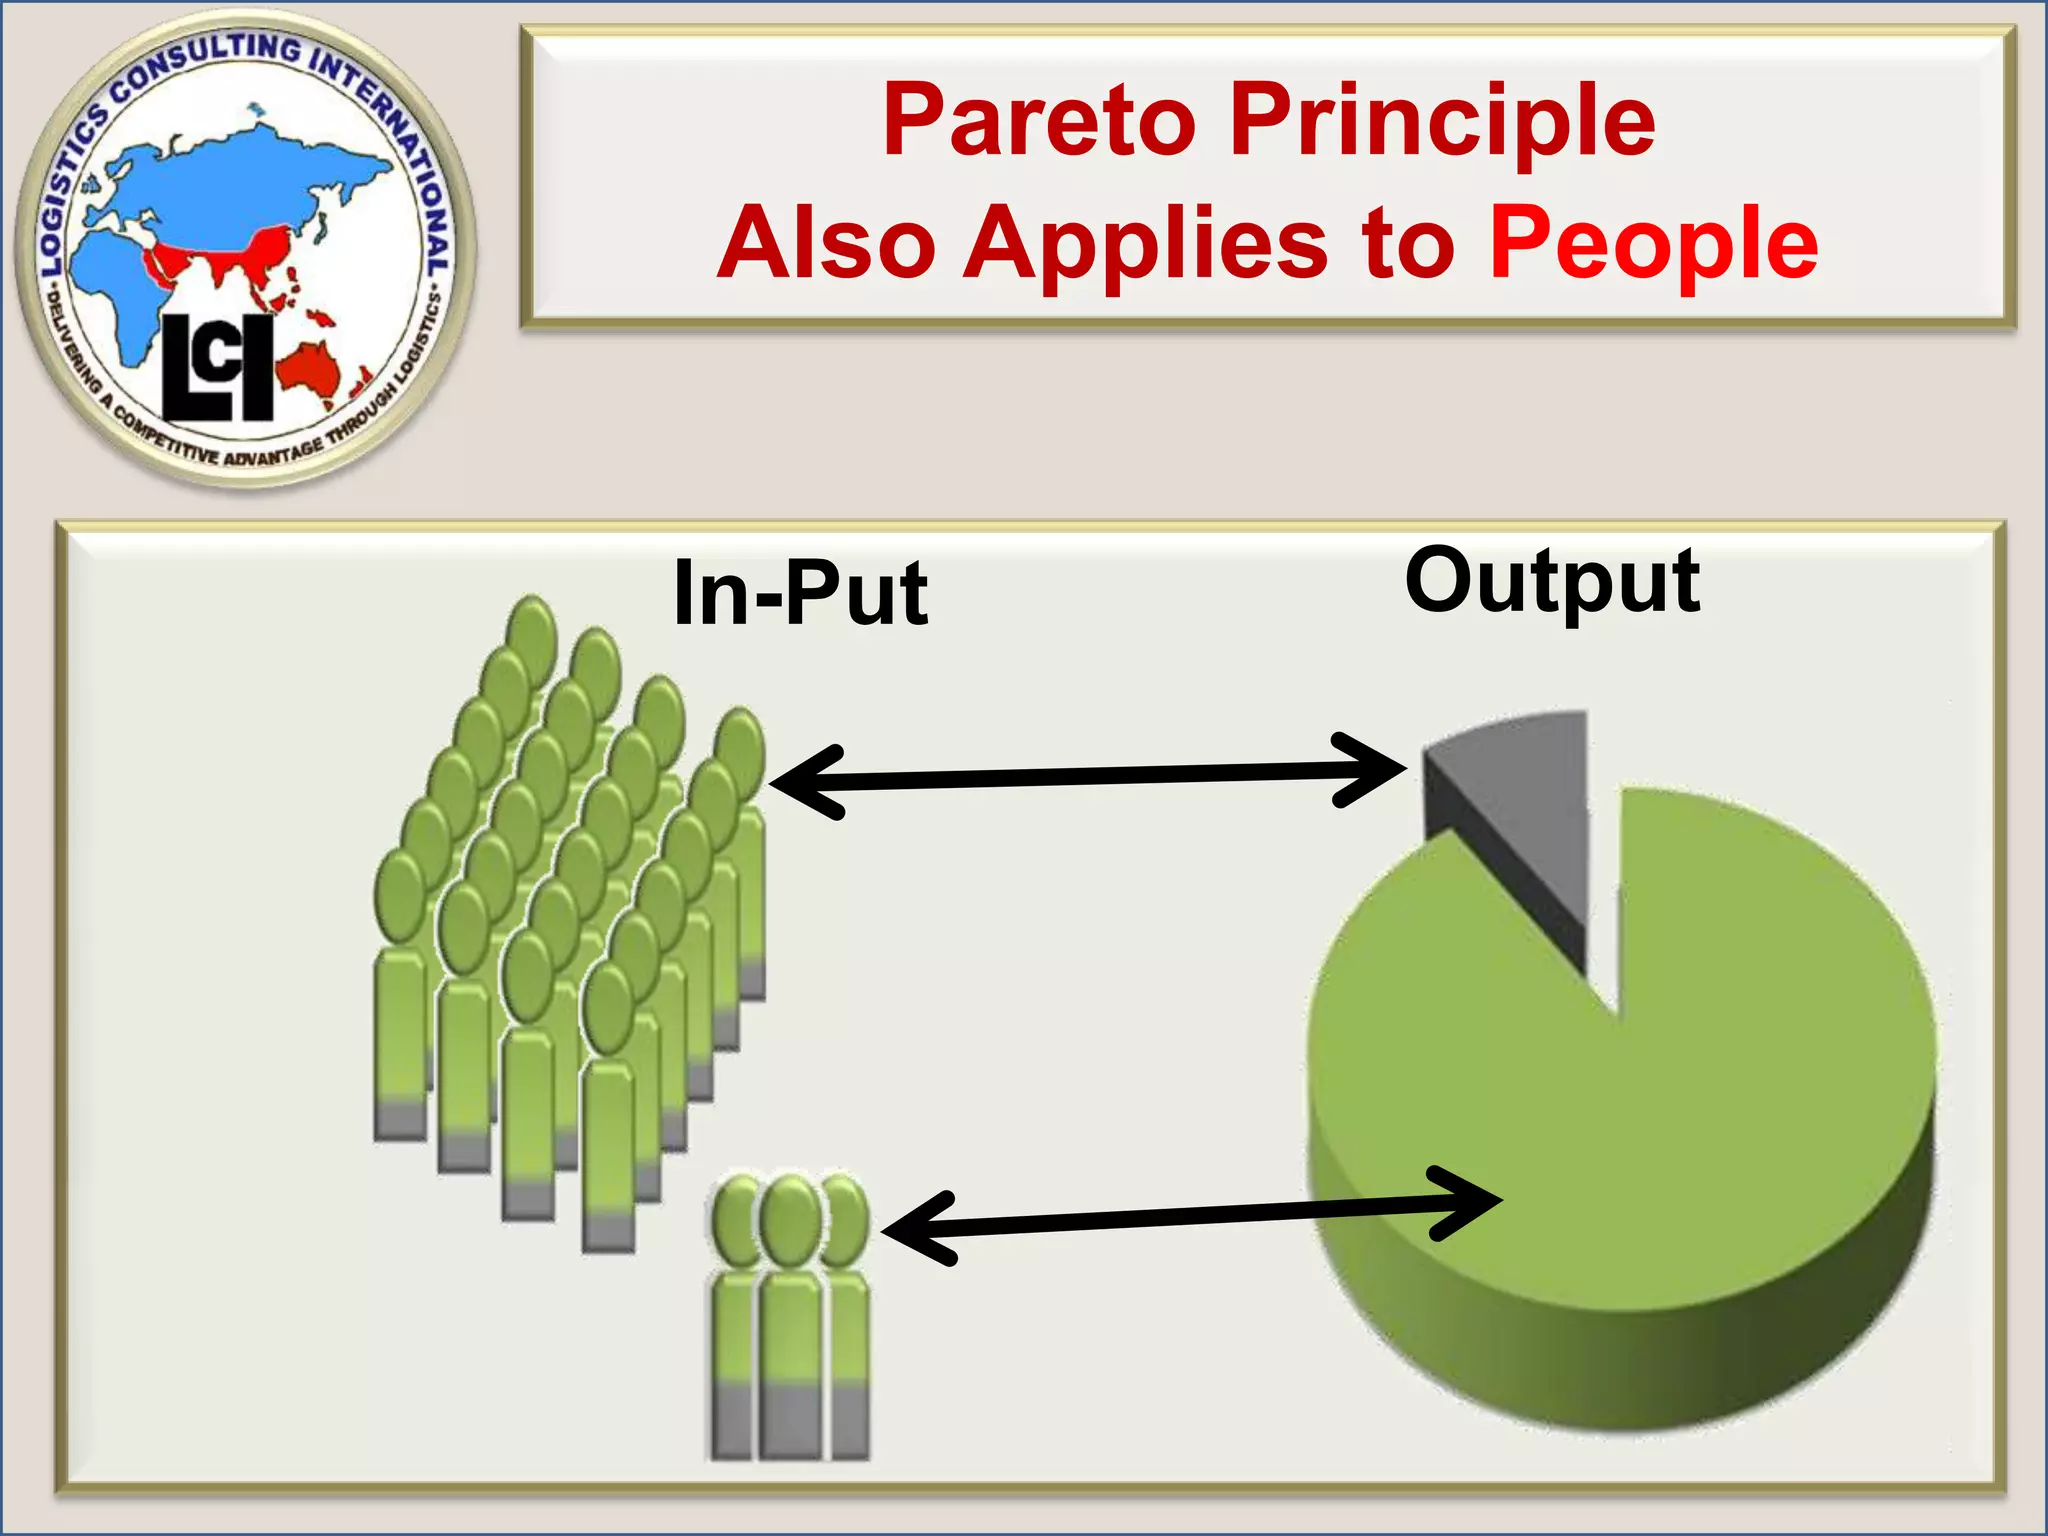
Have YOU Become An 80/20 Individual?An 80/20 Individual is a person who has learned that in order to have success, they don't need to be increasing their effort by 110%. Most people who do this are simply doing the wrong things more often. Instead, an 80/20 individual looks at the 20% that is responsible for 80% of their results and then they focus on improving this 20%! Is it really that simple? ………. Yes!Once you are taught how and what tools to use to improve your results, the only question left is ..... Will YOUtake action?