Downloaded 295 times
![Q&A 42U Confidential ©2008 42U All rights reserved Slide For More Information Contact Your 42U Data Center Efficiency Consultant: 1-800-638-2638 or www.42U.com For a Copy of Today’s Presentation Email: [email_address] Thank You](https://image.slidesharecdn.com/42ubestpracticeswebinarpresentation081203-091214110542-phpapp02/75/Data-Center-Energy-Efficiency-Best-Practices-31-2048.jpg)

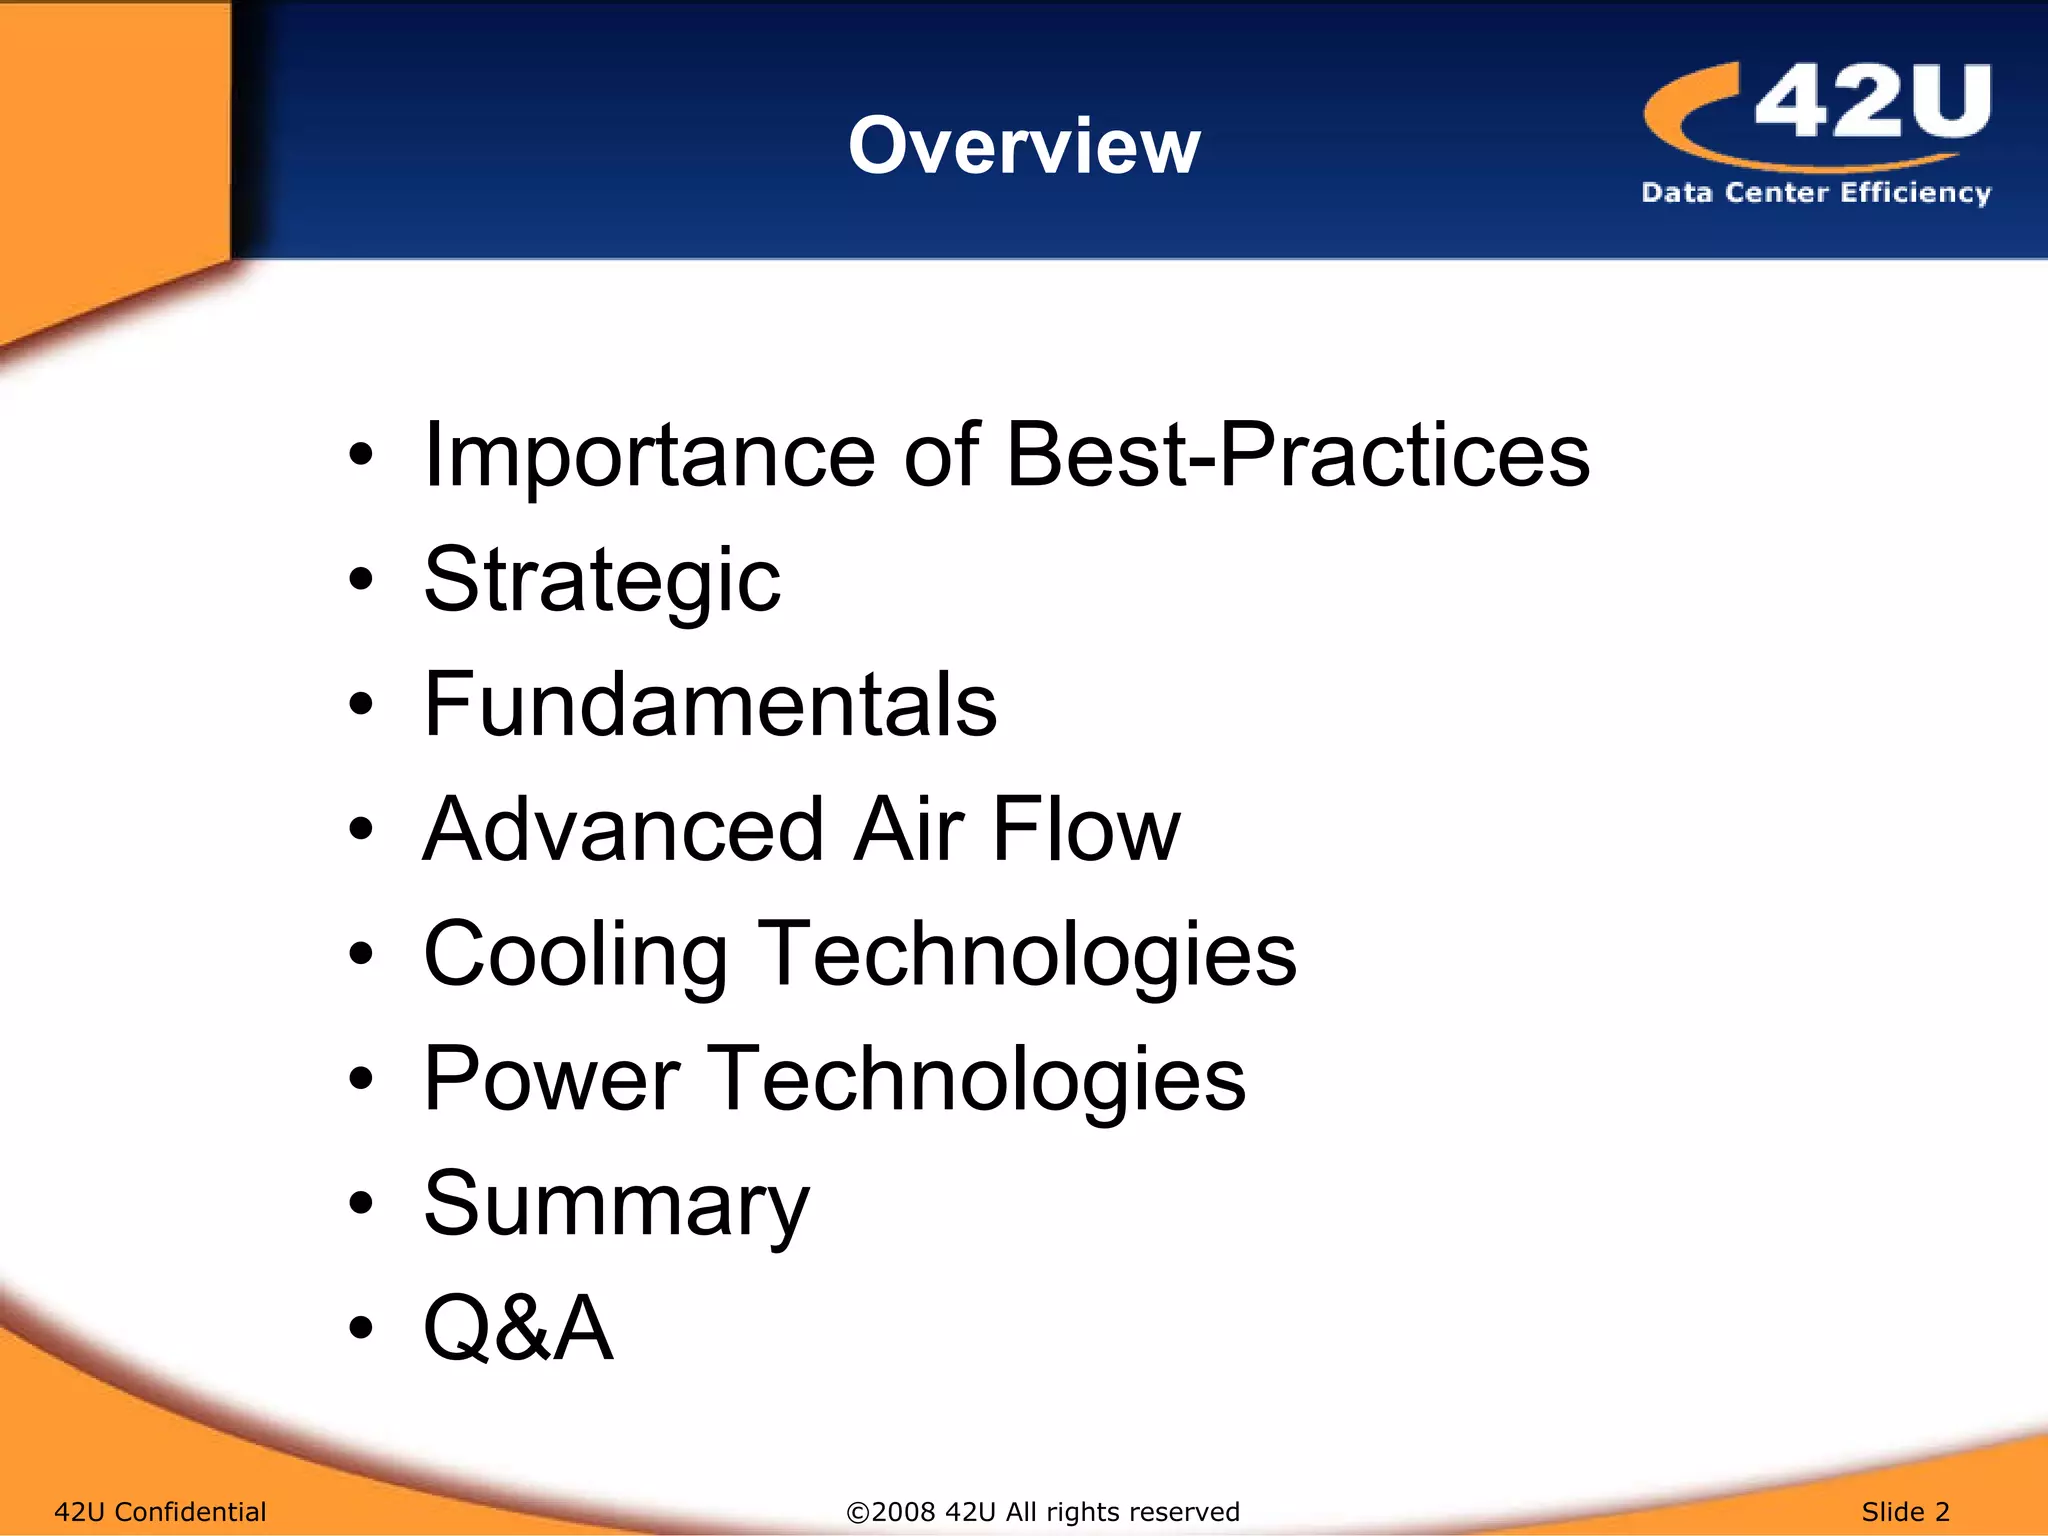
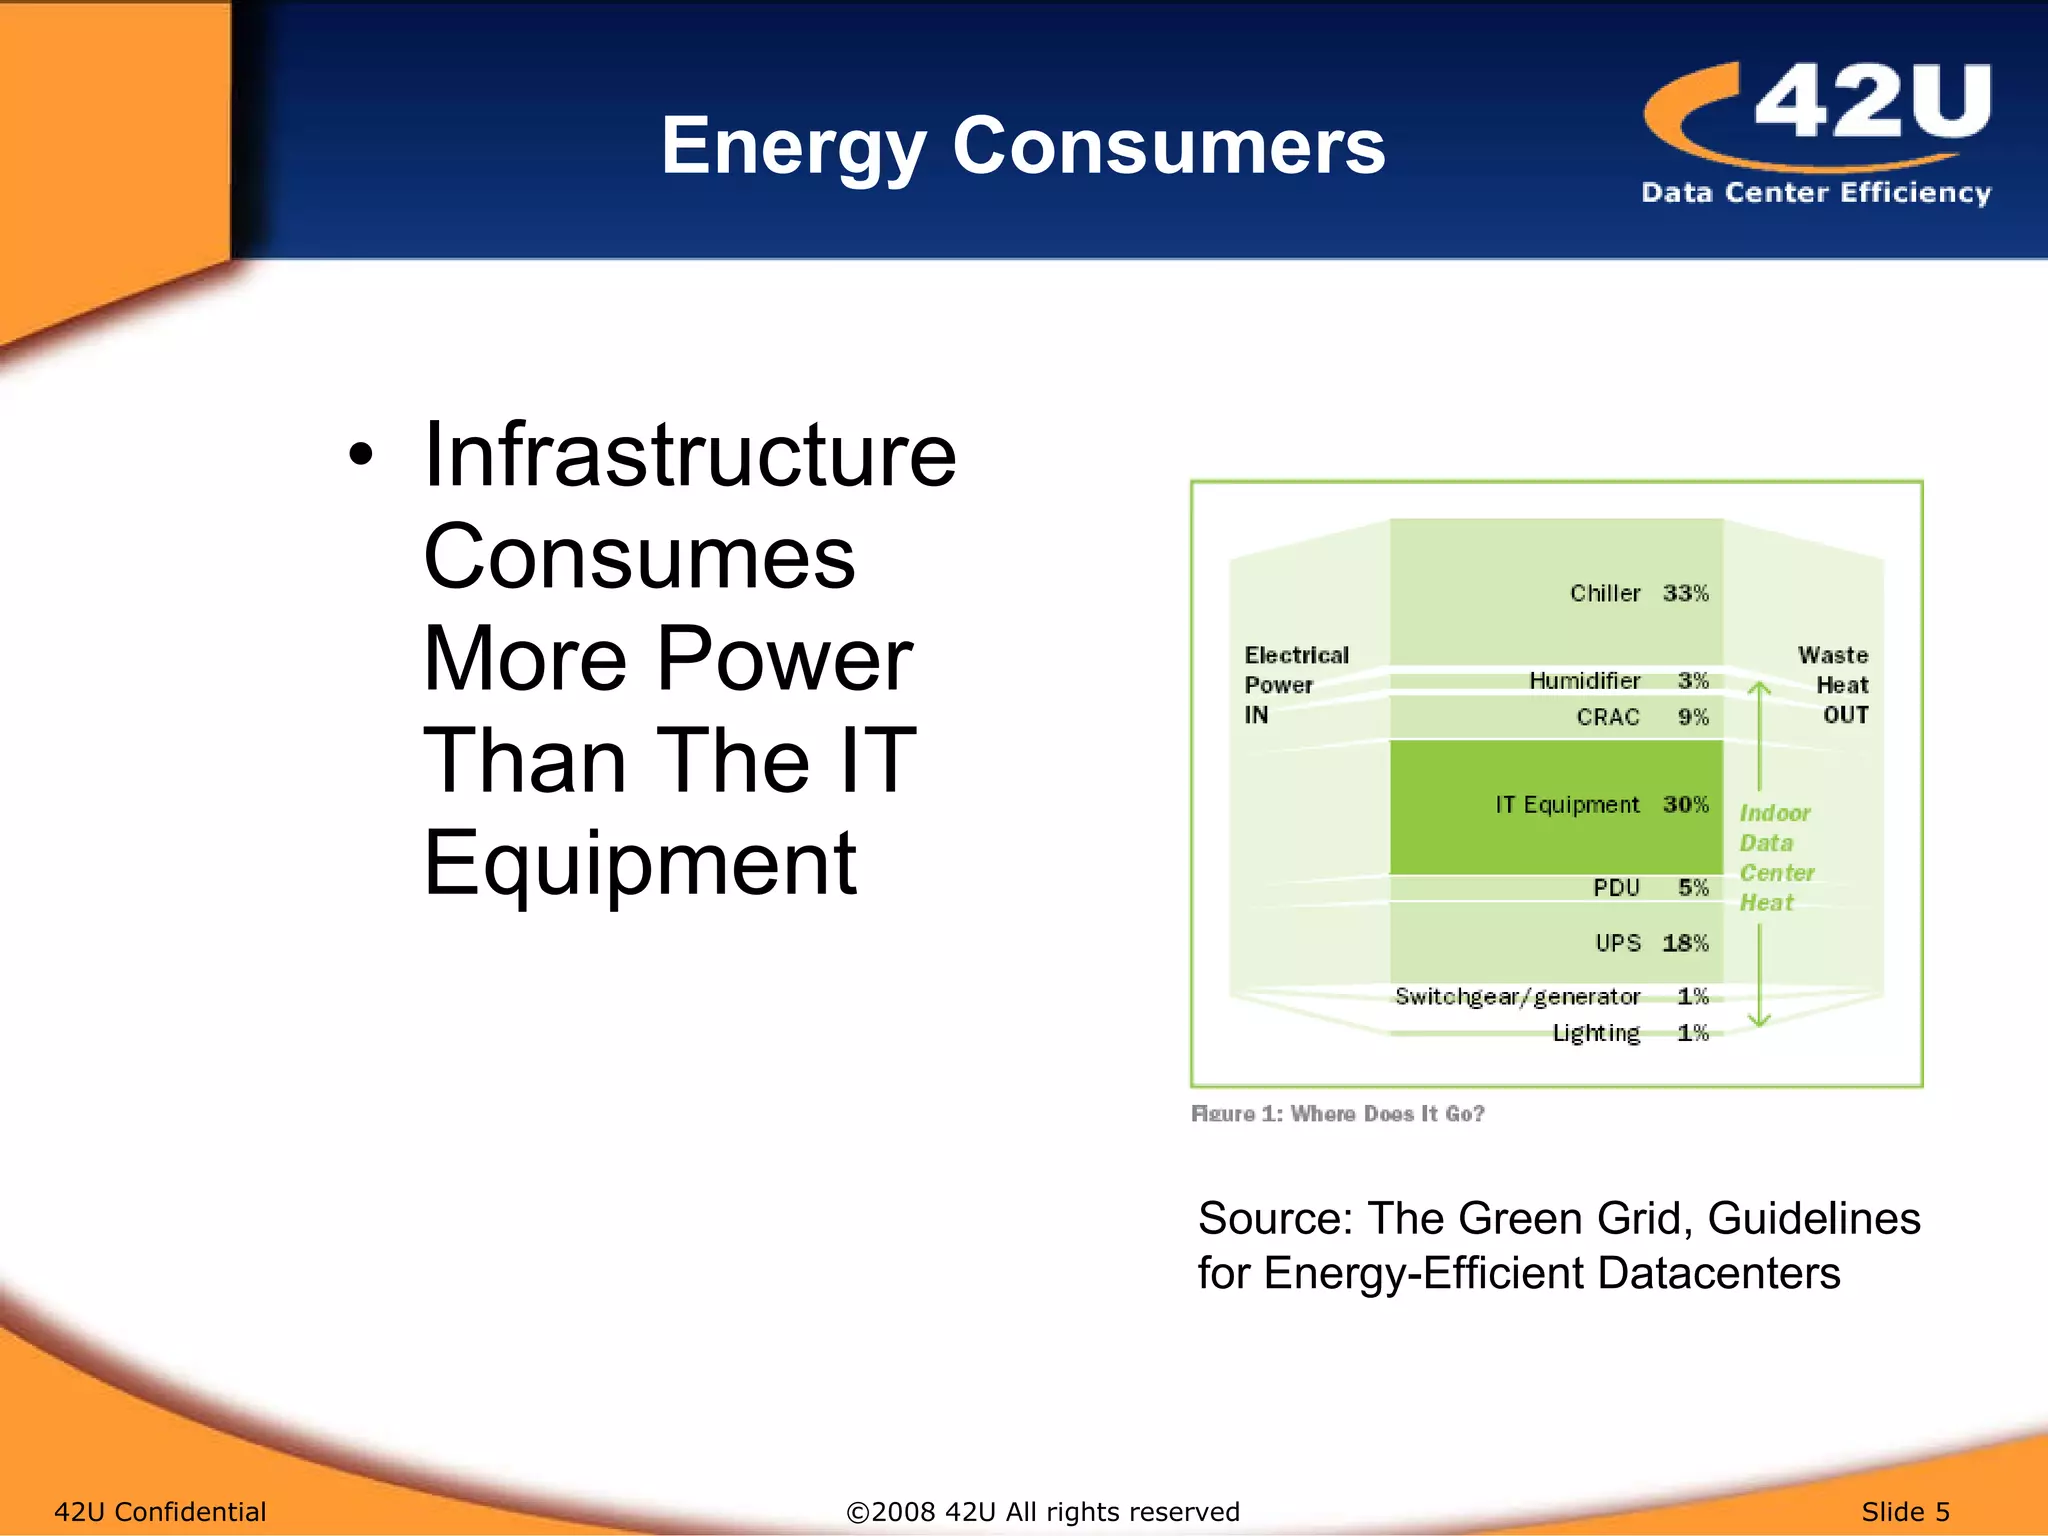
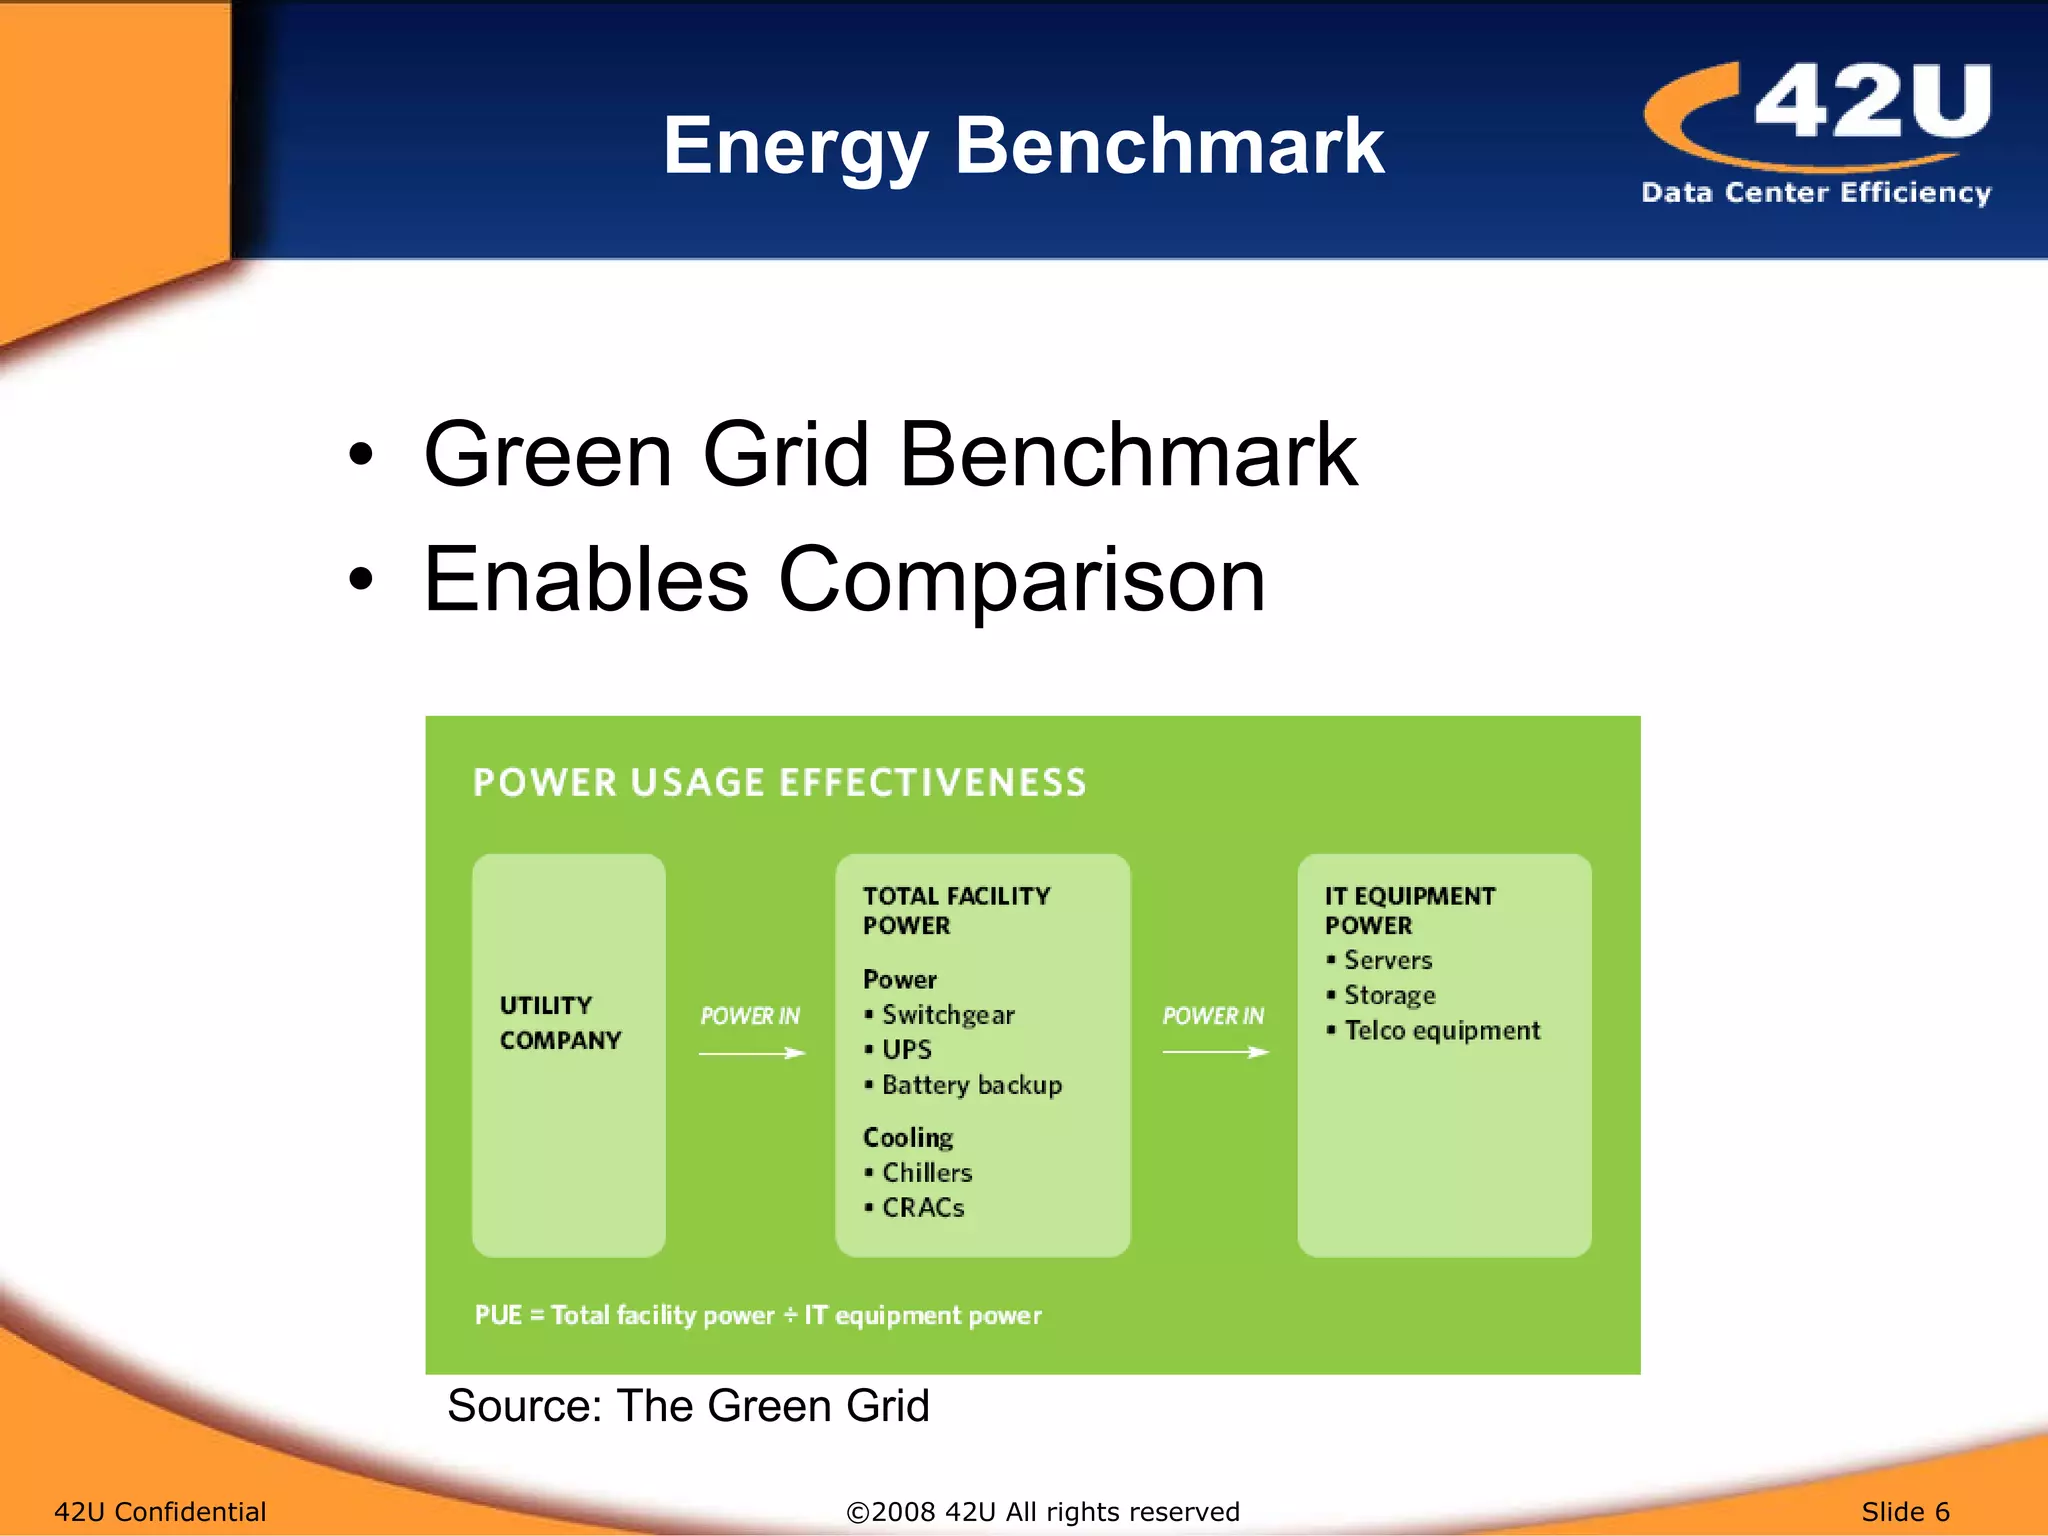
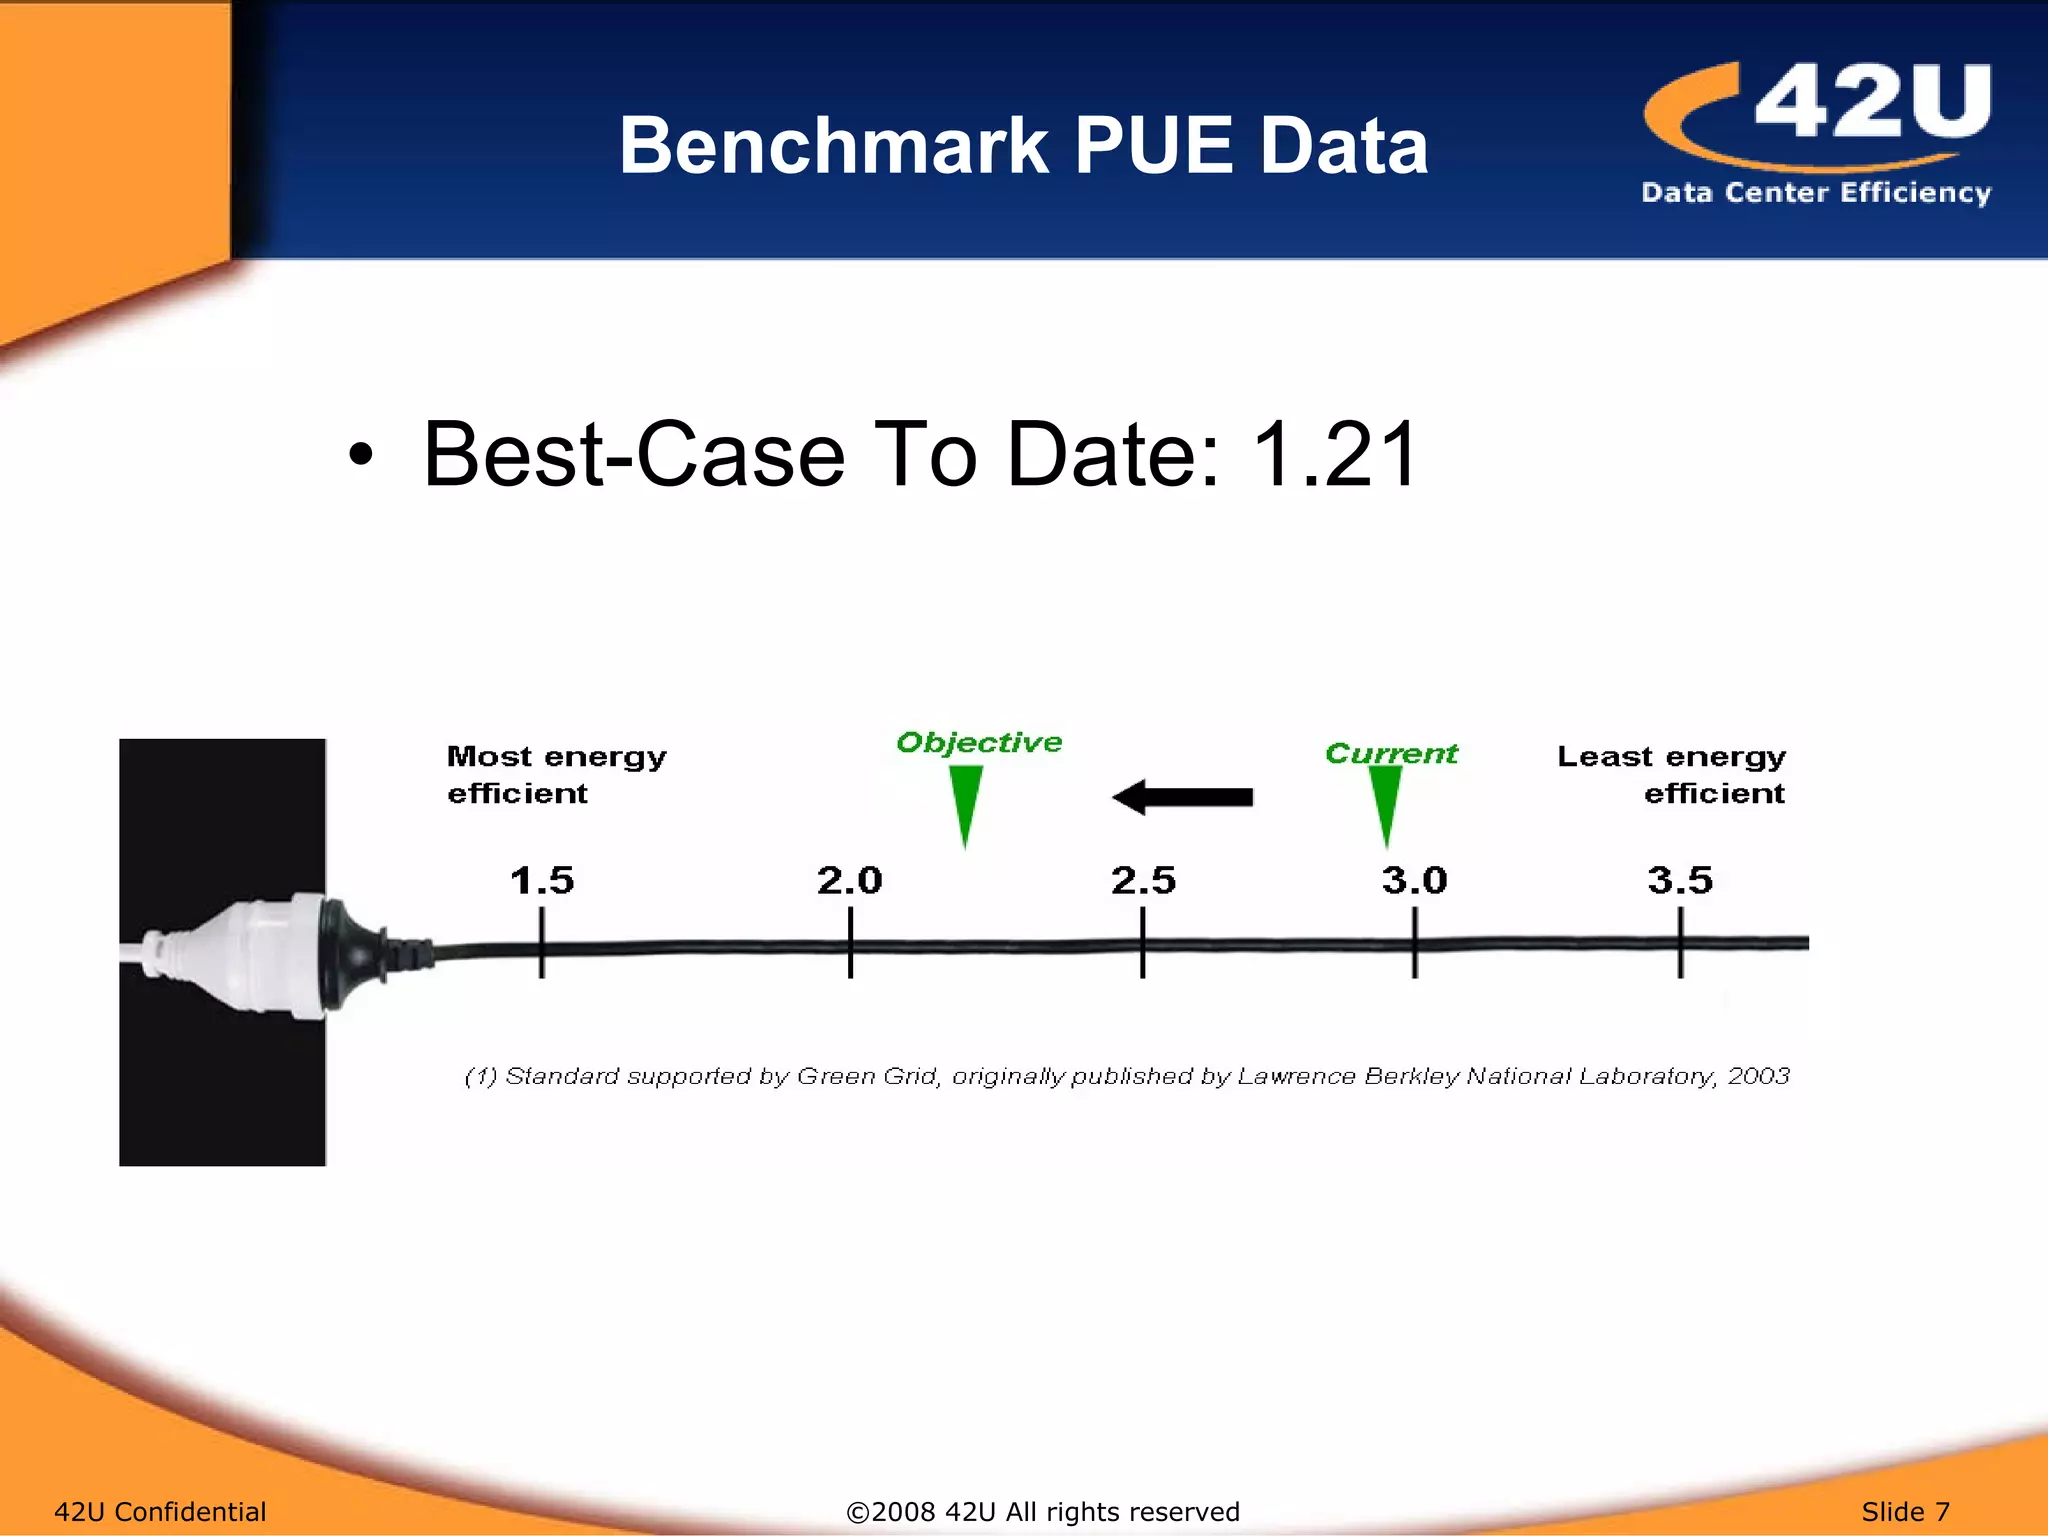
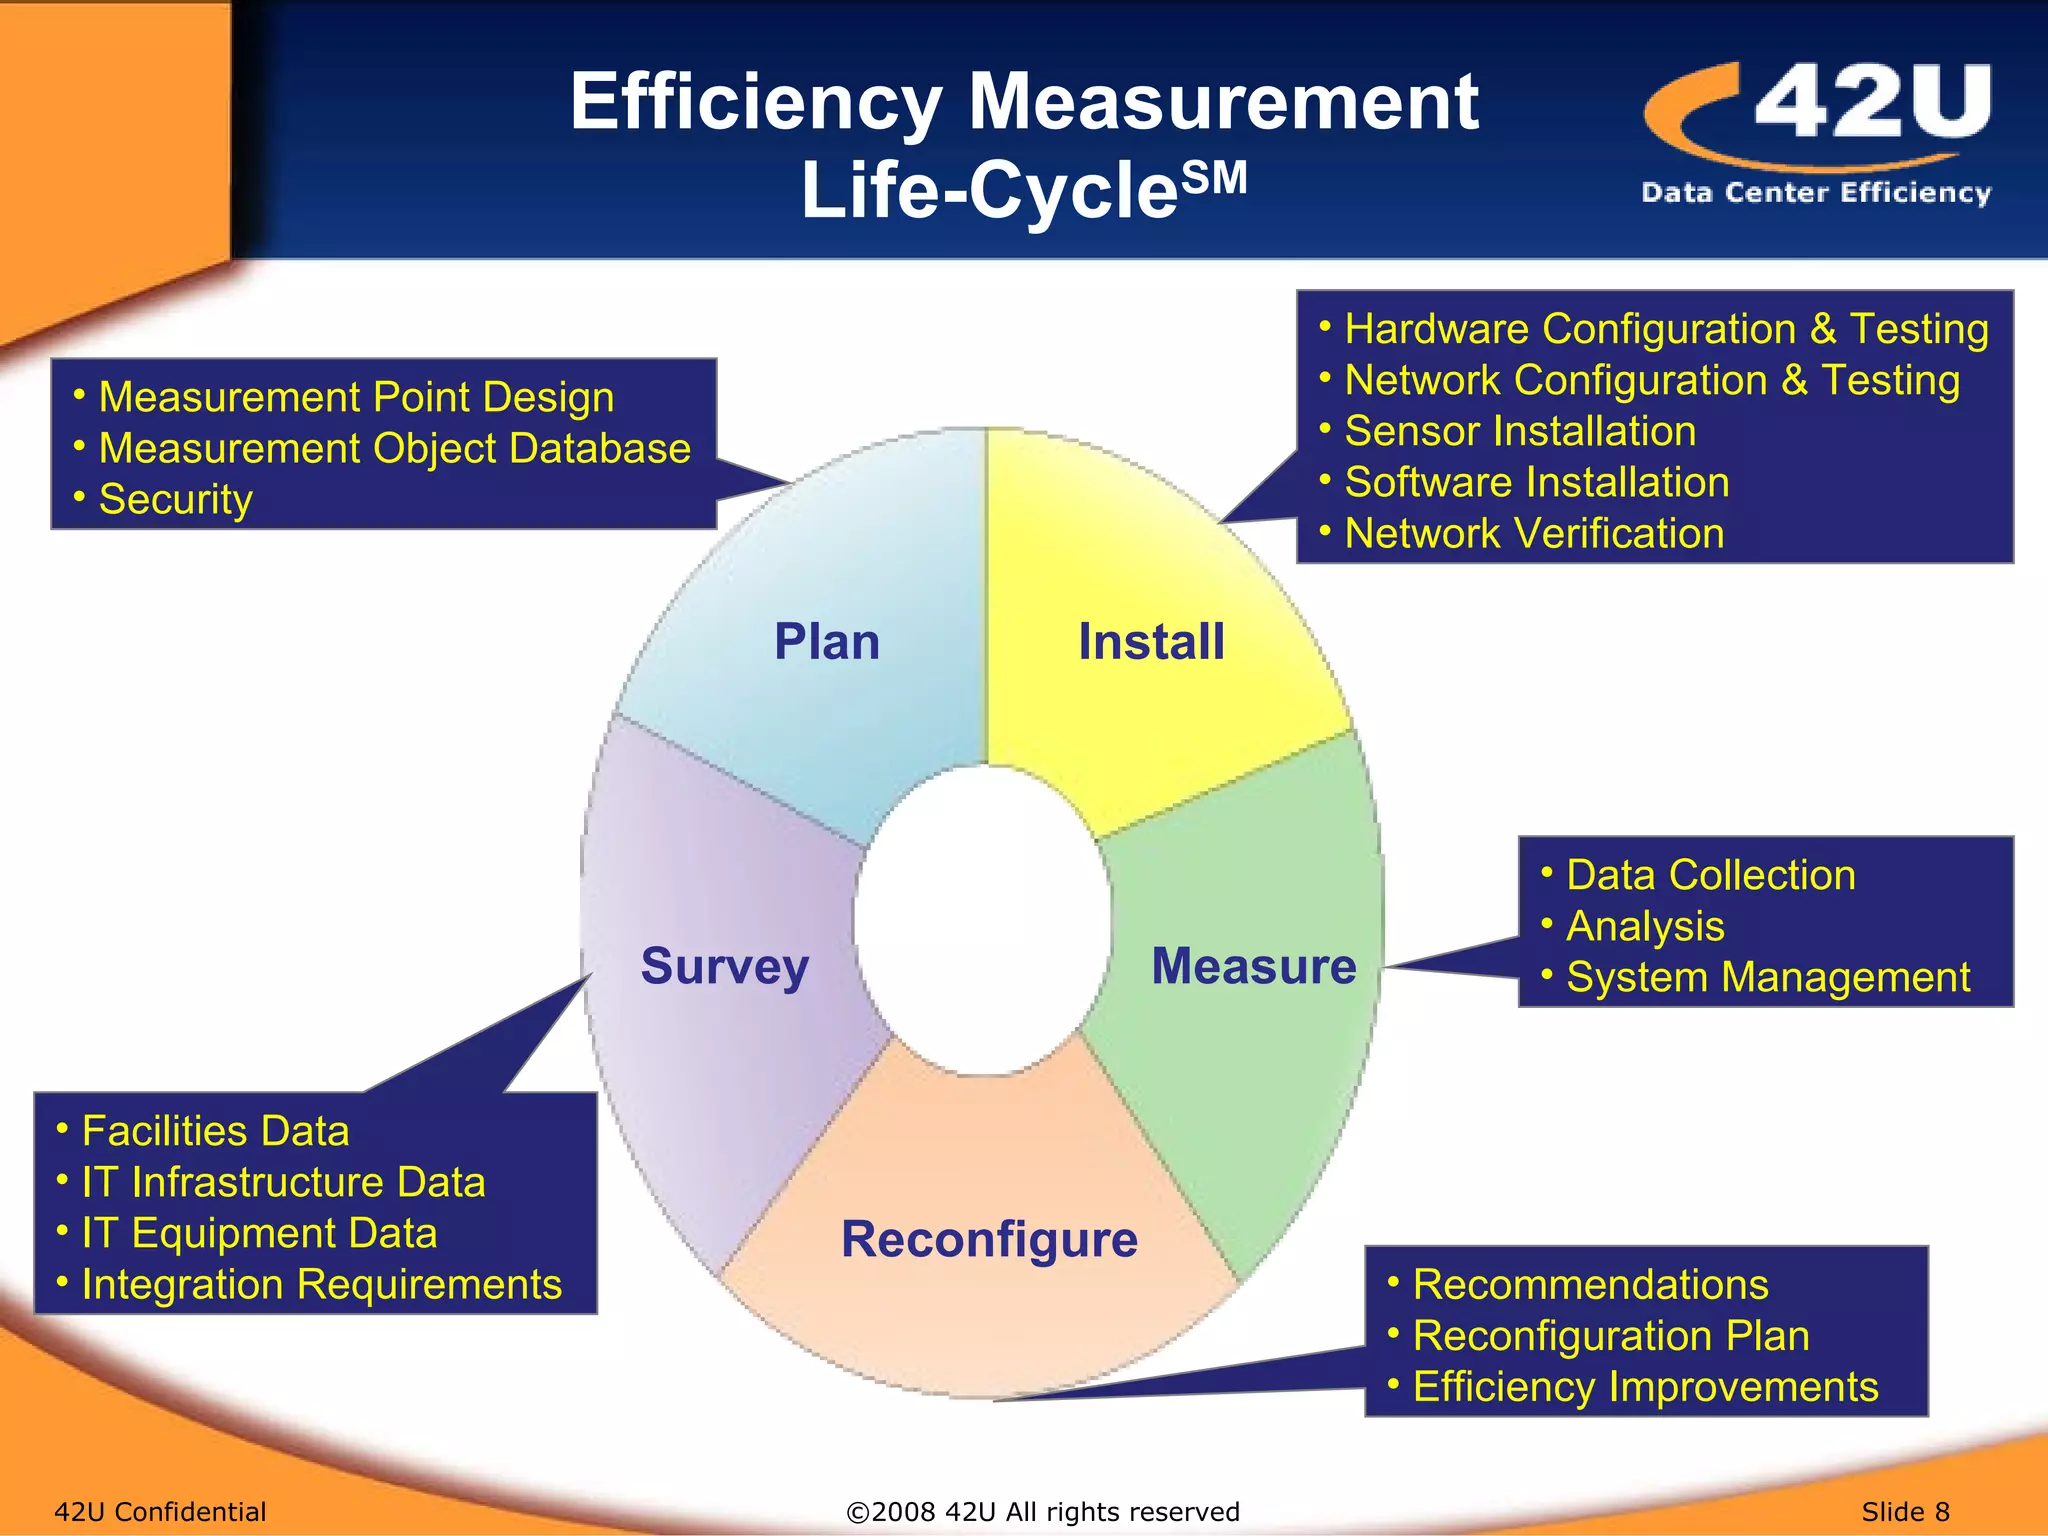
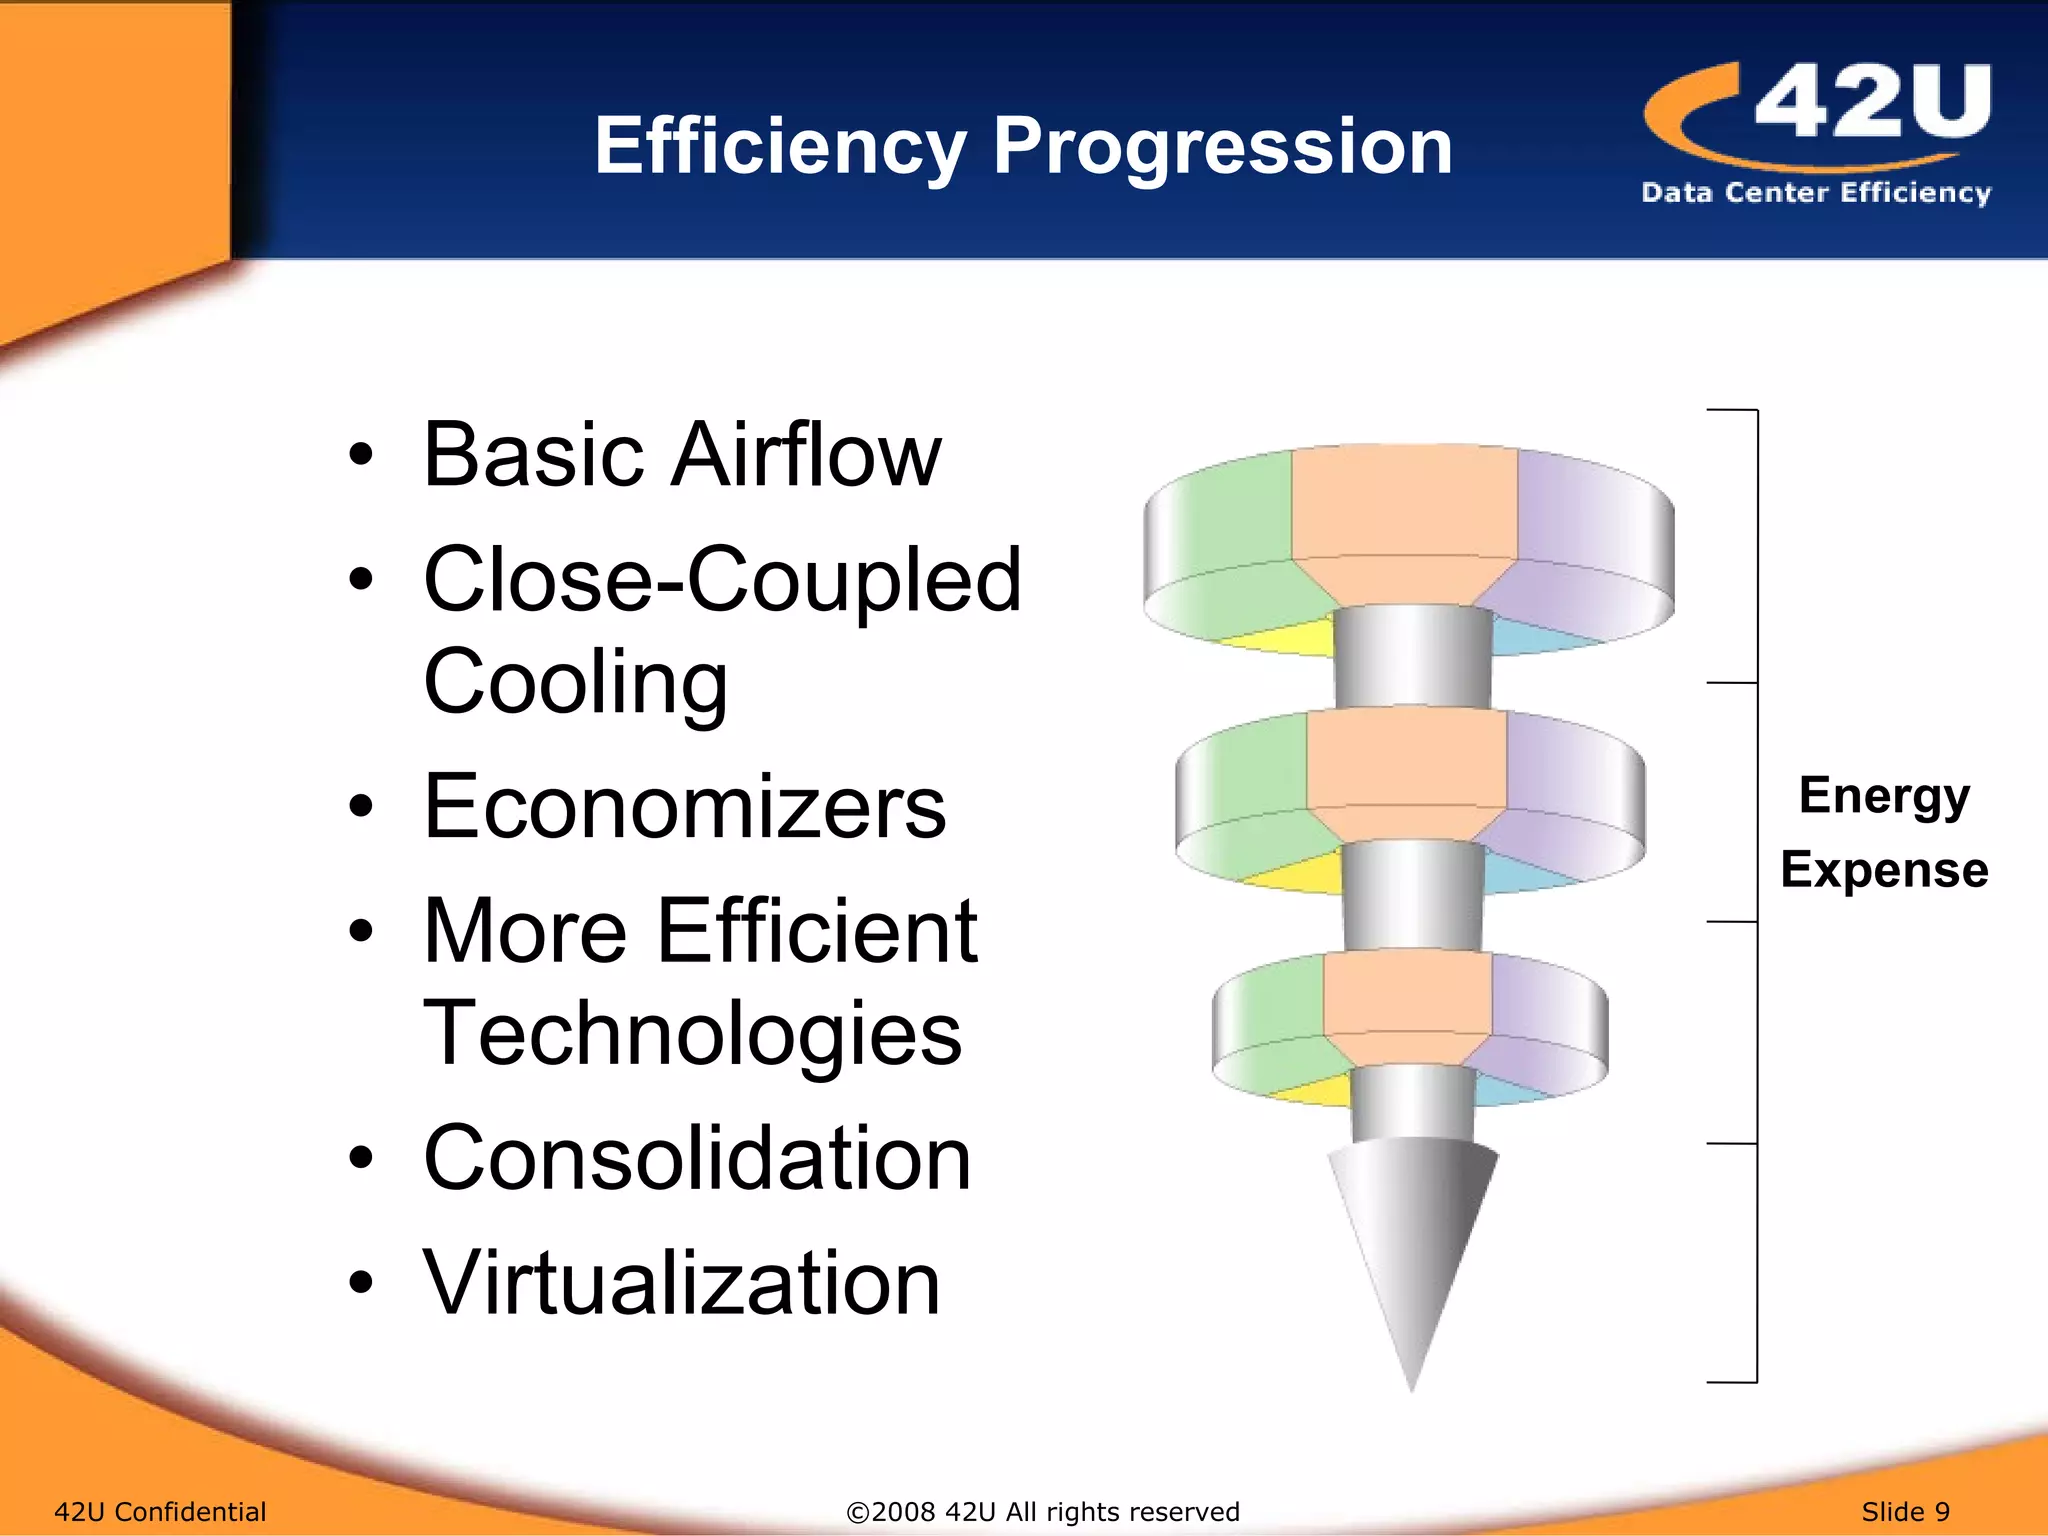
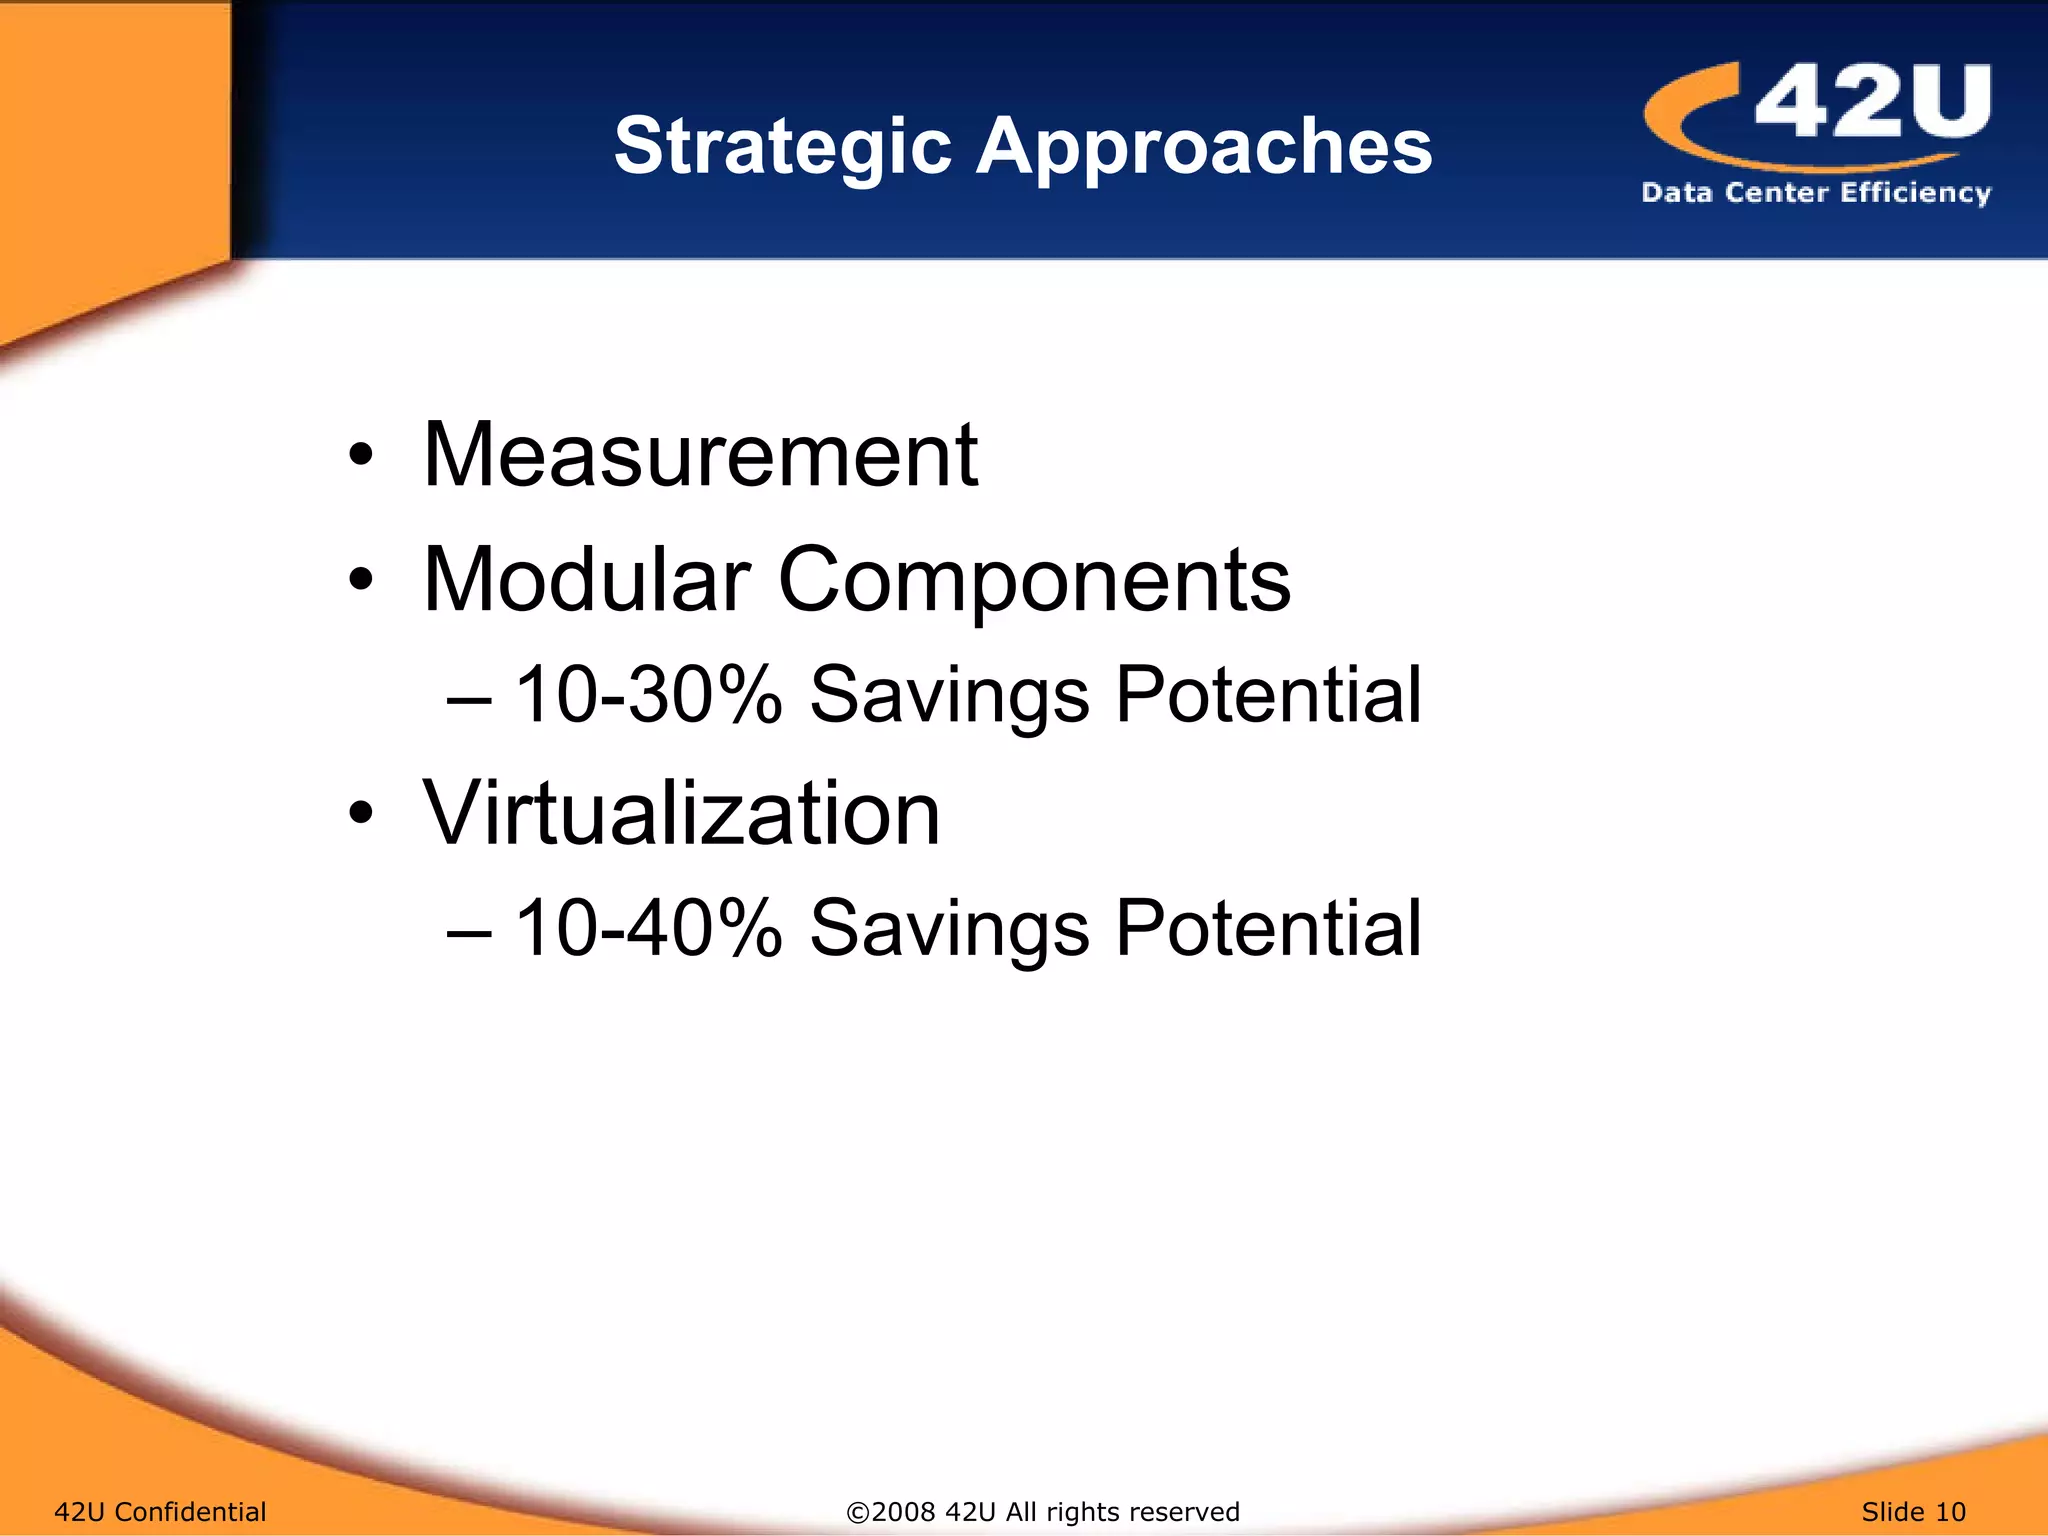
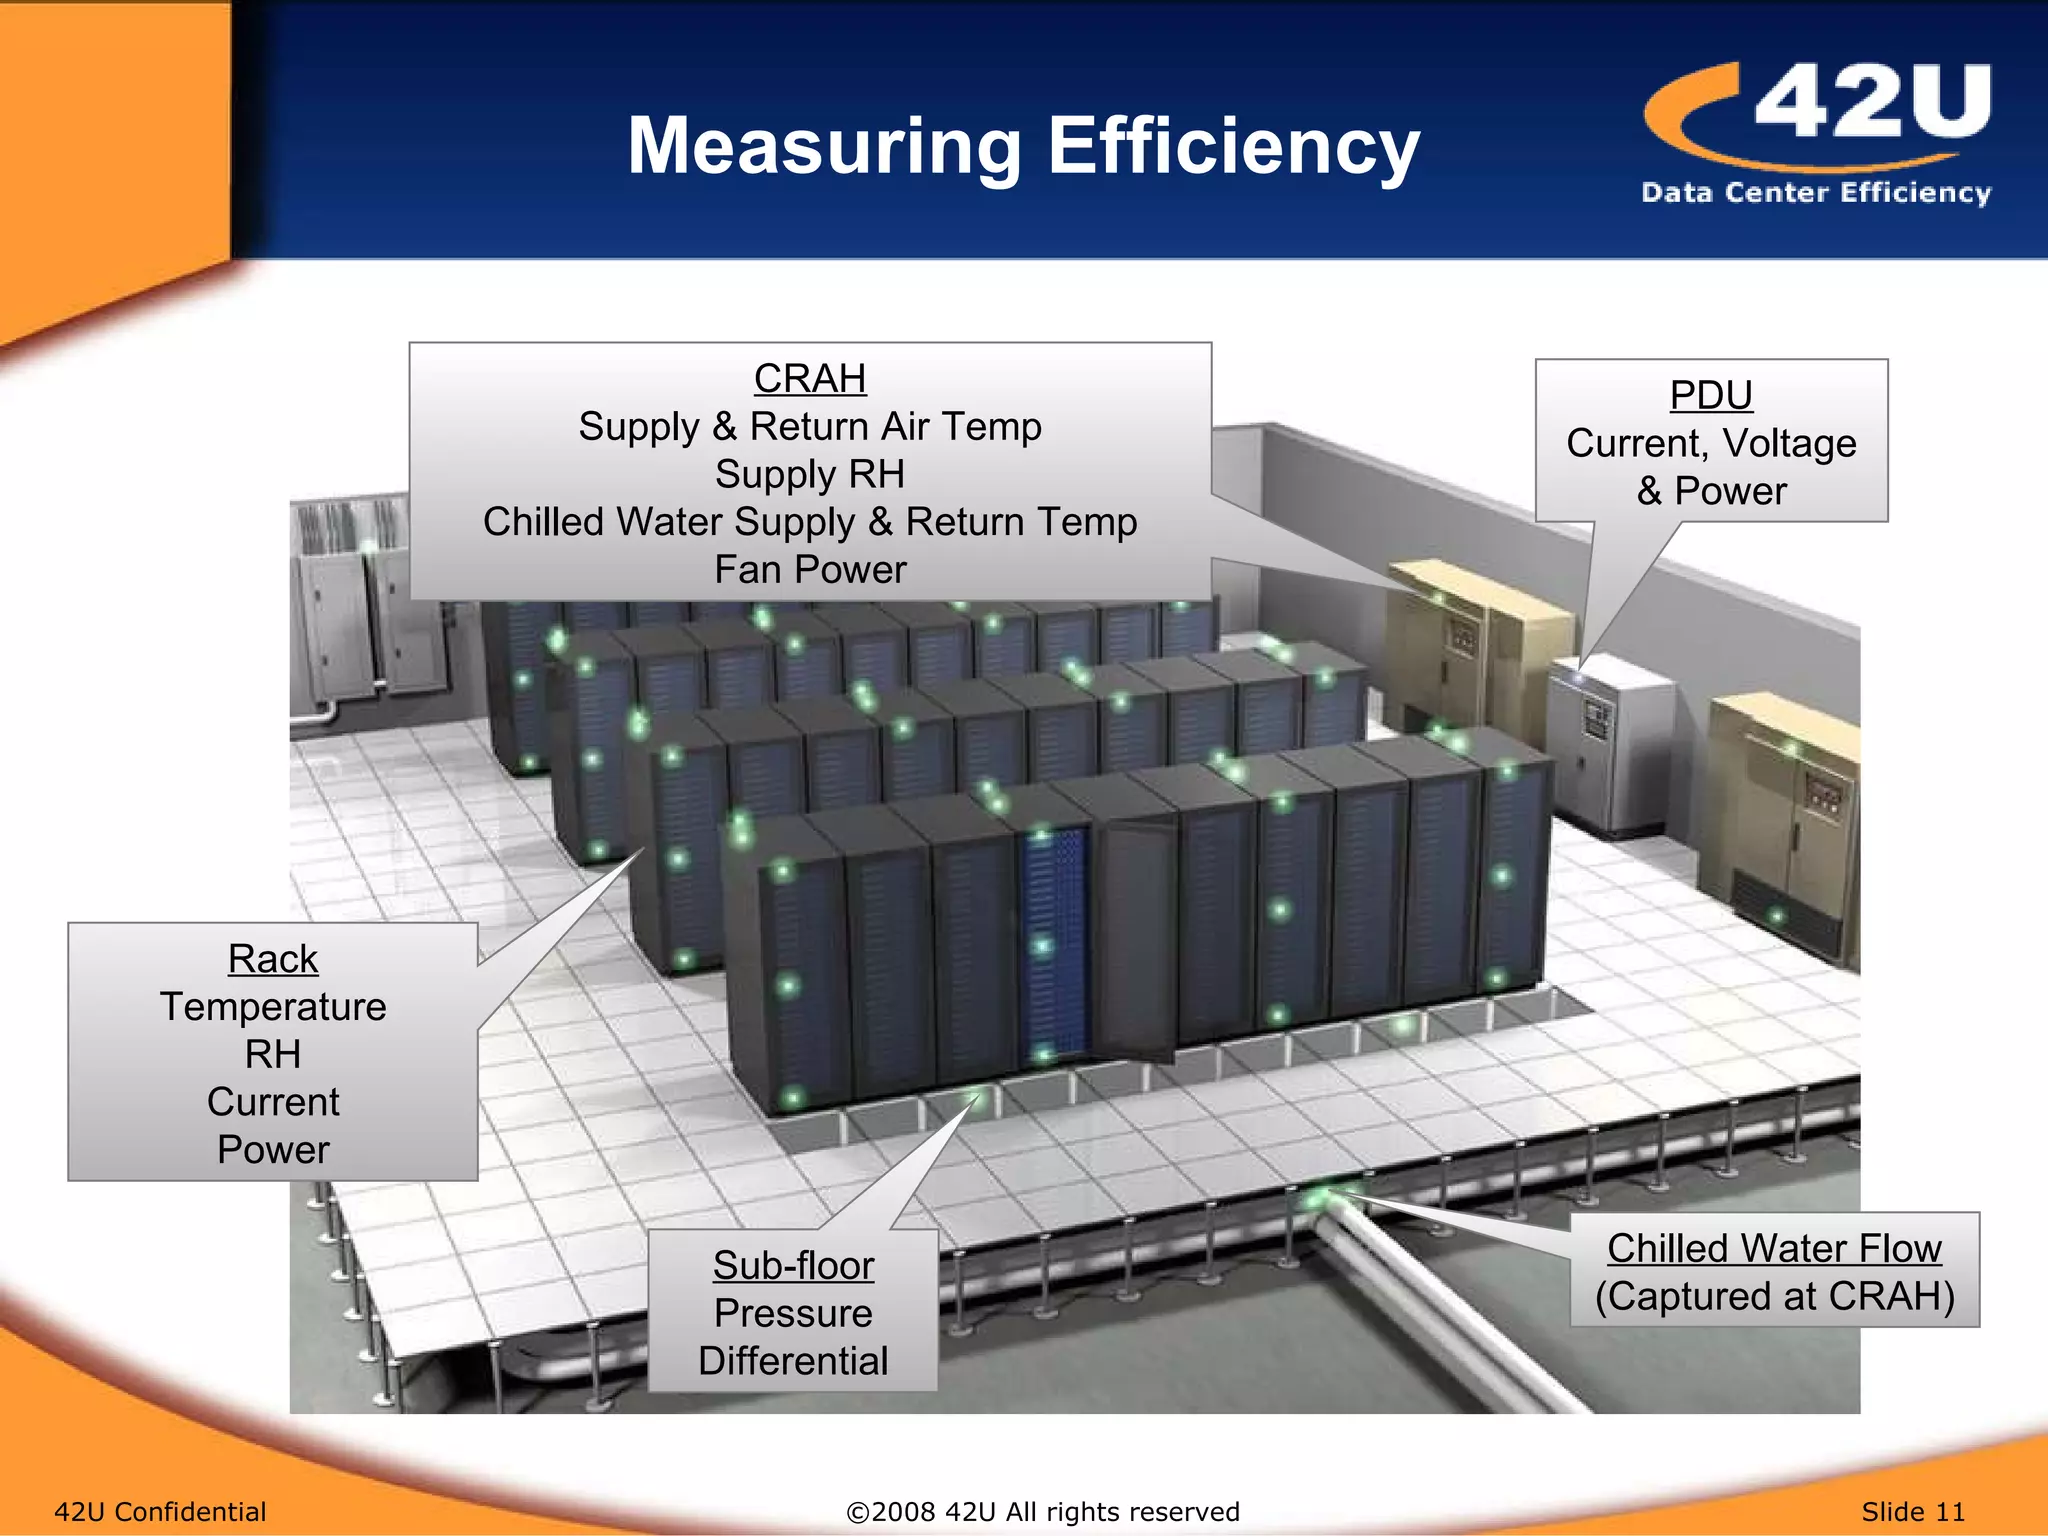
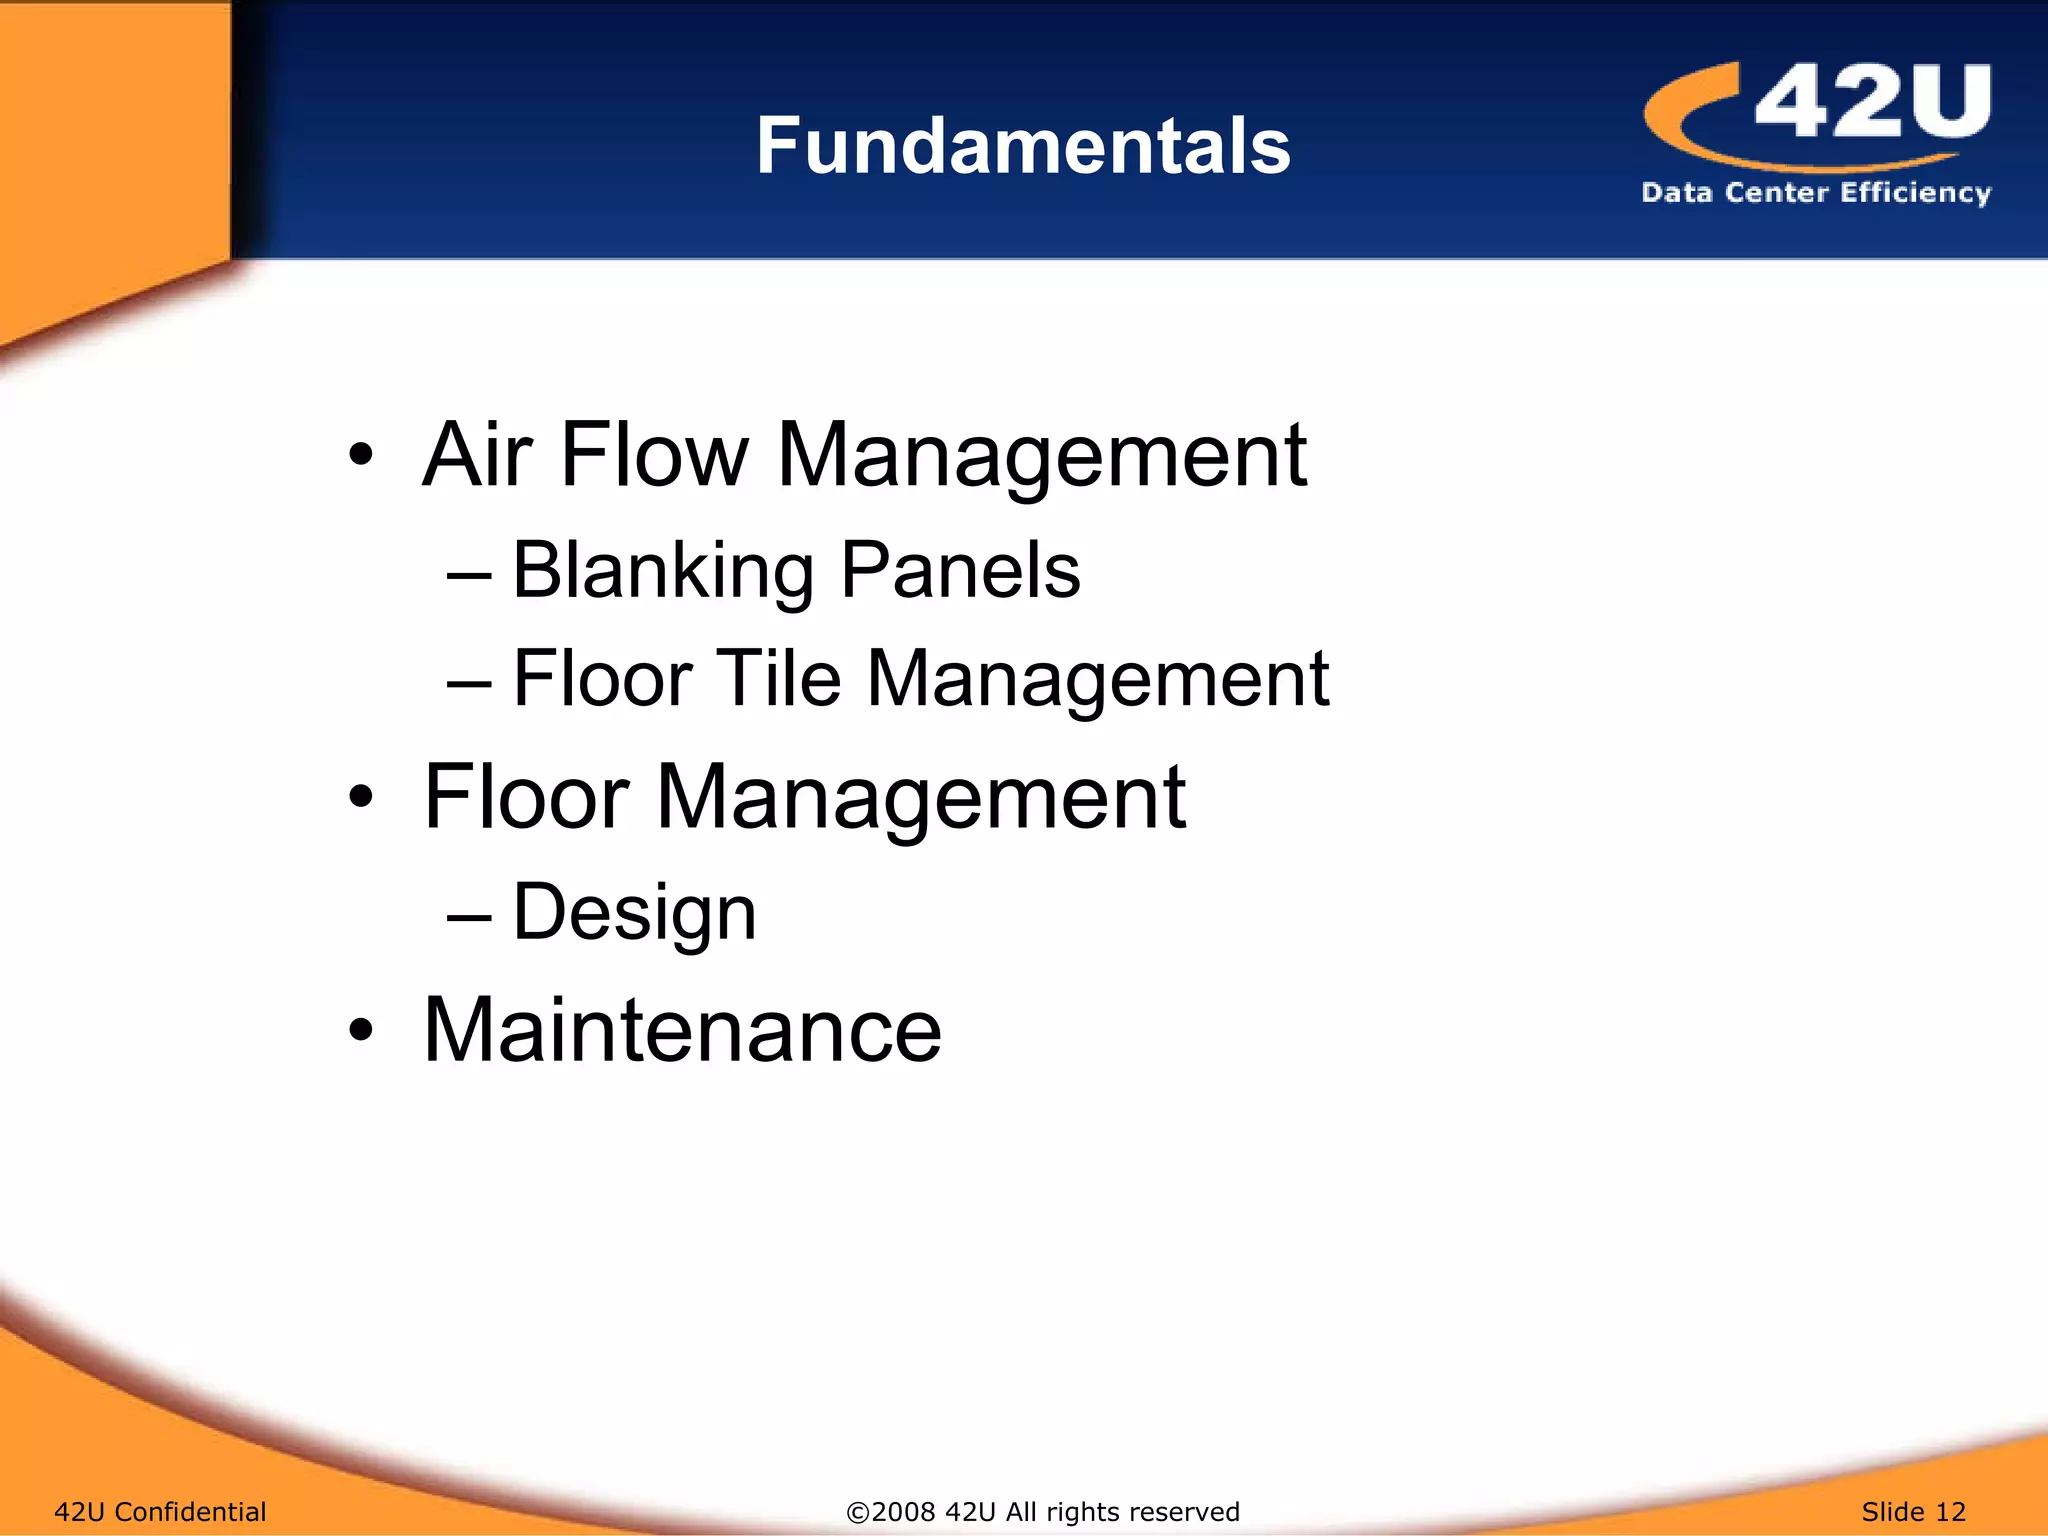
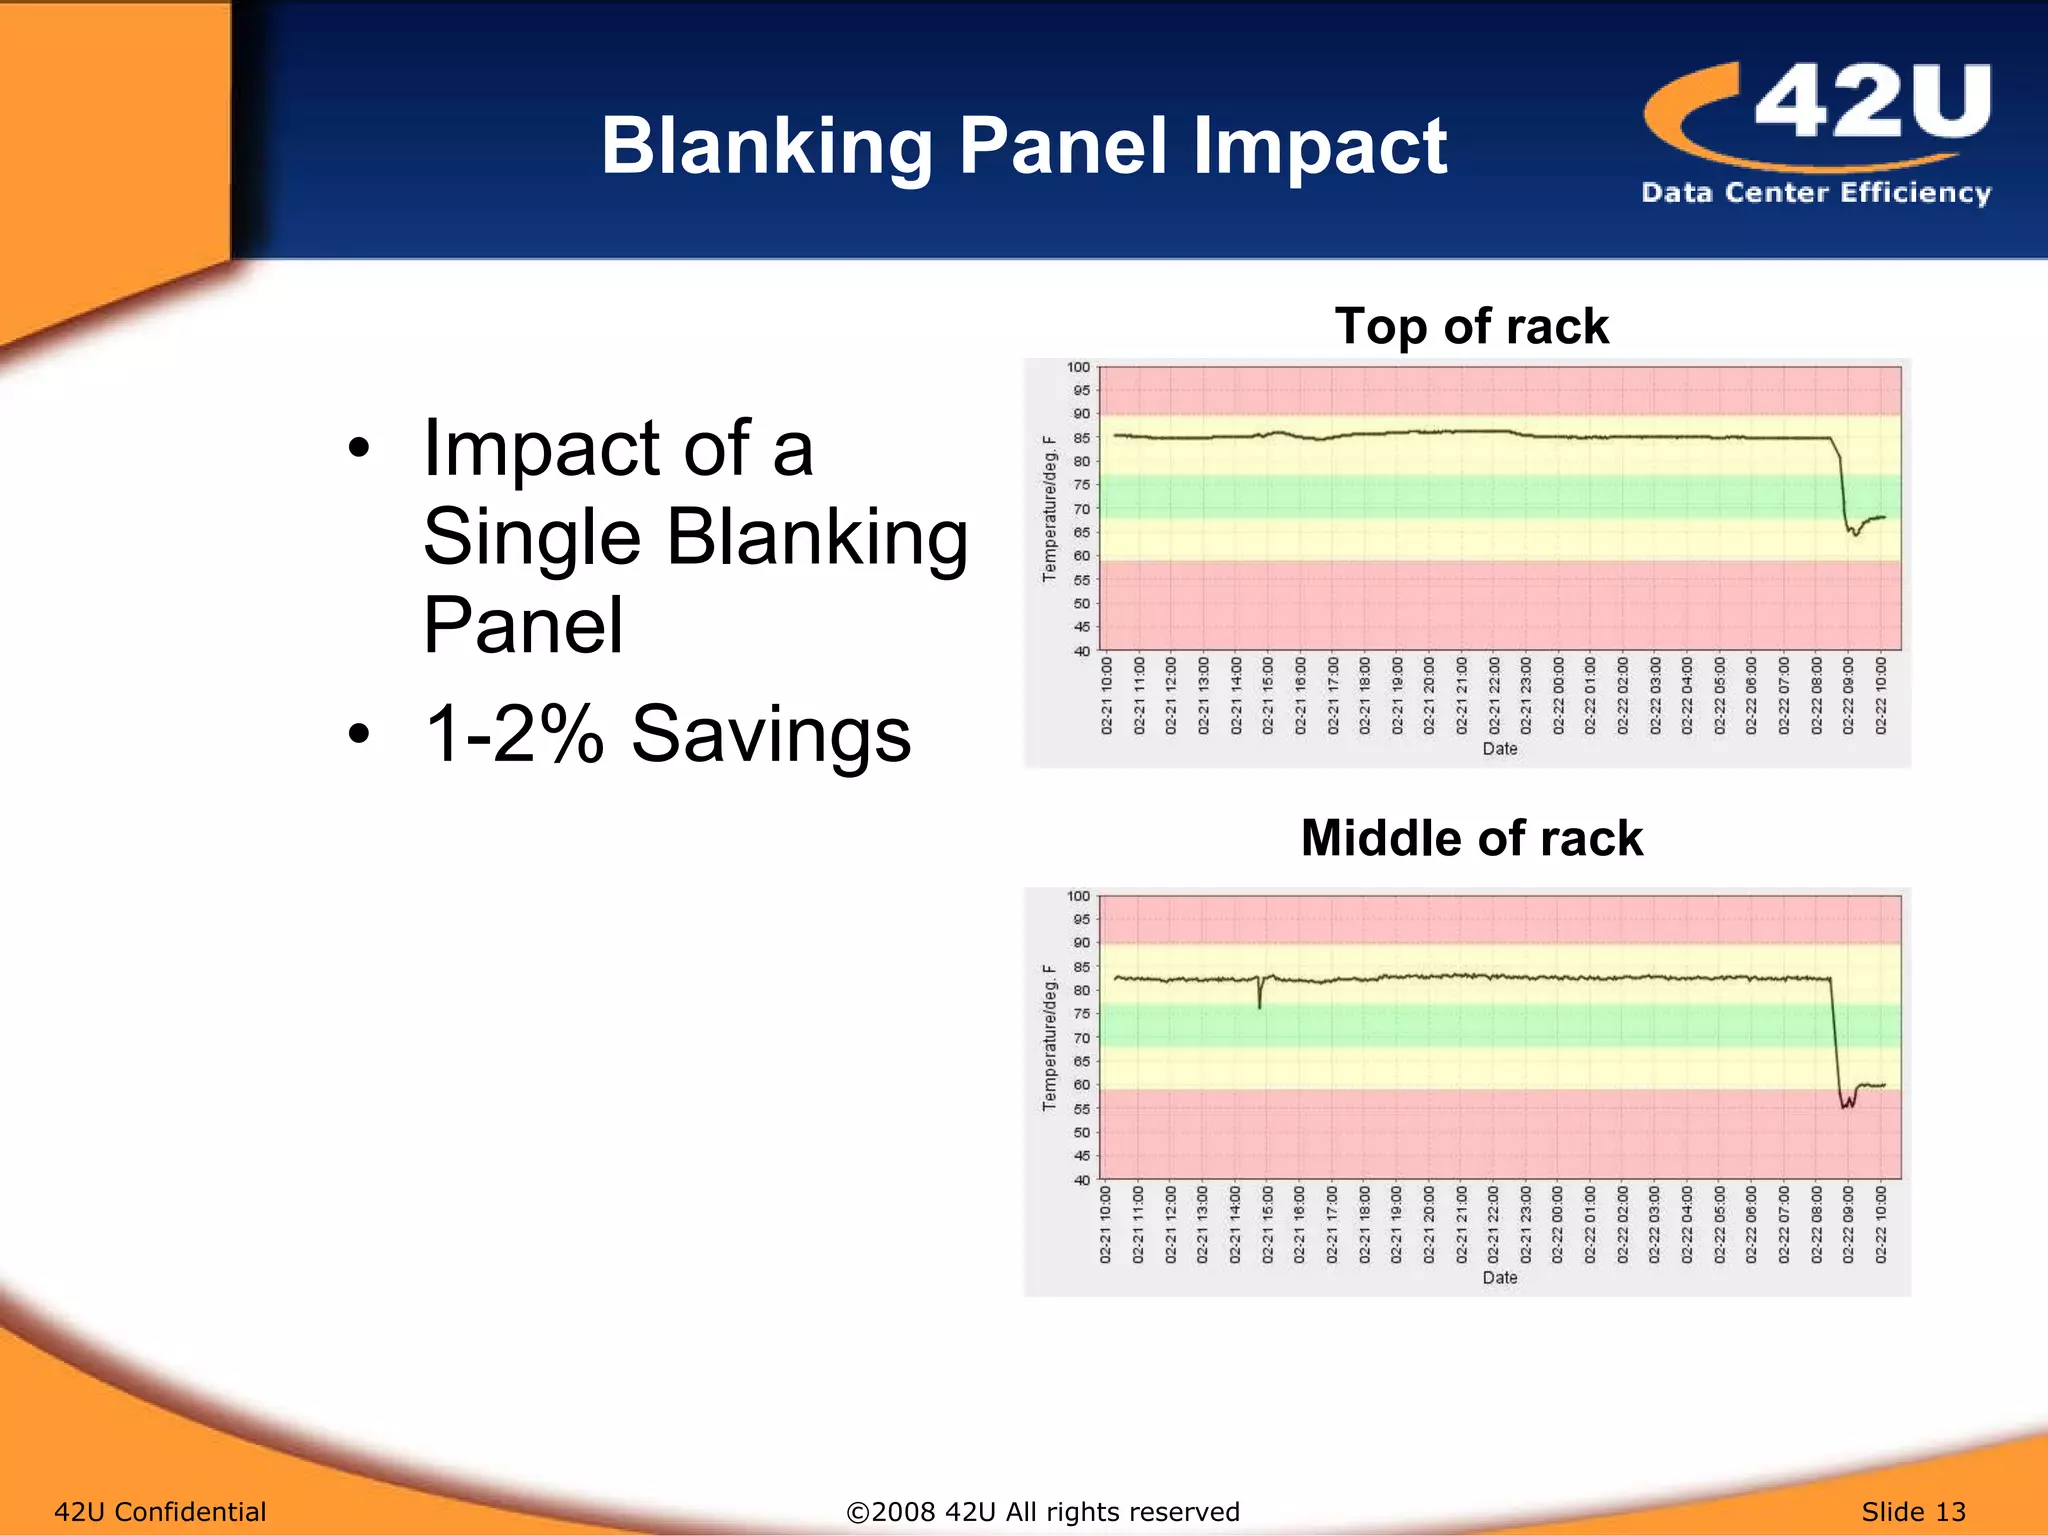
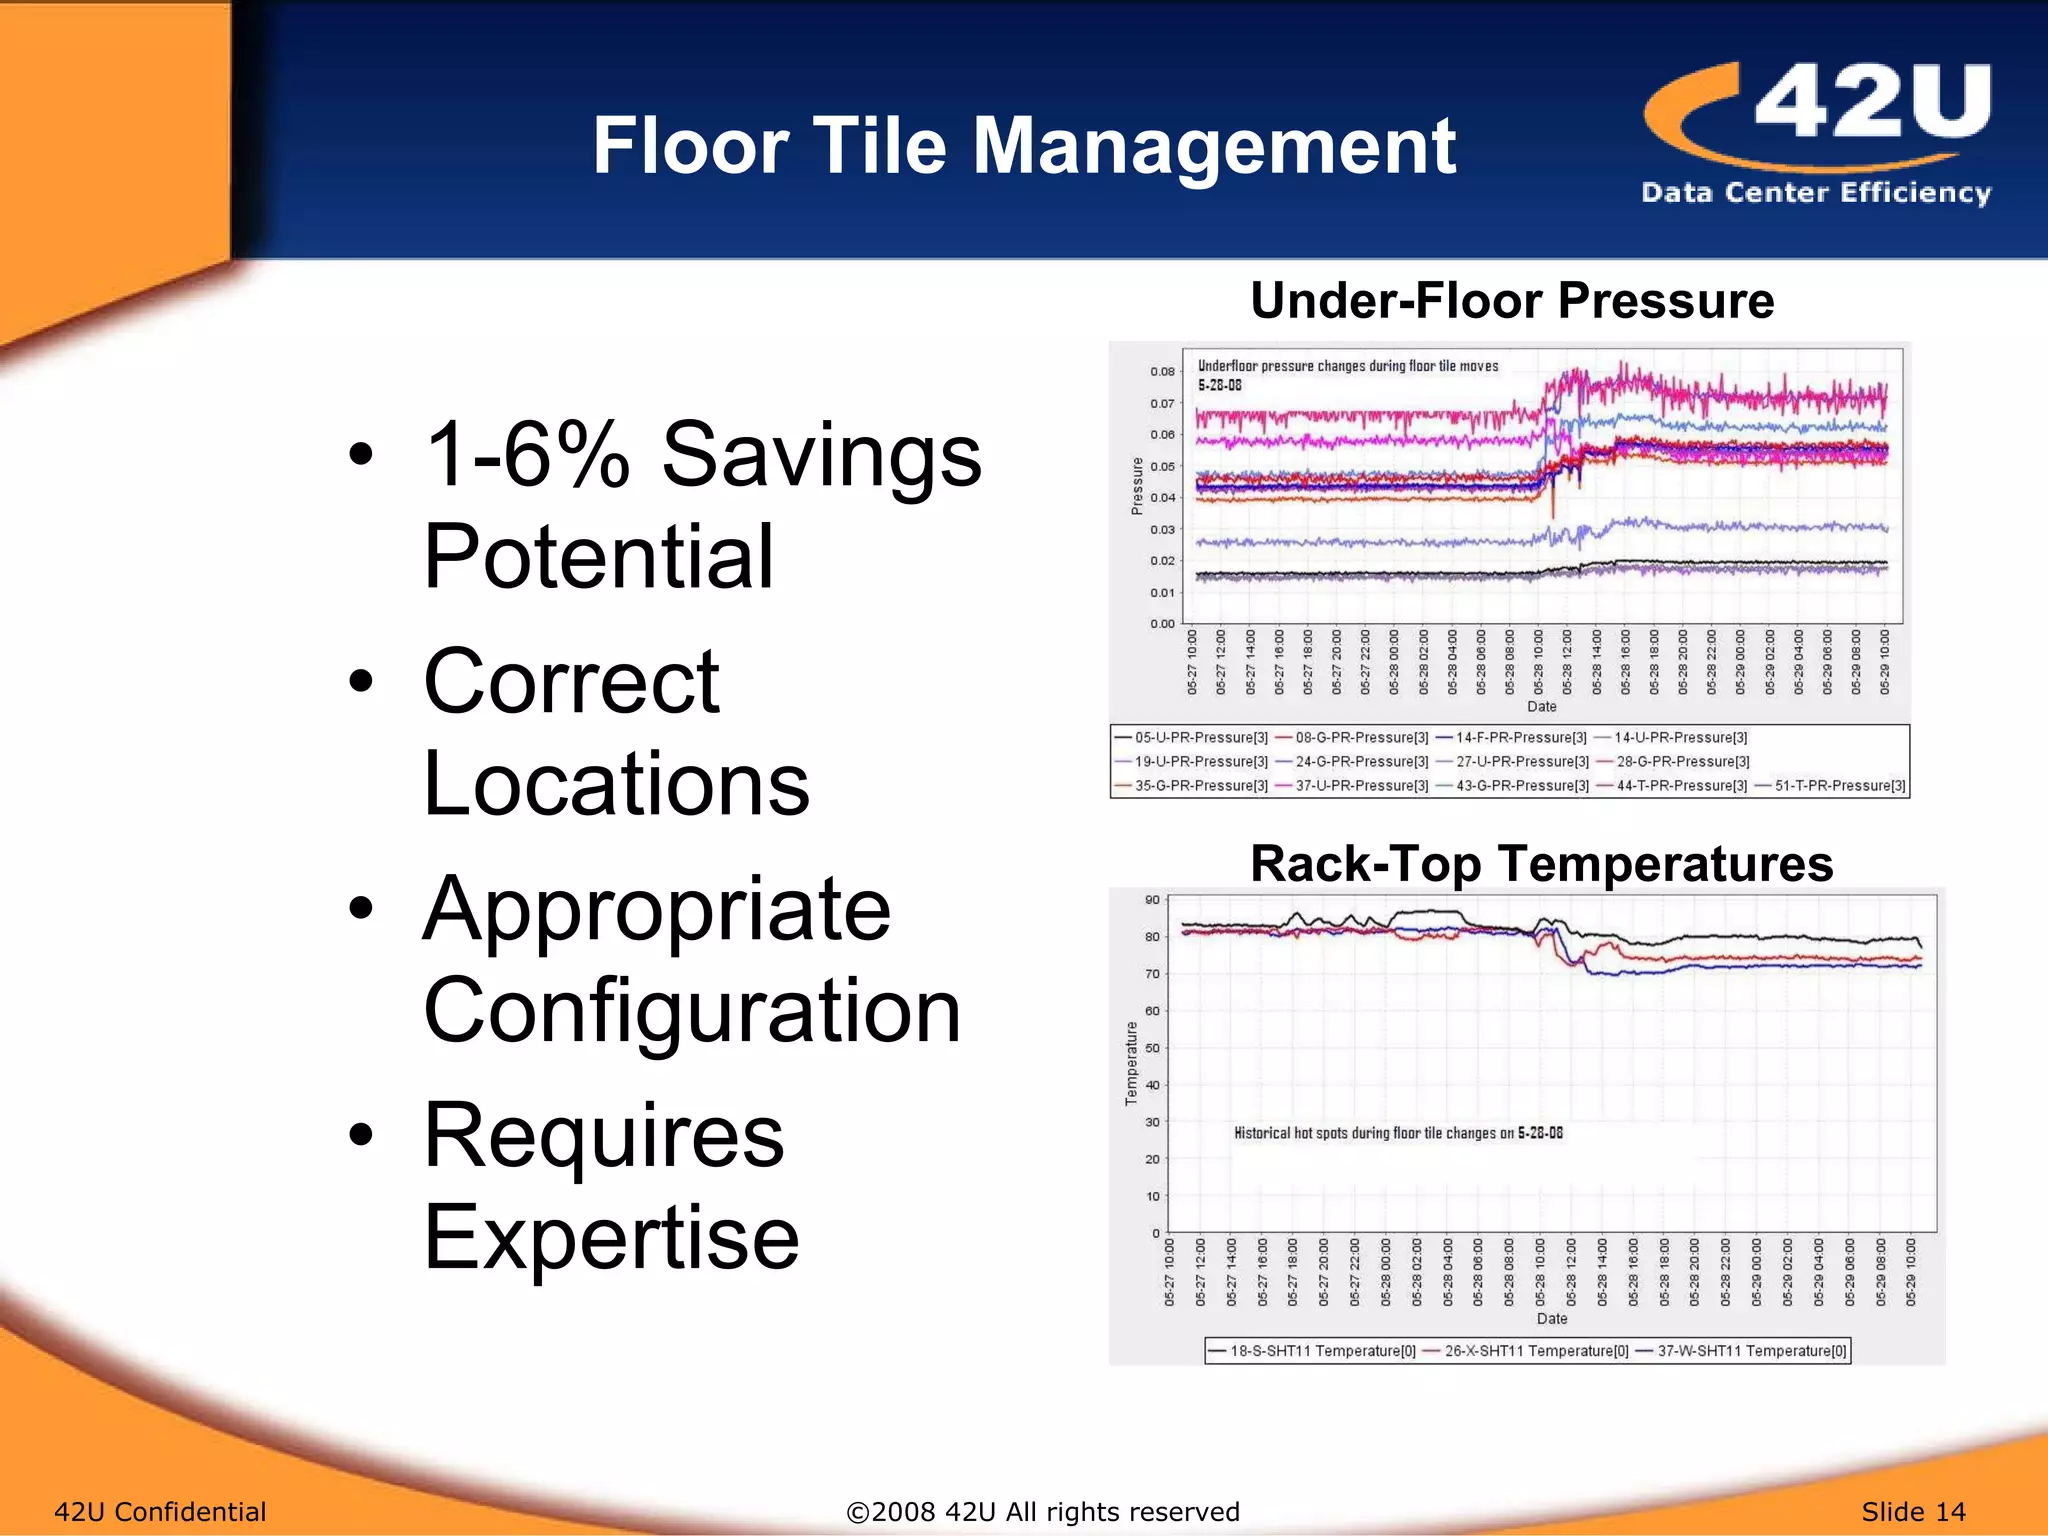
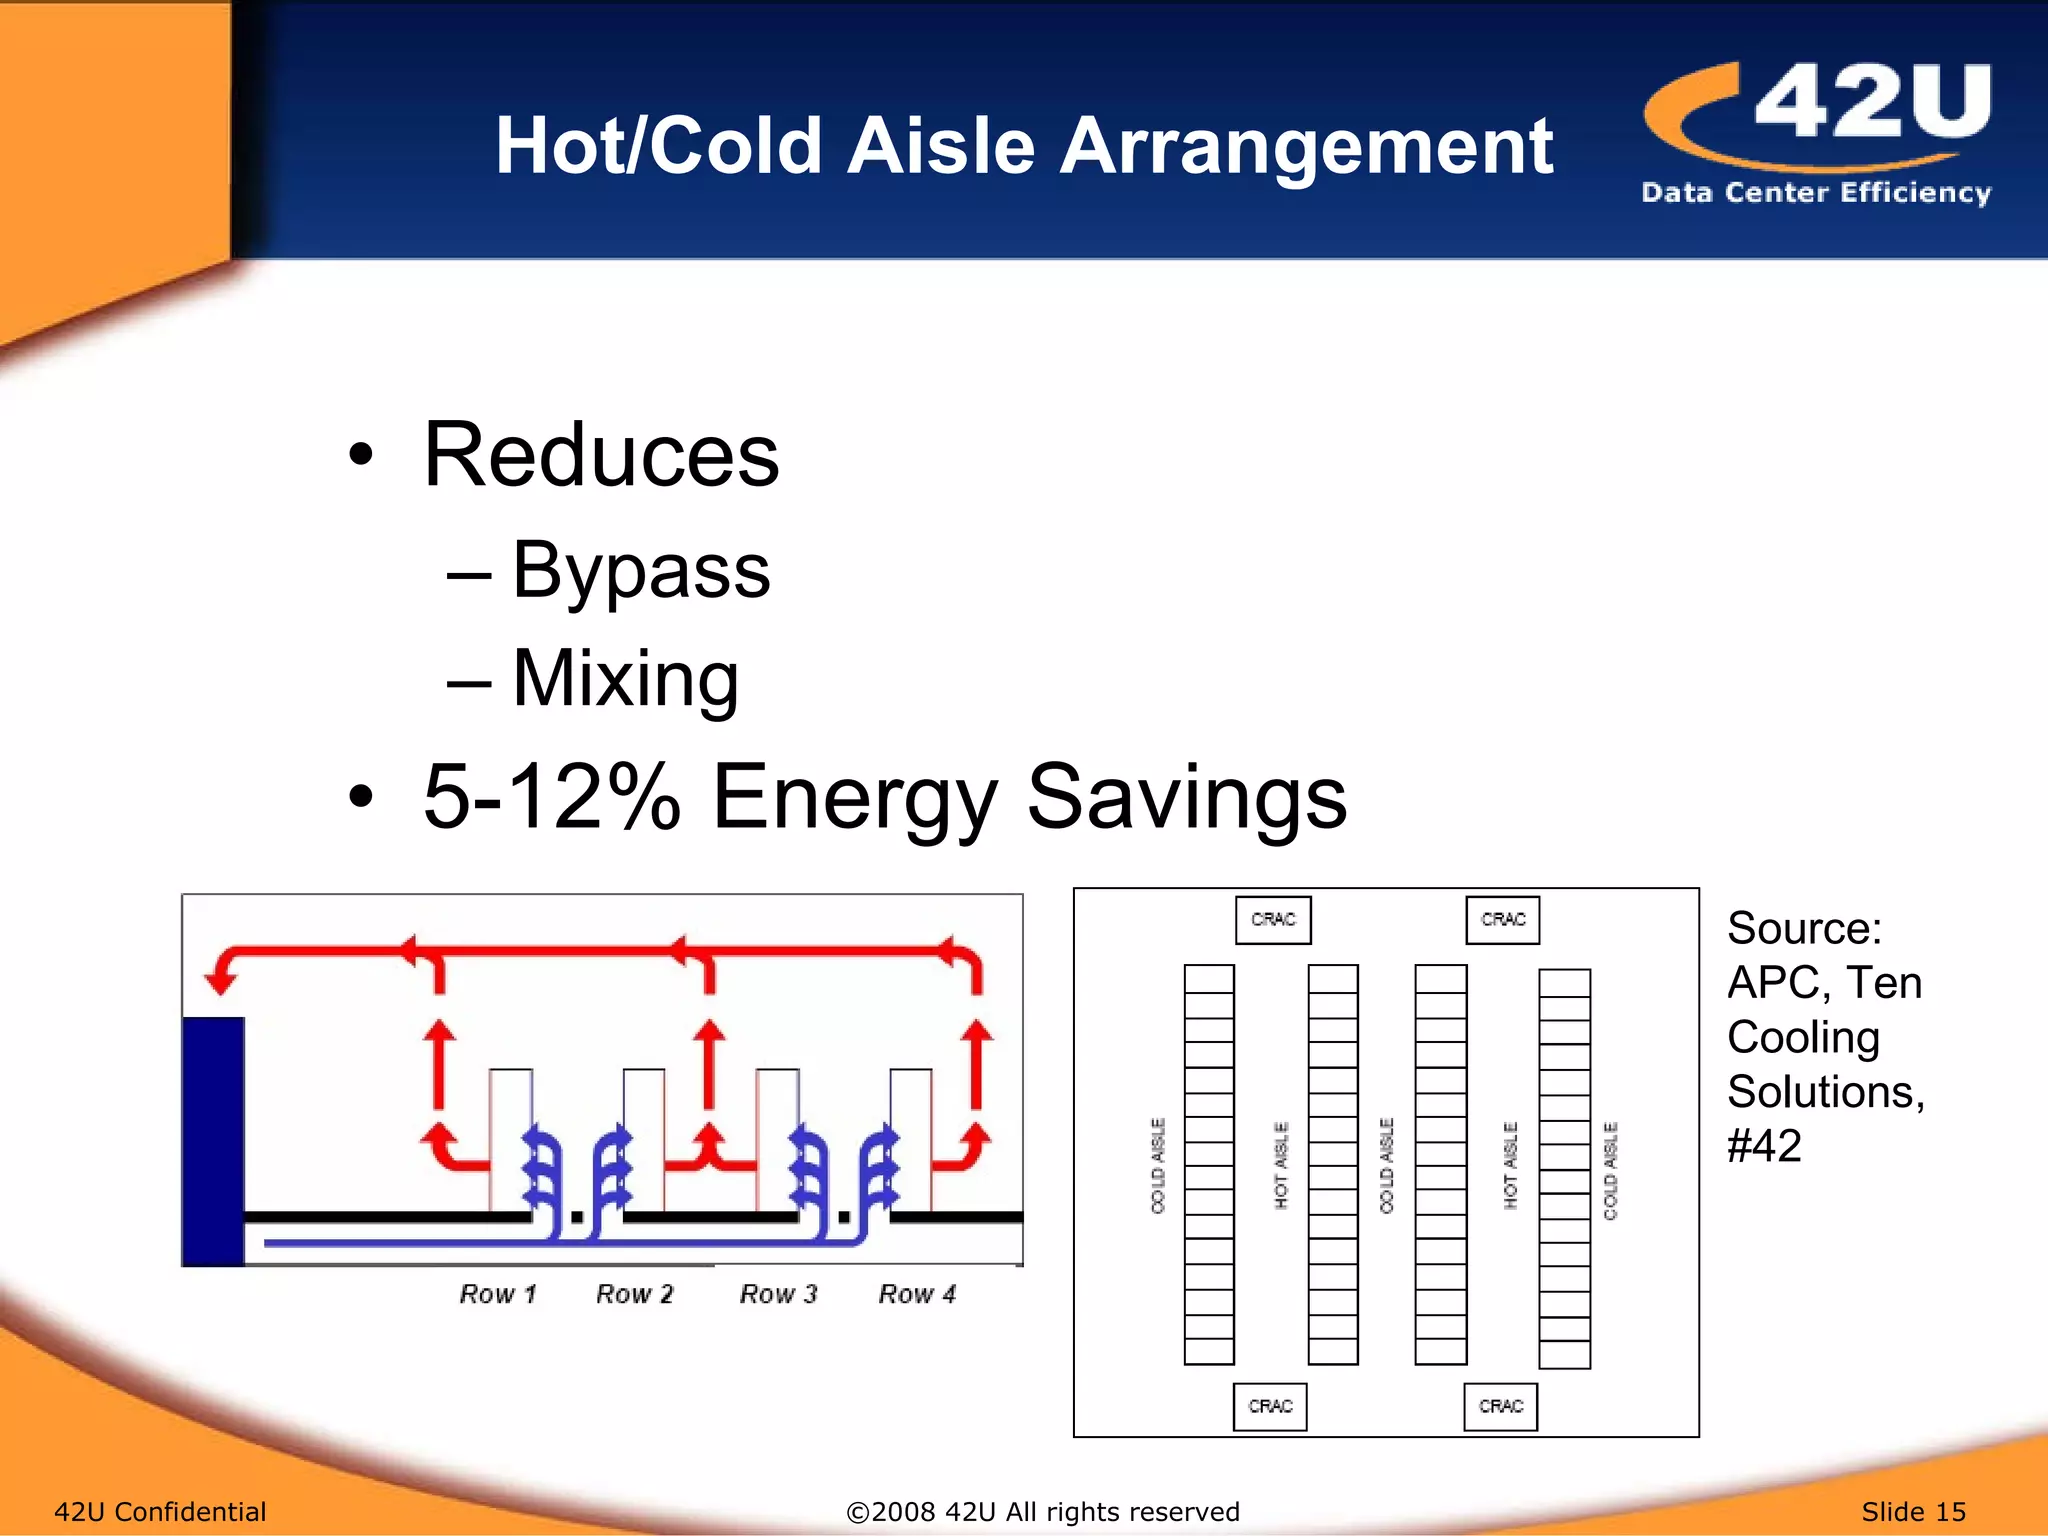
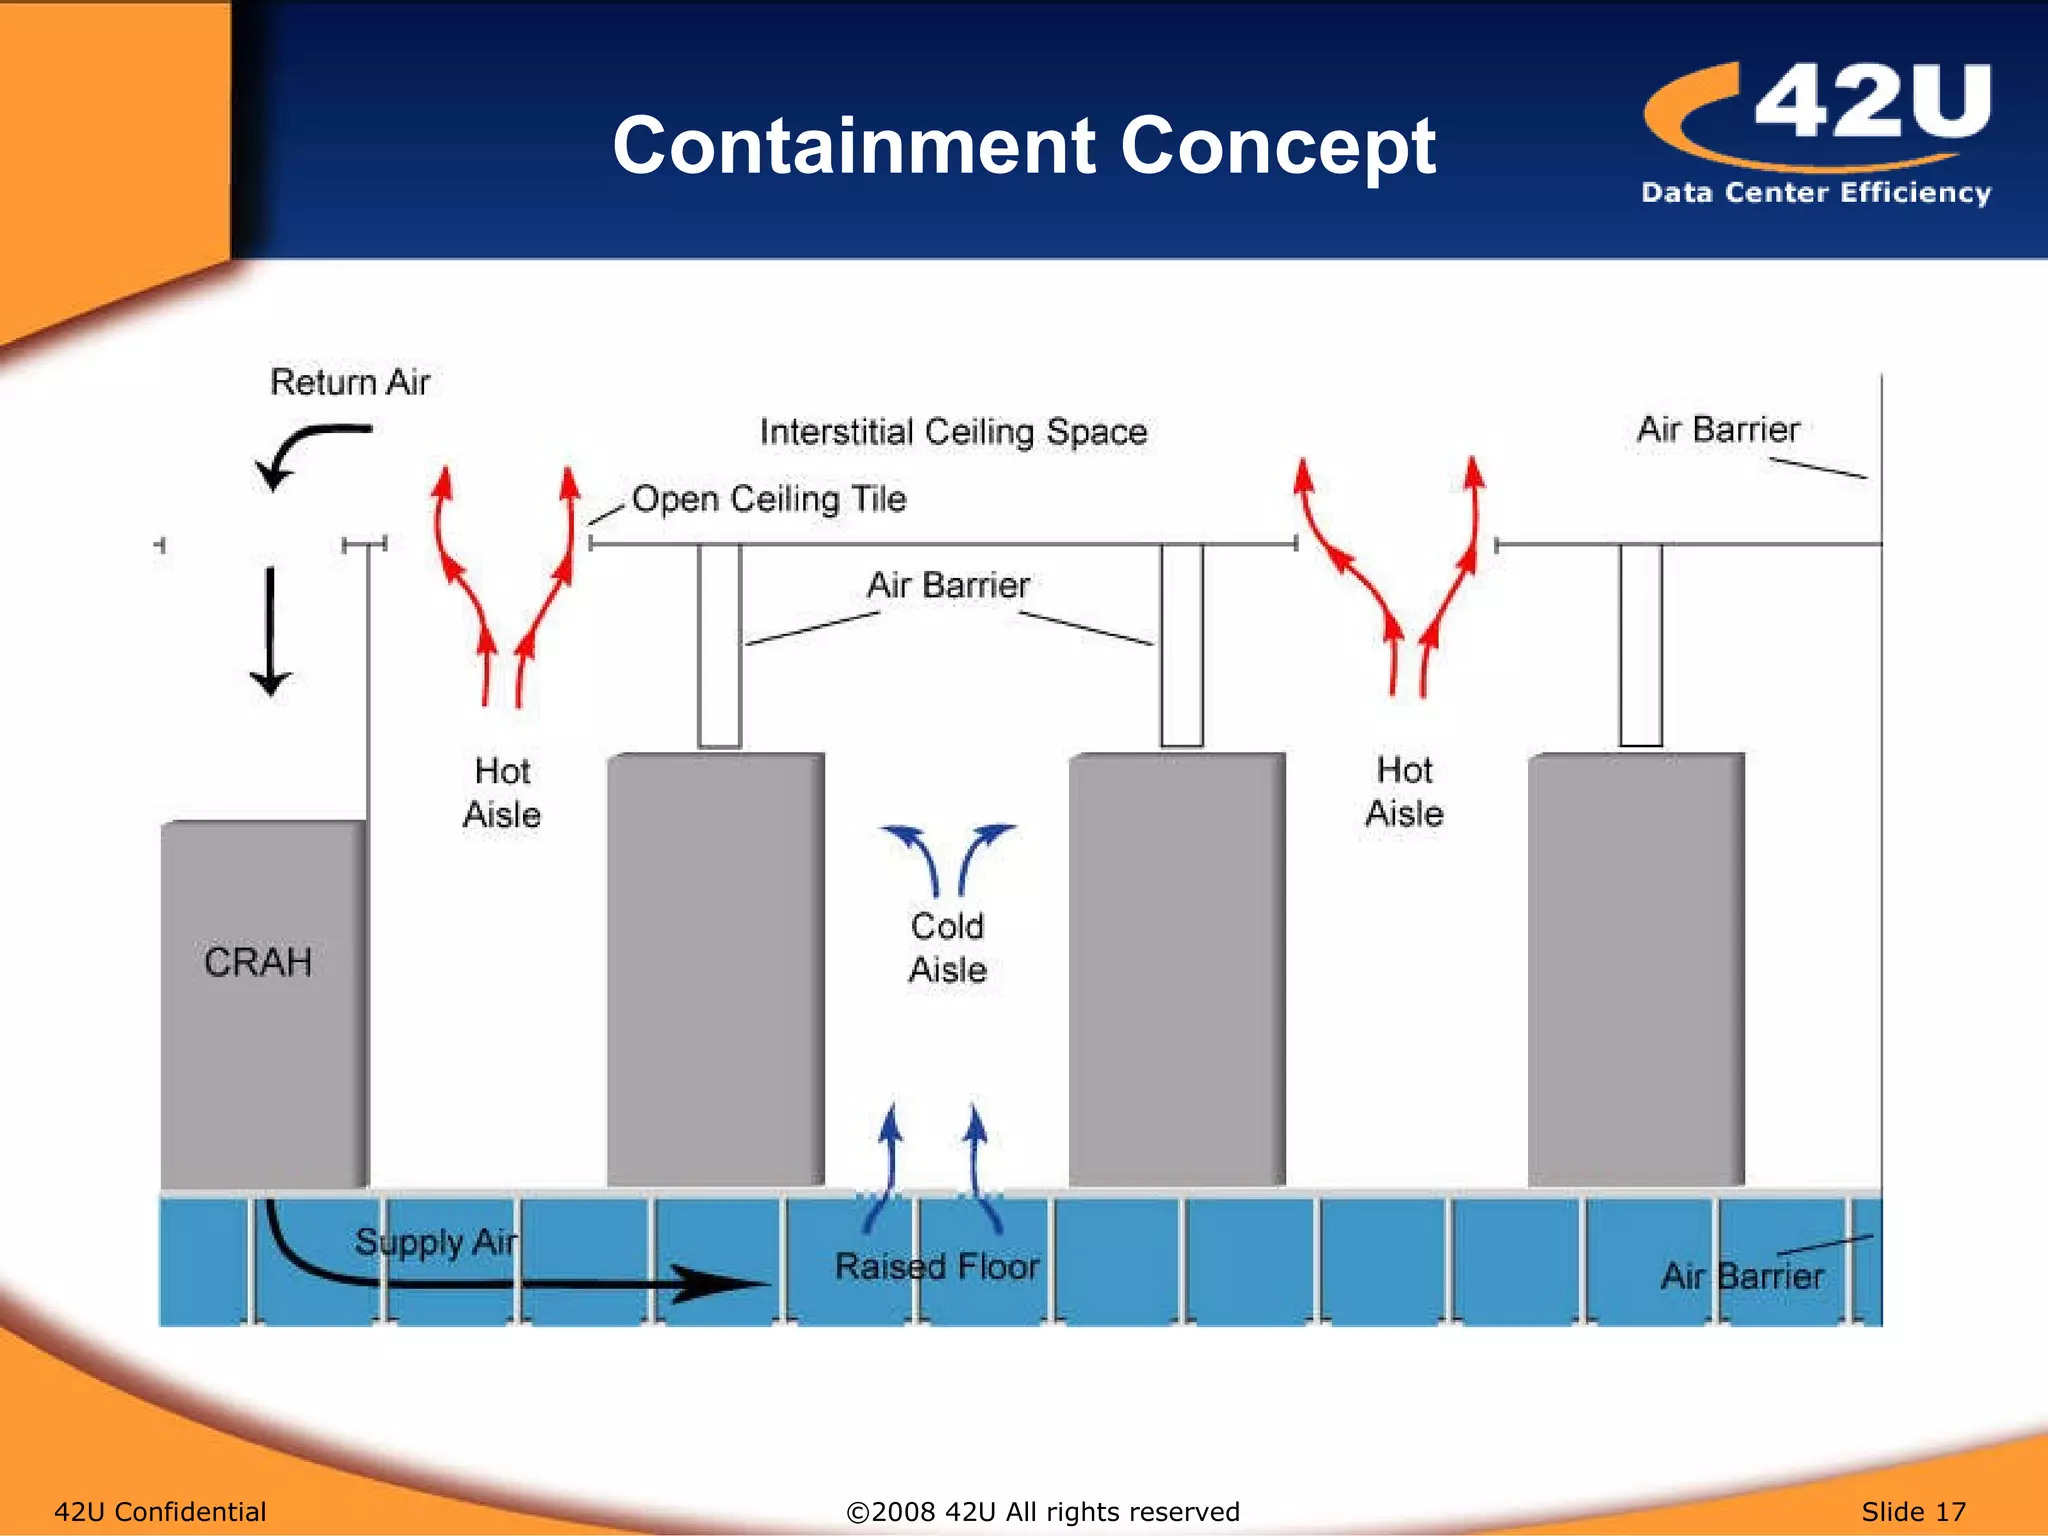
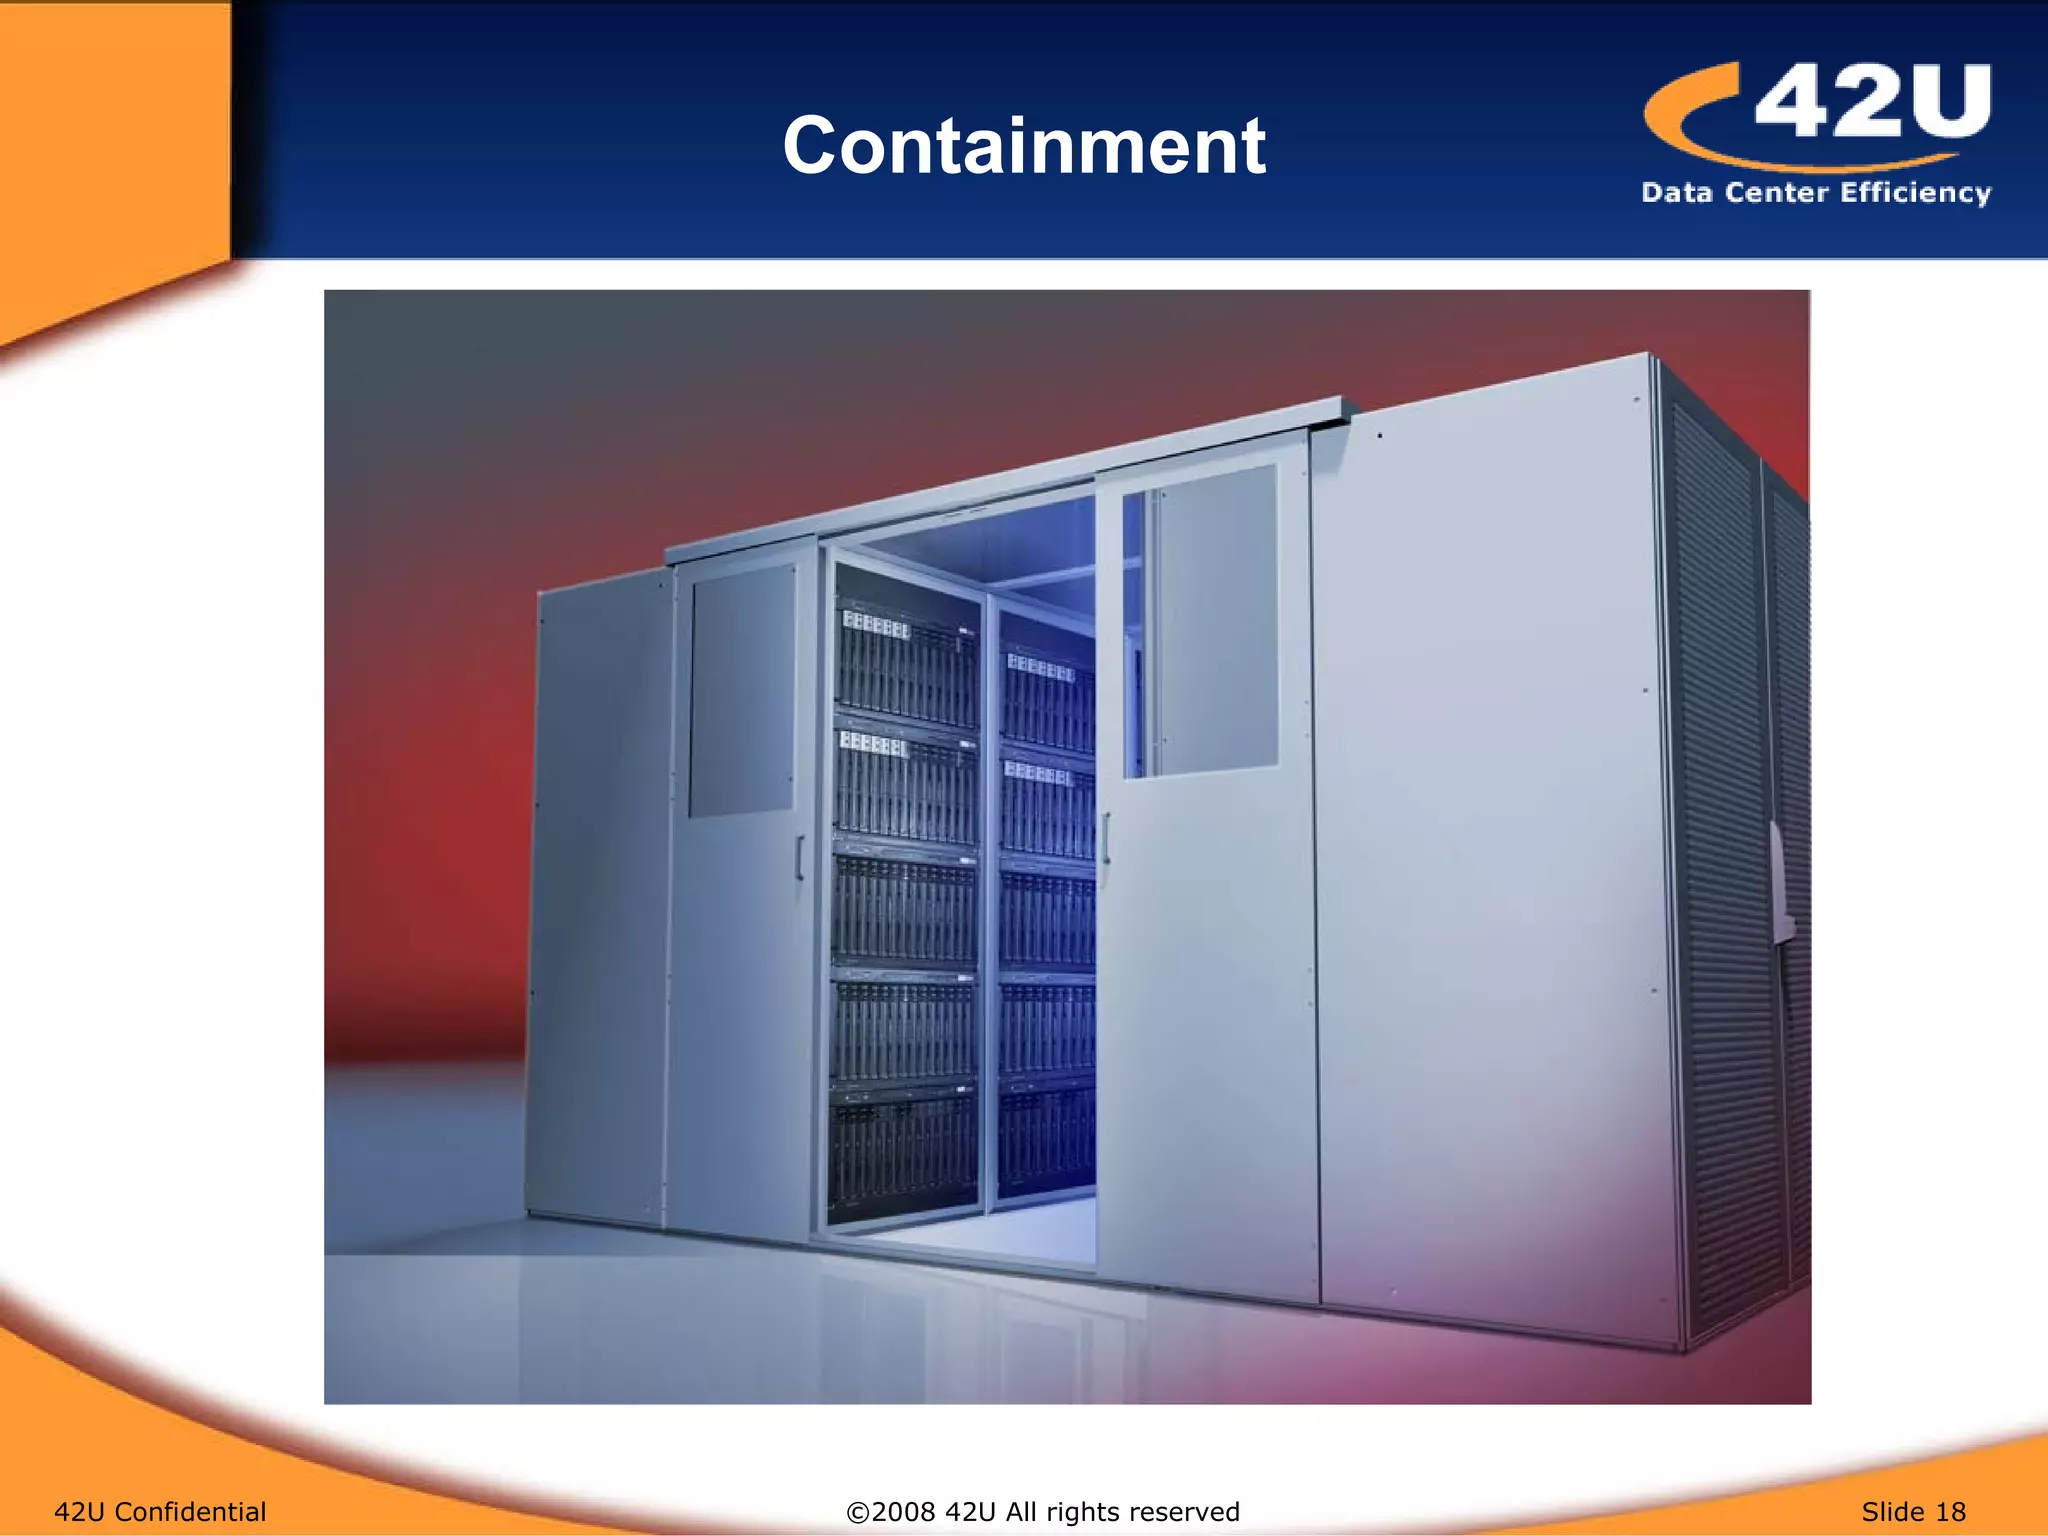
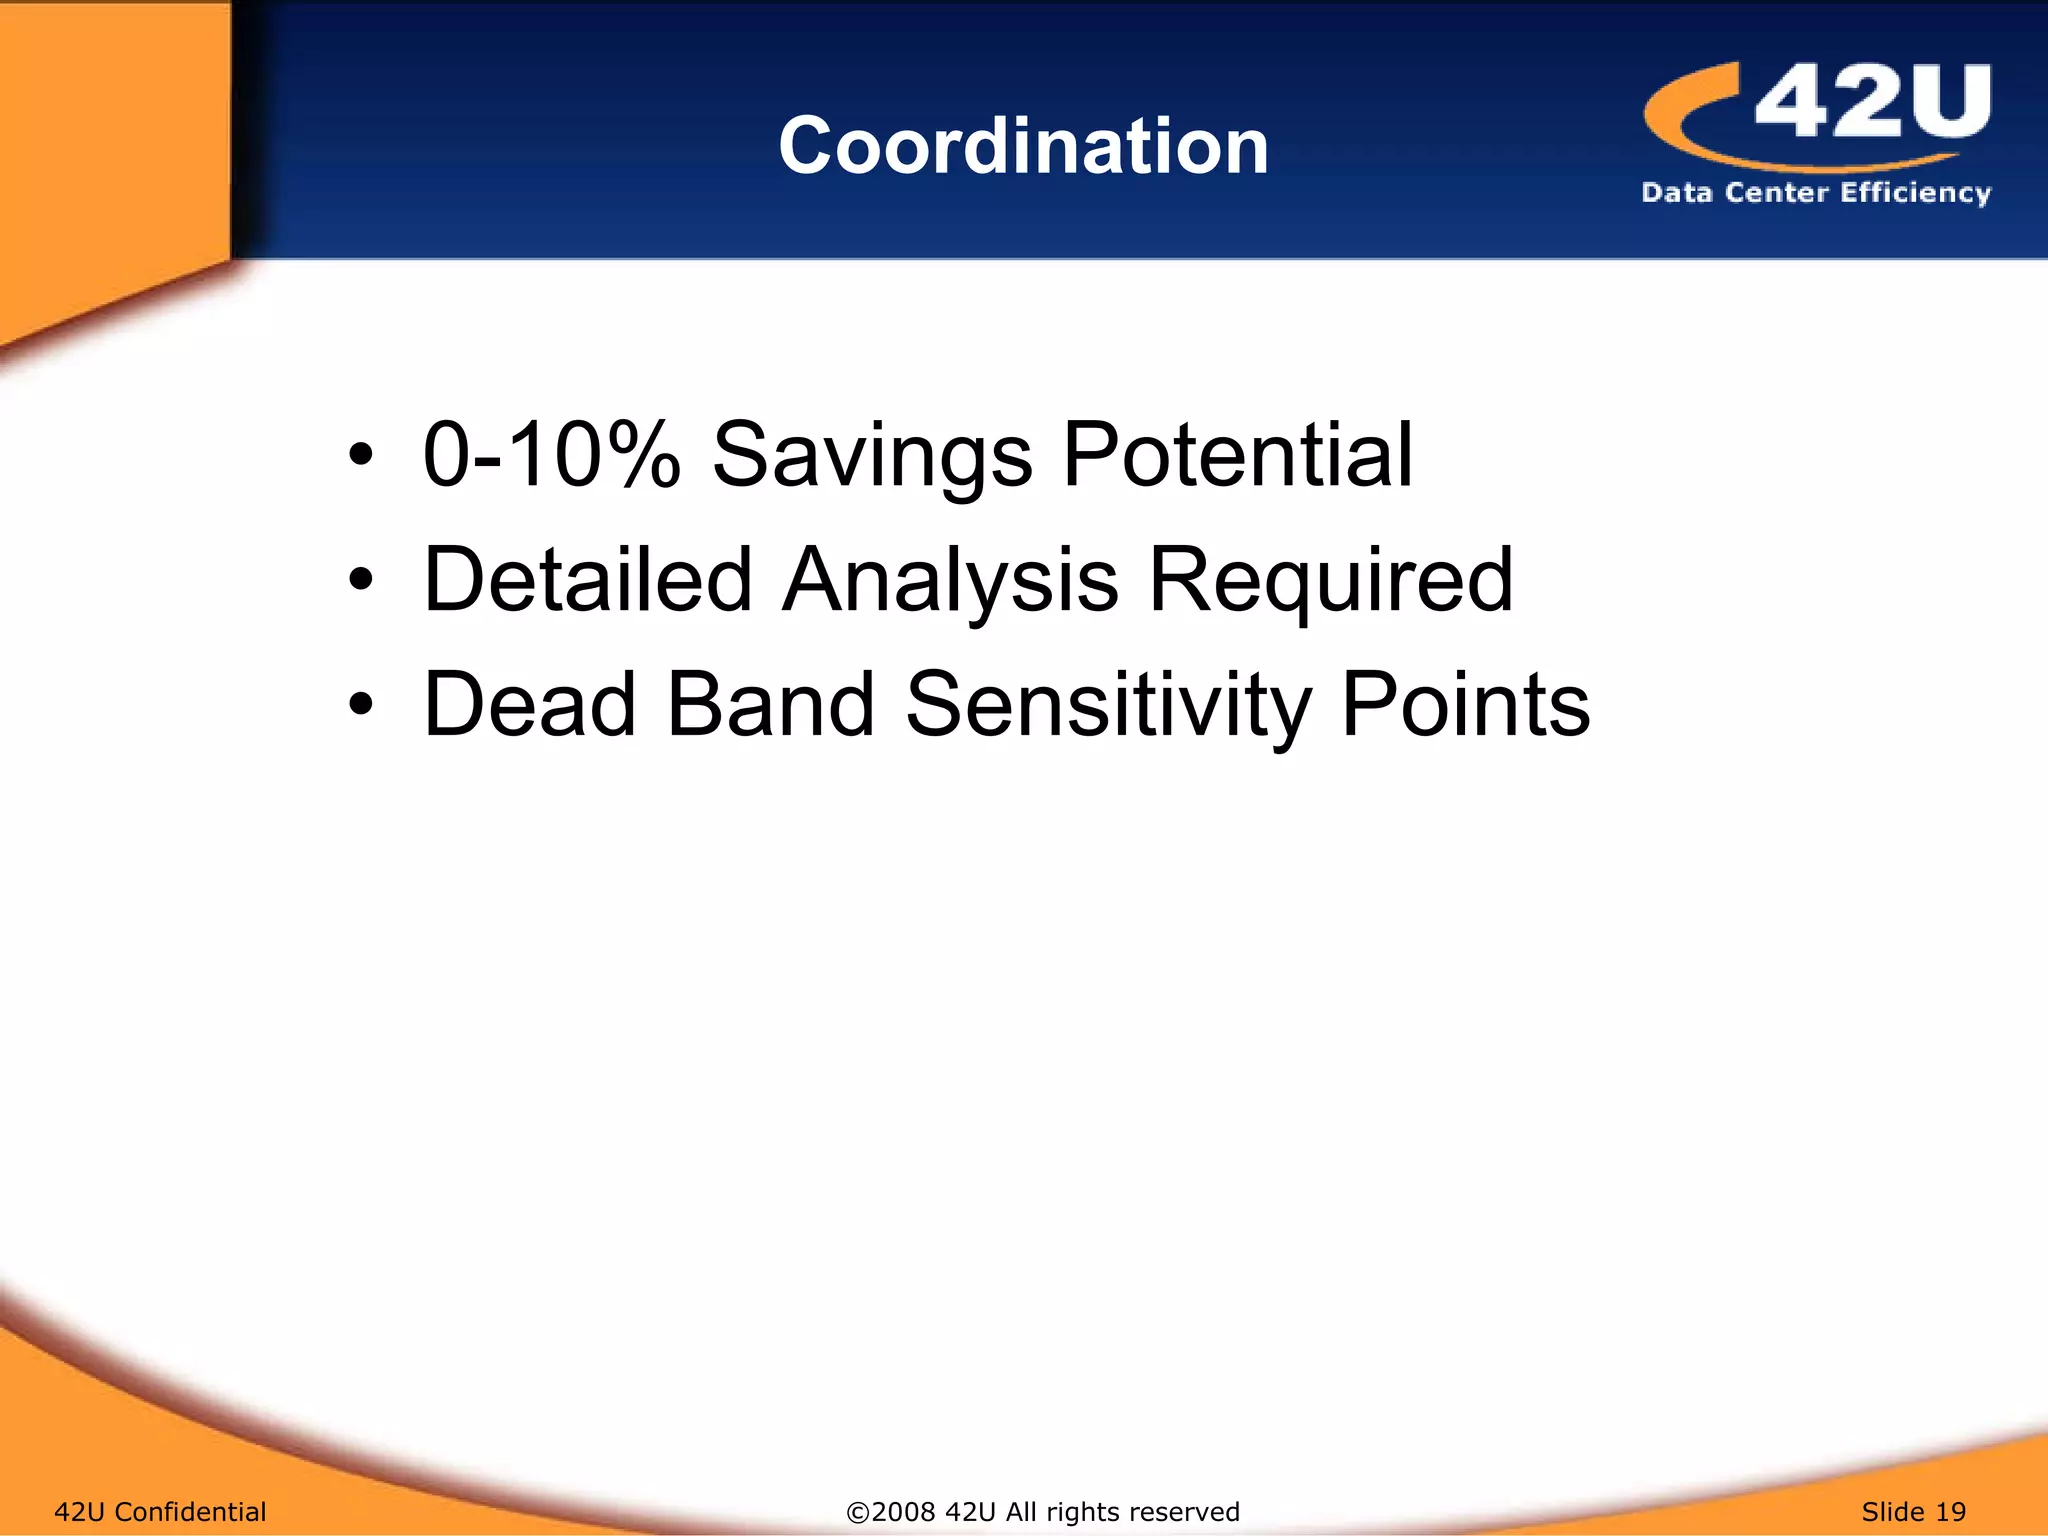
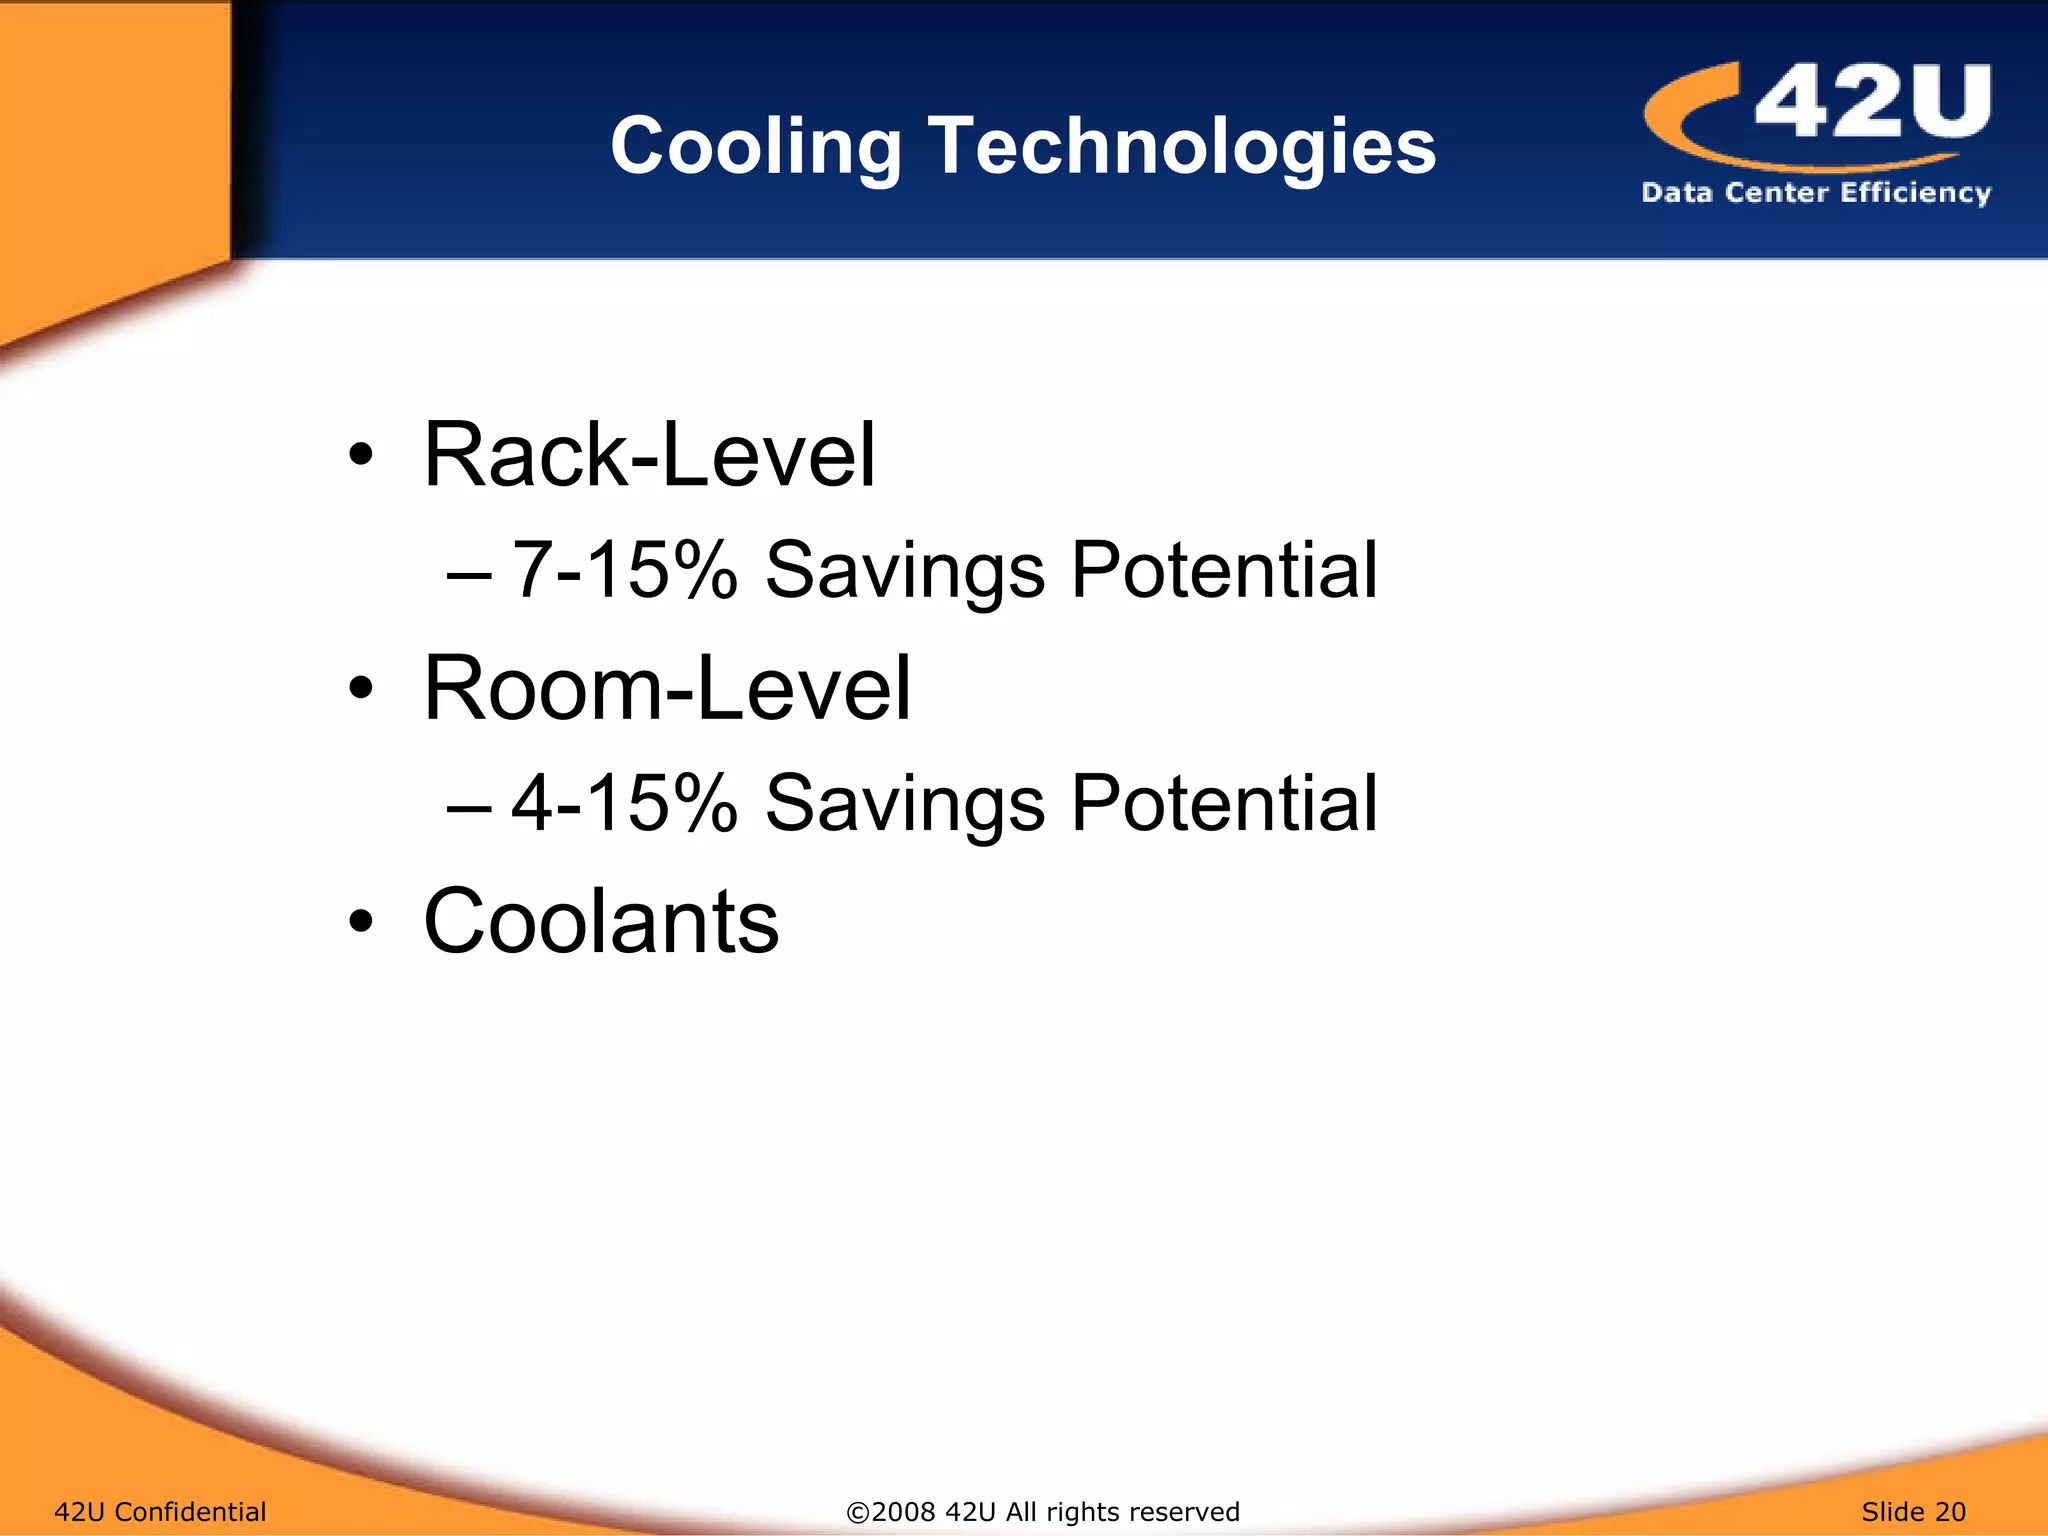
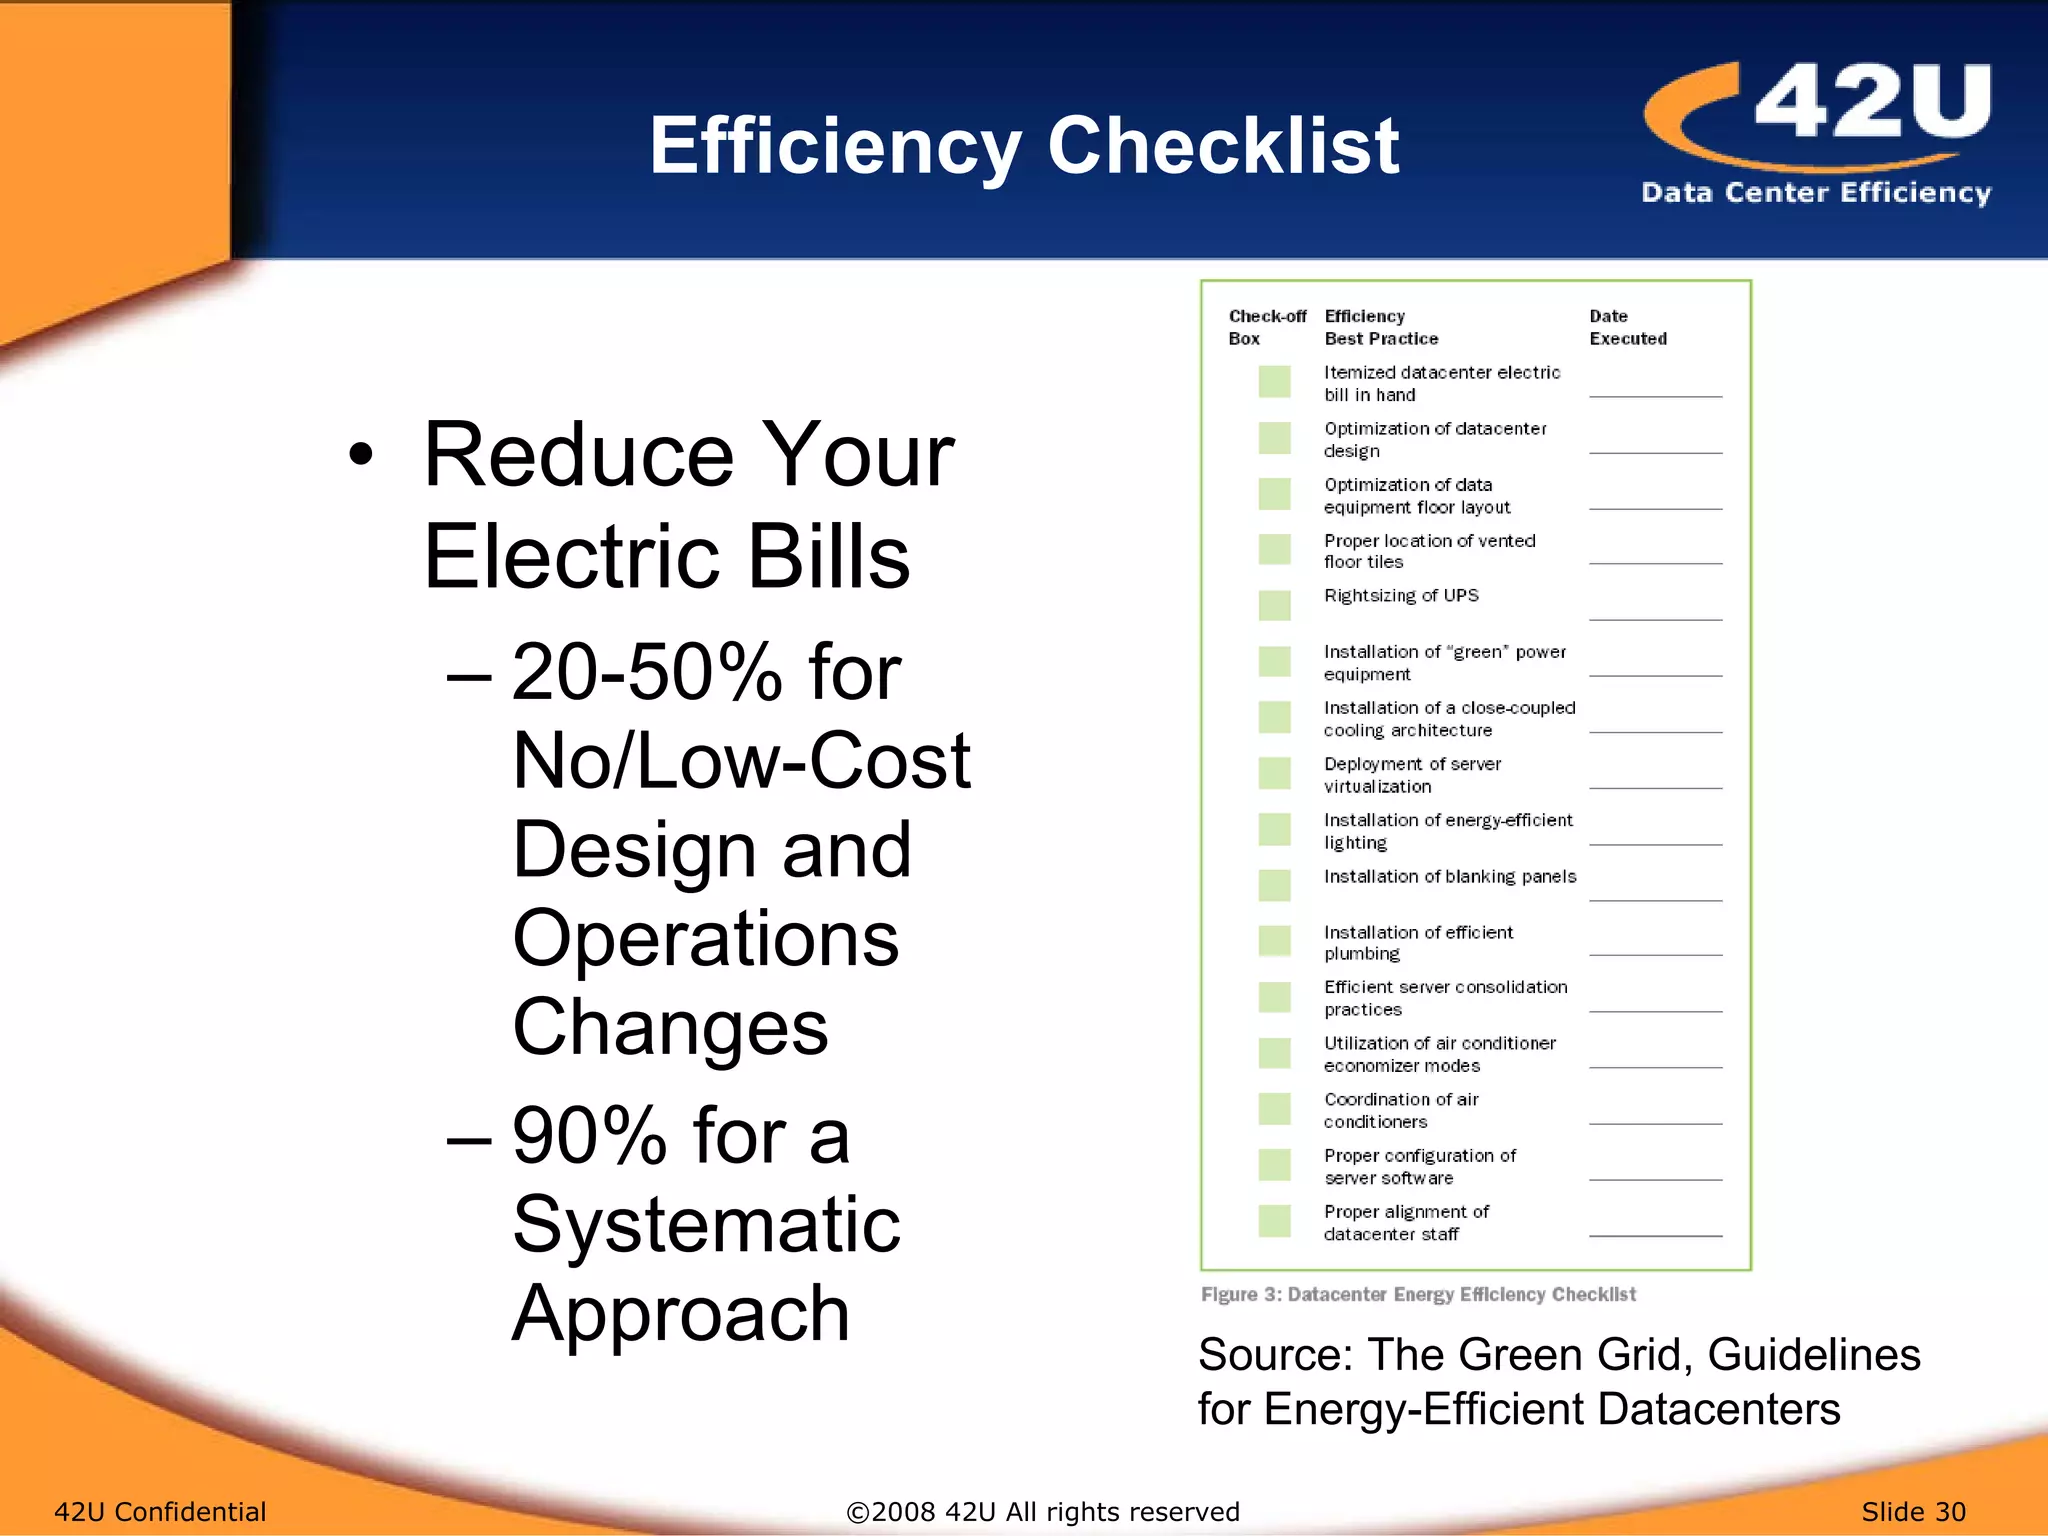
The document discusses best practices for improving energy efficiency in data centers, highlighting strategic approaches and advanced technologies in airflow and power management. It emphasizes potential savings from virtualization and efficient cooling methods, stressing the importance of measurements and systematic design changes. Recommendations also include utilizing energy benchmarks and implementing maintenance strategies to optimize performance.


![Vibe Coding vs. Spec-Driven Development [Free Meetup]](https://cdn.slidesharecdn.com/ss_thumbnails/vibecodingvsspecdrivendevelopment-251209105622-43f455e7-thumbnail.jpg?width=640&height=640&fit=bounds)


