2. Automatic Wave Loads Wave Display Plots and Tables
The Show Wave Plot button allows you to display plots of wave particle
velocities, accelerations and pressures in many different formats. Display
contour plots and horizontal and vertical section cut plots through the wave.
Report wave particle velocities, accelerations and pressures at the mouse
pointer location numerically.
The Show Wave Table button allows you to display a table that shows the
wave particle velocities, accelerations and pressures at points throughout the
wave.
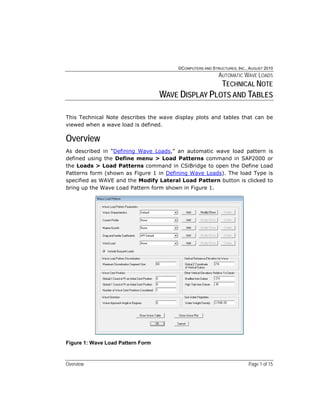
Wave Display Plots
Figure 2 shows the Wave Plot form as it might typically appear when you first
click the Show Wave Plot button on the Wave Load Pattern form or the
Wave Table form.
Figure 2: Wave Plot Form
Wave Display Plots Page 2 of 15
3. Automatic Wave Loads Wave Display Plots and Tables
Note that the title bar of the form identifies the name of the wave
characteristic parameter set and the name of the current profile parameter
set, if any, used to create the wave plot.
The Display Type area of the form can be used to set the type of plot to be
viewed. The choices are as follows:
• Click for Values
• Contours
• Arrows
• Vertical Cut
• Horizontal Cut
Each of these options is described in this Technical Note.
The Z/X Scaling Ratio area of the form allows user control over the scale size
of the plotted wave. When the default option is used, the program scales the
wave plot such that it fills the available plot area. This typically means that
the vertical (Z) and horizontal (X) scales of the plot are different. The
program reports the Z/X ratio so that you can get a sense of the scaling.
If the User scaling option is chosen, input your own Z/X ratio for the plot.
Figure 3 shows the same plot as Figure 2, except in Figure 3, the User scaling
option has set the Z/X ratio to 1 instead of the default 0.2926.
Figure 3: Wave Plot
with User Z/X
Scaling Ratio
Wave Display Plots Page 3 of 15
4. Automatic Wave Loads Wave Display Plots and Tables
The program has internal limits set on the scaling ratio so that the displayed
wave does not get too skinny in one direction. If you input a Z/X ratio that
exceeds the internal limit, the program automatically resets to its limit.
Figure 4: Wave Discretization
Two check boxes are in the bottom right corner of the Wave Plot form.
The first check box is labeled Show Wave Discretization. When this check box
is checked, the wave plot appears as shown in Figure 4. A white grid is
superimposed over the wave showing the wave discretization. Exact values of
water particle velocities and accelerations, and pressure are calculated at
each grid intersection and at the intersection of the vertical grid lines with the
wave surface. Intermediate values are interpolated from the calculated
values.
Wave Display Plots Page 4 of 15
5. Automatic Wave Loads Wave Display Plots and Tables
The second check box is labeled Show Values at Pointer. This feature allows
you to move the mouse pointer over the wave and see values of various
items, as shown in Figure 5. The items shown vary depending on the display
type.
Figure 5: Show Values at Pointer
Other buttons are available in the lower right corner of the Wave Plot form.
The Modify/Show Wave button brings up the Wave Characteristics form.
Use this button to modify the wave characteristics and then immediately see
the effect on the wave plot.
The Show Wave Table button brings up the wave table, which is the same
wave table as the one accessed from the Wave Load Pattern form. The wave
table is described later in this Technical Note.
Wave Display Plots Page 5 of 15
6. Automatic Wave Loads Wave Display Plots and Tables
The Refresh View button refreshes the wave plot view and the Done button
closes the Wave Plot form.
The following subsections describe each of the options available in the Display
Type area of the Wave Plot form.
Figure 6: Click for Values Display Type
Click for Values Display Type
When the display type option is set to Click for Values, a left click any where
on the wave will display a yellow square with its center located at clicked
point. In addition, the “Values at Yellow Square” area appears on the right
side of the form, as shown in Figure 6. The following values are reported for
the clicked point (i.e., center of the yellow square) in this area:
Wave Display Plots Page 6 of 15
7. Automatic Wave Loads Wave Display Plots and Tables
• xwave: The X coordinate of the point in the wave coordinate system.
The positive X axis of the wave coordinate system is horizontal in the
direction that the wave is traveling.
• zwave: The Z coordinate of the point in the wave coordinate system.
The positive Z axis of the wave coordinate system is in the same
direction as the positive global Z axis. The Z axis of the wave
coordinate system is referenced from the specified vertical datum.
• vxwave: The horizontal velocity of the wave (not including the
current) in the direction that the wave is traveling.
• vxcurrent: The horizontal velocity of the component of the current in
the direction that the wave is traveling.
• vxtotal: The combined horizontal velocity of the wave and the current
in the direction that the wave is traveling.
• vzwave: The vertical velocity of the wave.
• axwave: The horizontal acceleration of the wave in the direction that
the wave is traveling.
• azwave: The vertical acceleration of the wave.
• pressure: The pressure at the specified point.
Edit the xwave and zwave coordinates in the Values at Yellow Square area to
view the values at an exact location. To modify one of these coordinates, type
in the coordinate value and press the Enter key on your keyboard. The
velocity, acceleration and pressure values in the Values at Yellow Square area
immediately change and the yellow square itself will be moved to the
specified location.
Contours Display Type
When the display type option is set to Contours, the display appears as
contours and the “Display This Item” area appears on the right side of the
form, as shown in Figure 7. The following options are available in the Display
This Item area:
Wave Display Plots Page 7 of 15
8. Automatic Wave Loads Wave Display Plots and Tables
• Horiz Wave Velocity: The horizontal velocity of the wave (not
including the current) in the direction that the wave is traveling.
• Horiz Current Velocity: The horizontal velocity of the component of
the current in the direction that the wave is traveling.
• Horiz Total Velocity: The combined horizontal velocity of the wave
and the current in the direction that the wave is traveling.
Figure 7: Contours Display Type
• Horiz Wave Accel: The horizontal acceleration of the wave in the
direction that the wave is traveling.
• Vertical Wave Velocity: The vertical velocity of the wave.
• Vertical Wave Accel: The vertical acceleration of the wave.
Wave Display Plots Page 8 of 15
9. Automatic Wave Loads Wave Display Plots and Tables
• Pressure: The pressure at the specified point.
The legend for the contours is displayed at the bottom of the form, along with
the maximum and minimum values for the displayed item.
Figure 8: Arrows Display Type
Arrows Display Type
When the display type option is set to Arrows, the display appears as
contours with arrows superimposed on them and the “Display This Item” area
appears on the right side of the form, as shown in Figure 8. The following
options are available in the Display This Item area:
• Resultant Velocity w/o Current: The vector sum of the horizontal
and vertical wave velocity not including the current.
Wave Display Plots Page 9 of 15
10. Automatic Wave Loads Wave Display Plots and Tables
• Resultant Velocity w/ Current: The vector sum of the horizontal
and vertical wave velocity including the contribution of the current.
• Resultant Acceleration: The vector sum of the horizontal and
vertical wave acceleration.
The contours indicate the magnitude of the resultant velocity or acceleration.
The contour legend is displayed at the bottom of the form along with the
maximum and minimum values for the displayed item.
The arrows serve the dual purpose of indicating the direction and the
magnitude of the resultant velocity or acceleration. The lengths of the various
arrows are proportional to the resultant magnitude at that location.
When the display type option is set to Arrows, the “Show Arrows at Actual
Angle” check box appears in the Z/X Scaling Ratio area. When this check box
is unchecked, the arrow direction is shown consistent with current Z/X scaling
ratio. Unless the ratio is one, this will not be the true direction of the
resultant. When the Show Arrows at Actual Angle check box is checked, the
arrows are displayed in their true direction.
Suppose, for example, that at some location in the wave the true direction of
the resultant is 30 degrees from horizontal. When the Show Arrows at Actual
Angle check box is checked, the arrow at that location will graphically appear
at 30 degrees from horizontal. If the check box is not checked, the arrow will
graphically appear at some angle that is consistent with the current Z/X
scaling ratio.
Vertical Cut Display Type
When the display type option is set to Vertical Cut, a vertical section cut
appears through the wave and the Display This Item area appears on the
right side of the form, as shown in Figure 9. The options in the Display This
Item area are the same as those described for the Contours display type.
Use the horizontal scroll bar that appears at the bottom of the form for this
display type to drag the vertical section cut to different horizontal positions
across the wave. Alternatively, left click on the wave and drag your mouse
horizontally while still holding down the left mouse button to reposition the
section cut left or right.
Wave Display Plots Page 10 of 15
11. Automatic Wave Loads Wave Display Plots and Tables
Figure 9: Vertical Cut Display Type
Horizontal Cut Display Type
When the display type option is set to Horizontal Cut, a horizontal section cut
appears across the wave and the “Display This Item” area appears on the
right side of the form, as shown in Figure 10. The options in the Display This
Item area are the same as those described for the Contours display type.
Use the vertical scroll bar that appears to the right of the wave for this display
type to drag the horizontal section cut to different vertical positions on the
wave. Alternatively, left click on the wave and drag your mouse vertically
while still holding down the left mouse button to reposition the section cut up
or down.
Wave Display Plots Page 11 of 15
12. Automatic Wave Loads Wave Display Plots and Tables
Figure 10: Horizontal Cut Display Type
Wave Display Table
Figure 11 shows the Wave Data Table form as it might typically appear when
the Show Wave Table button is clicked initially on the Wave Load form or
the Wave Plot form. The data shown in the Wave Data Table form is not
editable. It is only for display.
The following fields are shown in the display table:
• Horiz Loc: The X coordinate of the point in the wave coordinate
system. The positive X axis of the wave coordinate system is
horizontal in the direction that the wave is traveling.
Wave Display Table Page 12 of 15
13. Automatic Wave Loads Wave Display Plots and Tables
Figure 11: Wave Data Table Form
• Vrt from Datum: The Z coordinate of the point in the wave
coordinate system. The positive Z axis of the wave coordinate system
is in the same direction as the positive global Z axis. The Z axis of the
wave coordinate system is referenced from the specified vertical
datum.
• Horiz Wave Vel: The horizontal velocity of the wave (not including
the current) in the direction that the wave is traveling.
• Horiz Current Vel: The horizontal velocity of the component of the
current in the direction that the wave is traveling.
• Horiz Total Vel: The combined horizontal velocity of the wave and the
current in the direction that the wave is traveling.
Wave Display Table Page 13 of 15
14. Automatic Wave Loads Wave Display Plots and Tables
• Horiz Wave Acc: The horizontal acceleration of the wave in the
direction that the wave is traveling.
Figure 12: Wave Data Table Form Showing Data for Horizontal Grid at 123.3543
• Vert Wave Vel: The vertical velocity of the wave.
• Vert Wave Acc: The vertical acceleration of the wave.
• Pressure: The pressure at the specified point.
Note that you can position the mouse pointer in the field name row and drag
the columns in the table to different widths if desired.
The Display Options area of the form allows you to display subsets of the data
at specified vertical or horizontal grid locations. For example, Figure 12 shows
data for the horizontal grid at 123.3543.
Wave Display Table Page 14 of 15
15. Automatic Wave Loads Wave Display Plots and Tables
Note that the first row in the table in Figure 12 shows a Vrt from Datum value
of 11.4805. This is the wave surface elevation at the 123.3543 horizontal
location. In the Wave Data Table form the top value displayed for each
horizontal coordinate is the wave surface elevation for that horizontal
coordinate.
Wave Display Table Page 15 of 15