More Related Content
Similar to 2059 2012 04_16_c_tw
Similar to 2059 2012 04_16_c_tw (20)
2059 2012 04_16_c_tw
- 1. f
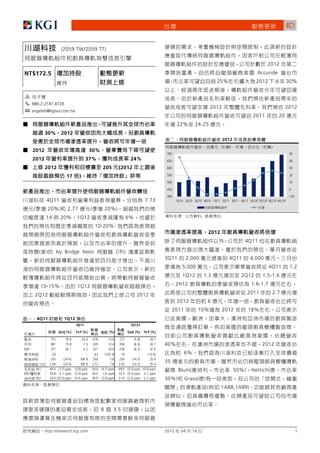
(2059.TW/2059 TT)
2012
NT$172.5 Accuride
25% 2012 30%
1
2 886.2.2181.8726
2012 2012
3 angelah@kgisia.com.tw
2011 20
22% 24-25
30% 2012
2012
( ) ( )
2012 30%
700 50
2012 37% 24% 650 40
2012 205 (2012 600 30
17 ) 550 20
500 10
450 0
400 (10)
4Q11 7.73 1Q10 2Q10 3Q10 4Q10 1Q11 2Q11 3Q11 4Q11 1Q12F 2Q12F 3Q12F 4Q12F
( 20%) 2.77 ( 20%)
14 20% 1Q12 6% : ;
10-20%
2012
4Q11
( ) Ivy Bridge Xeon CPU
3Q11 2,000 4Q11 4,000
5,000 4Q11 1.2
1Q12 1.3 2Q12 1.5-1.6
10-15% 1Q12 2H12 1.6-1.7
2Q12 2012 2011 2.7
2012 6
2011 10% 2012 18%
4Q11 1Q12
4Q11 1Q12F
QoQ (%) YoY (%) (%) QoQ (%) YoY (%)
773 19.9 20.0 678 13.9 727 (5.8) 24.7
381 15.8 7.3 339 12.4 356 (6.5) 24.7 40% 2012
EBIT 277 20.1 4.2 231 20.0 258 (6.7) 37.0
(2) - - 63 (103.3) 19 - (13.4) 6%
270 (24.4) 108.9 250 7.8 230 (14.7) 25.4
( ) 2.94 (24.4) 108.9 2.72 7.8 2.50 (14.7) 25.4
35
(%) 49.3 (1.7) ppts (5.9) ppts 50.0 (0.7) ppts 49.0 (0.3) ppts (0.0) ppts Blum( 50%) Hettich(
EBIT 35.8 0.1 ppts (5.5) ppts 34.0 1.8 ppts 35.5 (0.3) ppts 3.2 ppts
(%) 34.9 (20.5) ppts 14.9 ppts 36.9 (2.0) ppts 31.6 (3.3) ppts 0.2 ppts 30%) Grass( )
( 1A88,1A89)
8 3.5
http://research.kgi.com 2012 04 16 1
- 2. f
2012
2012 10.5% 12.05
( ) ( )
200 20
2012-13
2012-13 30% 20%
150 15
24% 21%
100 10
50 5 2011-2012
2011 2012F
0 0 (%) (%)
1Q10 2Q10 3Q10 4Q10 1Q11 2Q11 3Q11 4Q11 1Q12F 2Q12F 3Q12F 4Q12F
2,523 2,617 3.7 3,138 3,395 8.2
EBIT 831 877 5.6 1,134 1,262 11.3
1,059 1,040 (1.8) 1,211 1,339 10.6
: ; 879 898 2.2 1,005 1,111 10.6
( ) 9.54 9.75 2.2 10.91 12.05 10.5
(%) 49.0 48.9 (0.2) ppts 49.9 50.1 0.2 ppts
2012 (%) 32.9 33.5 0.6 ppts 36.1 37.2 1.1 ppts
(%) 34.8 34.3 (0.5) ppts 32.0 32.7 0.7 ppts
2012 30%
2H11 14-15% 2012 12.5%
4Q11 13.5%
10.5%
12.5-13.5%
2012 163 ( 2012
2012 15 ) 205 ( 2012
17 )
( ( )
18
38.2
41.3
38.5
8-23
35.8 35.5 36.9 37.4
17 35.8
37.0
16 33.2
32.3
15 29.4
14
12 31 EBITDA
13 ( ) ( ) ( ) ( ) ( ) ( )
12 2010A 2,551 1,327 953 1,060 704 7.66
11 2011A 2,617 1,280 877 1,008 898 9.75
10 2012F 3,395 1,700 1,262 1,400 1,111 12.05
1Q10 2Q10 3Q10 4Q10 1Q11 2Q11 3Q11 4Q11 1Q12F 2Q12F 3Q12F 4Q12F 2013F 4,067 2,027 1,510 1,663 1,349 14.63
12 31 EV/sales EV/EBIT EV/EBITDA EV/Inv. C
(x) (x) (x) (x) (x) (%)
2010A 5.6 15.1 13.5 22.5 2.9 20.7
: 2011A 5.4 16.0 14.0 17.7 2.6 23.8
2012F 4.0 10.8 9.7 14.3 2.2 25.8
2013F 3.2 8.6 7.8 11.8 1.8 26.8
52 ( / ): 98 - 185.5
2012
12 ( ) 205.0 ( / ): 16 / 540
2012 1Q12 / (%) 18.8 ( ): 92
(percentile, %) 66 ( ): 92
6% 15% 2.5 -12/11 (%) 2.9 ( ): 5
-12/12 (NT$) 50.2 3 ( ): 1
2Q12 10-15% -12/12 (x) 3.4 % (3,6,12 ) 18.2; 56.1; 17.3
-12/12 (%) % (3,6,12 ) 10.5; 48.7; 34.4
:
2Q12
17% 2.9 2H12
1Q12 2Q12
2012
http://research.kgi.com 2012 04 16 2
- 3. F
1Q12F 2Q12F 3Q12F 4Q12F 1Q13F 2Q13F 3Q13F 4Q13F 2012F 2013F
(NT$ )
727 827 886 954 878 948 1,042 1,199 3,395 4,067
371 414 443 467 448 483 521 587 1,695 2,040
356 414 443 486 430 464 521 611 1,700 2,027
98 108 112 119 116 123 130 147 437 517
258 305 332 367 314 341 391 464 1,262 1,510
34 34 34 34 38 38 38 38 135 150
1 1 1 1 1 1 1 1 3 3
EBITDA 293 340 366 402 352 379 429 502 1,400 1,663
4 4 4 4 5 5 5 5 17 21
0 0 0 0 0 0 0 0 0 0
25 25 25 25 25 25 25 25 100 100
29 29 29 29 30 30 30 30 117 121
10 10 10 10 11 11 11 11 41 44
10 10 10 10 11 11 11 11 41 44
277 324 351 386 333 360 410 483 1,339 1,587
( ) 47 55 60 66 50 54 62 72 228 238
230 269 291 321 283 306 349 411 1,111 1,349
0 0 0 0 0 0 0 0 0 0
230 269 291 321 283 306 349 411 1,111 1,349
EPS 3.02 3.53 3.81 4.20 3.62 3.92 4.46 5.25 14.52 17.21
EPS 2.50 2.93 3.17 3.49 3.08 3.33 3.79 4.47 12.05 14.63
(%)
49.0 50.0 50.0 51.0 49.0 49.0 50.0 51.0 50.1 49.8
35.5 36.9 37.4 38.5 35.8 36.0 37.5 38.7 37.2 37.1
EBITDA Margin 40.2 41.1 41.3 42.1 40.2 40.0 41.2 41.9 41.3 40.9
38.1 39.2 39.6 40.5 38.0 38.0 39.3 40.3 39.4 39.0
31.6 32.5 32.8 33.6 32.3 32.3 33.4 34.2 32.7 33.2
(%)
(5.8) 13.7 7.2 7.6 (8.0) 8.0 10.0 15.0 29.7 19.8
(6.5) 16.0 7.2 9.8 (11.6) 8.0 12.2 17.3 32.8 19.3
(6.7) 18.2 8.6 10.8 (14.5) 8.6 14.6 18.7 43.9 19.7
EBITDA (6.2) 16.0 7.8 9.8 (12.3) 7.7 13.1 17.0 39.0 18.8
1.0 16.9 8.1 10.2 (13.7) 8.1 13.8 17.8 28.7 18.5
(14.7) 16.9 8.1 10.2 (11.7) 8.1 13.8 17.8 23.7 21.4
http://research.kgi.com 2012 04 16 3
- 4. f
2012
1986
2001 3.89
3.49
2005 3.17
2.94 2.93
48% 2.50
2007 2.00
2008
0.95
1Q11 2Q11 3Q11 4Q11 1Q12F 2Q12F 3Q12F 4Q12F
2011
[0.7%] 200 50
40
6 180
5 30
6 160
20
140 10
0
120
(10)
100 (20)
81 80 (30)
1-3Q11 18.5 Apr-11 Jun-11 Jul-11 Aug-11 Oct-11 Nov-11 Jan-12 Feb-12 Apr-12
2012
1,000 24.0x 21.3x
200 18.6x
900
800 15.9x
700 160
600 13.2x
500 120
400 10.5x
300
80 7.8x
200
100
0 40
1Q11 2Q11 3Q11 4Q11 1Q12F 2Q12F 3Q12F 4Q12F 2007 2008 2009 2010 2011
2012
51.1 51.0 6.5x 5.7x 4.9x
50.0 50.0 200 4.1x
49.0 49.3 49.0
160 3.3x
45.9
2.5x
120
1.7x
80
40
1Q11 2Q11 3Q11 4Q11 1Q12F 2Q12F 3Q12F 4Q12F 2007 2008 2009 2010 2011
http://research.kgi.com 2012 04 16 4
- 5. f
12 31 ( ) 2009A 2010A 2011A 2012F 2013F 12 31 ( ) 2009A 2010A 2011A 2012F 2013F
5,199 5,401 5,847 6,756 7,695 2,175 2,551 2,617 3,395 4,067
3,571 3,745 4,163 5,071 6,060 1,051 1,224 1,338 1,695 2,040
2,669 2,857 3,112 3,734 4,478 1,123 1,327 1,280 1,700 2,027
270 310 319 404 486
349 374 402 437 517
562 504 686 884 1,036
775 953 877 1,262 1,510
69 74 45 50 60
(16) (26) (23) (24) (24)
1,628 1,656 1,684 1,685 1,635
0 0 0 0 0 11 10 13 17 21
1,618 1,643 1,666 1,665 1,615 27 36 36 41 44
10 12 18 20 20 0 0 0 0 0
1,968 1,827 1,871 2,130 2,273 53 (71) 186 100 100
1,480 520 1,808 2,065 2,208 0 0 0 0 0
195 166 214 279 335 812 856 1,040 1,339 1,587
956 7 1,281 1,436 1,513 164 151 142 228 238
329 347 313 350 360 648 704 898 1,111 1,349
488 1,306 63 65 65 EBITDA 851 1,060 1,008 1,400 1,663
435 1,251 0 0 0
( ) 7.13 7.66 9.75 12.05 14.63
53 56 63 65 65
3,231 3,574 3,976 4,626 5,422
871 921 922 922 922
289 361 371 371 371
2,070 2,292 2,684 3,334 4,129
0 0 0 0 0 12 31 ( ) 2009A 2010A 2011A 2012F 2013F
768 814 880 1,064 1,324
648 704 898 1,111 1,349
76 107 130 138 153
44 3 (148) (185) (178)
12 31 ( ) 2009A 2010A 2011A 2012F 2013F 0 0 0 0 0
(% ) (310) (135) (159) (139) (103)
(15.1) 17.3 2.6 29.7 19.8 (307) (131) (149) (134) (100)
(15.4) 23.1 (8.0) 43.9 19.7 0 0 0 0 0
EBITDA (14.1) 24.7 (5.0) 39.0 18.8 (3) (4) (10) (5) (3)
(18.1) 8.6 27.5 23.7 21.4
Free Cash Flow 458 679 721 925 1,221
(18.6) 7.5 27.2 23.7 21.4
(%)
370 (492) (466) (304) (476)
51.6 52.0 48.9 50.1 49.8 (74) (361) (496) (461) (553)
35.6 37.4 33.5 37.2 37.1 440 (133) 23 155 77
EBITDA 39.1 41.6 38.5 41.3 40.9 4 3 8 2 0
29.8 27.6 34.3 32.7 33.2 827 188 256 621 744
13.9 13.3 16.0 17.6 18.7
22.0 20.7 23.8 25.8 26.8
/
(%) 43.1 35.2 32.2 31.0 27.9
(%) Net cash Net cash Net cash Net cash Net cash ROIC (Return on Invested Capital)
(X) 31.6 24.8 29.5 33.8 36.9 12 31 1- + + =
(X) 0.9 20.6 0.8 0.9 1.0
Cash Flow Int. Coverage (X) 29.0 22.6 24.1 26.1 29.9 2009A 44.9% 3.5% 16.0% 35.6%
Cash Flow/Int. & ST Debt (X) 0.8 18.8 0.7 0.7 0.9 2010A 43.8% 4.2% 14.7% 37.4%
2011A 46.1% 5.0% 15.4% 33.5%
(X) 2.4 7.2 2.3 2.5 2.7
2012F 45.9% 4.1% 12.9% 37.2%
(X) 2.2 6.6 2.1 2.3 2.5
2013F 46.4% 3.8% 12.7% 37.1%
(NT$ ) (1,084) (1,438) (1,715) (2,065) (2,632)
(NT$ ) 12 31 1/ + + =
7.13 7.66 9.75 12.05 14.63 2009A 0.2 0.7 0.0 1.0
7.96 8.83 11.16 13.55 16.29 2010A 0.2 0.6 0.0 1.2
35.31 38.80 43.14 50.20 58.83 2011A 0.2 0.6 0.0 1.1
23.77 27.69 28.40 36.83 44.12 2012F 0.3 0.5 0.0 1.3
EBITDA/shr 8.52 10.37 9.52 13.69 16.39 2013F 0.3 0.4 0.0 1.5
3.60 3.41 5.00 6.00 7.00 12 31 x x 1- = ROIC
2009A 35.6% 1.0 79.8% 29.2%
(X) 0.5 0.5 0.5 0.5 0.6 2010A 37.4% 1.2 82.3% 36.4%
94.4 72.1 95.7 95.0 93.0 2011A 33.5% 1.1 86.4% 32.2%
45.4 44.3 44.5 43.4 43.6 2012F 37.2% 1.3 83.0% 40.9%
32.7 23.7 29.9 30.0 30.1 2013F 37.1% 1.5 85.0% 47.1%
107.1 92.7 110.3 108.4 106.5
http://research.kgi.com 2012 04 16 5
- 6. f
250
200
150
100
50
0
Apr-09 Jul-09 Oct-09 Jan-10 Apr-10 Jul-10 Oct-10 Jan-11 Apr-11 Jul-11 Oct-11 Jan-12 Apr-12
:
( )
16-Apr-12 172.5 163.0 205.0
07-Nov-11 141.5 113.5 163.0
01-Sep-11 104.5 133.0 113.5
28-Jun-11 120.5 188.0 133.0
29-Sep-10 156 193.0 188.0
26-Jan-10 174.5 187.0 193.0
23-Sep-09 189 110.5 187.0
01-Jul-09 105.5 136.7 110.5
07-May-09 124 128.0 136.7
16-Feb-09 97.8 100.0 128.0
27-Nov-08 85.5 132.0 100.0
13-Oct-08 102.5 240.0 132.0
:
http://research.kgi.com 2012 04 16 6
- 7. 100 A 1907-1909 104 700
200051 886.2.2181.8888
886.2.8501.1691
2014 A 24D1
518008
852.2878.6888 8th - 11th floors, Asia Centre Building
852.2878.6800 173 South Sathorn Road, Bangkok 10120, Thailand
66.2658.8888
66.2658.8014
(OP) (Excessive Return)
( ) 40%
(N) ( )
40% 40%
(U) ( )
40%
(NR)
(R ) /
* =( / )–1
http://research.kgi.com 2012 04 16 7