1. Course 3, Lesson 4-7
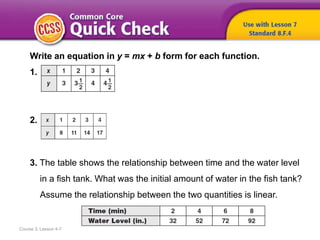
Write an equation in y = mx + b form for each function.
1.
2.
3. The table shows the relationship between time and the water level
in a fish tank. What was the initial amount of water in the fish tank?
Assume the relationship between the two quantities is linear.
8. 1
Need Another Example?
2
Step-by-Step Example
1. Determine whether the table represents
a linear or nonlinear function. Explain.
As x increases by 2,
y decreases by 15 each time.
The rate of change is constant,
so this function is linear.
9. Answer
Need Another Example?
Determine whether the table
represents a linear or nonlinear
function. Explain.
Nonlinear; the rate of change is not constant.
10. 1
Need Another Example?
2
3
Step-by-Step Example
2. Determine whether the table represents
a linear or nonlinear function. Explain.
As x increases by 3, y increases
by a greater amount each time.
The rate of change is not a constant,
so this function is nonlinear.
Graph the points on a coordinate plane.
Check
The points do not fall in a line. The function is nonlinear.
11. Answer
Need Another Example?
Determine whether the table
represents a linear or nonlinear
function. Explain.
Linear; the rate of change is constant,
as x increases by 3, y increases by 9.
12. 1
Need Another Example?
2
3
4
Step-by-Step Example
3. Use the table to determine whether the minimum
number of Calories a tiger cub should eat is a
linear function of its age in weeks.
Use the table to find the rates of
change.
1,000 – 825 = 175
The rates of change are not the same. Therefore, this
function is nonlinear.
Check Graph the data to verify the ordered pairs do not lie on a
straight line.
1,185 – 1,000 = 185
1,320 – 1,185 = 135
1,420 – 1,320 = 100
13. Answer
Need Another Example?
Use the table below to determine whether or
not the number of revolutions per hour of a
second hand on a clock is a linear function of
the number of hours that pass.
Linear function; the rate of change is constant;
as the number of hours increases by 1, the
number of second hand revolutions increases
by 60.
14. 1
Need Another Example?
2
Step-by-Step Example
4. A square has a side length of s inches. The area of
the square is a function of the side length. Does this
situation represent a linear or nonlinear function?
Explain.
Make a table to show the area of the square for side
lengths of 1, 2, 3, 4, and 5 inches.
Graph the function. The function
is not linear because the points
(1, 1), (2, 4), (3, 9), (4, 16), and
(5, 25) are not on a straight line.
15. Answer
Need Another Example?
At the first level of a maze, there are three possible
paths that can be chosen. At the next level, each of
those three paths have three more possible paths.
Does this situation represent a linear or nonlinear
function? Explain.
Nonlinear; if you graph the function
the points do not lie on a straight line.
16. How did what you learned
today help you answer the
HOW can we model relationships
between quantities?
Course 3, Lesson 4-7
Functions
17. How did what you learned
today help you answer the
HOW can we model relationships
between quantities?
Course 3, Lesson 4-7
Functions
Sample answers:
• In a function, if the rate of change between any two
data points is a constant, the function is linear.
• In a function, if the rate of change between any two
data points is not a constant, the function is nonlinear.
18. Explain how to tell whether
a table of x-values and
y-values describes a
function.
Ratios and Proportional RelationshipsFunctions
Course 3, Lesson 4-7