UChicago CMSC 23320 - The Best Commit Messages of 2024
(8) Lesson 4.9
1. Course 3, Lesson 4-9
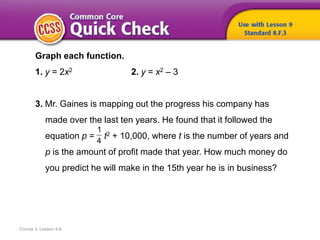
Graph each function.
1. y = 2x2 2. y = x2 – 3
3. Mr. Gaines is mapping out the progress his company has
made over the last ten years. He found that it followed the
equation p = t2 + 10,000, where t is the number of years and
p is the amount of profit made that year. How much money do
you predict he will make in the 15th year he is in business?
1
4
7. 1
Need Another Example?
Step-by-Step Example
1. The graph below displays the water level in a bathtub. Describe the
change in the water level over time.
At time zero, the water level in the bathtub is zero. The water level
in the bathtub increases at a constant rate. Then the water is
turned off and the water level does not change. Finally, the drain
plug is pulled and the water level decreases at a constant rate until
the water level is zero.
increasing
decreasing
no change
8. Answer
Need Another Example?
The graph displays the number of people at a
restaurant during the morning and afternoon.
Describe the change in the number of people
over time.
Sample answer: The number of people increases
during breakfast and then stays the same. After
breakfast, the number of people decreases and
then stays the same. Finally, the number of people
increases during lunch.
9. 1
Need Another Example?
2
Step-by-Step Example
2. A tennis ball is dropped onto the floor. On each successive
bounce, it rebounds to a height less than its previous bounce
height until it comes to rest on the floor. Sketch a qualitative graph
to represent the situation.
Draw the axes. Label the vertical
axis “Distance from Floor.” Label
the horizontal axis “Time.”
Sketch the shape of the graph.
The distance from the floor
starts out at a high value. The
ball falls to the floor, bounces,
and rebounds to a height less
than its drop height. This pattern
is repeated several times until the
ball comes to rest on the floor.
10. Answer
Need Another Example?
A train slowly increases speed, then maintains a
constant speed, then quickly speeds up. Sketch a
qualitative graph to represent the situation.
Sample answer:
11. 1
Need Another Example?
2
Step-by-Step Example
3. A child swings on a swing. Sketch a qualitative
graph to represent the situation.
Draw the axes. Label the vertical
axis “Distance from the ground”
and the horizontal axes “Time
Elapsed.”
Sketch the shape of the graph.
The distance from the swing to
the ground starts at a low value.
The child continues to swing and
creates momentum each time the
swing goes back until the child on
the swing stops.
12. Answer
Need Another Example?
Kenneth is playing fetch with his dog. As he
throws the ball away from him, the dog runs
and gets the ball and brings it back. Sketch a
qualitative graph to represent the situation.
Sample answer:
13. How did what you learned
today help you answer the
HOW can we model relationships
between quantities?
Course 3, Lesson 4-9
Functions
14. How did what you learned
today help you answer the
HOW can we model relationships
between quantities?
Course 3, Lesson 4-9
Functions
Sample answers:
• A qualitative graph is used to represent relationships
that may not have numerical values or in which
numerical values are not given.
• Qualitative graphs represent the essential elements of
a situation.
15. Draw a qualitative graph
on a small piece of paper.
Be sure to label the axes.
Choose one part of your
graph and write a brief
description of what it
represents.
Ratios and Proportional RelationshipsFunctions
Course 3, Lesson 4-9