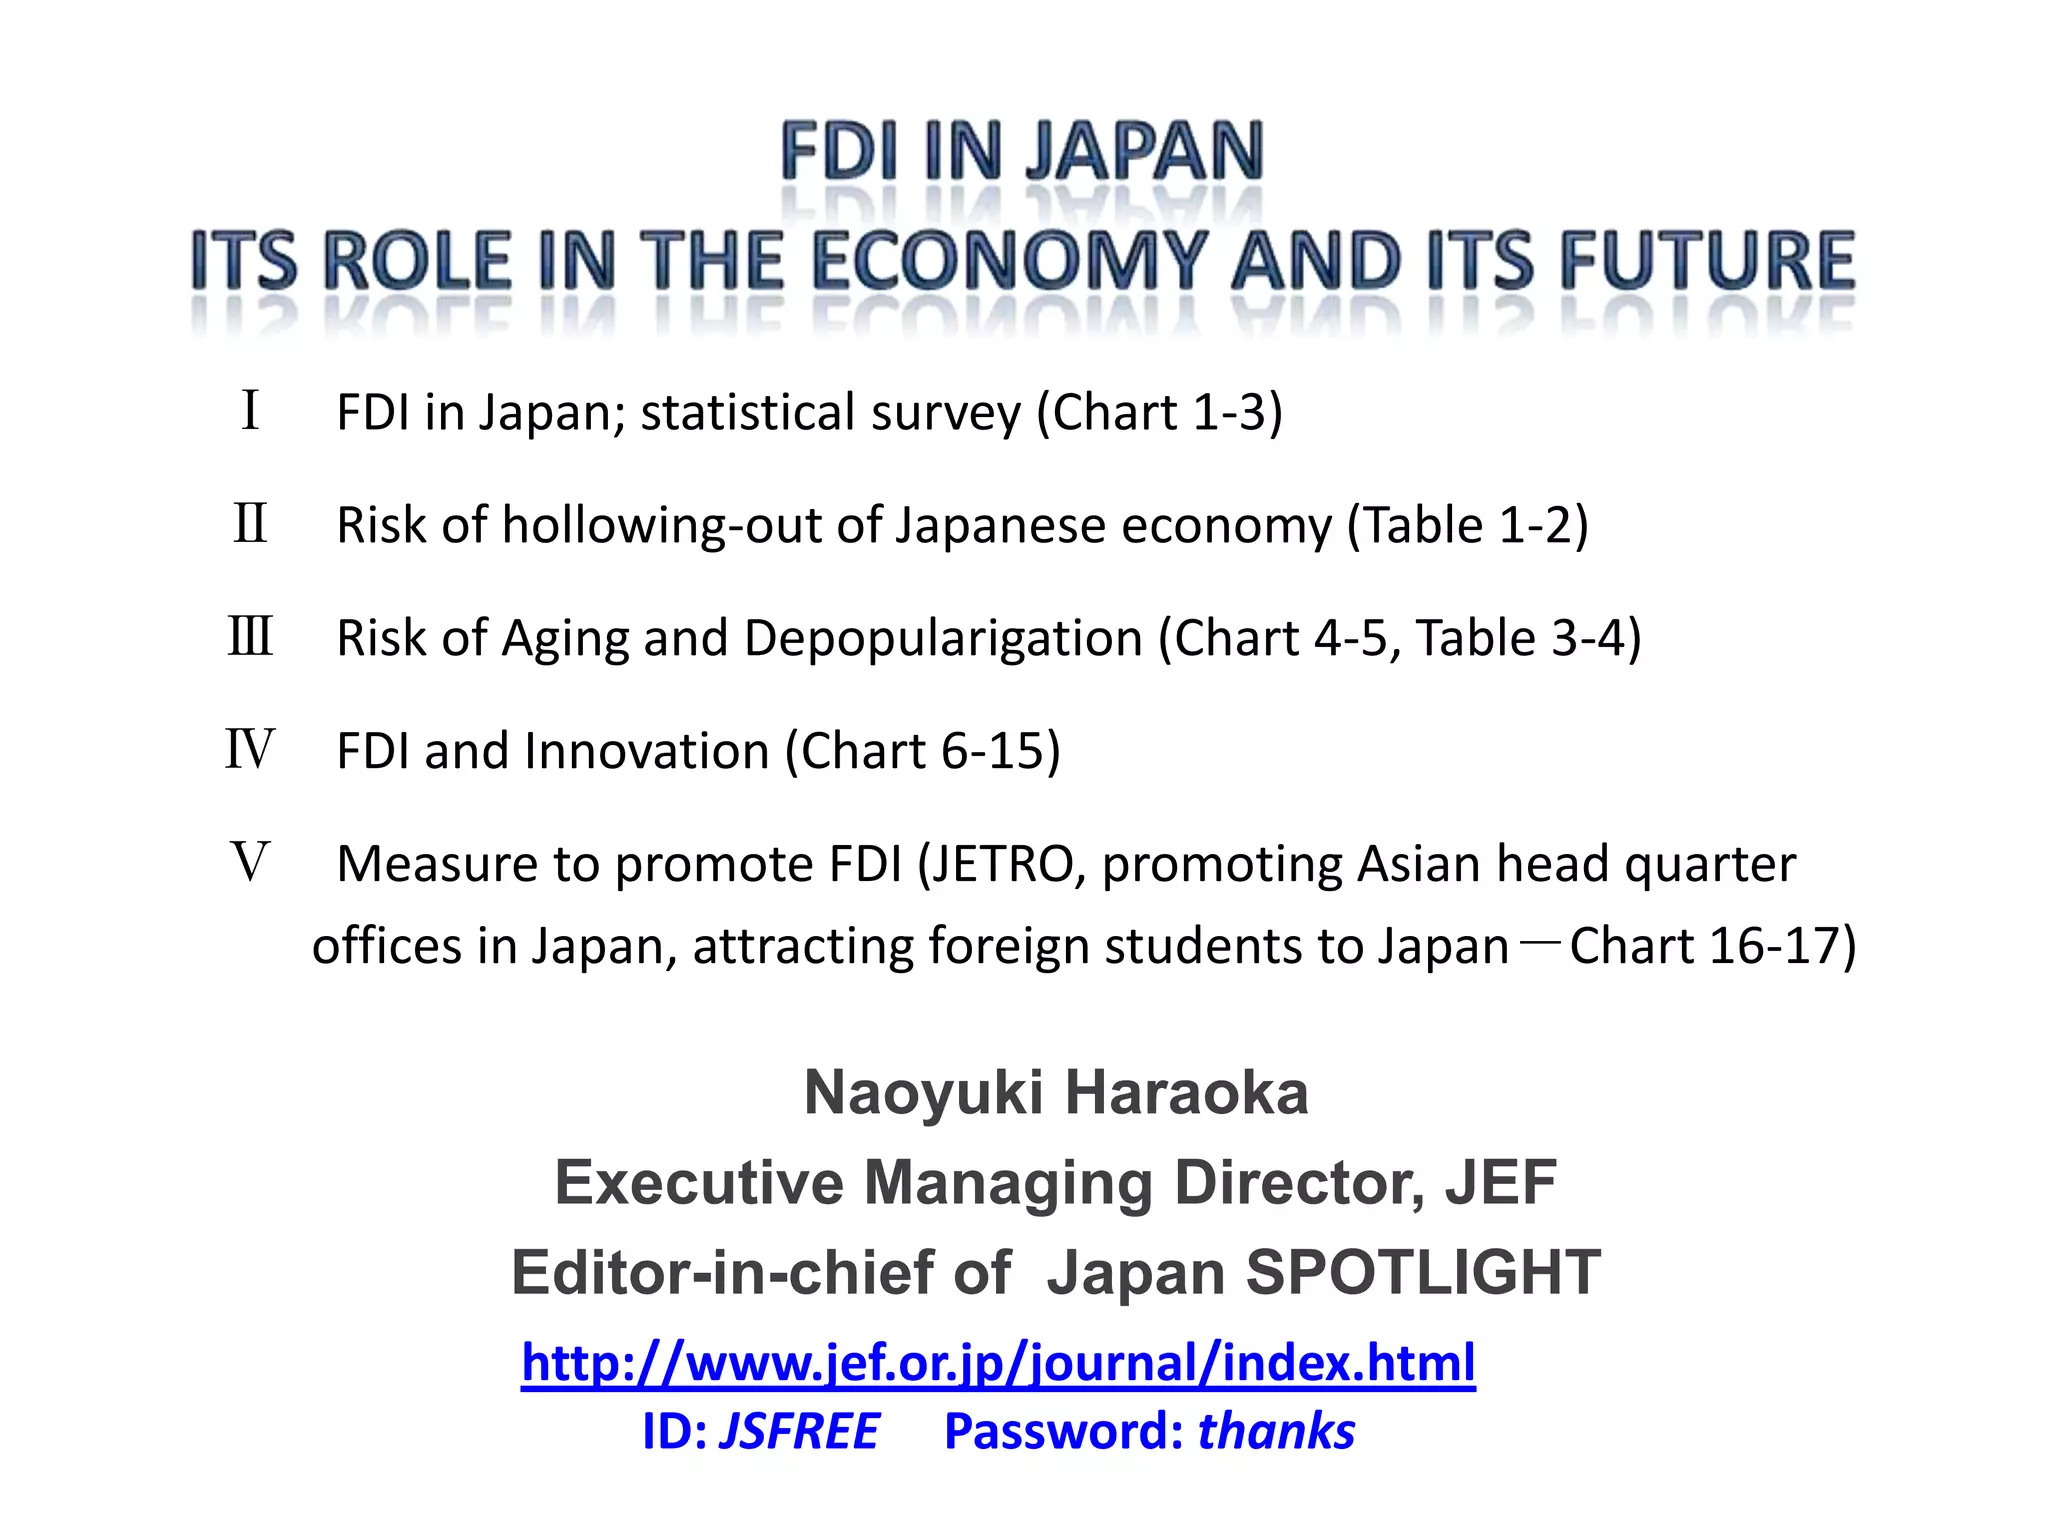
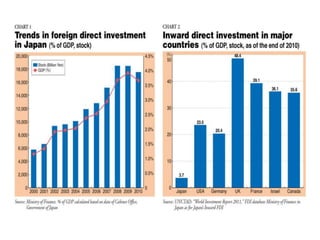
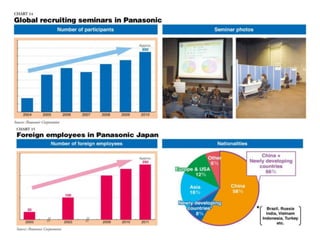
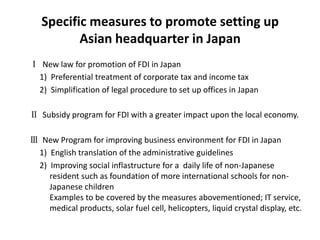
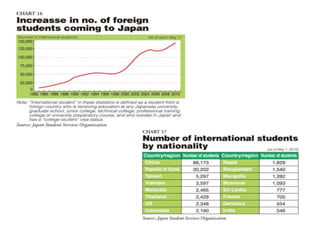
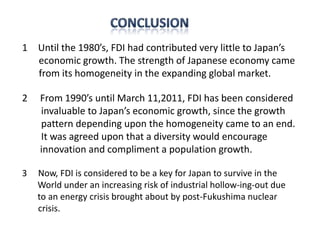
Ⅰ FDI in Japan; statistical survey (Chart 1-3)
Ⅱ Risk of hollowing-out of Japanese economy (Table 1-2)
Ⅲ Risk of Aging and Depopularigation (Chart 4-5, Table 3-4)
Ⅳ FDI and Innovation (Chart 6-15)
Ⅴ Measure to promote FDI (JETRO, promoting Asian head quarter
  offices in Japan, attracting foreign students to Japan-Chart 16-17)

                      Naoyuki Haraoka
             Executive Managing Director, JEF
            Editor-in-chief of Japan SPOTLIGHT
            http://www.jef.or.jp/journal/index.html
                 ID: JSFREE Password: thanks
Chart 3
       Trend of sales-profits ratio (by nationality)
 (%)
10
                                                                        9.1
 9
                   7.8        7.9
 8       7.6                            7.5                  7.4
                                                   7.2
 7
 6                            5.5
                                                   5.6
                                                                                     American Firms
 5      4.8
                   4.6
                                        4.8
                                                                                     Asian Firms
 4                           3.4        3.5       3.4
                                                                        3.2
                                                                                     European Firms
                   3.1
 3      2.7                                                       2.5                All Firms
 2                                                         2.4                 2.3
                                                  1.0                    1.1
 1                                     0.9                       0.9
                   0.5
        0.3
                              0.2
 0
       2003       2004      2005      2006       2007       2008        2009

(Source) Ministry of Finance, Japan
(Note) Sales-Profits Ratio = Current Profits/Sales×100.0
Table 1
     The number of the firms (firms, %) with declining shareholding
                         by foreign companies
            (excluding banking, insurance and real estate)

                     World total         American firms                Asian firms          European firms
                               Rate of                  Rate of                   Rate of                  Rate of
                              increase                 increase                  increase                 increase
                2008   2009              2008   2009              2008    2009              2008   2009
                              over the                 over the                  over the                 over the
                 FY     FY    previous    FY     FY    previous    FY      FY    previous    FY     FY    previous
                                year                     year                      year                     year

All the
industries
                125    164    31.2       38     62     63.2       14      22     57.1       44     55     25.0

Manufacturing
                                                                                  ▲
                28      30     7.1       10     10      0.0        4       3                11     13     18.2
                                                                                 25.0
Non-
Manufacturing
                97     125    28.9       28     52     85.7       10      19     90.0       33     42     27.3
Chart 4
      Changes of percentage of the aged population to total
(%)
35
             older than 75 years old
30           65-74 years old
25

20

15

10

  5

  0
      1950    1955   1960   1965   1970   1975   1980   1985   1990   1995   2000   2002   2003   2005   2010   2015   2020   2025
                                                                                                          (prediction)

       (Sources) Chief Cabinet Office, Bureau of Statistics
Table 3
Comparison by nation of the percentage of the aged population

                  Day/year            percentage to the total population (%)
   Nation
                 of the data        Above 65          65-74          Above 75
    Japan       2003. 9. 15           19.0            10.8              8.2
     Italy      2001. 1.       1      18.2            10.8              8.0
  Germany       2001. 12. 31          17.1             …….              …….
   France       2003. 1.       1      16.1             8.5              7.6
     U.K.       2001. 6. 30           15.9             8.4              7.5
    Russia      2002. 1.       1      12.9             8.3              4.6
   Canada       2002. 7.       1      12.7             6.9              5.8
    U.S.A.      2002. 7.       1      12.3             6.3              6.0


(Sources) Home page of each country’s statistics Bureau
Chart 5
         Changes of the percentage of the aged population
              to the total in the developed countries
 (%)
30                                                       (2003)                       France
                                                                                      UK
25                                                                                    Germany
                                                                                      Italy
20
                                                                                      Japan
15
                                                                                14
10

 5                                                                              7

 0
       1920 1930 1940 1950 1960 1970 1980 1990 2000 2010 2020 2025
                                                                                (Year)


(Sources) Japan National Research Institute of Social Welfare and Population Issues
        “World Population Prospects (2002)”
Table 4 Summary of forecast ofInstitute of population published in January 2012
         by National Research
                                Japanese
                                           Social Welfare and Population Issues
                                             2010           128,060 (thousand)
                                                                    ↓
                                             2030           116,620 (thousand)
    Total Population                                                ↓
                                             2055            91,930 (thousand)
                                             2060            86,740 (thousand)
                                             2010        16,840 (thousand)   13.1%
                                                                     ↓
                                             2030        12,040 (thousand)   10.3%
    Population (0-14 year old)                                       ↓
                                             2055         8,610 (thousand)   9.4%
                                                                     ↓
                                             2060         7,910 (thousand)   9.1%
                                             2010        81,730 (thousand)   63.8%
                                                                    ↓
                                             2030        67,730 (thousand)   58.1%
    Productive Population (15-64 years)                             ↓
                                             2055        47,060 (thousand)   51.2%
                                                                    ↓
                                             2060        44,180 (thousand)   50.9%
                                             2010        29,480 (thousand)   23.0%
                                                                     ↓
                                             2030        36,850 (thousand)   31.6%
    Aged Population (above 65 years)                                 ↓
                                             2055        36,260 (thousand)   39.4%
                                                                     ↓
                                             2060        24,640 (thousand)   39.9%
                                                         (% : percentage of the total)
Chart 6
Factors of economic growth among the advanced nations

           1980-95                             1995-05
10.0                                    10.0
                     TFP                                 TFP

 8.0                 capital input       8.0             capital input


                     labour input                        labour input
 6.0                                     6.0
                     real value-added                    real value-added
                     growth rate                         growth rate
 4.0                                     4.0


 2.0                                     2.0


 0.0                                     0.0


-2.0                                    -2.0
Chart 7
      TFP rate in manufacturing as well as non-manufacturing industry

240

220             Manufacturing
                Non-manufacturing
200

180

160

140

120

100
         1970       1975     1980    1985   1990   1995     2000    2005(year)


(Source) JIP database 2008
Specific measures to promote setting up
          Asian headquarter in Japan
Ⅰ New law for promotion of FDI in Japan
 1) Preferential treatment of corporate tax and income tax
 2) Simplification of legal procedure to set up offices in Japan

Ⅱ Subsidy program for FDI with a greater impact upon the local economy.

Ⅲ New Program for improving business environment for FDI in Japan
 1) English translation of the administrative guidelines
 2) Improving social inflastructure for a daily life of non-Japanese
    resident such as foundation of more international schools for non-
    Japanese children
    Examples to be covered by the measures abovementioned; IT service,
    medical products, solar fuel cell, helicopters, liquid crystal display, etc.
1 Until the 1980’s, FDI had contributed very little to Japan’s
  economic growth. The strength of Japanese economy came
  from its homogeneity in the expanding global market.

2   From 1990’s until March 11,2011, FDI has been considered
    invaluable to Japan’s economic growth, since the growth
    pattern depending upon the homogeneity came to an end.
    It was agreed upon that a diversity would encourage
    innovation and compliment a population growth.

3   Now, FDI is considered to be a key for Japan to survive in the
    World under an increasing risk of industrial hollow-ing-out due
    to an energy crisis brought about by post-Fukushima nuclear
    crisis.

Public Lecture PPT (6.6.2012)

  • 1.
    Ⅰ FDI inJapan; statistical survey (Chart 1-3) Ⅱ Risk of hollowing-out of Japanese economy (Table 1-2) Ⅲ Risk of Aging and Depopularigation (Chart 4-5, Table 3-4) Ⅳ FDI and Innovation (Chart 6-15) Ⅴ Measure to promote FDI (JETRO, promoting Asian head quarter offices in Japan, attracting foreign students to Japan-Chart 16-17) Naoyuki Haraoka Executive Managing Director, JEF Editor-in-chief of Japan SPOTLIGHT http://www.jef.or.jp/journal/index.html ID: JSFREE Password: thanks
  • 3.
    Chart 3 Trend of sales-profits ratio (by nationality) (%) 10 9.1 9 7.8 7.9 8 7.6 7.5 7.4 7.2 7 6 5.5 5.6 American Firms 5 4.8 4.6 4.8 Asian Firms 4 3.4 3.5 3.4 3.2 European Firms 3.1 3 2.7 2.5 All Firms 2 2.4 2.3 1.0 1.1 1 0.9 0.9 0.5 0.3 0.2 0 2003 2004 2005 2006 2007 2008 2009 (Source) Ministry of Finance, Japan (Note) Sales-Profits Ratio = Current Profits/Sales×100.0
  • 4.
    Table 1 The number of the firms (firms, %) with declining shareholding by foreign companies (excluding banking, insurance and real estate) World total American firms Asian firms European firms Rate of Rate of Rate of Rate of increase increase increase increase 2008 2009 2008 2009 2008 2009 2008 2009 over the over the over the over the FY FY previous FY FY previous FY FY previous FY FY previous year year year year All the industries 125 164 31.2 38 62 63.2 14 22 57.1 44 55 25.0 Manufacturing ▲ 28 30 7.1 10 10 0.0 4 3 11 13 18.2 25.0 Non- Manufacturing 97 125 28.9 28 52 85.7 10 19 90.0 33 42 27.3
  • 6.
    Chart 4 Changes of percentage of the aged population to total (%) 35 older than 75 years old 30 65-74 years old 25 20 15 10 5 0 1950 1955 1960 1965 1970 1975 1980 1985 1990 1995 2000 2002 2003 2005 2010 2015 2020 2025 (prediction) (Sources) Chief Cabinet Office, Bureau of Statistics
  • 7.
    Table 3 Comparison bynation of the percentage of the aged population Day/year percentage to the total population (%) Nation of the data Above 65 65-74 Above 75 Japan 2003. 9. 15 19.0 10.8 8.2 Italy 2001. 1. 1 18.2 10.8 8.0 Germany 2001. 12. 31 17.1 ……. ……. France 2003. 1. 1 16.1 8.5 7.6 U.K. 2001. 6. 30 15.9 8.4 7.5 Russia 2002. 1. 1 12.9 8.3 4.6 Canada 2002. 7. 1 12.7 6.9 5.8 U.S.A. 2002. 7. 1 12.3 6.3 6.0 (Sources) Home page of each country’s statistics Bureau
  • 8.
    Chart 5 Changes of the percentage of the aged population to the total in the developed countries (%) 30 (2003) France UK 25 Germany Italy 20 Japan 15 14 10 5 7 0 1920 1930 1940 1950 1960 1970 1980 1990 2000 2010 2020 2025 (Year) (Sources) Japan National Research Institute of Social Welfare and Population Issues “World Population Prospects (2002)”
  • 9.
    Table 4 Summaryof forecast ofInstitute of population published in January 2012 by National Research Japanese Social Welfare and Population Issues 2010 128,060 (thousand) ↓ 2030 116,620 (thousand) Total Population ↓ 2055 91,930 (thousand) 2060 86,740 (thousand) 2010 16,840 (thousand) 13.1% ↓ 2030 12,040 (thousand) 10.3% Population (0-14 year old) ↓ 2055 8,610 (thousand) 9.4% ↓ 2060 7,910 (thousand) 9.1% 2010 81,730 (thousand) 63.8% ↓ 2030 67,730 (thousand) 58.1% Productive Population (15-64 years) ↓ 2055 47,060 (thousand) 51.2% ↓ 2060 44,180 (thousand) 50.9% 2010 29,480 (thousand) 23.0% ↓ 2030 36,850 (thousand) 31.6% Aged Population (above 65 years) ↓ 2055 36,260 (thousand) 39.4% ↓ 2060 24,640 (thousand) 39.9% (% : percentage of the total)
  • 10.
    Chart 6 Factors ofeconomic growth among the advanced nations 1980-95 1995-05 10.0 10.0 TFP TFP 8.0 capital input 8.0 capital input labour input labour input 6.0 6.0 real value-added real value-added growth rate growth rate 4.0 4.0 2.0 2.0 0.0 0.0 -2.0 -2.0
  • 11.
    Chart 7 TFP rate in manufacturing as well as non-manufacturing industry 240 220 Manufacturing Non-manufacturing 200 180 160 140 120 100 1970 1975 1980 1985 1990 1995 2000 2005(year) (Source) JIP database 2008
  • 17.
    Specific measures topromote setting up Asian headquarter in Japan Ⅰ New law for promotion of FDI in Japan 1) Preferential treatment of corporate tax and income tax 2) Simplification of legal procedure to set up offices in Japan Ⅱ Subsidy program for FDI with a greater impact upon the local economy. Ⅲ New Program for improving business environment for FDI in Japan 1) English translation of the administrative guidelines 2) Improving social inflastructure for a daily life of non-Japanese resident such as foundation of more international schools for non- Japanese children Examples to be covered by the measures abovementioned; IT service, medical products, solar fuel cell, helicopters, liquid crystal display, etc.
  • 19.
    1 Until the1980’s, FDI had contributed very little to Japan’s economic growth. The strength of Japanese economy came from its homogeneity in the expanding global market. 2 From 1990’s until March 11,2011, FDI has been considered invaluable to Japan’s economic growth, since the growth pattern depending upon the homogeneity came to an end. It was agreed upon that a diversity would encourage innovation and compliment a population growth. 3 Now, FDI is considered to be a key for Japan to survive in the World under an increasing risk of industrial hollow-ing-out due to an energy crisis brought about by post-Fukushima nuclear crisis.