Impact Test Simulation
•Download as PPTX, PDF•
1 like•98 views

This document summarizes a PhD student's dissertation on crashworthiness simulations of an engineered cementitious composite safety barrier. It describes the methodology, material models used, and simulations conducted including beam-drop weight impact tests, barrier-drop weight impact tests, and barrier-vehicle crash tests. The student adjusted material parameters to match experimental beam-drop test results and used these adjusted models to predict barrier-drop and crash test outcomes. The goal was to investigate barrier responses through vehicle crash simulations using a 2007 Chevrolet Silverado model. Evaluation criteria from highway safety reports were also discussed.

Recommended
Recommended
More Related Content
What's hot
What's hot (20)
Similar to Impact Test Simulation
Similar to Impact Test Simulation (20)
Recently uploaded
Recently uploaded (20)
Impact Test Simulation
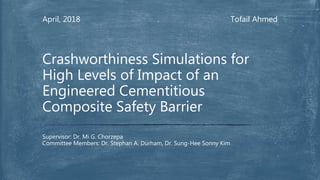
- 1. Tofail AhmedApril, 2018 Supervisor: Dr. Mi G. Chorzepa Committee Members: Dr. Stephan A. Durham, Dr. Sung-Hee Sonny Kim Crashworthiness Simulations for High Levels of Impact of an Engineered Cementitious Composite Safety Barrier
- 2. Methodology Selection of commercially available material models Beam-drop weight impact test simulation Adjustment of material parameters to achieve beam-drop weight impact test results Successful verification and validation of beam-drop weight impact model Developing Type S1 barrier model using adjusted material models Prediction of barrier-drop weight impact test results Prediction of vehicle crash test results Project Goal: Investigation of responses of Type S1 median barrier through vehicle crash test simulation Barrier is made of tire chips and steel fiber modified concrete Overview
- 3. Beam-drop weight impact test simulation Barrier-drop weight impact test simulation Barrier-vehicle crash test simulation FEA Models
- 4. 2007 Chevrolet Silverado Developed at Center for Collision and Safety Analysis (CCSA) laboratory at George Mason University [1,2] Verified and Validated by the developers Barrier-vehicle crash test simulation 1 2007 Chevrolet Silverado Finite Element Course Validation, Presentation https://doi.org/10.13021/G8SC8K 2 Components and Full-scale Tests of the 2007 Chevrolet Silverado Suspension System, Report https://media.ccsa.gmu.edu/cache/NCAC-2009-R-004.pdf
- 6. Test level 3-11 [1,2] 1 National cooperative Highway Research Program (NCHRP) Report 350 2 Manual for Assessing Safety Hardware (MASH) 2009,2016 3 Procedures for Verification and Validation of Computer Simulations Used for Roadside Safety Applications, AASHTO, NCHRP, TRB DOI 10.17226/17647 Length of rigid barrier 23 m Impact velocity 62 mph (100 km/h) Impact angle 25 degrees Vehicle designation 2270P: four door, two-drive, half-ton pickup truck weighing 5000 lb (2270 kg) 2007 Chevrolet Silverado: four door, 5152 lb (2337 kg) NCHRP reports [3] a case study where a FIAT UNO and a Peugeot 206 were used for experiments and in the corresponding FE analysis a vehicle model, ‘Geo Metro’, developed by National Crash Analysis Center (NCAC) was used. These cars and the FE model were different but complied with the requirements for 900 kg small car category.
- 7. Evaluation Criteria [1,2] 1 National cooperative Highway Research Program (NCHRP) Report 350 2 Manual for Assessing Safety Hardware (MASH) 2009,2016 Barrier should contain and redirect the vehicle or not bring the vehicle to a controlled stop Vehicle should not penetrate, underride, or override the installation Control lateral deflection of the barrier is acceptable Barrier should readily activate in predictable manner by breaking away, fracturing, or yielding Structural Properties Vehicle Trajectory Preferable Criteria Vehicle doesn’t intrude into adjacent traffic lanes Exit angle is less than 60 percent of test impact angle It is expected that the modified concrete barrier results in larger energy absorption, larger deformation, and reduced impact force when compared to standard concrete barrier
- 8. Barrier-Drop weight Impact Test Simulation
- 9. Barrier-Drop weight Impact Test Simulation: Results Figure: Impact force Time history Figure: Energy Time history
- 10. Strain Rate Dependency of Steel Figure: stress (lbf/in2) – strain curve for mild steel in compression [1] Figure: Results from Dynamic Tensile and Compression Tests on Mild Steel [1] 1 Jones, N. (1990), Structural Impact, Cambridge, Cambridge University
- 11. Strain Rate Dependency of Steel 𝜎 𝑑 𝜎𝑠 = 𝜀 𝐶 1 𝑝 𝜎 𝑑 = dynamic yield strength 𝜎𝑠 = static yield strength 𝜀 = strain rate 𝐶, 𝑝 are the Cowper-Symonds relationship parameters C = 40.4 s-1 and p = 5, gives reasonable agreement with the experimental data for mild steel assembled by Symonds [1] 1 Jones, N. (1990), Structural Impact, Cambridge, Cambridge University
- 12. Strain Rate Dependency of Concrete Figure: Change in Compressive Strength of Concrete with Change in Strain Rate from Experimental Data [1] Figure: Dynamic Increase Factor (DIF) versus Strain Rate (in a log scale) [2] 1 Bischoff, P.H., and S.H. Perry, “ Impact Behavior of Plain Concrete Loaded in Uniaxial Compression,” Journal of Engineering Mechanics, June 1995, pp. 685- 693 2 Ross, C.A., and J.W. Tedesco, “Effects of Strain-Rate on Concrete Strength,” Presented at the ACI 1991 Spring Convention, Washington, D.C., March 1992
- 13. Strain Rate Dependency of Concrete For roadside safety applications, the strain rate effect increases the peak strength by 15-20% in case of compression, and 100% in case of tension [1] 1 Users Manual for LS-DYNA Concrete Material Model 159, U.S. Department of Transportation, Federal Highway Administration, FHWA-HRT-05-062, May 2007 2 Bischoff PH, Schluter F-H, editors. Concrete structures under impact and impulsive loading, synthesis report. Bulletin d’information, No 187. Dubrovnik; Comite Euro- Internationale du Beton; September 1988 Constitutive relationship [2] Compression: 𝐹𝑟𝑎𝑡𝑒 = 𝑓 𝑐𝑑 𝑓𝑐 = ( 𝜀 𝜀0 ) 𝛼 𝜀 ≤ 30𝑠−1 𝑓 𝑐𝑑 𝑓𝑐 = 𝛾 3 𝜀 𝜀 > 30𝑠−1 𝜀0 = 30 × 10−6 𝑠−1 𝛼 = 1 5+ 3 4 𝑓𝑐 𝑙𝑜𝑔𝛾 = 6𝛼 − .492 Tension: 𝐹𝑟𝑎𝑡𝑒 = 𝑓 𝑡𝑑 𝑓𝑡 = ( 𝜀 𝜀0 ) 𝛿 𝜀 ≤ 30𝑠−1 𝑓 𝑡𝑑 𝑓𝑡 = 𝜂 3 𝜀 𝜀 > 30𝑠−1 𝜀0 = 3 × 10⁻⁶ 𝑠−1 𝛿 = 1 10+ 1 2 𝑓𝑐 𝑙𝑜𝑔𝜂 = 6𝛿 − .492 𝑓𝑐𝑑,𝑓𝑡𝑑 = dynamic compressive and tensile strength respectively 𝑓𝑐,𝑓𝑡 = static compressive and tensile strength respectively 𝜀 = strain rate
- 15. Cap Formulation Figure: Yield surface with (right) and without (left) cap formulation Elastic limit of concrete will increase with corresponding increase in confining pressure. At some point, this strength will start to decrease even if the confinement pressure increases. This is because of the internal porosity of the material. The function of the cap formulation in material models is to capture this behavior. In RHT and CSCM this decrease in strength is modeled through an ellipsoid shape
- 16. Material Models Riedel-Hiermaier-Thoma (RHT) Model [1] Continuous Cap Surface Model (CSCM) [2,3] 1 Riedel, W., et al. (2009). "Numerical assessment for impact strength measurements in concrete materials." International Journal of Impact Engineering 36(2): 283-293. 2 Users Manual for LS-DYNA Concrete Material Model 159, U.S. Department of Transportation, Federal Highway Administration, FHWA-HRT-05-062, May 2007 3 Evaluation of LS-DYNA Concrete Material Model 159, U.S. Department of Transportation, Federal Highway Administration, FHWA-HRT-05-063, May 2007
- 17. Material Models at a glance
- 18. User Input of Model Parameters Relevant experimental studies are performed Curve fitting from experimental test results Different parameter values are obtained from the curve fitting equation These values are used as a starting point for analytical study Repeated analytical studies are performed while input parameters are being adjusted until expected results are achieved Applicable for both RHT and CSCM Only parameters of interest should be adjusted Selection of parameters for adjustment is crucial
- 19. User Input of Model Parameters: CSCM Provides an interpolation method for determination of all the input values Adjustment of input values after interpolation, if necessary, is recommended 𝑃 = 𝐴 𝑝 𝑓𝑐 ′ 2 + 𝐵𝑝 𝑓𝑐 ′ + 𝐶 𝑝 𝑃 = 𝐴 𝑝 𝐷 2 + 𝐵𝑝 𝐷 + 𝐶 𝑝 Automatic unconfined compression strength maximum aggregate size Not reliable, model developers had problem with it Manual P is the parameter of interest
- 20. User Input of Model Parameters: CSCM Manual 𝑃 = 𝐴 𝑝 𝑓𝑐 ′ 2 + 𝐵𝑝 𝑓𝑐 ′ + 𝐶 𝑝 𝑃 = 𝐴 𝑝 𝐷 2 + 𝐵𝑝 𝐷 + 𝐶 𝑝
- 21. Beam-Drop Weight Impact Test Simulation Compared with experimental study performed by Masud and Chorzepa (2015) 500 lb drop weight (226.796 kg) Drop height 20 ft End velocity 10.943 m/s (24.45 mph) Unconfined compressive strength 46.3 MPa (6715 psi) Maximum Impact Force 916 kN Maximum mid-span displacement 115.74 mm
- 22. Beam-Drop Weight Impact Test Simulation RHT CSCM
- 23. Mesh sensitivity Results: RHT Internal energy time history
- 24. Results: RHT Mid-span displacement time historyImpact force time history
- 25. Results: CSCM Internal energy time history Mesh sensitivity
- 26. Results: CSCM Mesh sensitivity Stress displacement curve in a tensile test with unregulated softening behavior
- 27. Results: CSCM Fracture energy values used in parametric study of Texas T4 Bridge Rail Simulation
- 28. Results: CSCM
- 29. Results: CSCM Displacement time history
- 30. Program of Study Term Course No. Course Name Credit hours Spring 2017 CVLE 8350 Nonlinear Finite Element Analysis 3 ENGR 8990 Advanced Bridge Design 3 Summer 2017 ENGR 8990 Advanced Construction Materials 3 Fall 2017 CVLE 6330 Advanced Structural Analysis 3 ENGR 8950 Grad Seminar 1 ENGR 8990 Advanced Steel Design 3 Spring 2018 CVLE 8640 Advanced Strength of Materials 3 ENGR 8990 Structural Dynamics 3 Summer 2018 ENGR 8990 Composite Material Design 3