
Recommended
Recommended
More Related Content
Similar to Sample Report A Formal Report .docx
Similar to Sample Report A Formal Report .docx (20)
More from todd331
More from todd331 (20)
Recently uploaded
Recently uploaded (20)
Sample Report A Formal Report .docx
- 1. Sample Report A Formal Report Sample Reports S-29 Copyright © Houghton Mifflin Company. All rights reserved. A FORMAL REPORT THE EFFECTS OF STRESS ON BUSINESS EMPLOYEES AND PROGRAMS OFFERED BY EMPLOYERS TO MANAGE EMPLOYEE STRESS
- 2. Prepared for Dr. Robert J. Olney Southwest Texas State University Prepared by Charles Dishinger Nancy Howard Bill Kiagler Sherry Seabrooke Donna Tucker November 29, 20--
- 3. Sample Reports S-30 Copyright © Houghton Mifflin Company. All rights reserved. ii TABLE OF CONTENTS LIST OF TABLES……………………………………………………………… ……… ………. LIST OF FIGURES…………………………………………………………… ………… ……… ABSTRACT………………………………………………………… ………… ………………...
- 4. SECTION I INTRODUCTION TO THE STUDY………………………………………………….. Introduction…………………………………………………… ……………... Statement of the Problem…………………………………………………….. Significance of the Study…………………………………………………….. Scope of the Study…………………………………………………………… Review of Related Literature………………………………………………… Methods of the Study………………………………………………………… Source of Data…………………………………………………… …. l Page iii iv v 1
- 5. 1 1 1 1 2 2 3 3 4 4 4 6 6 6 6 7 8 9 10 11 Sample Reports S-31 Copyright © Houghton Mifflin Company. All rights reserved. iii
- 6. LIST OF TABLES Table Page 1. Programs Offered by Employers to Manage Stress ........…………………………………… 8
- 7. Sample Reports S-32 Copyright © Houghton Mifflin Company. All rights reserved. iv LIST OF FIGURES Figure Page 1. Age Distribution of Respondents .......................……………………………………………. 6 2. Negative Effects of Stress on Work Performance ........……………………………………… 7
- 9. Sample Reports S-34 Copyright © Houghton Mifflin Company. All rights reserved. The Effects of Stress on Business Employees and Programs Offered by Employers to Manage Employee Stress Section I Introduction to the Study Introduction Today, many organizations and employees are experiencing the effects of stress on work performance. The effects of stress can be either positive or negative. What is perceived as positive stress by one person may be perceived as negative stress by another, since everyone perceives situations differently.
- 10. According to Barden (2001), negative stress is becoming a major illness in the work environment, and it can debilitate employees and be costly to employers. Managers need to identify those suffering from negative stress and implement programs as a defense against stress. These programs may reduce the impact stress has on employees' work performance. Statement of the Problem The purpose of this study was to determine the negative effects of stress on employees and the methods employers use to manage employees' stress. Significance of the Study There are three primary groups that may benefit from this study. The first group, consisting of employees in today's business organizations, may learn to identify ways that stress negatively affects their work performance. Identifying the negative effects may enable them to take necessary action to cope with stress. By sharing this knowledge, employees can act as a vehicle to help management implement appropriate stress reduction programs. The second group that may benefit from this study is employers who may gain insight as to how stress is actually negatively affecting
- 11. Sample Reports S-35 Copyright © Houghton Mifflin Company. All rights reserved. 2 employees’ work performance. Finally, educators can use these findings as a valuable guide to incorporate into their curriculum. By emphasizing to students the importance of developing programs to deal with stress, the students may be able to transfer this knowledge to the workplace, thereby improving the quality of the work environment. Scope of the Study This study was limited to the perceptions of full-time business employees as to the negative effects that stress has on work performance and the steps that employers are taking to manage stress. For the purpose of this study, what constitutes full-time employment is defined by the employer. This study was restricted to businesses operating in the Central Texas area. The Central Texas area encompasses all communities within Hays, Kendall, Travis, and Williamson counties. For the purpose of this study, stress is defined as disruptive or disquieting influences that negatively affect an individual in the workplace. Data for this study were
- 12. collected during the fall of 2002. Review of Related Literature Barden (2001), a freelance writer specializing in health care and a former managing editor of Commerce and Health, stated the importance of wellness programs and gave specific examples of corporations that are successfully implementing such programs. The Morrison Company currently saves $8.33 for every dollar spent on wellness by offering programs such as weight loss, exercise, and back care. Axon Petroleum estimates that wellness programs will save $1.6 million each year in health care costs for its 650 employees. In addition to Morrison and Axon Petroleum, Barden cited the savings for six other companies. According to the Wellness Bureau of America, the success of these companies offers concrete proof that wellness programs pay off by lowering health care costs, reducing absenteeism, and increasing productivity. Foster (2002), a professional speaker on stress- management, surveyed mid- level managers and found stress to be a major determinant in worker productivity. According to the study, the primary areas affected by stress are employee morale, absenteeism, and decision making abilities. By recognizing that a problem exists and by addressing the issue, managers can reduce stressful activities
- 13. and increase worker performance in the business organization. Harrold and Wayland (2002) reported that increasing stress affects morale, productivity, organizational efficiency, absenteeism, and profitability for both individuals and the organization. The problem for businesses today is knowing how Sample Reports S-36 Copyright © Houghton Mifflin Company. All rights reserved. 3 to determine stressful areas in their organizations and how to use constructive confron- tation methods to reduce stress and improve efficiency. According to the authors, organizations that make a positive effort to deal with stress not only help build trust among their employees, but also increase the productivity of their employees and the organization as a whole. Maurer (2002) stated that stress-induced illnesses are prevalent in the workplace today, and stress is the problem of the sufferer and the employer. Stress causes absenteeism and can lead to other problems such as drug addiction, alcoholism, depression, and poor job performance. According to Maurer, the annual Barlow
- 14. Corporation Forum on Human Resource Issues and Trends reported that large numbers of companies noticed severe levels of stress exhibited by employees. The forum's panelists agreed that more needed to be done in the workplace to help employees manage stress. Some of the suggestions were to expand wellness programs, offer stress-management seminars, and teach staff how to balance work and family life. Maurer also noted that Olympic TeamTech, a computer management company, has dealt with employee stress by providing training programs, monitoring employee concerns, and meeting once a month to be proactive instead of reactive. Olympic TeamTech's turnover is less than the industry average. Schorr (2001), a stress-management consultant, stated that stress causes problems in the workplace which negatively affect employee health and organizational productivity. Stress can lead to problems such as job dissatisfaction, alcoholism, absenteeism, physical ailments, and poor job performance. If managers know how to prevent and cope with stress, productivity can be increased. Many companies instituted stress-management programs that led to a decline in absenteeism, a decrease in sickness and accident costs, and/or an increase in job performance. Schorr reported that a stress inventory, available from a stress-management program, can assist executives and managers in assessing employee stress. The inventory can identify the sources of stress, which may include physical elements as well
- 15. as other factors. Once these sources have been assessed, the program can provide the necessary skills for coping with the problems, and participants can learn that there are alternative ways of reacting to stress. Methods of the Study Source of Data Data for this study were collected using a questionnaire developed by a group of students at Southwest Texas State University. The questionnaire was divided into Sample Reports S-37 Copyright © Houghton Mifflin Company. All rights reserved. 4 three parts. Part one consisted of a list of 15 work performance areas that may be negatively affected by a person's level of stress. Respondents were asked to indicate whether stress increased, decreased, or had not changed their work performance in each area. They were also asked to indicate from the list of 15 work performance areas
- 16. the area that was the most negatively affected by stress and the area that was the least negatively affected by stress. In the second part of the questionnaire, a list of 17 programs was provided and the respondents were asked to indicate which programs their companies had implemented to manage stress. Part three was designed to collect demographic data for a respondent profile, including full-time employee classification and age group. A copy of the questionnaire is contained in Appendix A on page 12. Sample Selection The respondents involved in this survey were employees working in companies located in Central Texas. A nonprobability, convenience sampling technique was used to collect primary data. Each member of the research team was responsible for distributing three questionnaires to members of the sample. To ensure confidentiality, respondents were given self-addressed, stamped envelopes in which to return their completed questionnaires to Southwest Texas State University. Controls were used to eliminate duplication of the responses. Statistical Methods Simple statistical techniques were used to tabulate the results of this study. The primary data were analyzed using a percent of response. To compute the percent of response, the number of responses to each choice was divided
- 17. by the total number of respondents who answered the question. In question one, the percents of responses for the negative effects of stress on the 15 work performance areas were reported. The results of the next two questions were tabulated by totaling the number of respondents who chose an area they believed was least or most affected by stress. The fourth question reported the percent of respondents whose employers offered the listed programs to manage stress. Questions five and six asked the respondents to indicate if they were considered full-time employees and to indicate their age group. Limitations of the Study This study may be limited through the use of a questionnaire as a data collection instrument. Because questionnaires must generally be brief, areas that may have been affected by stress may not have been included in the questionnaire. Sample Reports S-38 Copyright © Houghton Mifflin Company. All rights reserved. 5
- 18. Also, all programs that may be available to employees for managing stress may not have been included in the study. The study may also be limited by the use of a nonprobability, convenience sampling method. The sample of business employees for the study was chosen for convenience and may not be representative of the total population of business employees. Care should be taken when generalizing these findings to the entire population. Finally, the use of simple statistical techniques may introduce an element of subjectivity into the interpretation and analysis of the data. All attempts have been made to minimize the effects of these limitations on the study.
- 19. Sample Reports S-39 Copyright © Houghton Mifflin Company. All rights reserved. 6 Section II Findings, Conclusions, and Recommendations
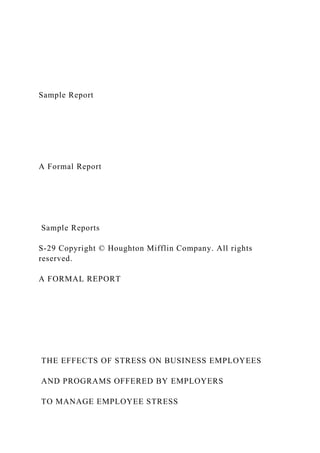
- 20. Introduction This study was designed to determine the effects of stress on employees and to discover methods employers use to manage employees' stress. Sixty questionnaires were distributed to business employees in the Central Texas area, and the response rate was 78.3%. This section includes the Findings, Conclusions, and Recommendations. Findings The findings will be presented in three sections according to the following characteristics: Demographic Profile, Areas of Job Performance Affected by Stress, and Programs Employers Offer Employees to Manage Stress. Demographic Profile All returned responses from the sample were considered full- time employees by their employers. The respondents were also asked to indicate their age group; all age ranges were represented in the results, as shown in Figure 1. The breakdown consisted of 2.1% under the age of 20, 33.7% between 20 and 29, 29.4% between the ages of 30 and 39, 26.1% between 40 and 49, 5.4% between 50 and 59, and 3.3% were 60 and over.
- 21. AGE GROUP 1 -- Less than 20 2.1% 2 -- 20 to 29 33.7% 3 -- 30 to 39 29.4% 4 -- 40 to 49 26.1% 5 -- 50 to 59 5.4% 6 -- 60 or over 3.3% Figure 1: Age Distribution of Respondents 1 2 3 4 5 6 Sample Reports S-40 Copyright © Houghton Mifflin Company. All rights
- 22. reserved. 7 Areas of Job Performance Affected by Stress The respondents were given a list of work performance areas that might be affected by stress and were asked to identify whether stress increased, decreased, or had no change on their work performance. Only respondents who indicated stress negatively affected an area were considered in these findings. Of the 15 areas listed, four areas were identified as having a response rate of more than 50.0%. These areas were as follows: job satisfaction / morale (73.9%), courtesy (65.2%), accuracy (52.7%), and creativity (51.6%). Similarly, Schorr (2001) stated that a significant number of employees' creativity is negatively affected by stress. Also, Harrold and Wayland (2002) agreed that morale is strongly affected by stress. Falling within the range of a 30.0 to 50.0% response rate were cooperation (49.5%), organizational skills (46.3%), initiative (45.2%), productivity (42.8%), alertness (39.4%), decision making abilities (39.1%), and perseverance (35.5%). Harrold and Wayland (2002) established that increasing stress and anxiety are having a negative influence on an individual's organizational efficiency and productivity. The findings that negatively affect work performance are shown in Figure 2.
- 23. Figure 2: Negative Effects of Stress on Work Performance 0 10 20 3 0 40 50 60 70 8 0
- 24. 1 3 5 7 9 1 1 1 3 1 5 1 42.8% Productivity 9 49.5% Cooperation 2 73.9% Job Satisfaction/Morale 10 45.2% Initiative 3 39.1% Decision Making Abilities 11 26.6% Reliability 4 52.7% Accuracy 12 39.4% Alertness 5 51.6% Creativity 13 35.5% Perseverance 6 28.0% Attention to Appearance 14 25.8% Tardiness 7 46.3% Organizational Skills 15 28.3% Absenteeism 8 65.2% Courtesy Sample Reports S-41 Copyright © Houghton Mifflin Company. All rights reserved. 8
- 25. Central Texas employees indicated the area they believed was most affected by stress and the area they believed was least affected by stress. According to the results, job satisfaction and productivity were thought to be most affected by stress. On the other end of the scale, areas least affected by stress were personal appearance and absenteeism. However, Schorr's (2001) study found that, on the average, individuals experiencing stress are more inclined to be absent or tardy. Programs Employers Offer Employees to Manage Stress Question four listed 17 programs offered by employers for managing stress. Respondents were asked to indicate which programs their companies had implemented to manage stress. The responses for each program are shown in Table 1.
- 26. Table 1: Programs Offered by Employers to Manage Stress. TYPE OF PROGRAM RESPONSES Insurance 72% Breaks 69.2% Educational Assistance/Reimbursement 51.0% Access for Disabled 42.6% Alternate Schedule 34.0% Employee Assistance Programs 34.0% Wellness Programs 34.0% Flextime 29.8% Stress Management Seminars 29.8% Training Programs 29.8% Piped Music 17.2% Assigned Parking 17.0%
- 27. Employee Empowerment Programs 17.0% Ergonomically Correct Furniture 17.0% Financial Counseling 8.5% On-Site/Assistance with Child Care 4.3% Sample Reports S-42 Copyright © Houghton Mifflin Company. All rights reserved. 9 Insurance received the highest number of responses (72.0%), whereas, therapy received the lowest (2.1%). Playing classical music and creating a comfortable work environment were found by Foster (2002) to be low cost stress reduction programs. Although these are inexpensive programs to implement, a relatively small response rate was given for piped music (17.2%) and ergonomically correct furniture (17.0%). Maurer (2002) stated that it is necessary for companies to design programs that enable employees to assess stressful situations and develop a rational mode of behavior. In contrast to Maurer's research, only 17.0% of the respondents indicated that Employee Empowerment Programs are being offered by their employer. A
- 28. response rate of 34.0% in the category of wellness programs/on-site fitness facilities was obtained. Barden (2001) reported programs that improve an individual's physical condition are both a positive and an effective method of managing stress. The remaining methods for managing stress were varied. Listed in decreasing percentages, they are as follows: breaks (69.2%), educational assistance/ reimbursement (51.0%), access for disabled (42.6%), alternative schedules (34.0%), Employee Assistance Programs (34.0%), Wellness Programs (34.0%) flextime (29.8%), stress management seminars/classes (29.8%), training programs (29.8%), assigned parking (17.0%), financial counseling (8.5%), and on- site/assistance with child care (4.3%). Conclusions On the basis of the findings, several conclusions concerning the effects of stress on Central Texas business employees can be drawn. The findings of this study indicated stress does negatively affect the work performance of employees. Job satisfaction and productivity were indicated as two areas most affected by work-related stress. Therefore, stress cannot be considered just an individual issue because reduced job satisfaction and lower productivity has a direct effect on the company as a whole.
- 29. From this study, it can be concluded that employers have realized the importance of managing stress in the workplace because of the wide variety of programs now offered to manage stress. Of all the programs offered by employers, insurance is the most frequently offered means for managing stress. Because insurance acts as a security net for employees and is offered the most, it can be inferred that employers contend that insurance is the most effective means for managing stress. Sample Reports S-43 Copyright © Houghton Mifflin Company. All rights reserved. 10 Recommendations Based on the findings and conclusions in this study, the following recommendations are made: 1. Employers should offer various stress reduction programs to help employees
- 30. manage stress because stress is prevalent in the workplace. 2. Employers should conduct a survey of the programs they already offer to discover which programs are the most effective for managing their employees' stress. 3. Employees should share their ideas for managing stress with their employers in order to help their employers implement appropriate stress reduction programs. 4. Educators should incorporate into their business curriculum discussions of stress in the workplace and ways to manage stress. 5. Additional research should be done. First, other areas negatively affected by stress should be studied to determine if stress affects other aspects of an employee's life. In addition, other factors should be examined to learn what the personal and work-related causes and symptoms of stress are for an individual.
- 31. Sample Reports S-44 Copyright © Houghton Mifflin Company. All rights reserved. 11 Bibliography Barden, Nancy Ray. "Wellness Programs: Everyone Wins." Commerce and Health, November 2001, 28–42. Foster, Lucy Barnes. "Workplace Stress: Changing the Pattern." Sales and Marketing Journal (2002), 32–33. Harrold, Robert and Wayland, Michael. "New Methods to Reduce Workplace Stress." Industrial Concepts, June 2002, 19–21. Maurer, Marcia K. "Is Stress Running Your Life?" Modern Office Innovation, February 2002, 27–28. Schorr, Leslie. "Coping with Stress, Boosting Productivity."
- 32. Employment News, Spring 2001, 23–26.
- 33. Sample Reports S-45 Copyright © Houghton Mifflin Company. All rights reserved. Appendix A Questionnaire The Effects of Stress on Business Employees Students in the Graduate School of Business at Southwest Texas State University are conducting this survey to determine perceptions of the effects of stress on employees. The survey also is designed to determine efforts employers are making to help employees manage stress. Please return this questionnaire in the enclosed postage-paid envelope by Friday, November 8. 1. How does stress most often affect you at work? Please mark one response per line.
- 35. Productivity Job Satisfaction/Morale Absenteeism Decision Making Abilities Accuracy Creativity Attention to Personal Appearance Organizational Skills Courtesy Cooperation Initiative Reliability Alertness Perseverance T di Sample Reports S-46 Copyright © Houghton Mifflin Company. All rights reserved. 13 2. Which one area from question 1 do you believe is most affected by stress? 3. Which one area from question 1 do you believe is least affected by stress?
- 36. 4. Which of the following means for managing stress does your employer offer? Please mark all that apply. __ Employee Assistance Program On-Site/Assistance with Child Care Assigned Parking Employee Empowerment Programs Educational Assistance/Reimbursement Breaks Wellness Program/On-Site Fitness Facility Financial Counseling Access for Disabled Stress Management Seminars/Classes Training Programs Therapy Alternative Schedules (part-time, time off for family, etc.) Flextime Piped Music Ergonomically Correct Furniture Insurance (security net for employee/family) Other (please specify) Note: Questions 5 and 6 are included in this questionnaire as a means of developing a demographic profile of our respondents. 5. Are you classified as a full-time employee by your employer?
- 37. Yes No 6. Please check your age group. Less than 20 40 to 49 20 to 29 50 to 59 30 to 39 60 or over Thank you for taking time to help us. We value your input. Structure of a Data Analysis Report A data analysis report is somewhat different from other types of professional writing that you may have done or seen, or will learn about in the future. It is related to but not the same as: • A typical psych/social science paper orgainzed around “intro/methods/analysis/results/discussion” sections. • A research article in an academic journal. • An essay.
- 38. • A lab report in a science class. The overall structure of a data analysis report is simple: 1. Introduction 2. Body 3. Conclusion(s)/Discussion 4. Appendix/Appendices The data analysis report is written for several different audiences at the same time: • Primary audience: A primary collaborator or client. Reads theIntroduction and perhaps the Conclusionto find out what you did and what your conclusions were, and then perhaps fishes/skims through theBody, stopping only for some additional details on the parts thathe/she thought were interesting or eye-catching.Organize the paper around an agenda for a conversation you want to have with this person about what you’ve learned about their data: e.g., from most general to most specific, or from most important to least important, etc. Provide the main evidence from your analysis (tabular, graphical, or otherwise) in the Bodyto support each point or conclusion you reach, but save more detailed evidence, and other ancillary material, for the Appendix. • Secondary Audience: An executive person.Probably only skims theIntroduction and perhaps the ulConclusionto find out what you did and what your conclusions are.Leave signposts in the
- 39. Introduction, Bodyand Conclusionto make it easy for this person to swoop in, find the “headlines” of your work and conclusions, and swoop back out. • Secondary Audience: A technical supervisor.Reads theBody and then examines theAppendix for quality control: How good a job did you do in (raising and)answering the interesting questions? How efficient were you? Did you reach reasonable conclusions by defensible statistical methods? Etc. Make specific cross-references between the Bodyand specific parts of the Appendixso that this person can easily find supporting and ancillary material related to each main analysis you report in theB ̆ ody. Add text to the technical material in the Appendixso that this person sees how and why you carried out the more detailed work shown in the Appendix. 1 The data analysis report has two very important features: • It is organized in a way that makes it easy for different audiences to skim/fish through it to find the topics and the level of detail that are of interest to them. • The writing is as invisible/unremarkable as possible, so that the content of the analysis is what the reader remembers, not distracting quirks or tics in the writing. Examples of distractions include: – Extra sentences, overly formal or flowery prose, or at the other extreme overly casual or overly brief prose.
- 40. – Grammatical and spelling errors. – Placing the data analysis in too broad or too narrow a contextfor the questions of interest to your primary audience. – Focusing on process rather than reporting procedures and outcomes. – Getting bogged down in technical details, rather than presenting what is necessary to properly understand your conclusions on substantive questions of interest to the primary audience. It is less important to worry about the latter two items in theAppendix which is expected to be more detailed and process-oriented. However, there should be enough text annotating the technical material in the Appendix so that the reader can see how and why you carried out the more detailed work shown there. The data analysis report isn’t quite like a research paper orterm paper in a class, nor like a research article in a journal. It is meant, primarily, to start an organized conversation between you and your client/collaborator. In that sense it is a kind of “internal” communication, sort of like an extended memo. On the other hand it also has an “external” life, informing a boss or supervisor what you’ve been doing. 2
- 41. Now let’s consider the basic outline of the data analysis report in more detail: 1. Introduction. Good features for the Introduction include: • Summary of the study and data, as well as any relevant substantive context, background, or framing issues. • The “big questions” answered by your data analyses, and summaries of your conclusions about these questions. • Brief outline of remainder of paper. The above is a pretty good order to present this material in aswell. 2. Body. The body can be organized in several ways. Here are two that often work well: • Traditional. Divide the body up into several sections at the same level as the Introduction, with names like: – Data – Methods – Analysis – Results This format is very familiar to those who have written psych research papers. It often works well for a data analysis paper as well, though one problem with it is that the Methods section often sounds like a bit of a stretch: In a psych research paperthe Methods section describes
- 42. what you did to get your data. In a data analysis paper, you should describe the analyses that you performed. Without the results as well, this can be pretty sterile sounding, so I often merge these “methods” pieces into the “Analysis” section when I write. • Question-oriented. In this format there is a single Body section, usually called“Analysis”, and then there is a subsection for each question raised in theintroduction, usually taken in the same order as in the introduction (general to specific, decreasing order of importance, etc.). Within each subsection, statistical method, analyses, andconclusion would be described (for each question). For example: 2. Analysis 2.1 Success Rate Methods Analysis Conclusions 2.2 Time to Relapse Methods Analysis Conclusions 3 2.3 Effect of Gender Methods Analysis
- 43. Conclusions 2.4 Hospital Effects Methods Analysis Conclusions Etc. . . Other organizational formats are possible too. Whatever the format, it is useful to provide one or two well-chosen tables or graphs per questionin the body of the report, for two reasons: First, graphical and tabular displays can convey your points more efficiently than words; and second, your “skimming” audiences will be more likely to have their eye caught by an interesting graph or table than by running text. However, too much graphical/tabular material will break up the flow of the text and become distracting; so extras should be moved to the Appendix. 3. Conclusion(s)/Discussion. The conclusion should reprise the questions and conclusions of the in- troduction, perhaps augmented by some additional observations or details gleaned from the analysis section. New questions, future work, etc., can also be raised here. 4. Appendix/Appendices.One or more appendices are the place to out details and ancillary materials. These might include such items as • Technical descriptions of (unusual) statistical procedures • Detailed tables or computer output
- 44. • Figures that were not central to the arguments presented in the body of the report • Computer code used to obtain results. In all cases, and especially in the case of computer code, it is a good idea to add some text sentences as comments or annotations, to make it easier for the uninitiated reader to follow what you are doing. It is often difficult to find the right balance between what to put in the appendix and what to put in the body of the paper. Generally you should put just enough inthe body to make the point, and refer the reader to specific sections or page numbers in the appendix for additional graphs, tables and other details. 4