Download to read offline
![Market Probe 3
FOPL Reports
• Ontario Public Library Operating Data 2001-2013: Overview, Primer on
Library Statistics and Collected Tables (81 page PDF)
– Introduction by Stephen Abram, MLS, Executive Director
– A Primer on Library Data by Robert Molyneux, PhD
– Key Ratios for Ontario Public Libraries, 2013
– Population and Circulation at Ontario Public Libraries, 2001-2013, All Reporting Each
Year
– Programs Held and Program Attendance Ontario Public Libraries, 2001-2013, All
Reporting Each Year
– Selected Expenditures at Ontario Public Libraries, 2001-2013, All Reporting Each Year
– Selected Digital Materials, Held by Ontario Public Libraries, 2001-2013, All Reporting
EACH Year
– Circulations per capita and per active cardholder,2013, Ranked by Bands
– Expenditures per capita and per active cardholder, 2013, Ranked by Bands
– Total Operating Expenditures and Materials Expenditures, 2001-2013, [summary and
by bands]
– Active Cardholders as a Percentage of Population (Resident) at Ontario’s Public
Libraries, 2001-2013
– Circulation per capita and per active cardholders, Ontario Public Libraries, 2001-2013
– Sources of data used in these reports
• http://fopl.ca/news/fopl-member-benefit-performance-measures-for-ontario-
public-libraries/
• Each chapter has a separate blog posting as well for June 30-Sept 8.](https://image.slidesharecdn.com/celuplpoll2015-151109145327-lva1-app6892/85/Celupl-poll2015-3-320.jpg)

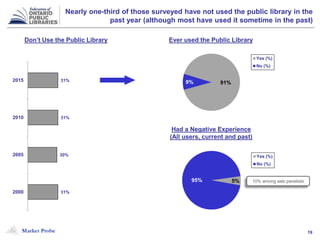
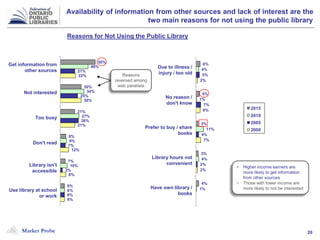
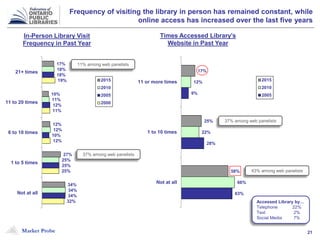
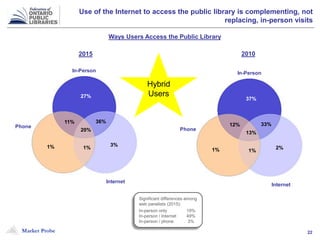
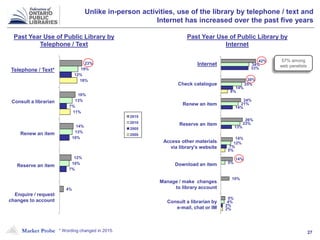
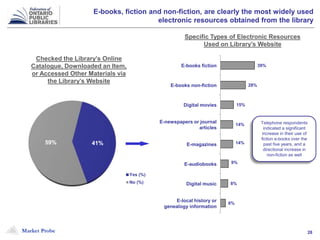
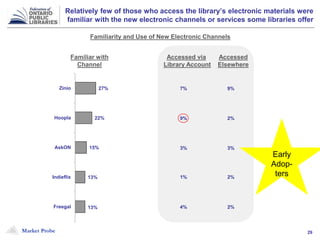
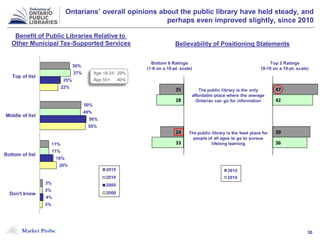


The document provides information from a market probe conducted by the Federation of Ontario Public Libraries (FOPL) in 2015. It includes: - Statistics and measurements strategies undertaken by FOPL, including participating in task forces, hosting symposia, publishing analyses and polls. - Reports published by FOPL, including an overview of Ontario public library operating data from 2001-2013, a market probe public opinion poll from May 2015, and a presentation on the 2015 poll. - Findings from the public opinion poll showing that while in-person library visits have remained steady, online access has increased, and usage patterns have evolved with more people using both online and in-person services.


