Download to read offline


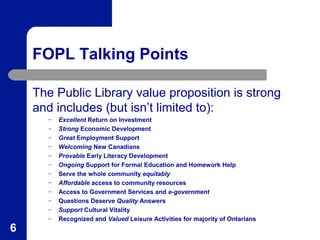


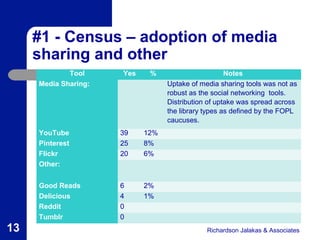


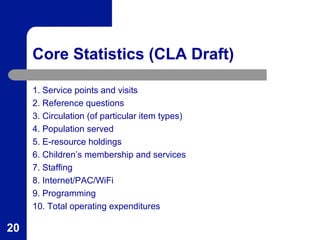


The document provides an overview of recent activities by the Federation of Ontario Public Libraries (FOPL). FOPL advocates for public libraries in Ontario and provides services focused on advocacy, marketing, research, and consortia purchasing. Recent activities include advocacy training webinars, research on branding and social media use by Ontario libraries, and planning for a summit on the future of libraries. FOPL is also working to develop standardized impact metrics and measurements to help libraries communicate their value in areas like early literacy, economic impact, and return on investment.


