Download to read offline

![Library data have a long history
We have fragmentary numbers of collections
of a number of these libraries
– And like modern library numbers, we are not
always sure exactly what they mean
Adriano Balbi, A Statistical Essay of the
Libraries of Vienna and the World [1835]
– First modern attempt at comparing libraries in
major European cities using published statistics
about them10](https://image.slidesharecdn.com/foplolascstatswithmolyneux-160119192958/75/Fopl-ola-sc-stats-with-molyneux-10-2048.jpg)

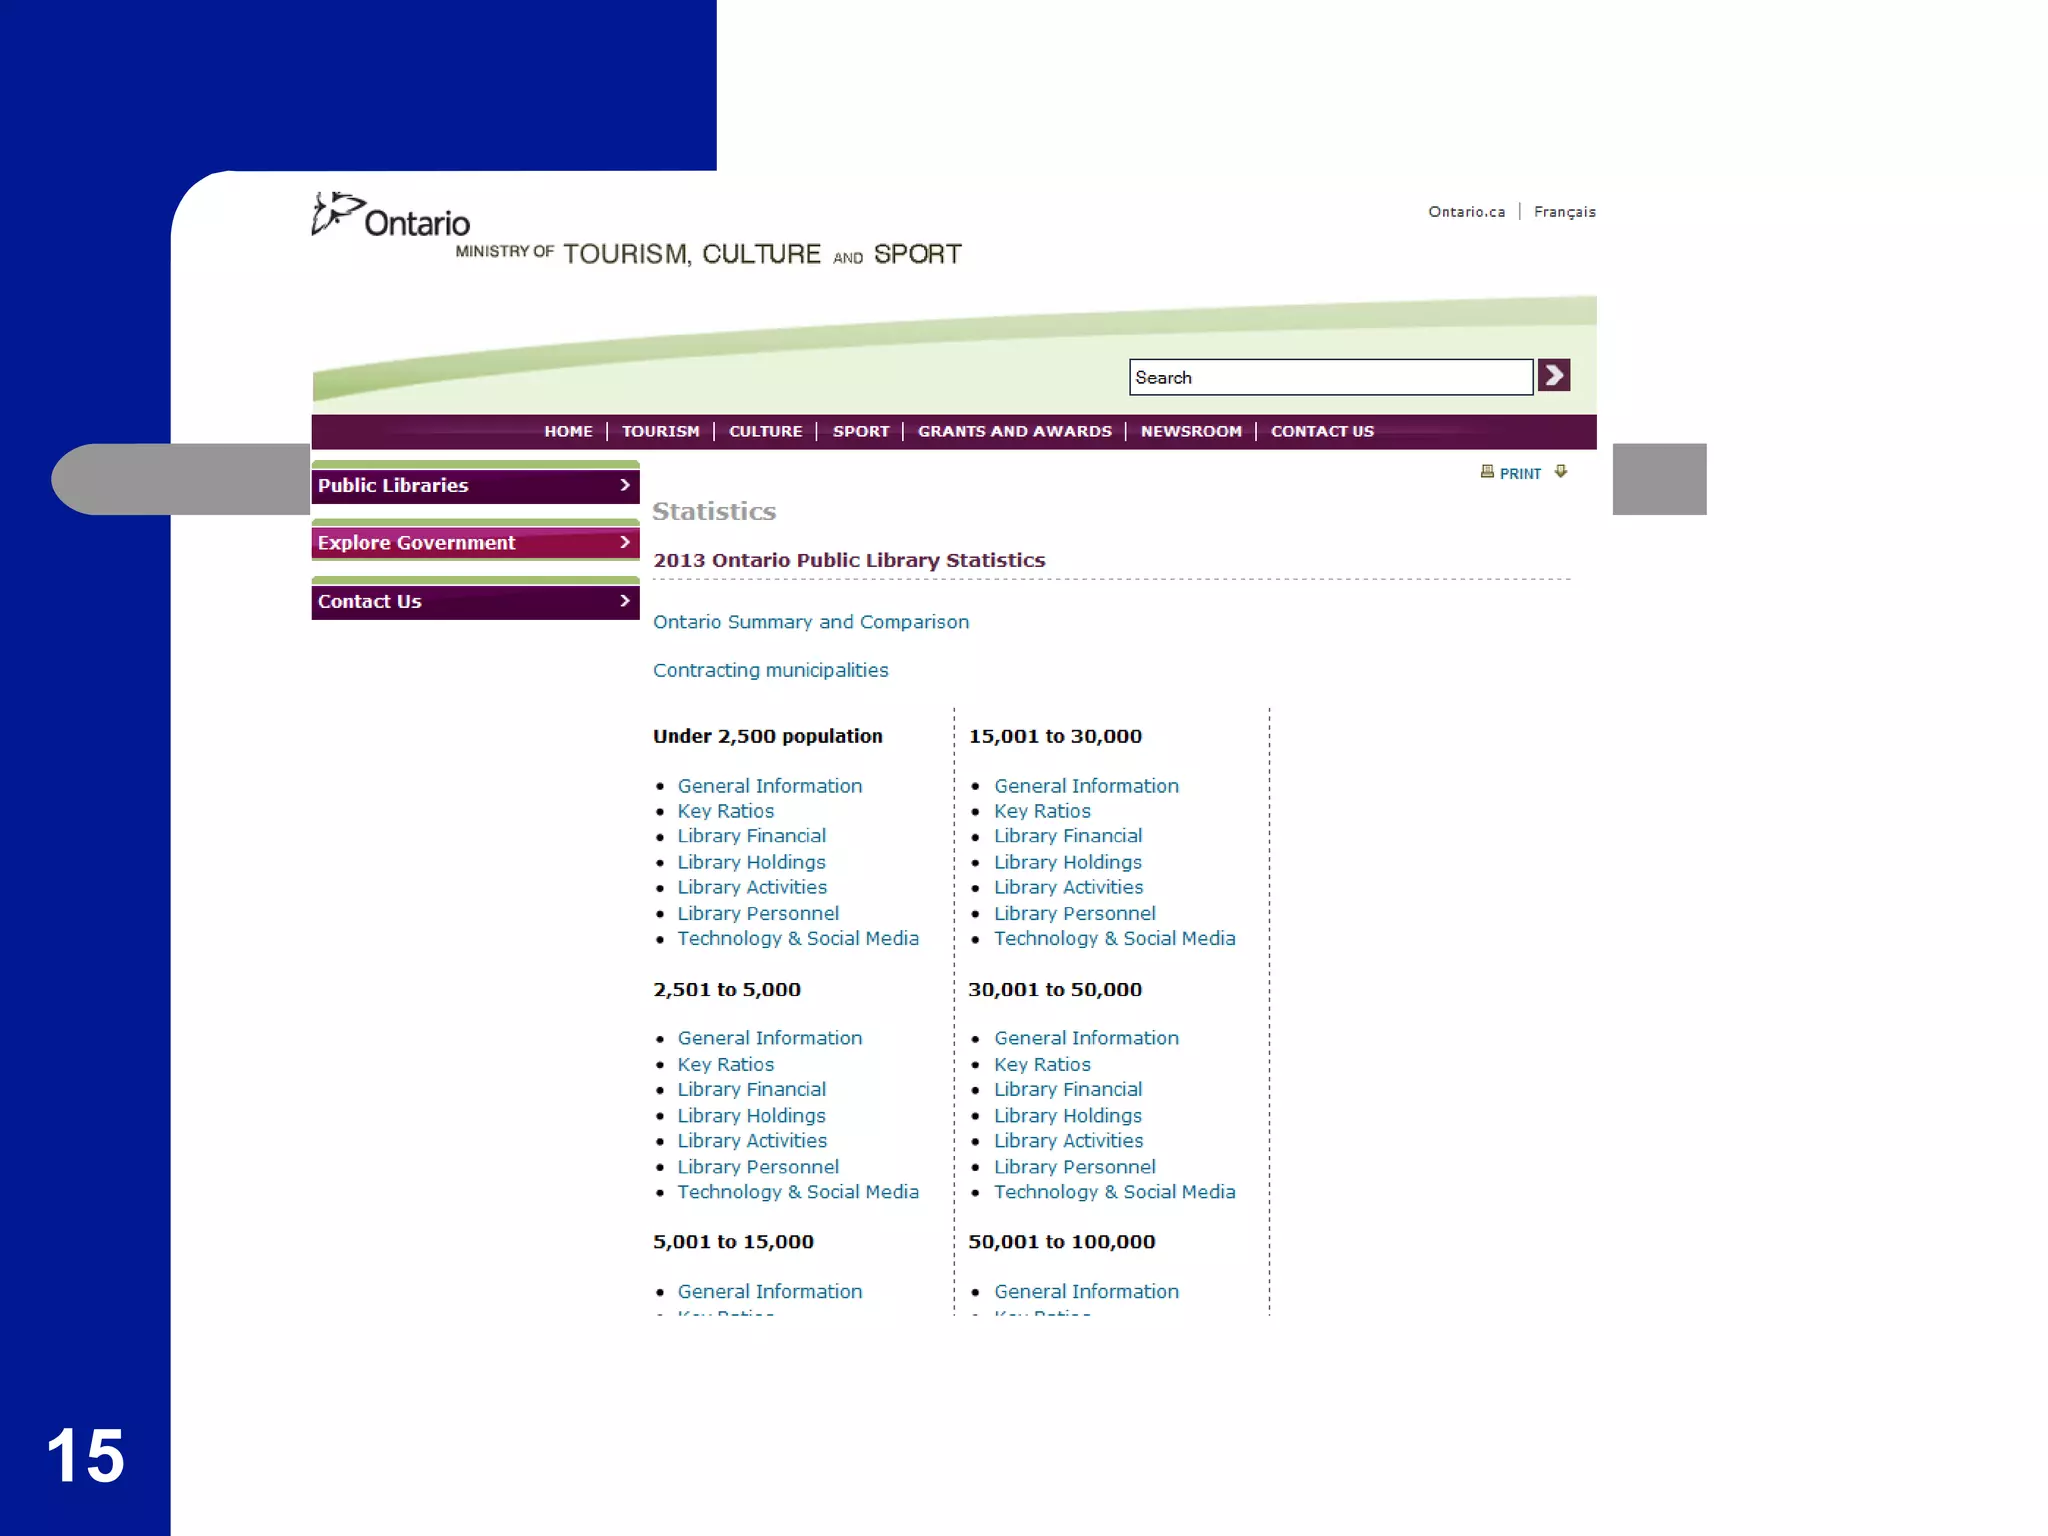


This document summarizes a presentation given by Dr. Robert Molyneux and Stephen Abram on FOPL's Ontario Public Library Statistics and Measurements Report. It provides an overview of the report, which analyzes trends in Ontario public library statistics from 2001-2013 using data collected by the Ministry of Tourism, Culture and Sport. Key findings include that circulation and visits have remained steady while digital transactions are growing. The presentation examines the data through ratios, band comparisons based on library size, and rank order tables. It cautions that library statistics are complex and recommends qualitative surveys to better understand changing user needs.


