Download to read offline
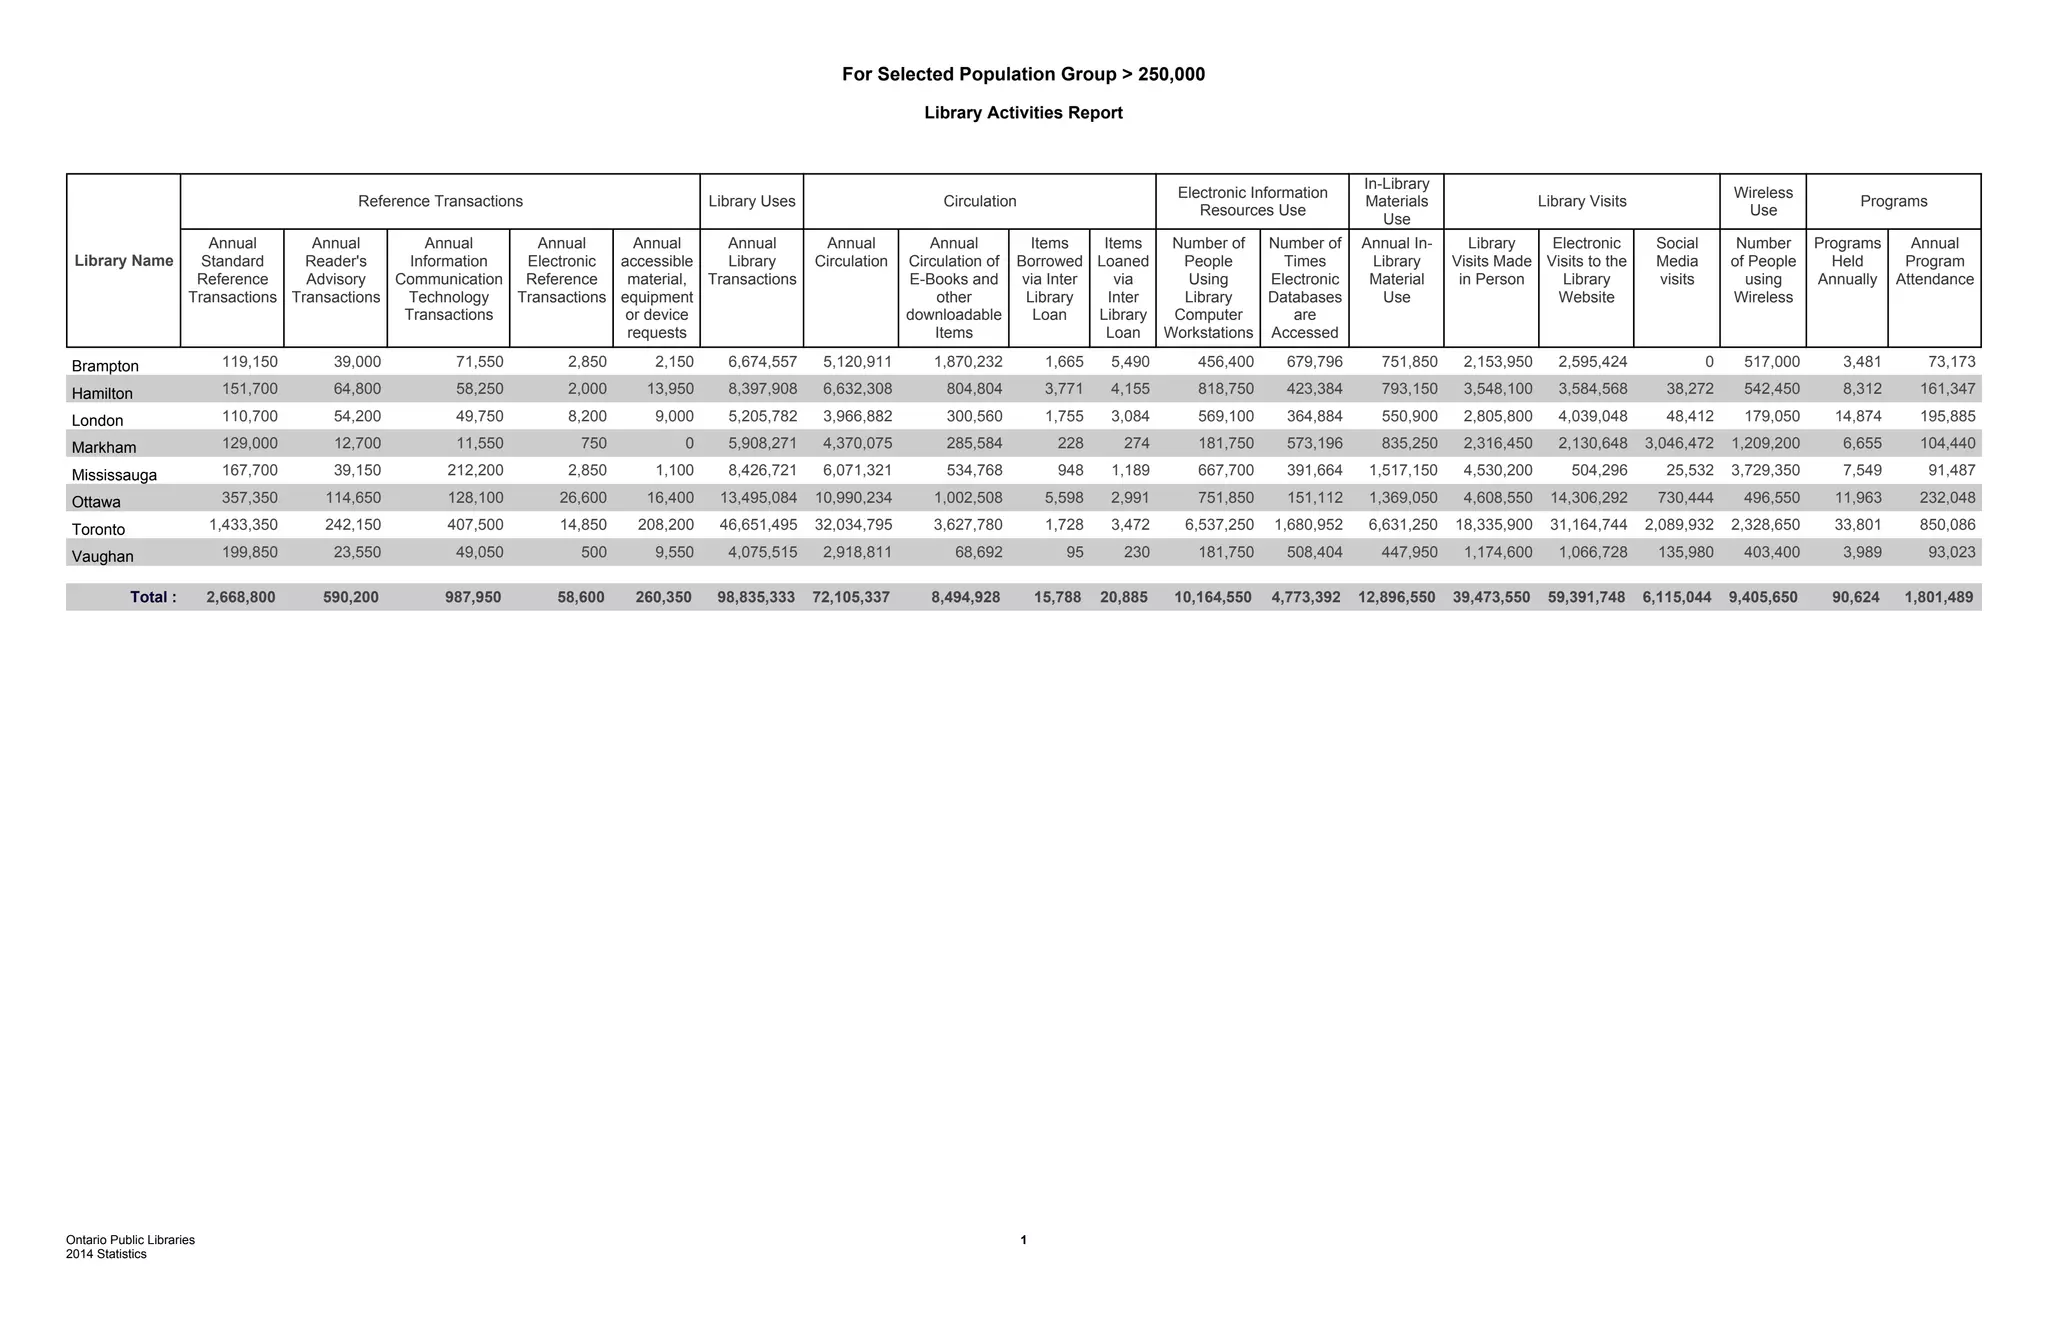


This document contains statistics from 2014 about library activities and usage for several Ontario cities with populations over 250,000. It includes data on reference transactions, circulation, electronic resources usage, in-library materials use, visits, wireless use, and programs. The cities reported millions of annual transactions, circulations, website and database visits, library visits, and program attendances. A graph at the end shows key ratios such as electronic visits to the library website and in-person visits per capita, as well as program attendance per active card holder and per capita.


