Download to read offline


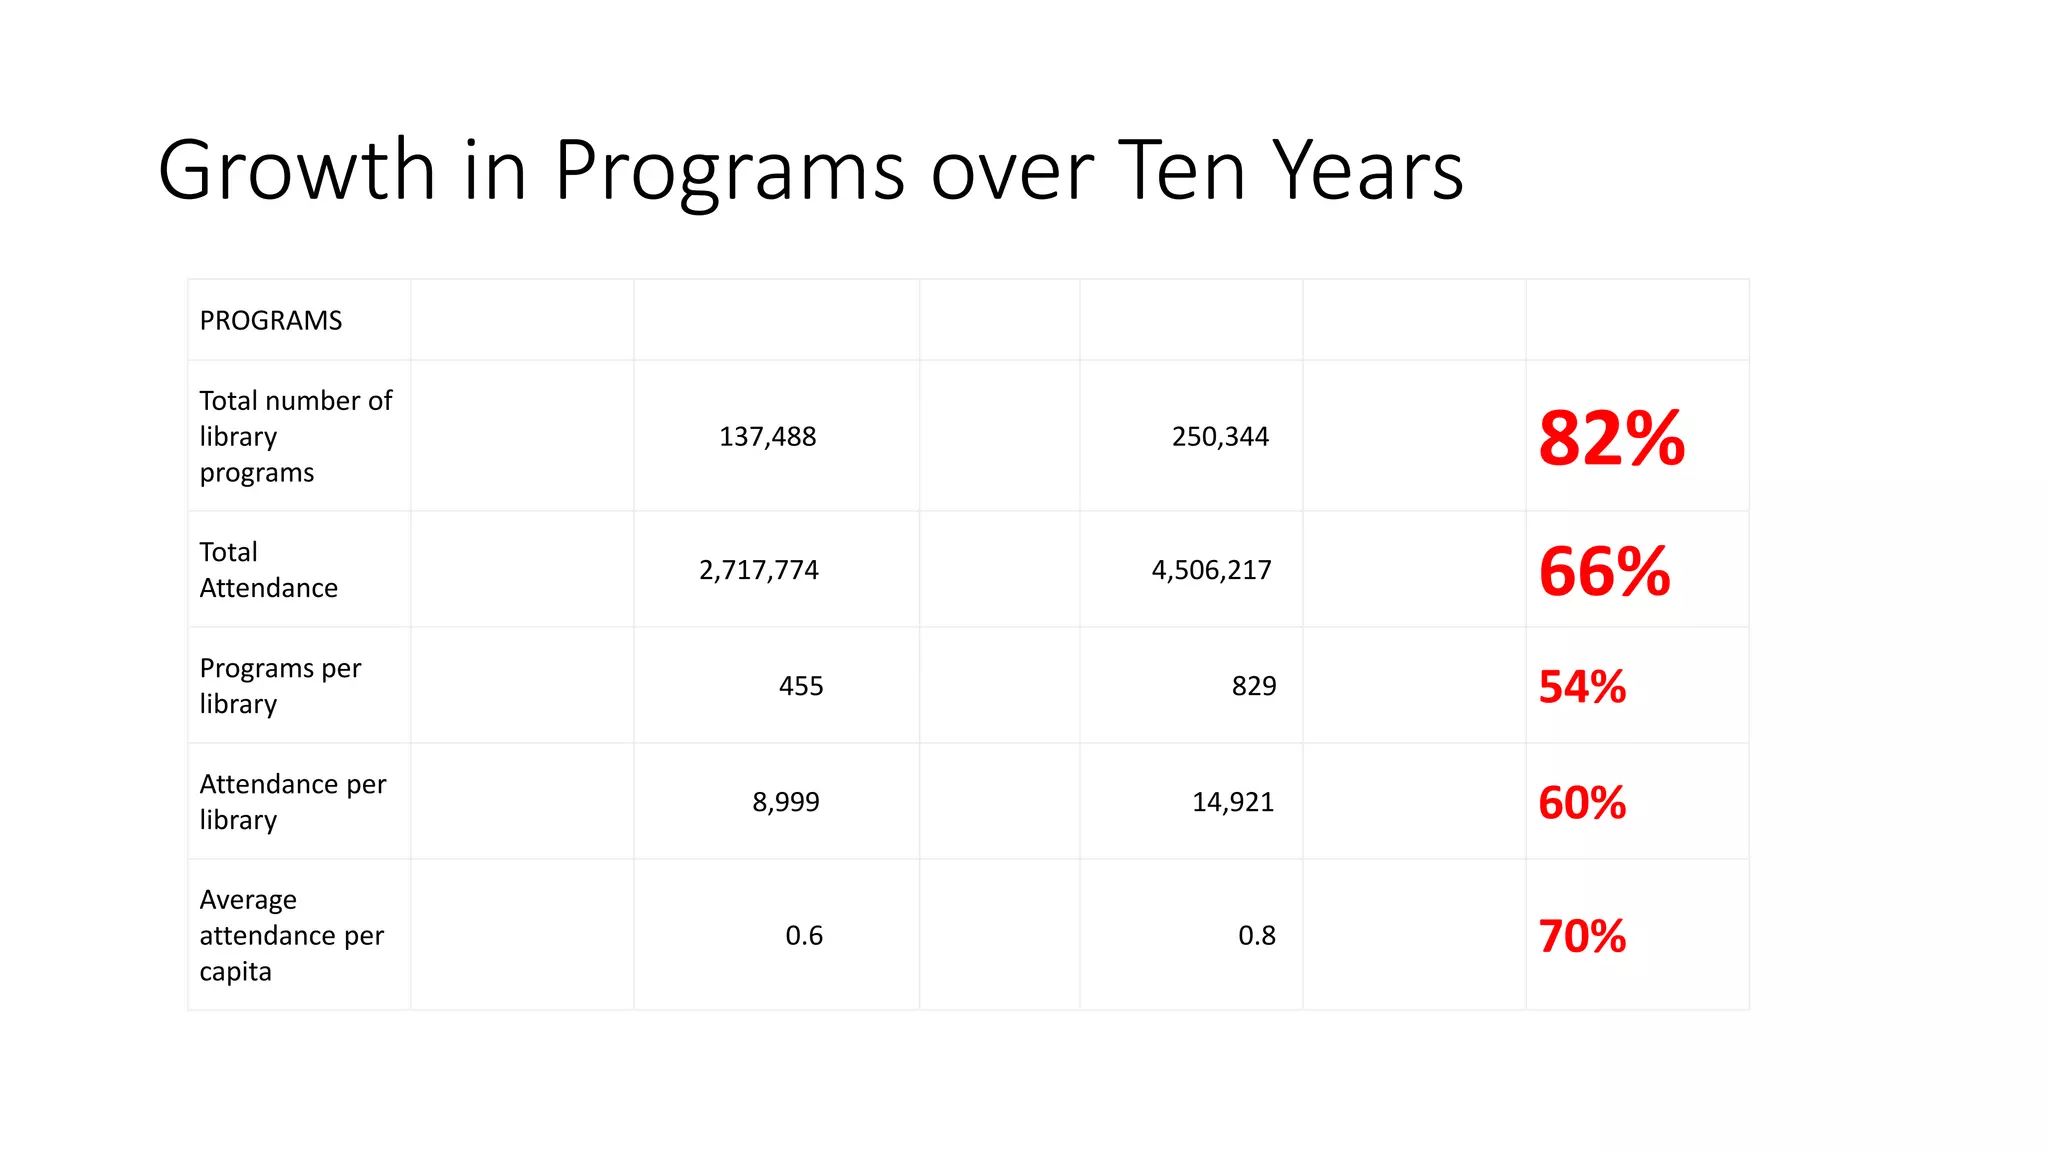


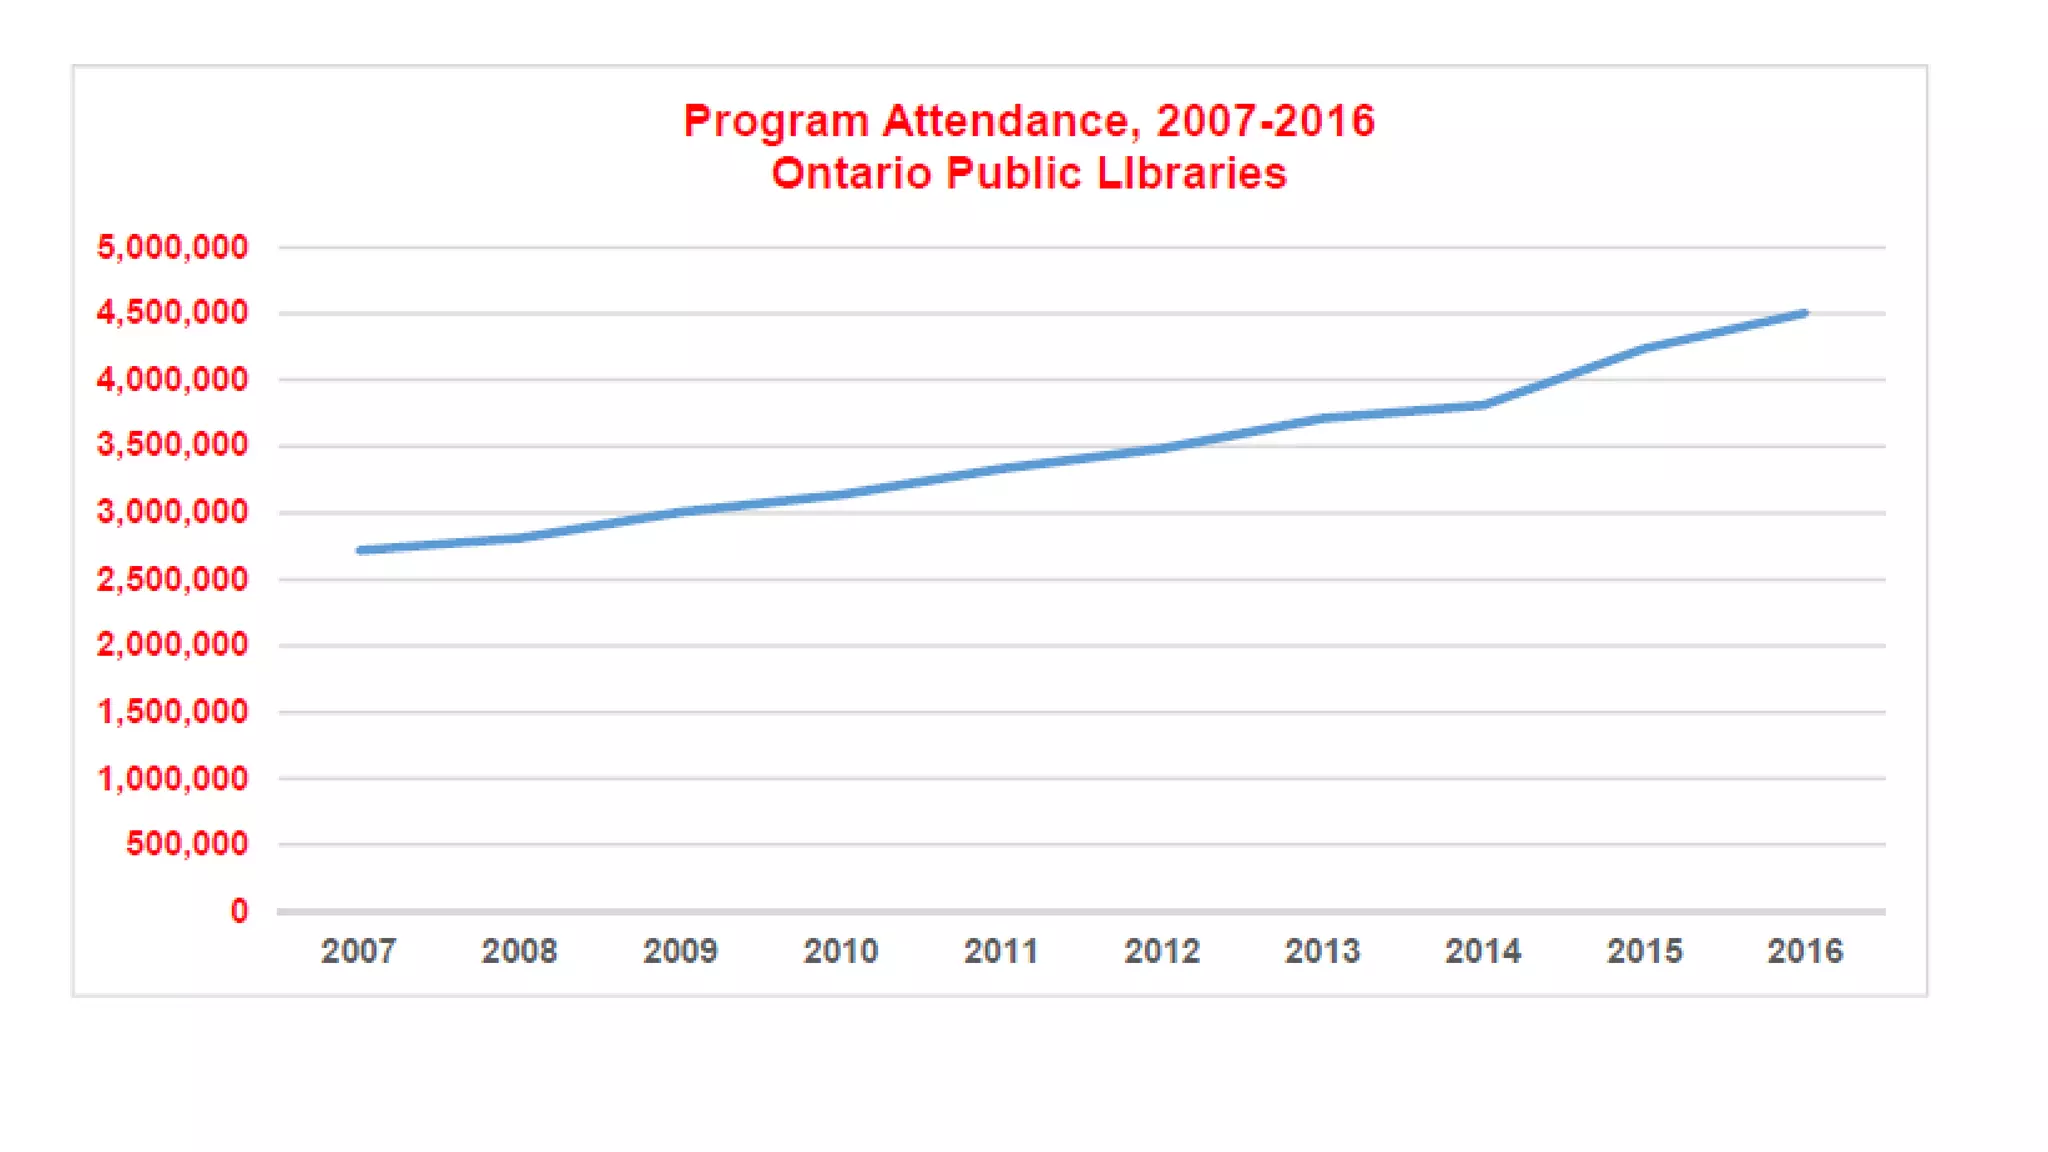


This document provides information from a presentation given by Stephen Abram to the Federation of Ontario Public Libraries on provincial elections and the value of public libraries. Some key points: - Ontario's 305 public library systems serve over 99% of the population and see over 80 million in-person visits annually, with digital services doubling that number. - Public libraries offer many programs and services like literacy support, career help, genealogy resources, and more that attracted over 4.5 million residents in 2016. - The public library value proposition includes a strong return on investment, economic and business support, access to technology, support for newcomers, and more. - The 2018 provincial election is an opportunity to advocate for


