1. P Value
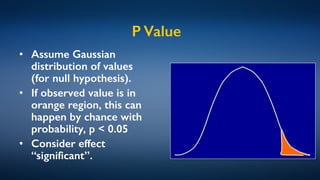
• Assume Gaussian
distribution of values
(for null hypothesis).
• If observed value is in
orange region, this can
happen by chance with
probability, p < 0.05
• Consider effect
“significant”.
3. p-Hacking
• Multiple hypothesis testing
• For a given single hypothesis, a p-value of 0.05
says that there is only a 5% probability of
observing values by chance, without the
hypothesis being true.
• What if you test 100 independent hypotheses?
• One gene chip can have 20,000 genes.
4. Unreported Failures
• Independent hypotheses, tested in parallel, can have
statistics developed to correct for multiple tests.
• What about sequential hypotheses, each slightly
different from the previous?
• E.g. a pharma company develops dozens of drug
candidates, and tests them independently.
– Most fail, a few succeed.
5. Exploratory Analysis
• What if you devised your hypothesis to
fit the observed data?
• Often, exploration is the first phase
of data analysis.
• Separate exploratory (training) data from test
data on which evaluation is reported.
6. Algorithmic Fairness
• Humans have many biases.
– No human is perfectly fair, even with the best of intentions.
• Biases in algorithms usually easier to measure, even
if outcome is no fairer.
• Mathematical definitions of fairness can be applied,
proving fairness, at least within the scope of the
assumptions.
7. Attributions
Cartoon by Scott Hampson is licensed CC BY-NC-ND
Headline from Wall Street Journal Blog is reproduced as Fair Use.
Staples company logo is reproduced as Fair Use.
All other graphics are the creation of the author.