
Recommended
Recommended
More Related Content
Similar to The projectAboveWay Sandwich - ProjectYou are a Master Black Belt .docx
Similar to The projectAboveWay Sandwich - ProjectYou are a Master Black Belt .docx (20)
More from ssusera34210
More from ssusera34210 (20)
Recently uploaded
Recently uploaded (20)
The projectAboveWay Sandwich - ProjectYou are a Master Black Belt .docx
- 1. The projectAboveWay Sandwich - ProjectYou are a Master Black Belt working with AboveWay Sandwich, Inc. to improve the franchises' customer satisfaction. The process is simple.Your assignment is to improve customer satisfaction by working with variousGreen Belts and Black Belts. To successfully pass the course, you must complete all of the deliverables (tabs below) to the satisfaction of your instructor. Select Bread Assemble Wrap and Pay Excel examplesHow you can use Excel This spreadsheet tab provides illustrations of adding the DATA ANALYSIS capability to your Excel software.If you see Data Analysis already listed under the Tools tab, you are set. If you do not see Data Analysisfollow the instructions in the Green tab.Excel 2003 instructions Diane Johnson: Instructor Excel 2003: Click on the TOOLS tab in the top bar of Excel. If your computer already has the “Data Analysis” option listed, you are ready to go. Your Data Analysis tools have already been added. Under the Data Analysis Function you will find some of the more advanced functions that we will be discussing such as ANOVAs, and t tests. If you do not see Data Analysis listed under the TOOLS tab, I encourage you to go to the Help function in Excel for specific instructions on how to load “the Data Analysis Toolpak” in your version of Excel. Here are the easy standard instructions for Excel 2003 if you
- 2. need to load the Add-Ins. 1) On the Tools menu, click Add-Ins. 2) In the Add-Ins available box, select the check box next to Analysis Toolpak, and then click OK. 3) When you load the Analysis Toolpak, the DATA ANALYSIS command is automatically added to the TOOLS menu. If your version if slightly different than the above, refer to your HELP function for details on loading Tookpak. Remember that the Data Analysis function is NOT necessary for the course, but it is helpful. If you would like to print this tip, right click on the cell and select EDIT COMMENT. Then just highlight and copy the text, and paste in a document for printing.Excel 2003 or earlier versions of Excel exampleThis spreadsheet tab provides illustrations of adding the DATA ANALYSIS capability to your 2007 Excel software.If you see Data Analysis already listed under the DATA tab, you are set. If you do not see Data Analysisfollow the instructions in the Green tab.Excel 2007 instructions Diane Johnson: Instructor Excel 2007: The Analysis ToolPak is a Microsoft Office Excel add-in program that is available when you install Microsoft Office or Excel. To use it in Excel, however, you need to load it first. 1. Click the Microsoft Office Button , and then click Excel Options at the bottom. 2. Click Add-Ins, and then in the Manage box, select Excel
- 3. Add-ins. 3. Click Go. 4. In the Add-Ins available box, select the Analysis ToolPak check box, and then click OK. If you get prompted that the Analysis ToolPak is not currently installed on your computer, click Yes to install it. 5. After you load the Analysis ToolPak, the Data Analysis command is available in the ANALYSIS group on the DATA tab. Remember that the Data Analysis function is not required for the course. If you would like to print this tip, right click on the cell and select EDIT COMMENT. Then just highlight and copy the text, and paste in a document for printing. Diane Johnson: Instructor Excel 2003: Click on the TOOLS tab in the top bar of Excel. If your computer already has the “Data Analysis” option listed, you are ready to go. Your Data Analysis tools have already been added. Under the Data Analysis Function you will find some of the more advanced functions that we will be discussing such as ANOVAs, and t tests. If you do not see Data Analysis listed under the TOOLS tab, I encourage you to go to the Help function in Excel for specific instructions on how to load “the Data Analysis Toolpak” in your version of Excel.
- 4. Here are the easy standard instructions for Excel 2003 if you need to load the Add-Ins. 1) On the Tools menu, click Add-Ins. 2) In the Add-Ins available box, select the check box next to Analysis Toolpak, and then click OK. 3) When you load the Analysis Toolpak, the DATA ANALYSIS command is automatically added to the TOOLS menu. If your version if slightly different than the above, refer to your HELP function for details on loading Tookpak. Remember that the Data Analysis function is NOT necessary for the course, but it is helpful. If you would like to print this tip, right click on the cell and select EDIT COMMENT. Then just highlight and copy the text, and paste in a document for printing.Excel 2007 example COPQObjective:Your first action as the new Master Black Belt is to collect data on the quality costs associated with the current system.Accounting provides you with the following results for the past year.Instructions for you:You think it would be useful to get an idea of the Cost of Poor Quality for the organization.Your mission is to put the costs into the appropriate buckets. Buckets meaning, the cost of doing business, internal failures, external failures, appraisal, and prevention costs. Once your analysis matches your instructor's analysis, you can determine 'what's next.'Data:Raw Materials (ingredients for sandwiches)$53,200.00Scrapped Meat and Vegetables (damaged during food preparation)$2,416.00Incoming Inspection (of ingredients)$3,700.00Six Sigma Projects$420.00Obsolete / expired food$864.00Training for counter
- 5. help$2,097.00Corporate audits to verify store compliance with policies$3,789.00Procedures for counter help$1,574.00Electricity$1,196.00Fines from Health Inspectors$2,000.00Rent$24,020.00Scrapped Burned bread$485.00Cost to pre-package meats in individual serving portions$297.00Free meals given to customers with complaints$1,457.00Supervisor sign-off/approval for credit card sales$348.00Business Bureau membership$500.00Training for incoming inspection$368.00Loss of business due to customer dissatisfaction$6,603.00TOTAL$105,334.00AboveWay Sandwich, Inc. Customer Satisfaction ImprovementDeliverable:Cost of poor qualityStudent last name:Your last name hereThe categories are: Cost of doing business, Internal Failures, External Failures, Appraisal, and Prevention.For each of the following, please choose the appropriate COPQ category. Type in your responses. If you are100% correct when you choose each catagory, your analysis will match your instructor's analysis of the same data. Raw Materials (ingredients for sandwiches)Type hereScrapped Meat and Vegetables (damaged during food prep)Type hereIncoming Inspection (of ingredients)Type hereSix Sigma ProjectsType hereObsolete / expired foodType hereTraining for counter helpType hereCorporate audits to verify store compliance with policiesType hereProcedures for counter helpType hereElectricityType hereFines from Health InspectorsType hereRentType hereScrapped Burned breadType hereCost to pre- package meats in individual serving portionsType hereFree meals given to customers with complaintsType hereSupervisor sign-off/approval for credit card salesType hereBusiness Bureau membershipType hereTraining for incoming inspectionType hereLoss of business due to customer dissatisfactionType hereSelf check daniel-munson: Instructor: For Cost of Doing Business, your instructor calculated ~$80k
- 6. For Prevention, your instructor calculated ~$4k For Appraisal, your instructor calculated ~$8k For Internal Failure, your instructor calculated ~$4k For External failures, your instructor calculated ~$10kWhat is the total cost of doing business?Type here : Your answer should be between $78,000 and $81,000.What is the total internal failures cost?Type here : Your answer should be between $3,000 and $5,500.What is the total external failures cost?Type here : Your answer should be between $8,000 and $11,000.What is the total appraisal cost?Type here : Your answer should be between $8,000 and $11,000.What is the total prevention cost?Type here : Your answer should be between $3,000 and $5,000.What is the total cost of quality?Type here : Your answer should be between $25,000 and $29,000.Based on these findings and COQ philosophy, what would you recommend to your Black Belt as the best strategy for addressing any problem areas shown and why?Type your recommendation here. (Use at most 50 words.) FMEAObjective:To provide a Black Belt with sound advice on how to address problems identified by an FMEA.Instructions for you:You are given this filled out FMEA for baking bread by a Black Belt who has been working with your store. Your assignment is to use the results of this FMEA to advise your Black Belt on which failure mode to focus on first and why,
- 7. based on FMEA philosophy. Data:POTENTIAL FAILURE MODESPOTENTIAL EFFECTS OF FAILURESEVERITY OF EFFECTPOTENTIAL CAUSES OF FAILUREPROBABILITY OF OCCURRENCECURRENT PROCESS CONTROLSPROBABILITY OF DETECTION / EASE OF CORRECTIONRPNWrong oven temperature set.Bread overcooked and must be scrapped.4Didn’t know that different types of bread required different baking temperatures – lack of training.Instructions on package.6248Didn’t read label on dough package.6144Label on dough package is wrong.124Temperature dial on oven is defective.372Bread not put into ovens on time.Bread is not done when customers arrive.6Didn’t know how long the bread needs to bake – lack of training.Checklist for store opening procedures.10160Got busy and forgot.6360Person normally responsible is out of work that day.2120Bread is forgotten in an oven left on overnight.Fire10Put bread in oven without setting the timer.Checklist for store closing procedures.6160Got busy and forgot to shut oven off after the timer went off.6360Person normally responsible is out of work that day.2120AboveWay Sandwich, Inc. Customer Satisfaction ImprovementDeliverable:Failure Modes and Effects Analysis (FMEA)Student last name:Your last name hereBased on FMEA philosophy, which failure mode (be specific) should your Black Belt focus on first and why? Type your recommendation here. (Use at most 25 words.) Value Stream MapWe're getting there…The team has made some major strides as can be seen below, but improvement was still needed, so the team created a Value Stream Map. You do not need to do anything with this spaghetti diagrams below - they are there simply for your entertainment! But, you have to admit, the one on the right is a whole lot more streamlined! (Smile!)Original spaghetti diagramSpaghetti diagram after realignmentObjective:The team decided to create a Value Stream Map to better understand the material and information flow of the process. The team observed the process for one hour
- 8. and documented their findings on the VSM shown below. The wait time between process steps varied with the number of customers in line, which ranged from 1 to 5 throughout the one- hour observation period. The team wants to better understand the elements of their process and identify any opportunities to reduce the lead time. To help create the future state map, the team will also need to calculate the takt time.Instructions for you:We want to make sure you can analyze a value stream map (VSM). Please refer to the VSM provided below and answer the following questions.1. What is the total lead time (min and max values)?Help! : Instructor: The minimum lead time (process time + wait time) represents the wait time experienced if there was one customer (minimum inventory between process steps). The maximum lead time would be the time it would take if there were many customers or a large order (maximum inventory between process steps). 2. What is the total processing time?Help! : Instructor: The sum of all of the cycle times for all PROCESS steps.3. What is the Process Cycle Efficiency (PCE)?Help! : Instructor: PCE = Value Add Time / Total Lead Time4. What is the takt time (sec) based on the information provided?Help! : Instructor: Takt Time = Available Time / Customer DemandData:AboveWay Sandwich, Inc. Customer Satisfaction
- 9. ImprovementDeliverable:Value Stream MapStudent last name:Your last name here1a) What is the total lead time (min value)?Type hereCheck daniel-munson: Instructor: You should get a value between 100 and 200 seconds. 1b) What is the total lead time (max value)?Type hereCheck daniel-munson: Instructor: You should get a value between 300 and 400 seconds. 2) What is the total processing time?Type hereCheck daniel-munson: Instructor: You should get a value between 0 and 100 seconds. : Instructor: The minimum lead time (process time + wait time) represents the wait time experienced if there was one customer (minimum inventory between process steps). The maximum lead time would be the time it would take if there were many customers or a large order (maximum inventory between process steps). : Instructor: The sum of all of the cycle times for all PROCESS steps. : Instructor: PCE = Value Add Time / Total Lead Time3) What is the Process Cycle Efficiency (PCE) for the maximum lead time?Type hereCheck daniel-munson: Instructor:
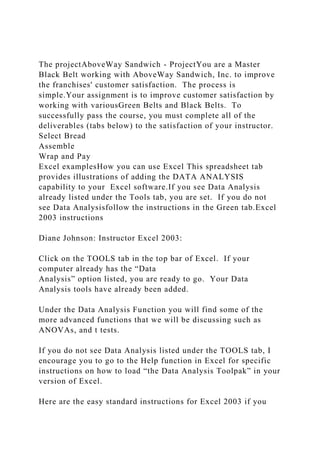
- 10. You should get a value between 0 and 25%. : Instructor: Takt Time = Available Time / Customer Demand4) What is the takt time (T/T)?Type hereCheck daniel-munson: Instructor: You should get a value between 1 and 60 seconds. 5) Which process step should your Black Belt focus on first to improve the process and why? HINT: There are 2 very good reasons for the correct first step based on VSM philosophy and the calculations made in this study - use them both in your answer!Type your recommendation here. (Use at most 50 words.) Control ChartObjective:Your Black Belts developed the following data and created this control chart for sandwich preparation times. They say that the process is stable and shows that the average prep time is 1.7512 minutes and that individual prep times will not exceed 1.9205 minutes. They also say that it's very good because it shows very little variation.Instructions for you:Part IDo you agree with their interpretation? (see chart below) HINT: Use the 11 Shewhart Rules for Stability as the basis for your decision.Data:Current Sandwich PrepTimes (in minutes)1.64341.86231.76111.70491.78881.74691.82231.77931 .71221.75621.67981.70131.77501.74001.81221.77781.72331.74 101.71431.7807Part IIYou and your team work to eliminate all known assignable causes from this process. You think you have accomplished this and collect the following data on the new process. Calculate the control chart center line and control limit values for an I-MR chart and use the 11 Shewhart Rules for Stability to determine if this process is now stable.Revised Process Prep Times (in minutes)1.5361.5891.4821.5611.5471.5021.5061.5001.5501.542
- 11. 1.4321.5731.5921.5571.5021.5341.4821.4921.6001.518AboveW ay Sandwich, Inc. Customer Satisfaction ImprovementDeliverable:Control ChartStudent last name:Your last name hereDo you agree with their interpretation that the original process is stable?Type "YES" or "NO" hereIf "NO", please identify BY NAME which of the 11 Shewhart Tests for Stability EACH chart fails.I CHART:Type hereMR CHART:Type hereRevised Process Prep DataINDIVIDUALS CHART:What did you get for a center line? Type here (use 4 decimal places)What did you get for an upper control limit? Type here (use 4 decimal places)What did you get for a lower control limit? Type here (use 4 decimal places)Revised Process Prep DataMOVING RANGE CHART:What did you get for a center line? Type here (use 4 decimal places)What did you get for an upper control limit? Type here (use 4 decimal places)What did you get for a lower control limit? Type here (use 4 decimal places)Is the revised process stable?Type "YES" or "NO" hereIf "NO", please identify BY NAME which of the 11 Shewhart Tests for Stability EACH chart fails.I CHART:Type hereMR CHART:Type here RegressionObjective:A team member has been saying since day one that there is a relationship between wait time and customersatisfaction ratings (1 being the worst and 10 being the best). Should the team have listened? Perform correlation and regression analysis to see if she is correct. Instructions for you:PART 1 - Do you suspect the variables may be related? Determine the correlation coefficient as well as perform a regression analysis on the data provided to answer the questions below.PARTS 2 & 3 - The team suspects that the time of day may have an effect on the results, so the team decides toperform another analysis by analyzing the same results sorting by the time of day (lunch or dinner). Perform the same analysis as PART 1, however be sure to use only the data for the respective time ofday. Perform one analysis with the 30 data points for Lunch and another analysis for the 30 data pointsfor Dinner and answer the questions below. Data:Time of DayWait Time
- 12. (minutes)Customer Satisfaction (1-10)Lunch9.55487Scatter diagrams in Excel 2003 Diane Johnson: Instructor: 1) Click on Chart icon on top task bar, OR Click on the INSERT menu option at the top menu bar. 2) Click on SCATTER from the Standard Types tab 3) Click Next 4) Highlight both columns of data and finish according to the directions. If you would like to print this tip, right click on the cell and select EDIT COMMENT. Then just highlight and copy the text, and paste in a document for printing.Lunch21.49503Lunch26.39151Scatter diagrams in Excel 2007 Diane Johnson: Instructor: 1) Highlight both rows of data 2) Click INSERT tab at the top 3) Go to CHART category 4) Click on SCATTER and your scatter diagram appears If you would like to print this tip, right click on the cell and select EDIT COMMENT. Then just highlight and copy the text, and paste in a document for printing.Lunch11.70576Lunch15.51915Correlation Coefficient - Excel 2003
- 13. Diane Johnson: Instructor: 1) Click on the fx in the top bar and CORREL, or click on INSERT, function, CORREL. 2) Highlight each column of data as an ARRAY 3) Click Okay. 4) Excel will calculate the correlation coefficient. The correlation coefficient ranges between zero and one. Zero is no correlation and '1' is a perfect correlation. __________________________________________ -1.0 to -0.7 strong negative association. -0.7 to -0.3 weak negative association. -0.3 to +0.3 little or no association. +0.3 to +0.7 weak positive association. +0.7 to +1.0 strong positive association. If you would like to print this tip, right click on the cell and select EDIT COMMENT. Then just highlight and copy the text, and paste in a document for printing.Lunch28.77611Lunch27.71461Correlation Coefficient - Excel 2007 Diane Johnson: Instructor: 1) Click on the fx in the top bar and CORREL, or click on
- 14. FOMULAS, INSERT function, CORREL. 2) Highlight each column of data as an ARRAY 3) Click Okay. 4) Excel will calculate the correlation coefficient. The correlation coefficient ranges between zero and one. Zero is no correlation and '1' is a perfect correlation. __________________________________________ -1.0 to -0.7 strong negative association. -0.7 to -0.3 weak negative association. -0.3 to +0.3 little or no association. +0.3 to +0.7 weak positive association. +0.7 to +1.0 strong positive association. If you would like to print this tip, right click on the cell and select EDIT COMMENT. Then just highlight and copy the text, and paste in a document for printing.Lunch8.55757Lunch8.95408Regression Analysis - Excel 2003 Diane Johnson: Instructor: 1) To access the regression data analysis function in Excel, select the Data tab from the Tools menu above, and then choose Data Analysis. 2) Then click on Regression from the dialog box and then click OK.
- 15. 3) The first box is the Input Y range. Here, we tell Excel about our dependent variable. You can highlight the dependent variable column of data, including the column label. 4) Because we have included the column Label (row 21), which includes the variable name, we are going to have to tell Excel this, by clicking on the "Labels" checkbox. If you choose not to include the Label row (which may be the case for the Part 2 - Dinner analysis), you do not need to select the "Labels" option! 5) The second box is the Input X range, where we input the independent variables. You can highlight the independent variable column of data, including the column label. 6) Then click OK 7) The first part of the output is the regression statistics followed by the ANOVA table. If you would like to print this tip, right click on the cell and select EDIT COMMENT. Then just highlight and copy the text, and paste in a document for printing.Lunch18.03494Lunch4.05509Regression Analysis - Excel 2007 Diane Johnson: Instructor: 1) To access the regression data analysis function in Excel, select the Data tab from the Tools menu above, and then choose Data Analysis. 2) Then click on Regression from the dialog box and then click OK.
- 16. 3) The first box is the Input Y range. Here, we tell Excel about our dependent variable. You can highlight the dependent variable column of data, including the column label. 4) Because we have included the column Label (row 21), which includes the variable name, we are going to have to tell Excel this, by clicking on the "Labels" checkbox. If you choose not to include the Label row (which may be the case for the Part 2 - Dinner analysis), you do not need to select the "Labels" option! 5) The second box is the Input X range, where we input the independent variables. You can highlight the independent variable column of data, including the column label. 6) Then click OK 7) The first part of the output is the regression statistics followed by the ANOVA table. If you would like to print this tip, right click on the cell and select EDIT COMMENT. Then just highlight and copy the text, and paste in a document for printing. Diane Johnson: Instructor: 1) Click on Chart icon on top task bar, OR Click on the INSERT menu option at the top menu bar. 2) Click on SCATTER from the Standard Types tab 3) Click Next 4) Highlight both columns of data and finish according to the
- 17. directions. If you would like to print this tip, right click on the cell and select EDIT COMMENT. Then just highlight and copy the text, and paste in a document for printing. Diane Johnson: Instructor: 1) Highlight both rows of data 2) Click INSERT tab at the top 3) Go to CHART category 4) Click on SCATTER and your scatter diagram appears If you would like to print this tip, right click on the cell and select EDIT COMMENT. Then just highlight and copy the text, and paste in a document for printing. Diane Johnson: Instructor: 1) Click on the fx in the top bar and CORREL, or click on INSERT, function, CORREL. 2) Highlight each column of data as an ARRAY 3) Click Okay. 4) Excel will calculate the correlation coefficient. The correlation coefficient ranges between zero and one. Zero is no correlation and '1' is a perfect correlation. __________________________________________ -1.0 to -0.7 strong negative association.
- 18. -0.7 to -0.3 weak negative association. -0.3 to +0.3 little or no association. +0.3 to +0.7 weak positive association. +0.7 to +1.0 strong positive association. If you would like to print this tip, right click on the cell and select EDIT COMMENT. Then just highlight and copy the text, and paste in a document for printing. Diane Johnson: Instructor: 1) Click on the fx in the top bar and CORREL, or click on FOMULAS, INSERT function, CORREL. 2) Highlight each column of data as an ARRAY 3) Click Okay. 4) Excel will calculate the correlation coefficient. The correlation coefficient ranges between zero and one. Zero is no correlation and '1' is a perfect correlation. __________________________________________ -1.0 to -0.7 strong negative association. -0.7 to -0.3 weak negative association. -0.3 to +0.3 little or no association. +0.3 to +0.7 weak positive association.
- 19. +0.7 to +1.0 strong positive association. If you would like to print this tip, right click on the cell and select EDIT COMMENT. Then just highlight and copy the text, and paste in a document for printing. Diane Johnson: Instructor: 1) To access the regression data analysis function in Excel, select the Data tab from the Tools menu above, and then choose Data Analysis. 2) Then click on Regression from the dialog box and then click OK. 3) The first box is the Input Y range. Here, we tell Excel about our dependent variable. You can highlight the dependent variable column of data, including the column label. 4) Because we have included the column Label (row 21), which includes the variable name, we are going to have to tell Excel this, by clicking on the "Labels" checkbox. If you choose not to include the Label row (which may be the case for the Part 2 - Dinner analysis), you do not need to select the "Labels" option! 5) The second box is the Input X range, where we input the independent variables. You can highlight the independent variable column of data, including the column label. 6) Then click OK 7) The first part of the output is the regression statistics followed by the ANOVA table.
- 20. If you would like to print this tip, right click on the cell and select EDIT COMMENT. Then just highlight and copy the text, and paste in a document for printing.Lunch20.55274Lunch8.29858Lunch23.35923Lunch14.4 1986Lunch18.06433Lunch11.94456Lunch11.49307Lunch14.102 94Lunch12.56506Lunch15.87375Lunch17.75164Lunch13.48547 Lunch13.59486Lunch7.13095Lunch5.49518Lunch25.49962Lunc h9.61277Lunch12.87675Lunch26.23303Dinner18.84155Dinner1 6.93623Dinner5.14285Dinner21.63233Dinner2.00004Dinner16. 43635Dinner22.74966Dinner19.44741Dinner19.40784Dinner12. 46742Dinner13.61083Dinner16.03156Dinner26.40125Dinner11. 13242Dinner29.95186Dinner8.39683Dinner26.14075Dinner5.34 983Dinner6.75475Dinner18.94294Dinner19.30403Dinner2.0946 6Dinner19.79824Dinner14.47545Dinner19.35993Dinner26.0793 4Dinner6.93787Dinner29.26525Dinner25.46062Dinner28.40903 YOU DO NOT NEED TO SUBMIT THE SCATTER DIAGRAMAboveWay Sandwich, Inc. Customer Satisfaction ImprovementDeliverable:Scatter Diagram & Regression AnalysisStudent last name:Your last name herePART 1: Using Lunch & Dinner DataWhat is the correlation coefficient?Type here (use 3 decimal places)What is the regression equation?Type here (use 3 decimal places)What percentage of variation is explained by the model? HINT: There are 2 related values that can be used to answer this question. Show them BOTH and explain which value you would recommend using and why.Type your answer here. (Use at most 25 words.)Based on an ANOVA of the regression equation, is the regression equation statistically significant at 5% alpha risk?Type "YES" or "NO" hereWhy do you you say that it is either statistically significant or not? HINT: Use the results of your ANOVA as the basis for your answer.Type your answer here. (Use at most 25 words.)What is the null hypothesis for ANOVA for a regression equation?Type your answer here. (Use at most 15 words.)PART 2: Using Only Lunch DataWhat is the correlation coefficient for Lunch?Type here (use 3 decimal places)What is the regression
- 21. equation for Lunch?Type here (use 3 decimal places)What percentage of variation is explained by the Lunch model? HINT: There are 2 related values that can be used to answer this question. Show them BOTH and explain which value you would recommend using and why.Type your answer here. (Use at most 25 words.)Based on an ANOVA of the regression equation, is the regression equation statistically significant at 5% alpha risk?Type "YES" or "NO" hereWhy do you you say that it is either statistically significant or not? HINT: Use the results of your ANOVA as the basis for your answer.Type your answer here. (Use at most 25 words.)Given the results of this study, what should your Black Belt do next to improve customer satisfaction at lunch?Type your answer here. (Use at most 25 words.)PART 3: Using Only Dinner DataWhat is the correlation coefficient for Dinner?Type here (use 3 decimal places)What is the regression equation for Dinner?Type here (use 3 decimal places)What percentage of variation is explained by the Dinner model? HINT: There are 2 related values that can be used to answer this question. Show them BOTH and explain which value you would recommend using and why.Type your answer here. (Use at most 25 words.)Based on an ANOVA of the regression equation, is the regression equation statistically significant at 5% alpha risk?Type "YES" or "NO" hereWhy do you you say that it is either statistically significant or not? HINT: Use the results of your ANOVA as the basis for your answer.Type your answer here. (Use at most 25 words.)Given the results of this study, what should your Black Belt do next to improve customer satisfaction at dinner?Type your answer here. (Use at most 25 words.) Process CapabilityObjective:Determine process capabilityInstructions for you:The company's goal is that every sandwich can be completed in less than 1.5 minutes. Based on the datafrom the revised process control chart study, evaluate our shop's ability to meet this goal using the followingEvaluate our shop's ability to meet this goal using the following cabability measures.CpCpkPpPpkz scoreSigma Level% of
- 22. sandwiches made within the 1.5 minute goalPPM beyond the 1.5 minute goalData: See the revised data from the control chart tab.AboveWay Sandwich, Inc. Customer Satisfaction ImprovementDeliverable:Process CapabilityStudent last name:Your last name hereWhat did you get for Cp?Type hereSelf check daniel-munson: Instructor: Hint: If you got a value, I would like to see it. What did you get for Cpk?Type here (use 2 decimal places)Self check daniel-munson: Instructor: You should get a value between -2 and +2 What, specifically, does this particular Cpk tell you about the process that other Cpk's may not?Type here (use at most 25 words)What did you get for Pp?Type hereSelf check daniel-munson: Instructor: Hint: If you got a value, I would like to see it. What did you get for Ppk?Type here (use 2 decimal places)Self check daniel-munson: Instructor: You should get a value between -3 and +3 What did you get for Z-score?Type here (use 2 decimal places)Self check daniel-munson: Instructor: You should get a value between -2 to +2 What does this Z-score mean? HINT: Use the z score you
- 23. calculated in a sentence that explains what it tells you about this process.Type here (use at most 25 words)Using the z score calculated above and a z table, estimate the % of sandwiches that will be made within the 1.5 minute goal.Type here (use 2 decimal places)Self check daniel-munson: Instructor: You should get a value <30% daniel-munson: Instructor: Hint: If you got a value, I would like to see it. PPM (aka DPMO) beyond the 1.5 minute goalType hereSelf check daniel-munson: Instructor: You should have gotten a really big number. Also, this number should be "consistent" with the % within goal found above. daniel-munson: Instructor: You should get a value between -3 and +3 daniel-munson: Instructor: You should get a value between -2 to +2 QuestionsObjective:An enthusiastic Black Belt comes to you and states that next Friday morning at 10:15 AM the Project Champion is going to collect 20 temperature measurements inside one of the new Suntouch conveyor ovens at Store 243 to
- 24. see if these ovens perform the same as the older model currently in use at other stores. She says, "We will be running Minitab to crunch the numbers." You say to her, "Before you do this, I have some questions to ask you about your strategy for this study." She tells you that she only has a few minutes before a meeting with the Champion to discuss the data collection, so you need to make your questions count!Instructions for you:(1) List 10 questions that you think are the most important questions to ask to ensure that your Black Belt has a good stragegy in place for this study and has addressed all important issues. Provide a brief (less than 15 word) rationale for each question. NOTE: Follow-up questions for clarification do NOT count as separate questions. (2) Identify 5 tools that could be used to help answer the question posed by your Black Belt in this study. Justify your choice of each tool in 15 words or less.AboveWay Sandwich, Inc. Customer Satisfaction ImprovementDeliverable:QuestionsStudent last name:Your last name hereAn enthusiastic Black Belt comes to you and states that next Friday morning at 10:15 AM the Project Champion is going to collect 20 temperature measurements inside one of the new Suntouch conveyor ovens at Store 243 to see if these ovens perform the same as the older model currently in use at other stores. She says, "We will be running Minitab to crunch the numbers." You say to her, "Before you do this, I have some questions to ask you about your strategy for this study." She tells you that she only has a few minutes before a meeting with the Champion to discuss the data collection, so you need to make your questions count!Question 1Type the question here.Eplain your rationale for this question in 15 words or less.Question 2Type the question here.Eplain your rationale for this question in 15 words or less.Question 3Type the question here.Eplain your rationale for this question in 15 words or less.Question 4Type the question here.Eplain your rationale for this question in 15 words or less.Question 5Type the question here.Eplain your rationale for this question in 15 words or less.Question 6Type the question here.Eplain your rationale for
- 25. this question in 15 words or less.Question 7Type the question here.Eplain your rationale for this question in 15 words or less.Question 8Type the question here.Eplain your rationale for this question in 15 words or less.Question 9Type the question here.Eplain your rationale for this question in 15 words or less.Question 10Type the question here.Eplain your rationale for this question in 15 words or less.List five tools your Black Belt might use to answer her question in this studyType here and why?Type here (use at most 15 words)and give a brief (10 wordsType here and why?Type here (use at most 15 words)or less) explanation of why each tool would be useful in this particular study. HINT: Each tool listed must be appropriate for THIS particular study. Do NOT go beyond the scope of the question being investigated by your Black Belt!Type here and why?Type here (use at most 15 words)Type here and why?Type here (use at most 15 words)Type here and why?Type here (use at most 15 words) : : 191715131197531 1.9 1.8 1.7 1.6 Observation I n d i v i d u a l
- 26. V a l u e _ X=1.7512 UCL=1.9205 LCL=1.5818 191715131197531 0.20 0.15 0.10 0.05 0.00 Observation M o v i n g R a n g e __ MR=0.0637 UCL=0.2080 LCL=0 1 I-MR Chart of Current Sandwich Prep Times
- 27. The projectAboveWay Sandwich - ProjectYou are a Master Black Belt working with AboveWay Sandwich, Inc. to improve the franchises' customer satisfaction. The process is simple.Your assignment is to improve customer satisfaction by working with variousGreen Belts and Black Belts. To successfully pass the course, you must complete all of the deliverables (tabs below) to the satisfaction of your instructor. Select Bread Assemble Wrap and Pay Excel examplesHow you can use Excel This spreadsheet tab provides illustrations of adding the DATA ANALYSIS capability to your Excel software.If you see Data Analysis already listed under the Tools tab, you are set. If you do not see Data Analysisfollow the instructions in the Green tab.Excel 2003 instructions Diane Johnson: Instructor Excel 2003: Click on the TOOLS tab in the top bar of Excel. If your computer already has the “Data Analysis” option listed, you are ready to go. Your Data Analysis tools have already been added. Under the Data Analysis Function you will find some of the more advanced functions that we will be discussing such as ANOVAs, and t tests. If you do not see Data Analysis listed under the TOOLS tab, I encourage you to go to the Help function in Excel for specific instructions on how to load “the Data Analysis Toolpak” in your version of Excel. Here are the easy standard instructions for Excel 2003 if you need to load the Add-Ins.
- 28. 1) On the Tools menu, click Add-Ins. 2) In the Add-Ins available box, select the check box next to Analysis Toolpak, and then click OK. 3) When you load the Analysis Toolpak, the DATA ANALYSIS command is automatically added to the TOOLS menu. If your version if slightly different than the above, refer to your HELP function for details on loading Tookpak. Remember that the Data Analysis function is NOT necessary for the course, but it is helpful. If you would like to print this tip, right click on the cell and select EDIT COMMENT. Then just highlight and copy the text, and paste in a document for printing.Excel 2003 or earlier versions of Excel exampleThis spreadsheet tab provides illustrations of adding the DATA ANALYSIS capability to your 2007 Excel software.If you see Data Analysis already listed under the DATA tab, you are set. If you do not see Data Analysisfollow the instructions in the Green tab.Excel 2007 instructions Diane Johnson: Instructor Excel 2007: The Analysis ToolPak is a Microsoft Office Excel add-in program that is available when you install Microsoft Office or Excel. To use it in Excel, however, you need to load it first. 1. Click the Microsoft Office Button , and then click Excel Options at the bottom. 2. Click Add-Ins, and then in the Manage box, select Excel Add-ins.
- 29. 3. Click Go. 4. In the Add-Ins available box, select the Analysis ToolPak check box, and then click OK. If you get prompted that the Analysis ToolPak is not currently installed on your computer, click Yes to install it. 5. After you load the Analysis ToolPak, the Data Analysis command is available in the ANALYSIS group on the DATA tab. Remember that the Data Analysis function is not required for the course. If you would like to print this tip, right click on the cell and select EDIT COMMENT. Then just highlight and copy the text, and paste in a document for printing.Excel 2007 example COPQObjective:Your first action as the new Master Black Belt is to collect data on the quality costs associated with the current system.Accounting provides you with the following results for the past year.Instructions for you:You think it would be useful to get an idea of the Cost of Poor Quality for the organization.Your mission is to put the costs into the appropriate buckets. Buckets meaning, the cost of doing business, internal failures, external failures, appraisal, and prevention costs. Once your analysis matches your instructor's analysis, you can determine 'what's next.'Data:Raw Materials (ingredients for sandwiches)$53,200.00Scrapped Meat and Vegetables (damaged during food preparation)$2,416.00Incoming Inspection (of ingredients)$3,700.00Six Sigma Projects$420.00Obsolete / expired food$864.00Training for counter help$2,097.00Corporate audits to verify store compliance with policies$3,789.00Procedures for counter help$1,574.00Electricity$1,196.00Fines from Health
- 30. Inspectors$2,000.00Rent$24,020.00Scrapped Burned bread$485.00Cost to pre-package meats in individual serving portions$297.00Free meals given to customers with complaints$1,457.00Supervisor sign-off/approval for credit card sales$348.00Business Bureau membership$500.00Training for incoming inspection$368.00Loss of business due to customer dissatisfaction$6,603.00TOTAL$105,334.00AboveWay Sandwich, Inc. Customer Satisfaction ImprovementDeliverable:Cost of poor qualityStudent last name:Your last name hereThe categories are: Cost of doing business, Internal Failures, External Failures, Appraisal, and Prevention.For each of the following, please choose the appropriate COPQ category. Type in your responses. If you are100% correct when you choose each catagory, your analysis will match your instructor's analysis of the same data. Raw Materials (ingredients for sandwiches)Type hereScrapped Meat and Vegetables (damaged during food prep)Type hereIncoming Inspection (of ingredients)Type hereSix Sigma ProjectsType hereObsolete / expired foodType hereTraining for counter helpType hereCorporate audits to verify store compliance with policiesType hereProcedures for counter helpType hereElectricityType hereFines from Health InspectorsType hereRentType hereScrapped Burned breadType hereCost to pre- package meats in individual serving portionsType hereFree meals given to customers with complaintsType hereSupervisor sign-off/approval for credit card salesType hereBusiness Bureau membershipType hereTraining for incoming inspectionType hereLoss of business due to customer dissatisfactionType hereSelf check daniel-munson: Instructor: For Cost of Doing Business, your instructor calculated ~$80k For Prevention, your instructor calculated ~$4k
- 31. For Appraisal, your instructor calculated ~$8k For Internal Failure, your instructor calculated ~$4k For External failures, your instructor calculated ~$10kWhat is the total cost of doing business?Type here : Your answer should be between $78,000 and $81,000.What is the total internal failures cost?Type here : Your answer should be between $3,000 and $5,500.What is the total external failures cost?Type here : Your answer should be between $8,000 and $11,000.What is the total appraisal cost?Type here : Your answer should be between $8,000 and $11,000.What is the total prevention cost?Type here : Your answer should be between $3,000 and $5,000.What is the total cost of quality?Type here : Your answer should be between $25,000 and $29,000.Based on these findings and COQ philosophy, what would you recommend to your Black Belt as the best strategy for addressing any problem areas shown and why?Type your recommendation here. (Use at most 50 words.) FMEAObjective:To provide a Black Belt with sound advice on how to address problems identified by an FMEA.Instructions for you:You are given this filled out FMEA for baking bread by a Black Belt who has been working with your store. Your assignment is to use the results of this FMEA to advise your Black Belt on which failure mode to focus on first and why, based on FMEA philosophy. Data:POTENTIAL FAILURE MODESPOTENTIAL EFFECTS OF FAILURESEVERITY OF EFFECTPOTENTIAL CAUSES OF FAILUREPROBABILITY
- 32. OF OCCURRENCECURRENT PROCESS CONTROLSPROBABILITY OF DETECTION / EASE OF CORRECTIONRPNWrong oven temperature set.Bread overcooked and must be scrapped.4Didn’t know that different types of bread required different baking temperatures – lack of training.Instructions on package.6248Didn’t read label on dough package.6144Label on dough package is wrong.124Temperature dial on oven is defective.372Bread not put into ovens on time.Bread is not done when customers arrive.6Didn’t know how long the bread needs to bake – lack of training.Checklist for store opening procedures.10160Got busy and forgot.6360Person normally responsible is out of work that day.2120Bread is forgotten in an oven left on overnight.Fire10Put bread in oven without setting the timer.Checklist for store closing procedures.6160Got busy and forgot to shut oven off after the timer went off.6360Person normally responsible is out of work that day.2120AboveWay Sandwich, Inc. Customer Satisfaction ImprovementDeliverable:Failure Modes and Effects Analysis (FMEA)Student last name:Your last name hereBased on FMEA philosophy, which failure mode (be specific) should your Black Belt focus on first and why? Type your recommendation here. (Use at most 25 words.) Value Stream MapWe're getting there…The team has made some major strides as can be seen below, but improvement was still needed, so the team created a Value Stream Map. You do not need to do anything with this spaghetti diagrams below - they are there simply for your entertainment! But, you have to admit, the one on the right is a whole lot more streamlined! (Smile!)Original spaghetti diagramSpaghetti diagram after realignmentObjective:The team decided to create a Value Stream Map to better understand the material and information flow of the process. The team observed the process for one hour and documented their findings on the VSM shown below. The wait time between process steps varied with the number of customers in line, which ranged from 1 to 5 throughout the one-
- 33. hour observation period. The team wants to better understand the elements of their process and identify any opportunities to reduce the lead time. To help create the future state map, the team will also need to calculate the takt time.Instructions for you:We want to make sure you can analyze a value stream map (VSM). Please refer to the VSM provided below and answer the following questions.1. What is the total lead time (min and max values)?Help! : Instructor: The minimum lead time (process time + wait time) represents the wait time experienced if there was one customer (minimum inventory between process steps). The maximum lead time would be the time it would take if there were many customers or a large order (maximum inventory between process steps). 2. What is the total processing time?Help! : Instructor: The sum of all of the cycle times for all PROCESS steps.3. What is the Process Cycle Efficiency (PCE)?Help! : Instructor: PCE = Value Add Time / Total Lead Time4. What is the takt time (sec) based on the information provided?Help! : Instructor: Takt Time = Available Time / Customer DemandData:AboveWay Sandwich, Inc. Customer Satisfaction ImprovementDeliverable:Value Stream MapStudent last name:Your last name here1a) What is the total lead time (min value)?Type hereCheck
- 34. daniel-munson: Instructor: You should get a value between 100 and 200 seconds. 1b) What is the total lead time (max value)?Type hereCheck daniel-munson: Instructor: You should get a value between 300 and 400 seconds. 2) What is the total processing time?Type hereCheck daniel-munson: Instructor: You should get a value between 0 and 100 seconds.3) What is the Process Cycle Efficiency (PCE) for the maximum lead time?Type hereCheck daniel-munson: Instructor: You should get a value between 0 and 25%. 4) What is the takt time (T/T)?Type hereCheck daniel-munson: Instructor: You should get a value between 1 and 60 seconds. 5) Which process step should your Black Belt focus on first to improve the process and why? HINT: There are 2 very good reasons for the correct first step based on VSM philosophy and the calculations made in this study - use them both in your answer!Type your recommendation here. (Use at most 50 words.) Control ChartObjective:Your Black Belts developed the following data and created this control chart for sandwich preparation times. They say that the process is stable and shows that the average prep time is 1.7512 minutes and that individual prep times will not exceed 1.9205 minutes. They also say that it's very good because it shows very little variation.Instructions for you:Part IDo you agree with their interpretation? (see chart below) HINT: Use the 11 Shewhart Rules for Stability as the basis for your decision.Data:Current Sandwich PrepTimes (in
- 35. minutes)1.64341.86231.76111.70491.78881.74691.82231.77931 .71221.75621.67981.70131.77501.74001.81221.77781.72331.74 101.71431.7807Part IIYou and your team work to eliminate all known assignable causes from this process. You think you have accomplished this and collect the following data on the new process. Calculate the control chart center line and control limit values for an I-MR chart and use the 11 Shewhart Rules for Stability to determine if this process is now stable.Revised Process Prep Times (in minutes)1.5361.5891.4821.5611.5471.5021.5061.5001.5501.542 1.4321.5731.5921.5571.5021.5341.4821.4921.6001.518AboveW ay Sandwich, Inc. Customer Satisfaction ImprovementDeliverable:Control ChartStudent last name:Your last name hereDo you agree with their interpretation that the original process is stable?Type "YES" or "NO" hereIf "NO", please identify BY NAME which of the 11 Shewhart Tests for Stability EACH chart fails.I CHART:Type hereMR CHART:Type hereRevised Process Prep DataINDIVIDUALS CHART:What did you get for a center line? Type here (use 4 decimal places)What did you get for an upper control limit? Type here (use 4 decimal places)What did you get for a lower control limit? Type here (use 4 decimal places)Revised Process Prep DataMOVING RANGE CHART:What did you get for a center line? Type here (use 4 decimal places)What did you get for an upper control limit? Type here (use 4 decimal places)What did you get for a lower control limit? Type here (use 4 decimal places)Is the revised process stable?Type "YES" or "NO" hereIf "NO", please identify BY NAME which of the 11 Shewhart Tests for Stability EACH chart fails.I CHART:Type hereMR CHART:Type here RegressionObjective:A team member has been saying since day one that there is a relationship between wait time and customersatisfaction ratings (1 being the worst and 10 being the best). Should the team have listened? Perform correlation and regression analysis to see if she is correct. Instructions for you:PART 1 - Do you suspect the variables may be related?
- 36. Determine the correlation coefficient as well as perform a regression analysis on the data provided to answer the questions below.PARTS 2 & 3 - The team suspects that the time of day may have an effect on the results, so the team decides toperform another analysis by analyzing the same results sorting by the time of day (lunch or dinner). Perform the same analysis as PART 1, however be sure to use only the data for the respective time ofday. Perform one analysis with the 30 data points for Lunch and another analysis for the 30 data pointsfor Dinner and answer the questions below. Data:Time of DayWait Time (minutes)Customer Satisfaction (1-10)Lunch9.55487Scatter diagrams in Excel 2003 Diane Johnson: Instructor: 1) Click on Chart icon on top task bar, OR Click on the INSERT menu option at the top menu bar. 2) Click on SCATTER from the Standard Types tab 3) Click Next 4) Highlight both columns of data and finish according to the directions. If you would like to print this tip, right click on the cell and select EDIT COMMENT. Then just highlight and copy the text, and paste in a document for printing.Lunch21.49503Lunch26.39151Scatter diagrams in Excel 2007 Diane Johnson: Instructor: 1) Highlight both rows of data 2) Click INSERT tab at the top
- 37. 3) Go to CHART category 4) Click on SCATTER and your scatter diagram appears If you would like to print this tip, right click on the cell and select EDIT COMMENT. Then just highlight and copy the text, and paste in a document for printing.Lunch11.70576Lunch15.51915Correlation Coefficient - Excel 2003 Diane Johnson: Instructor: 1) Click on the fx in the top bar and CORREL, or click on INSERT, function, CORREL. 2) Highlight each column of data as an ARRAY 3) Click Okay. 4) Excel will calculate the correlation coefficient. The correlation coefficient ranges between zero and one. Zero is no correlation and '1' is a perfect correlation. __________________________________________ -1.0 to -0.7 strong negative association. -0.7 to -0.3 weak negative association. -0.3 to +0.3 little or no association. +0.3 to +0.7 weak positive association. +0.7 to +1.0 strong positive association.
- 38. If you would like to print this tip, right click on the cell and select EDIT COMMENT. Then just highlight and copy the text, and paste in a document for printing.Lunch28.77611Lunch27.71461Correlation Coefficient - Excel 2007 Diane Johnson: Instructor: 1) Click on the fx in the top bar and CORREL, or click on FOMULAS, INSERT function, CORREL. 2) Highlight each column of data as an ARRAY 3) Click Okay. 4) Excel will calculate the correlation coefficient. The correlation coefficient ranges between zero and one. Zero is no correlation and '1' is a perfect correlation. __________________________________________ -1.0 to -0.7 strong negative association. -0.7 to -0.3 weak negative association. -0.3 to +0.3 little or no association. +0.3 to +0.7 weak positive association. +0.7 to +1.0 strong positive association. If you would like to print this tip, right click on the cell and select EDIT COMMENT. Then just highlight and copy the text, and paste in a document for printing.Lunch8.55757Lunch8.95408Regression Analysis -
- 39. Excel 2003 Diane Johnson: Instructor: 1) To access the regression data analysis function in Excel, select the Data tab from the Tools menu above, and then choose Data Analysis. 2) Then click on Regression from the dialog box and then click OK. 3) The first box is the Input Y range. Here, we tell Excel about our dependent variable. You can highlight the dependent variable column of data, including the column label. 4) Because we have included the column Label (row 21), which includes the variable name, we are going to have to tell Excel this, by clicking on the "Labels" checkbox. If you choose not to include the Label row (which may be the case for the Part 2 - Dinner analysis), you do not need to select the "Labels" option! 5) The second box is the Input X range, where we input the independent variables. You can highlight the independent variable column of data, including the column label. 6) Then click OK 7) The first part of the output is the regression statistics followed by the ANOVA table. If you would like to print this tip, right click on the cell and select EDIT COMMENT. Then just highlight and copy the text, and paste in a document for printing.Lunch18.03494Lunch4.05509Regression Analysis -
- 40. Excel 2007 Diane Johnson: Instructor: 1) To access the regression data analysis function in Excel, select the Data tab from the Tools menu above, and then choose Data Analysis. 2) Then click on Regression from the dialog box and then click OK. 3) The first box is the Input Y range. Here, we tell Excel about our dependent variable. You can highlight the dependent variable column of data, including the column label. 4) Because we have included the column Label (row 21), which includes the variable name, we are going to have to tell Excel this, by clicking on the "Labels" checkbox. If you choose not to include the Label row (which may be the case for the Part 2 - Dinner analysis), you do not need to select the "Labels" option! 5) The second box is the Input X range, where we input the independent variables. You can highlight the independent variable column of data, including the column label. 6) Then click OK 7) The first part of the output is the regression statistics followed by the ANOVA table. If you would like to print this tip, right click on the cell and select EDIT COMMENT. Then just highlight and copy the text, and paste in a document for printing.Lunch20.55274Lunch8.29858Lunch23.35923Lunch14.4
- 41. 1986Lunch18.06433Lunch11.94456Lunch11.49307Lunch14.102 94Lunch12.56506Lunch15.87375Lunch17.75164Lunch13.48547 Lunch13.59486Lunch7.13095Lunch5.49518Lunch25.49962Lunc h9.61277Lunch12.87675Lunch26.23303Dinner18.84155Dinner1 6.93623Dinner5.14285Dinner21.63233Dinner2.00004Dinner16. 43635Dinner22.74966Dinner19.44741Dinner19.40784Dinner12. 46742Dinner13.61083Dinner16.03156Dinner26.40125Dinner11. 13242Dinner29.95186Dinner8.39683Dinner26.14075Dinner5.34 983Dinner6.75475Dinner18.94294Dinner19.30403Dinner2.0946 6Dinner19.79824Dinner14.47545Dinner19.35993Dinner26.0793 4Dinner6.93787Dinner29.26525Dinner25.46062Dinner28.40903 YOU DO NOT NEED TO SUBMIT THE SCATTER DIAGRAMAboveWay Sandwich, Inc. Customer Satisfaction ImprovementDeliverable:Scatter Diagram & Regression AnalysisStudent last name:Your last name herePART 1: Using Lunch & Dinner DataWhat is the correlation coefficient?Type here (use 3 decimal places)What is the regression equation?Type here (use 3 decimal places)What percentage of variation is explained by the model? HINT: There are 2 related values that can be used to answer this question. Show them BOTH and explain which value you would recommend using and why.Type your answer here. (Use at most 25 words.)Based on an ANOVA of the regression equation, is the regression equation statistically significant at 5% alpha risk?Type "YES" or "NO" hereWhy do you you say that it is either statistically significant or not? HINT: Use the results of your ANOVA as the basis for your answer.Type your answer here. (Use at most 25 words.)What is the null hypothesis for ANOVA for a regression equation?Type your answer here. (Use at most 15 words.)PART 2: Using Only Lunch DataWhat is the correlation coefficient for Lunch?Type here (use 3 decimal places)What is the regression equation for Lunch?Type here (use 3 decimal places)What percentage of variation is explained by the Lunch model? HINT: There are 2 related values that can be used to answer this question. Show them BOTH and explain which value you would recommend using and why.Type your answer here. (Use at most
- 42. 25 words.)Based on an ANOVA of the regression equation, is the regression equation statistically significant at 5% alpha risk?Type "YES" or "NO" hereWhy do you you say that it is either statistically significant or not? HINT: Use the results of your ANOVA as the basis for your answer.Type your answer here. (Use at most 25 words.)Given the results of this study, what should your Black Belt do next to improve customer satisfaction at lunch?Type your answer here. (Use at most 25 words.)PART 3: Using Only Dinner DataWhat is the correlation coefficient for Dinner?Type here (use 3 decimal places)What is the regression equation for Dinner?Type here (use 3 decimal places)What percentage of variation is explained by the Dinner model? HINT: There are 2 related values that can be used to answer this question. Show them BOTH and explain which value you would recommend using and why.Type your answer here. (Use at most 25 words.)Based on an ANOVA of the regression equation, is the regression equation statistically significant at 5% alpha risk?Type "YES" or "NO" hereWhy do you you say that it is either statistically significant or not? HINT: Use the results of your ANOVA as the basis for your answer.Type your answer here. (Use at most 25 words.)Given the results of this study, what should your Black Belt do next to improve customer satisfaction at dinner?Type your answer here. (Use at most 25 words.) Process CapabilityObjective:Determine process capabilityInstructions for you:The company's goal is that every sandwich can be completed in less than 1.5 minutes. Based on the datafrom the revised process control chart study, evaluate our shop's ability to meet this goal using the followingEvaluate our shop's ability to meet this goal using the following cabability measures.CpCpkPpPpkz scoreSigma Level% of sandwiches made within the 1.5 minute goalPPM beyond the 1.5 minute goalData: See the revised data from the control chart tab.AboveWay Sandwich, Inc. Customer Satisfaction ImprovementDeliverable:Process CapabilityStudent last name:Your last name hereWhat did you get for Cp?Type
- 43. hereSelf check daniel-munson: Instructor: Hint: If you got a value, I would like to see it. What did you get for Cpk?Type here (use 2 decimal places)Self check daniel-munson: Instructor: You should get a value between -2 and +2 What, specifically, does this particular Cpk tell you about the process that other Cpk's may not?Type here (use at most 25 words)What did you get for Pp?Type hereSelf check daniel-munson: Instructor: Hint: If you got a value, I would like to see it. What did you get for Ppk?Type here (use 2 decimal places)Self check daniel-munson: Instructor: You should get a value between -3 and +3 What did you get for Z-score?Type here (use 2 decimal places)Self check daniel-munson: Instructor: You should get a value between -2 to +2 What does this Z-score mean? HINT: Use the z score you calculated in a sentence that explains what it tells you about this process.Type here (use at most 25 words)Using the z score calculated above and a z table, estimate the % of sandwiches that will be made within the 1.5 minute goal.Type here (use 2 decimal places)Self check
- 44. daniel-munson: Instructor: You should get a value <30% PPM (aka DPMO) beyond the 1.5 minute goalType hereSelf check daniel-munson: Instructor: You should have gotten a really big number. Also, this number should be "consistent" with the % within goal found above. QuestionsObjective:An enthusiastic Black Belt comes to you and states that next Friday morning at 10:15 AM the Project Champion is going to collect 20 temperature measurements inside one of the new Suntouch conveyor ovens at Store 243 to see if these ovens perform the same as the older model currently in use at other stores. She says, "We will be running Minitab to crunch the numbers." You say to her, "Before you do this, I have some questions to ask you about your strategy for this study." She tells you that she only has a few minutes before a meeting with the Champion to discuss the data collection, so you need to make your questions count!Instructions for you:(1) List 10 questions that you think are the most important questions to ask to ensure that your Black Belt has a good stragegy in place for this study and has addressed all important issues. Provide a brief (less than 15 word) rationale for each question. NOTE: Follow-up questions for clarification do NOT count as separate questions. (2) Identify 5 tools that could be used to help answer the question posed by your Black Belt in this study. Justify your choice of each tool in 15 words or less.AboveWay Sandwich, Inc. Customer Satisfaction ImprovementDeliverable:QuestionsStudent last name:Your last name hereAn enthusiastic Black Belt comes to you and states that next Friday morning at 10:15 AM the Project Champion is going to collect 20 temperature measurements inside one of the
- 45. new Suntouch conveyor ovens at Store 243 to see if these ovens perform the same as the older model currently in use at other stores. She says, "We will be running Minitab to crunch the numbers." You say to her, "Before you do this, I have some questions to ask you about your strategy for this study." She tells you that she only has a few minutes before a meeting with the Champion to discuss the data collection, so you need to make your questions count!Question 1Type the question here.Eplain your rationale for this question in 15 words or less.Question 2Type the question here.Eplain your rationale for this question in 15 words or less.Question 3Type the question here.Eplain your rationale for this question in 15 words or less.Question 4Type the question here.Eplain your rationale for this question in 15 words or less.Question 5Type the question here.Eplain your rationale for this question in 15 words or less.Question 6Type the question here.Eplain your rationale for this question in 15 words or less.Question 7Type the question here.Eplain your rationale for this question in 15 words or less.Question 8Type the question here.Eplain your rationale for this question in 15 words or less.Question 9Type the question here.Eplain your rationale for this question in 15 words or less.Question 10Type the question here.Eplain your rationale for this question in 15 words or less.List five tools your Black Belt might use to answer her question in this studyType here and why?Type here (use at most 15 words)and give a brief (10 wordsType here and why?Type here (use at most 15 words)or less) explanation of why each tool would be useful in this particular study. HINT: Each tool listed must be appropriate for THIS particular study. Do NOT go beyond the scope of the question being investigated by your Black Belt!Type here and why?Type here (use at most 15 words)Type here and why?Type here (use at most 15 words)Type here and why?Type here (use at most 15 words) : :
- 47. i n g R a n g e __ MR=0.0637 UCL=0.2080 LCL=0 1 I-MR Chart of Current Sandwich Prep Times